
94% of researchers rate our articles as excellent or good
Learn more about the work of our research integrity team to safeguard the quality of each article we publish.
Find out more
ORIGINAL RESEARCH article
Front. Neurosci., 13 March 2023
Sec. Brain Imaging Methods
Volume 17 - 2023 | https://doi.org/10.3389/fnins.2023.1137567
This article is part of the Research TopicArtificial Intelligence-based Computer-aided Diagnosis Applications for Brain Disorders from Medical Imaging Data, Volume IIView all 11 articles
 Junwei Duan1,2*
 Yang Liu1
 Huanhua Wu3
 Jing Wang4*
 Long Chen5C. L. Philip Chen6 for the Alzheimer's Disease Neuroimaging Initiative
Alzheimer's disease (AD) is a progressive neurodegenerative disease, and the development of AD is irreversible. However, preventive measures in the presymptomatic stage of AD can effectively slow down deterioration. Fluorodeoxyglucose positron emission tomography (FDG-PET) can detect the metabolism of glucose in patients' brains, which can help to identify changes related to AD before brain damage occurs. Machine learning is useful for early diagnosis of patients with AD using FDG-PET, but it requires a sufficiently large dataset, and it is easy for overfitting to occur in small datasets. Previous studies using machine learning for early diagnosis with FDG-PET have either involved the extraction of elaborately handcrafted features or validation on a small dataset, and few studies have explored the refined classification of early mild cognitive impairment (EMCI) and late mild cognitive impairment (LMCI). This article presents a broad network-based model for early diagnosis of AD (BLADNet) through PET imaging of the brain; this method employs a novel broad neural network to enhance the features of FDG-PET extracted via 2D CNN. BLADNet can search for information over a broad space through the addition of new BLS blocks without retraining of the whole network, thus improving the accuracy of AD classification. Experiments conducted on a dataset containing 2,298 FDG-PET images of 1,045 subjects from the ADNI database demonstrate that our methods are superior to those used in previous studies on early diagnosis of AD with FDG-PET. In particular, our methods achieved state-of-the-art results in EMCI and LMCI classification with FDG-PET.
Alzheimer's disease (AD) cannot be diagnosed until obvious symptoms appear in the patient, but studies have found that patients with AD show abnormalities in regional metabolism before brain structure changes occur (Jagust et al., 2006). Fluorine 18 (18F) fluorodeoxyglucose (FDG) positron emission tomography (PET) is a non-invasive nuclear medicine imaging technique that can indicate the metabolic activity of tissues and organs (Marcus et al., 2014; Bouter et al., 2019; Levin et al., 2021). FDG-PET may detect the onset of certain diseases earlier than other imaging tests (Brown et al., 2014). FDG-PET is regarded as an effective biomarker for earlier diagnosis of AD (Chételat et al., 2020). The onset of Alzheimer's disease is insidious and slow, and it can be divided into three stages: cognitively normal (CN), mild cognitive impairment (MCI), and Alzheimer's disease (AD). Patients with AD tend to show hypometabolism on 18F-FDG-PET scan in the regions of the posterior cingulate, parietotemporal cortices, and frontal lobes, while patients with MCI often show posterior cingulate and parietotemporal hypometabolism with variable frontal lobe involvement (Mosconi et al., 2008; Kobylecki et al., 2015). However, the difference between the two stages in FDG-PET is difficult to distinguish with the naked eye or through pattern recognition-based decisions made via qualitative readings. Because the disease involves a wide continuous spectrum, from normal cognition to MCI to AD, MCI can also be subdivided into early MCI (EMCI) and late MCI (LMCI) (Jessen et al., 2014).
Machine learning approaches can effectively extract features that are difficult to find with the naked eye and can outperform professional clinicians in certain imaging diagnosis problems (Zhang et al., 2020). A number of studies have already experimented with unsupervised learning (Suk and Shen, 2013), adversarial learning (Baydargil et al., 2021), and multi-scale learning (Lu et al., 2018) techniques in AD-related PET image analysis. These methods have achieved good results in classification of CN, MCI, and AD, but few studies have explored the refined classification of early EMCI and late LMCI.
Currently, deep learning-based approaches have been applied in early diagnosis of AD (Suk and Shen, 2013; Lu et al., 2018). Nevertheless, there are still many issues remaining in deep learning, such as gradient explosion and vanishing gradients, which limit the depth in terms of number of layers in the network or its fitting ability; some researchers have proposed residual learning (He et al., 2016) as a way to alleviate this problem. The broad learning system (BLS) is one kind of neural network without deep structure. BLS provides better fitting ability by increasing the number of network nodes horizontally and obtains solutions via pseudoinverse, with no need for an iterative backpropagation process. However, BLS obtains a feature representation of input data through random projection, which may result in too much redundant information that could influence the performance of the BLS model. Some researchers have experimented with variations of BLS that use other models as feature extractors in the feature mapping layer (Feng and Chen, 2018; Du et al., 2020; Jara-Maldonado et al., 2022; Wu and Duan, 2022). In this article, we propose a novel BLS-based method, in which we use grouped convolution layers to extract the features from slice groups in the first stage, and then these features are fed into a broad learning model for further feature enhancement.
This study proposes a machine learning model based on BLS to predict the clinical diagnosis in patients using 18F-FDG-PET of the brain. We attempted to predict patients' classifications as AD, MCI, or CN, and (within the category of MCI) as EMCI or LMCI. The hypothesis was that the broad learning-based model would be able to detect regional metabolic abnormalities caused by pathology, which are difficult to observe on clinical review, and improve the accuracy of individual diagnosis.
Data used in the preparation of this article were obtained from the Alzheimer's Disease Neuroimaging Initiative (ADNI) database (adni.loni.usc.edu). ADNI was launched in 2003 as a public–private partnership, led by Principal Investigator Michael W. Weiner, MD. The primary goal of ADNI has been to test whether serial magnetic resonance imaging (MRI), PET, other biological markers, and clinical and neuropsychological assessment can be combined to measure the progression of MCI and early AD.
In our study, we analyzed a total of 2,298 FDG-PET imaging studies of 1,045 patients obtained from ADNI. The datasets contained images of subjects of different ages. In ADNI 1, the subjects were grouped into three classes: CN, MCI, and AD. However, in ADNI 2/GO, the MCI stage was subdivided into EMCI and LMCI. To be classified as CN, subjects must have no memory complaints and be non-demented. To be classified as having MCI, subjects must have a Mini-Mental State Examination (MMSE) score between 24 and 30; the activities of daily living must be preserved, and dementia must be absent. Finally, to be classified as having AD, subjects must be clinically diagnosed as such, with an MMSE score between 20 and 26 (Jack Jr et al., 2008). Demographic information on our dataset is presented in Table 1. A total of 80% of the data (1,851 imaging studies, 598 patients) were used for model training. The remaining 20% (447 imaging studies; no repeat studies of the same subjects in the test set) were used for model testing, from which an additional test set (74 imaging studies for AD vs. MCI vs. CN classification and 45 imaging studies for EMCI vs. LMCI classification) was selected for validation by professional radiologists.
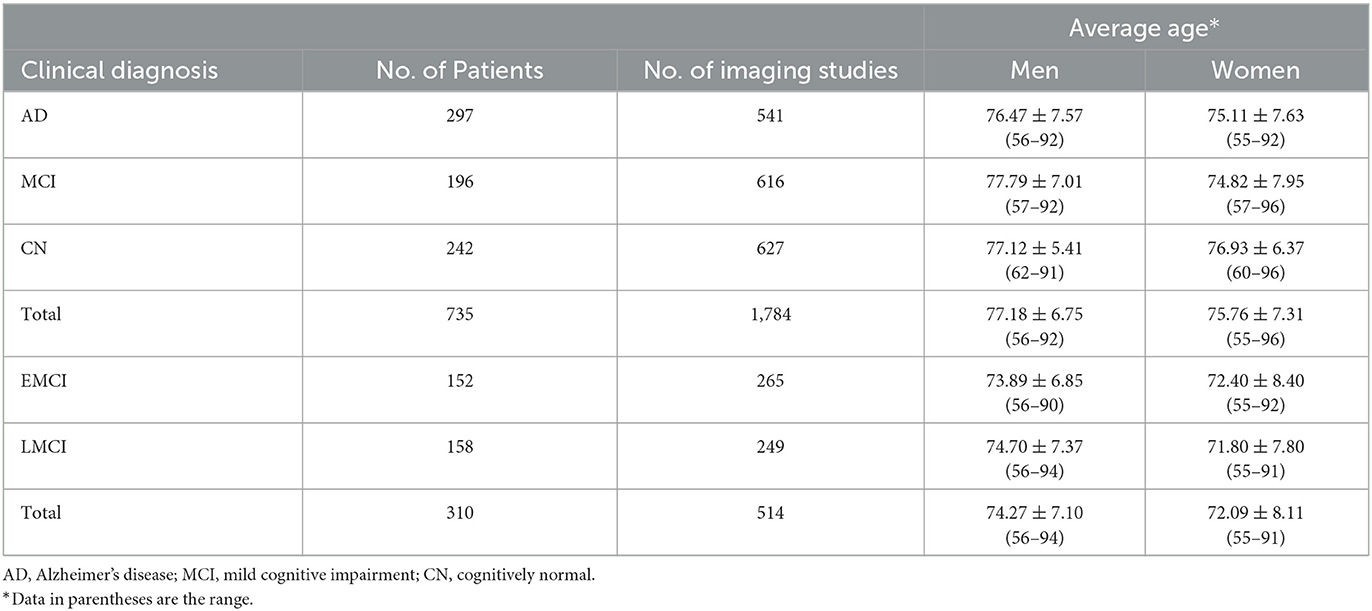
Table 1. Demographics of datasets.
For the purpose of eliminating differences between images acquired from various systems, FDG-PET images in ADNI have undergone a series of preprocessing steps, intensity normalization, and conversion to a uniform isotropic resolution of 8 mm full width at half maximum. We selected the processed images from ADNI; our method does not require any specific pre-defined ROI or VOI as traditional machine learning methods do. All 3D images were resampled to a size of 160 × 160 × 96; we treated the images as a series of 2D slices and removed slices with all-zero intensity on both sides, then divided the image into four groups of slices at equal intervals, with each group containing 23 slices. All processing steps were conducted in Python (version 3.8) using the packages scipy (http://www.scipy.org) and numpy (https://numpy.org/). Figure 1 shows a single slice, viewed on three planes.
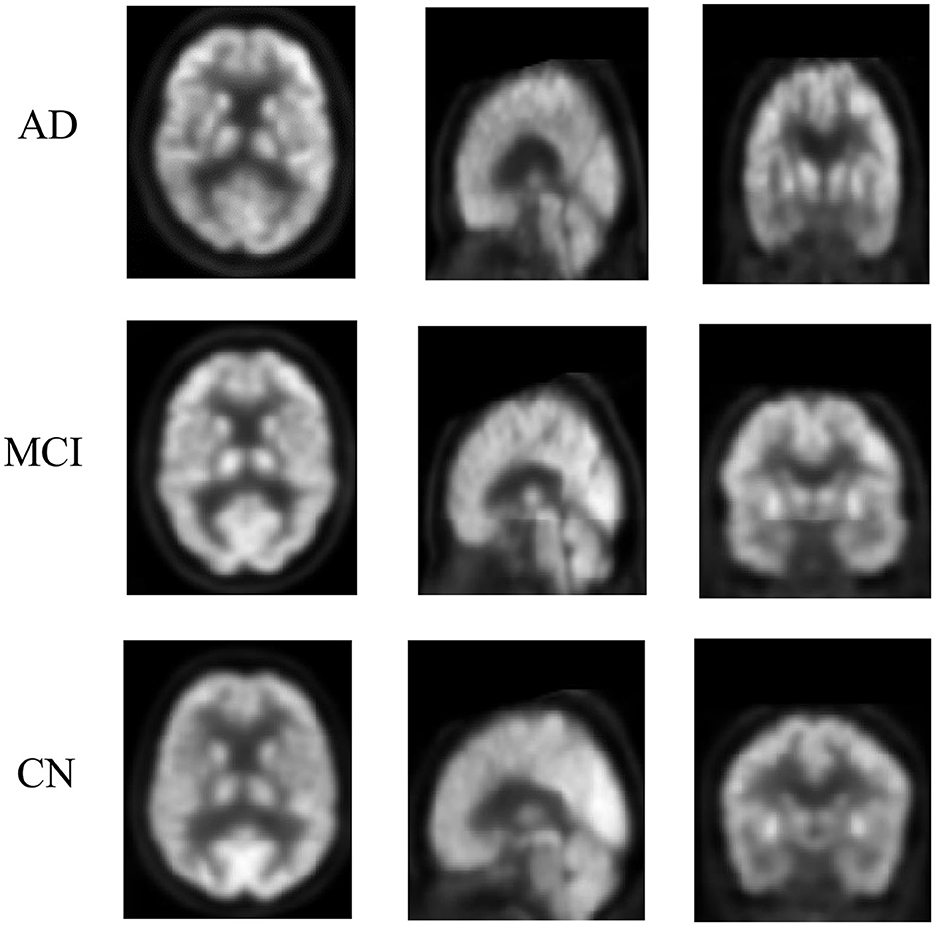
Figure 1. Example of FDG-PET imaging from ADNI. Each row represents a PET imaging slice on a three-plane view. The three rows are: a 73-year-old man with AD, an 81-year-old woman with MCI, and a 71-year-old man without MCI/AD. The difference between them is difficult to identify with the naked eye.
Despite the good learning ability of deep neural networks, they are easy to overfit on small datasets and their training is also time-consuming. The BLS is a lightweight network with a broad structure proposed by Chen and Liu (2017). The inspiration for its design comes from a random vector functional link neural network (RVFLLNN) (Pao and Takefuji, 1992; Chu et al., 2019; Gong et al., 2021). It can obtain a globally optimal solution using a ridge regression algorithm during training. without an iterative backpropagation process, meaning that its training is fast and efficient. The detailed description of the BLS is illustrated in the Supplementary material. Based on the BLS, we propose a broad network-based model for early diagnosis of AD (BLADNet) through PET imaging of the brain.
Figure 2 illustrates the overall architecture of BLADNet. The framework consists of two stages. In the first stage, we use a 2D CNN for automated feature learning from each group of slices rather than directly using a 3D CNN, which reduces the number of parameters to be learned. In the second stage, the features extracted from each group in the previous step are concatenated to form a compact sequence feature; then, the Extreme Broad Learning System (EBLS), based on a broad neural network, is used to enhance the features from 2D CNN and carry out the final classification. A detailed description of the EBLS is provided in the Supplementary material1. Our model was developed in Python using the packages numpy and pytorch (https://pytorch.org/, version 1.7.1). All experiments were conducted using a computer with a Linux operating system (Ubuntu 18.04). The computer was equipped with a CPU (Intel(R) Core (TM) i9-9980XE, 3.00 GHz), 64 GB of DDR4 SDRAM, and GPU (GeForce RTX 3080) with CUDA Version 11.2 and cuDNN Version 9.1.85.
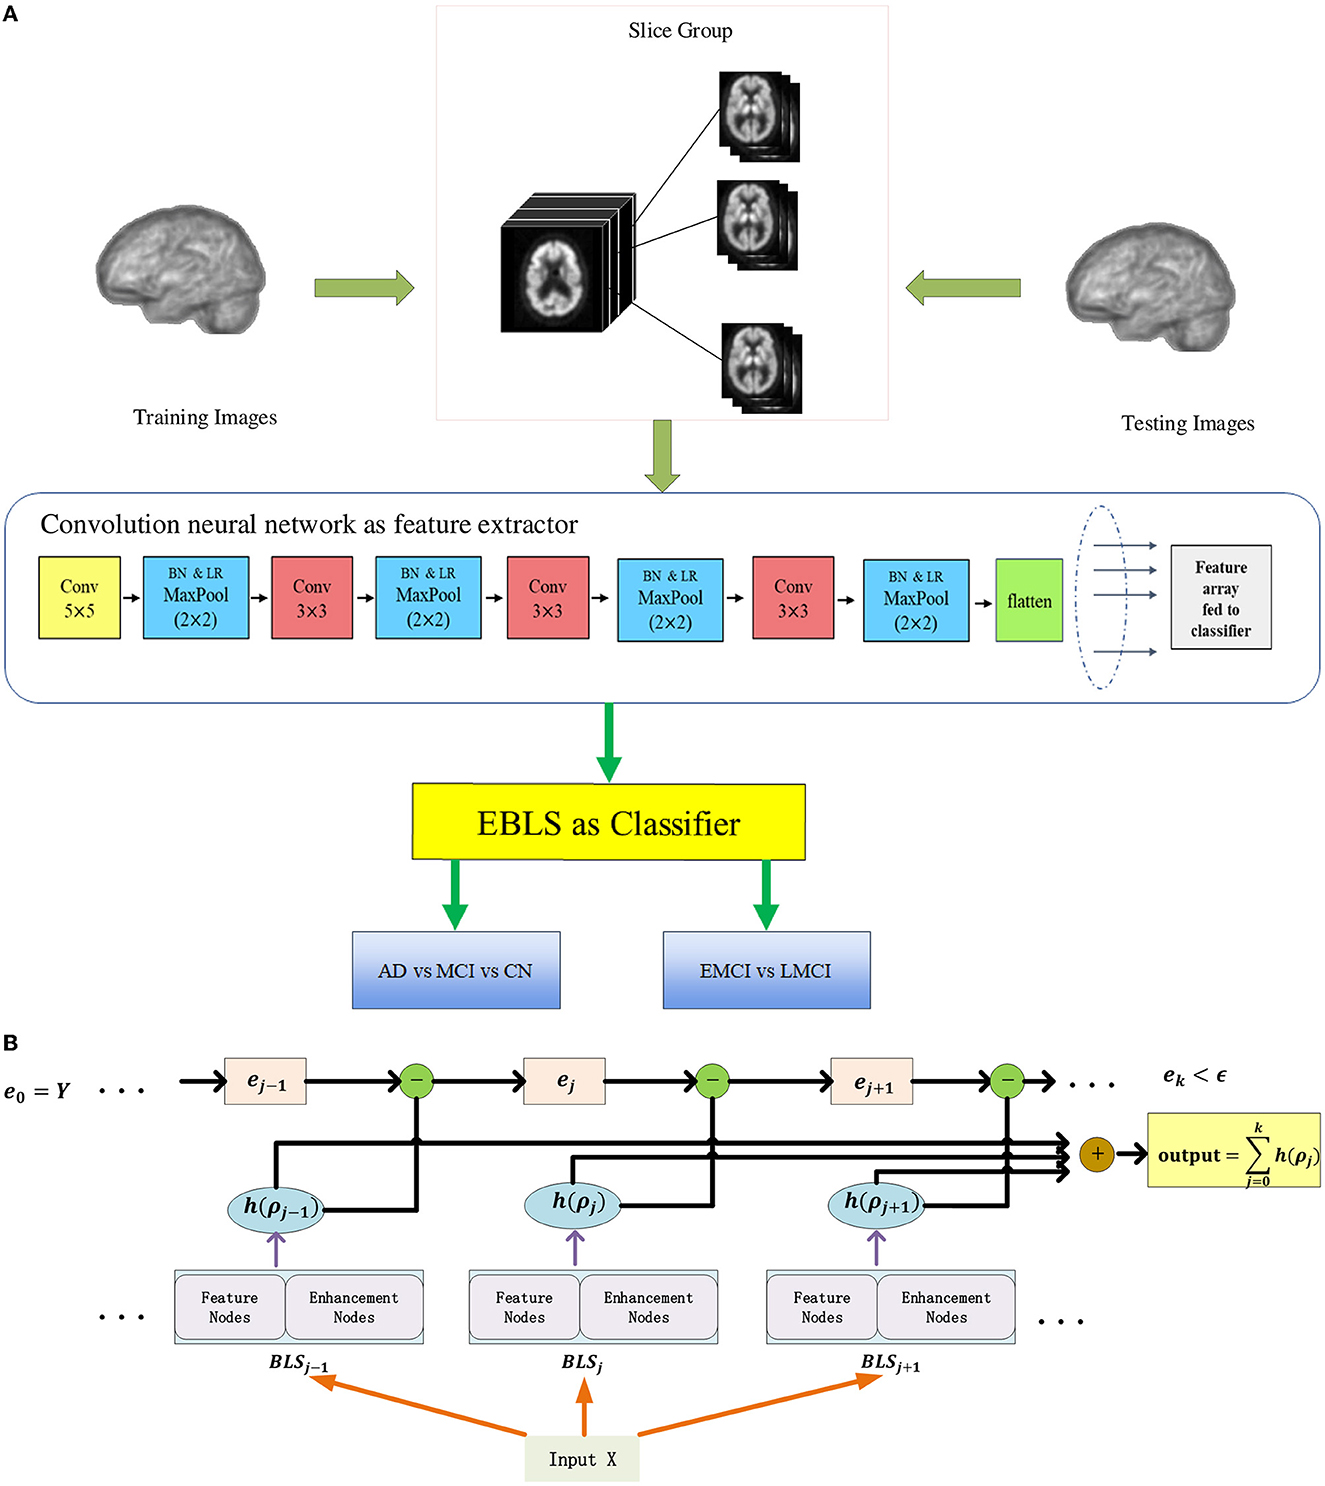
Figure 2. Each 3D image is decomposed into groups of 2D slices at equal intervals. In the first stage, deep convolutional features are extracted from each group by 2D CNN. In the second stage, all features from each slice group are concatenated to form a compact feature vector, and fed to EBLS for final prediction. (A) The overall architecture of BLADNet. (B) The detailed structure of EBLS.
We performed the experiments of AD vs. MCI vs. CN classification as in previous studies on data from ADNI 1, and also performed additional experiments of refined classification between EMCI and LMCI on data from ADNI 2/GO. All data were randomly shuffled before being spli into the training set and test set. In all experiments, we used 80% of the samples for training and 20% of the samples for testing. In the experiment, we regard each category as positive samples respectively, the rest as negative samples, and then calculate metrics. We used accuracy, sensitivity, and specificity as metrics to evaluate classification performance. All metrics were calculated under a default threshold value of 0.5. We also plotted the ROC curve of all experiments and calculated the corresponding AUC.
Two board-certified professional radiologists working in a department of brain imaging and nuclear medicine (radiologist 1: HLZ, with 8 years of experience in brain imaging reading for AD diagnosis; radiologist 2: HHW, with 6 years of experience in brain imaging reading for AD diagnosis) were asked to give their diagnostic impressions of a dataset that was not used for model training. For each case, the radiologists were provided with the patient's age, gender, and MMSE score as additional information for validation. To validate the performance of the proposed model and the professional readings of radiologists, we compared the performance of our proposed model with that of the radiologists' interpretations. The main steps of the experiment are shown in Figure 3.
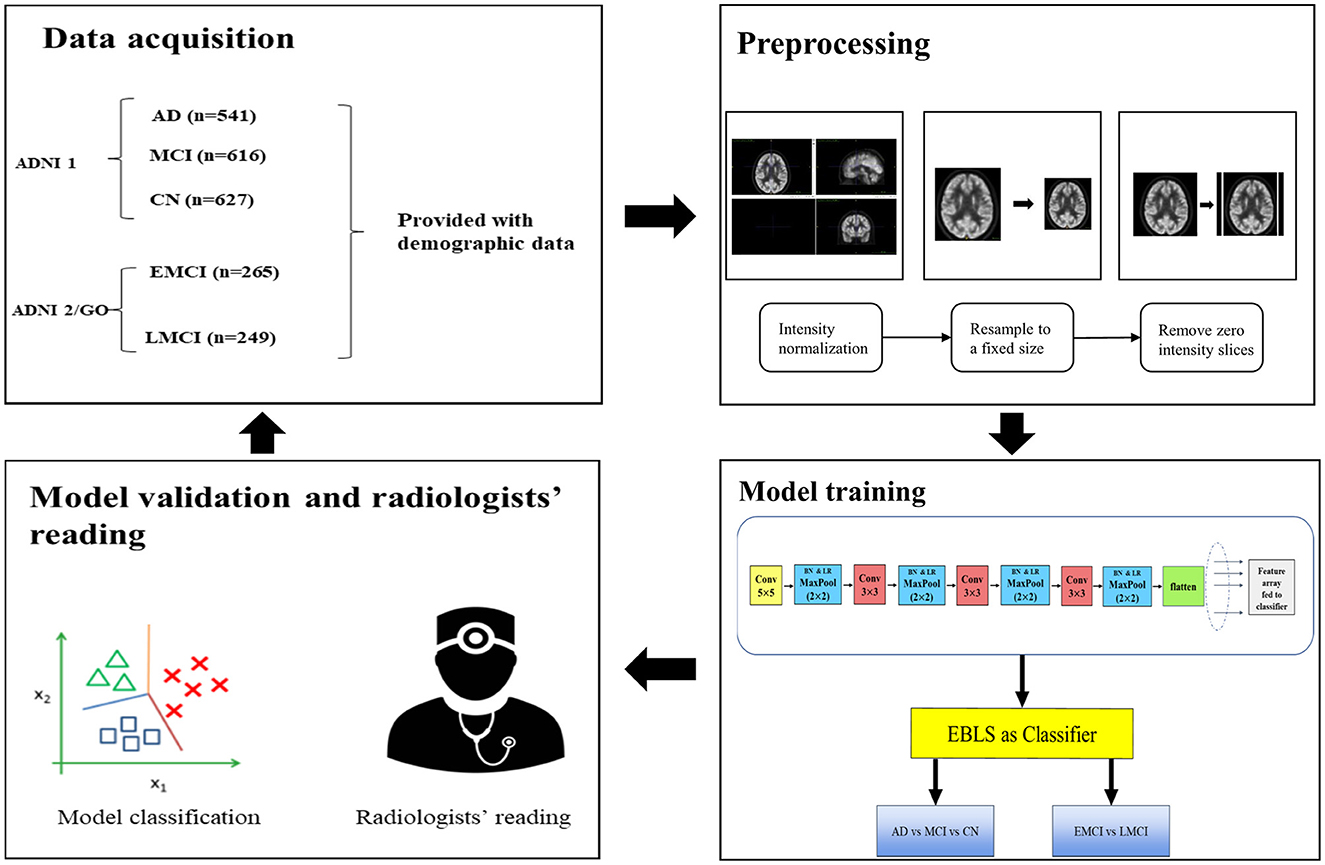
Figure 3. Main steps of the experiment. The data set was split into training and test sets at a ratio of 8:2. In the validation step, the radiologists were provided with demographic information to aid their readings.
The prediction results of the broad network-based model are shown in Table 2. For classification of AD, MCI, and CN samples, sensitivity was 92.16 (94 of 102), 89.34 (109 of 122), and 95.16% (118 of 124), respectively; specificity was 97.56 (240 of 246), 95.58 (216 of 226), and 95.09% (213 of 224), respectively; and precision was 94.00 (94 of 100), 91.60 (109 of 119), and 91.47% (118 of 129), respectively. The ROC curves of our model, trained on 80% of the ADNI data and tested on the remaining 20%, are shown in Figure 4. The AUC in prediction of AD, MCI, and CN was 0.97, 0.98, and 0.99, respectively. The AUC for CN was the highest, indicating that our model can distinguish healthy subjects from patients with AD/MCI.
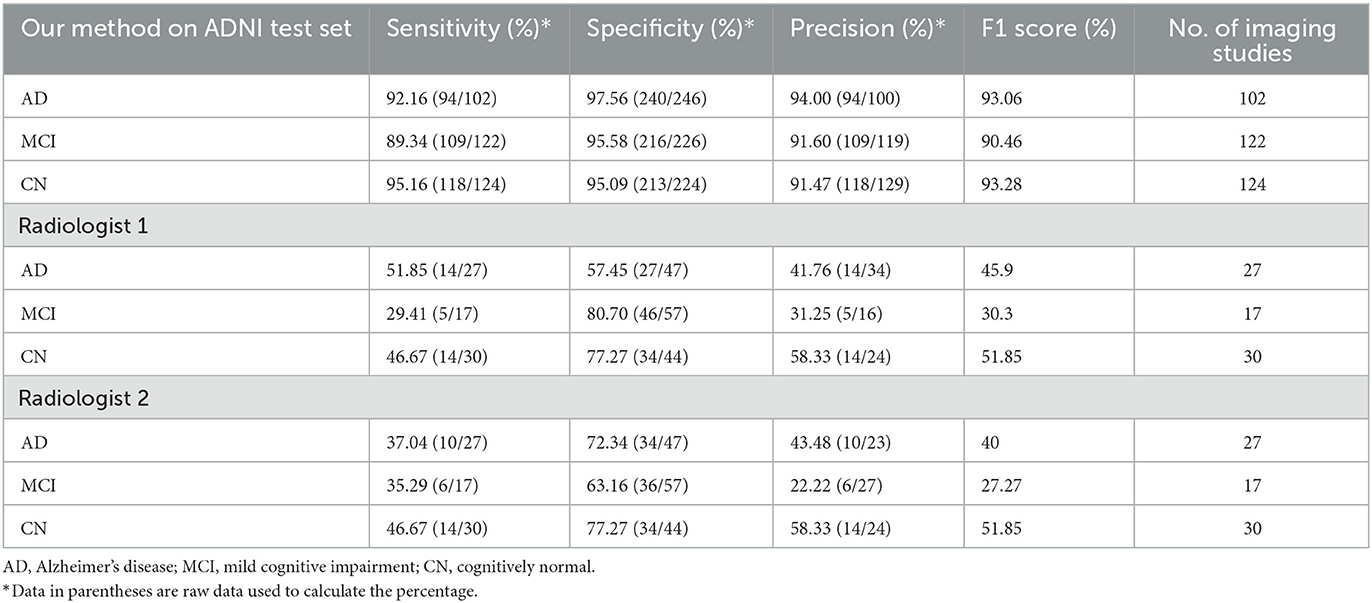
Table 2. Comparison of performance between our model and radiology readers in prediction of AD, MCI, and CN.
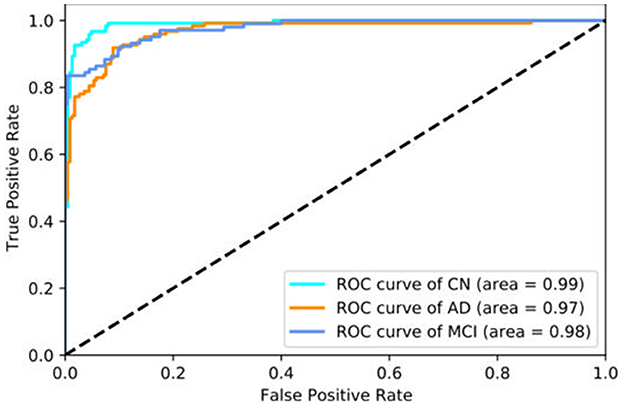
Figure 4. ROC curve of our method tested on the ADNI data set. The ROC curve labeled AD represents the model's performance in distinguishing AD vs. all other classes, the other curves represent the equivalent objective. The AUC is larger for CN than for the other classes, which indicates that our model can distinguish healthy subjects from patients with AD/MCI more successfully than other classifications.
The results for EMCI and LMCI prediction are shown in Table 3. In this experiment, we treated LMCI as the positive class and EMCI as the negative class. Sensitivity was 81.63% (40 of 49) and specificity was 85.19% (46 of 54). Similar to the AD vs. MCI vs. CN experiment, the specificity of the model was much higher than the sensitivity, indicating that our model was better than radiologists at identifying healthy subjects.
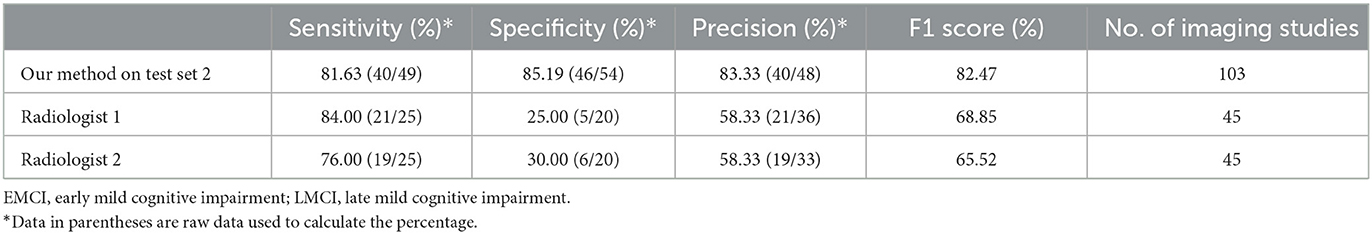
Table 3. Comparison of performance between our model and radiology readers in prediction of EMCI and LMCI.
We used the t-SNE algorithm to reduce the dimensionality of the features extracted from the convolutional network and projected them into a two-dimensional space for visualization. As shown in Figure 5A, for the AD vs. MCI vs. CN experiment, there were obvious boundaries between the three categories. Moreover, only a few samples from other categories were scattered within the CN category, indicating that the model has a better screening ability for healthy cases than for patients. Similarly, as shown in Figure 5B, for EMCI and LMCI classification, the model divided the samples very successfully into two clusters. Although a few cases were mixed in the junction of the two clusters, which indicates that there is a transition stage from EMCI to LMCI, our model could distinguish the two stages well.

Figure 5. Scatter plot of all data after dimension reduction by t-SNE. (A) Visualization of dimension reduction for AD, MCI, and CN. (B) Visualization of dimension reduction for EMCI and LMCI.
Recently, a substantial amount of work has been carried out exploring the application of machine learning approaches to AD prediction using brain imaging. Most of these studies have used structural imaging of the brain, with few studies using functional imaging, specifically 18F-FDG-PET. Some researchers have attempted to analyze 18F-FDG-PET for AD predictions, but these studies have yielded limited success (Liu et al., 2018; Lu et al., 2018; Pan et al., 2018; Ding et al., 2019; Huang et al., 2019; Hamdi et al., 2022). Tables 4, 5 summarize state-of-the-art deep learning methods for prediction of AD using 18F-FDG-PET imaging. Most of the methods investigated can only discriminate AD from CN or MCI from CN, while our method can classify patients at different stages of AD with higher sensitivity and specificity. In addition, compared with these methods, we used a larger test set in our experiments, which demonstrates the superior generalization ability of our method.
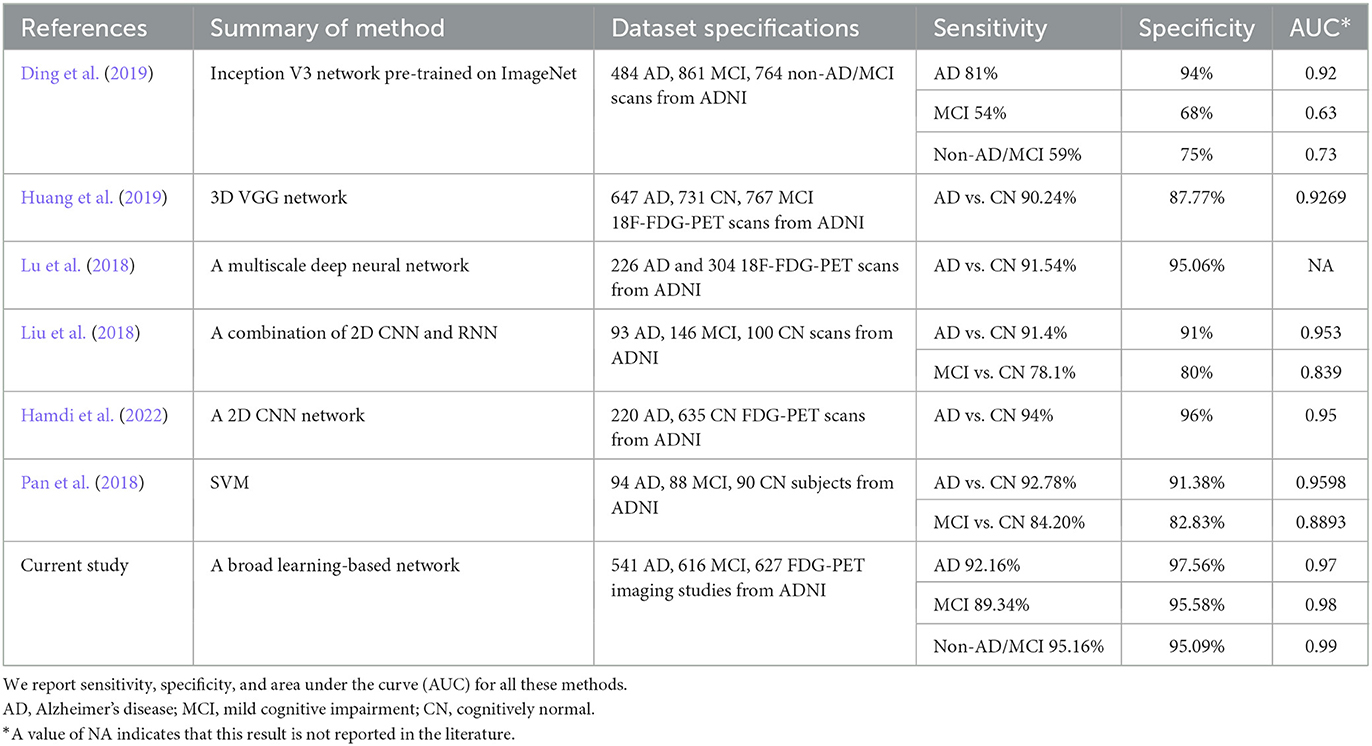
Table 4. Summary of state-of-the-art methods for prediction of Alzheimer's disease (AD) using 18F-FDG-PET imaging.
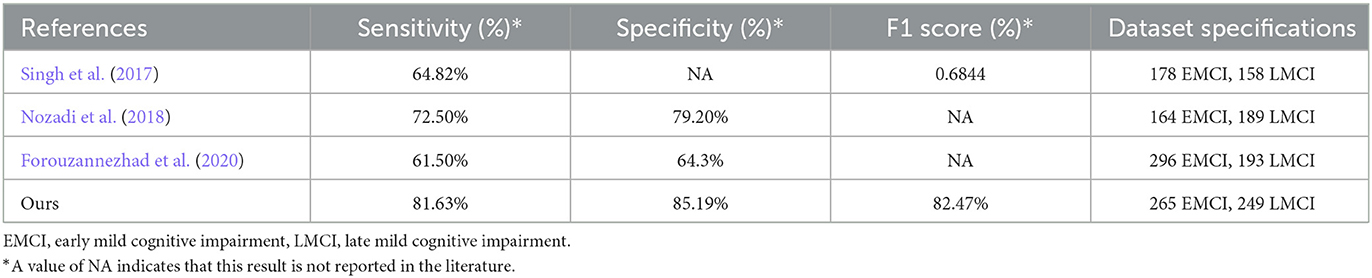
Table 5. Comparison of performance between our model and other existing methods in prediction of EMCI and LMCI.
As shown in Table 2, two radiologists gave their interpretations of a test set. For radiologist 1, the sensitivity results for MCI, AD, and CN were 51.85 (14 of 27), 29.41 (5 of 17), and 46.67% (14 of 30), respectively; the specificity results were 57.45 (27 of 47), 80.70 (46 of 57), and 77.27% (34 of 44), respectively; and the precision results were 41.76 (14 of 34), 34.25 (5 of 16), and 58.33% (14 of 24), respectively. For radiologist 2, sensitivity for MCI, AD, and CN was 37.04 (10 of 27), 35.29 (6 of 17), and 46.67% (14 of 30), respectively; specificity was 72.34 (34 of 47), 63.16 (36 of 57), and 77.27% (34 of 44), respectively; and precision was 43.48 (10 of 23), 22.22 (6 of 27), and 58.33% (14 of 24), respectively. It can be observed that the prediction results of our proposed model were better than those of the radiologist, which indicates that the model was able to find lesions that were difficult to observe with the naked eye. It is also worth noting that although the two radiologists obtained the same results in their evaluations of healthy cases, patients with MCI and AD were difficult to evaluate.
Table 3 reports reader performance on prediction of EMCI vs. LMCI. For radiologist 1, the results in terms of sensitivity, specificity, and precision were 84.00 (21 of 25), 25.00 (5 of 20), and 58.33% (21 of 36), respectively. For radiologist 2, the results were 76.00 (19 of 25), 30.00 (6 of 20), and 58.33% (19 of 33), respectively. Although radiologists had higher sensitivity in this scenario, their specificity was very low; this is because radiologists tend to predict cases as LMCI. In contrast, our model was able to achieve high specificity under high sensitivity.
With the aging of the population, the number of patients with AD is continuously increasing. However, research on a cure for AD has been slow, and the focus of research has shifted to the early diagnosis of AD, so that early prevention measures can delay the progression of the disease. However, early identification of patients at the prodromal stage of AD is still a challenging problem. The broad neural network-based model can identify patients with AD at different stages with high sensitivity and specificity. In addition, in identifying patients at the EMCI or LMCI stage, the proposed model is able to achieve high sensitivity under high specificity; notably, it outperformed professional radiologist readers, achieving higher sensitivity and specificity.
Previous research has studied the specific pattern of hypometabolism that can be observed in FDG-PET of patients with AD. Bilateral temporo-parietal hypometabolism has been found to be a dominant pattern related to clinically confirmed AD (Hoffman et al., 2000). Other studies have demonstrated that, as the disease progresses, FDG uptake is reduced, especially in the frontal, parietal, and lateral temporal lobes (Ossenkoppele et al., 2012). However, FDG-PET is not a definitive imaging biomarker for AD and MCI. Substantial previous efforts have been devoted to attempts to develop computer-aided methods of diagnosis of AD via other modalities, but few studies have been conducted involving attempts to applying machine learning approaches to classify patients with AD by FDG-PET alone. Previous attempts to identify MCI have resulted in limited sensitivity (81% for AD, 54% for MCI) and specificity (Ding et al., 2019). In addition to prediction of AD, our model performs refined classification of EMCI vs. LMCI, achieving sensitivity of 81.63% and specificity of 85.19% in doing so. Compared to previous studies, the key advantages of our model are as follows. First, due to the incremental learning ability of BLS, our model can be dynamically updated without retraining from scratch if new imaging studies are added; our EBLS model can further extend the incremental learning ability of BLS by adding new BLS blocks dynamically. In addition, our model exhibits better performance in the identification of the early stage of AD, which is of great significance for the diagnosis of AD, because early identification of AD facilitates early intervention in the progression of the disease. There are also some limitations to our model in that the training needs to be completed in two stages, and the process is complicated. In addition, training a convolution layer from scratch for the first time is still time-consuming work, and the BLS model in the second stage depends on the quality of feature extraction in the convolution layer.
Because of deep structure, deep learning models are very good at capturing abstract and intrinsic features of images. However, the problems existing in deep learning models, such as gradient explosion and vanishing gradients, usually limit the possibility of deepening the networks of deep learning models indefinitely. BLS can solve this problem in a different way, providing good universal approximation ability with a flat structure. The universal approximation ability of BLS has been proven by Chen et al. (2018). Our proposed method utilizes a convolution layer as a feature extractor to provide deep space features for BLS, and our proposed EBLS model can enhance the features in broad space before computing the final output. The comparison in the section above demonstrates that our method achieves better performance than state-of-the-art deep learning methods, which demonstrates the role of broad learning in feature enhancement. In addition, compared to other studies that have only used dozens of images, our model was trained and validated on a large dataset containing thousands of images and achieves better performance, which indicates that our method has better generalizability. However, in real clinical scenarios, the reasons for hypometabolism observed in FDG-PET may be more complicated. For instance, other types of dementia, such as dementia with Lewy bodies (DLB) or frontotemporal dementia (FTD), may also cause pathological changes similar to AD. Further studies that verify this method on more complex data may in future provide more reliable clinical aids for diagnosis of AD.
Our study also has limitations. First, although the machine learning method has achieved very good results in the validation with the ADNI data set, actual clinical prediction is much more complicated. For instance, many patients may have neurological diseases other than AD, which will affect the prediction results. We will continue our investigation and apply our model to a more general patient population in the future. Second, the algorithm can learn features that are difficult to see with the naked eye (which means that its predictions can differ from experts' interpretations), and t-SNE dimension reduction also shows the gradual progression of patients from MCI to AD, but the model cannot provide interpretable information for radiologists.
In conclusion, in our study we have developed a novel broad network-based model for prediction of AD diagnosis using 18F-FDG-PET of the brain. The proposed broad learning-based model was able to achieve high accuracy, sensitivity, and specificity on the validation set and outperformed professional radiologist readers in predicting AD based on FDG-PET. Moreover, the proposed model can be integrated into the clinical workflow as a powerful auxiliary diagnosis tool for reading PET imaging of patients with AD.
Publicly available datasets were analyzed in this study. This data can be found here: https://adni.loni.usc.edu.
Ethical approval was not provided for this study on human participants because the data used in this research was obtained from public available dataset. The patients/participants provided their written informed consent to participate in this study.
JD: conceptualization, methodology, validation, visualization, writing—original draft, writing—review and editing, supervision, project administration, and funding acquisition. YL: data curation, methodology, software, validation, and writing—original draft. HW: validation and software. JW: supervision and project administration. LC: visualization and writing—review and editing. CC: conceptualization, resources, and supervision. All authors contributed to the article and approved the submitted version.
Data used in preparation of this article were obtained from the Alzheimer's Disease Neuroimaging Initiative (ADNI) database (http://adni.loni.usc.edu). As such, the investigators within the ADNI contributed to the design and implementation of ADNI and/or provided data but did not participate in analysis or writing of this report. A complete listing of ADNI investigators can be found at: http://adni.loni.usc.edu/wp-content/uploads/how_to_apply/ADNI_Acknowledgement_List.pdf. This work was supported in part by Guangdong Basic and Applied Basic Research Foundation under Grant 2021A1515011999, in part by the National Key Research and Development Program of China under Grant 2018YFC2002500, and in part by Guangdong Provincial Key Laboratory of Traditional Chinese Medicine Informatization under Grant 2021B1212040007.
The authors declare that the research was conducted in the absence of any commercial or financial relationships that could be construed as a potential conflict of interest.
All claims expressed in this article are solely those of the authors and do not necessarily represent those of their affiliated organizations, or those of the publisher, the editors and the reviewers. Any product that may be evaluated in this article, or claim that may be made by its manufacturer, is not guaranteed or endorsed by the publisher.
The Supplementary Material for this article can be found online at: https://www.frontiersin.org/articles/10.3389/fnins.2023.1137567/full#supplementary-material
1. ^The code of EBLS model (https://github.com/YangLiuuuu/Extreme-Broad-Learning-System).
Baydargil, H. B., Park, J. S., and Kang, D. Y. (2021). Anomaly analysis of Alzheimer's disease in PET images using an unsupervised adversarial deep learning model. Appl. Sci. 11, 2187. doi: 10.3390/app11052187
Bouter, C., Henniges, P., Franke, T. N., Irwin, C., Sahlmann, C. O., Sichler, M. E., et al. (2019). 18F-FDG-PET detects drastic changes in brain metabolism in the Tg4–42 model of Alzheimer's disease. Front. Aging Neurosci. 10, 425. doi: 10.3389/fnagi.2018.00425
Brown, R. K., Bohnen, N. I., Wong, K. K., Minoshima, S., and Frey, K. A. (2014). Brain PET in suspected dementia: patterns of altered FDG metabolism. Radiographics 34, 684–701. doi: 10.1148/rg.343135065
Chen, C. P., and Liu, Z. (2017). Broad learning system: an effective and efficient incremental learning system without the need for deep architecture. IEEE Trans. Neural Netw. Learn. Syst. 29, 10–24. doi: 10.1109/TNNLS.2017.2716952
Chen, C. P., Liu, Z., and Feng, S. (2018). Universal approximation capability of broad learning system and its structural variations. IEEE Trans. Neural Netw. Learn. Syst. 30, 1191–1204. doi: 10.1109/TNNLS.2018.2866622
Chételat, G., Arbizu, J., Barthel, H., Garibotto, V., Law, I., Morbelli, S., et al. (2020). Amyloid-PET and 18F-FDG-PET in the diagnostic investigation of Alzheimer's disease and other dementias. Lancet Neurol. 19, 951–962. doi: 10.1016/S1474-4422(20)30314-8
Chu, F., Liang, T., Chen, C. P., Wang, X., and Ma, X. (2019). Weighted broad learning system and its application in non-linear industrial process modeling. IEEE Trans. Neural Netw. Learn. Syst. 31, 3017–3031. doi: 10.1109/TNNLS.2019.2935033
Ding, Y., Sohn, J. H., Kawczynski, M. G., Trivedi, H., Harnish, R., Jenkins, N. W., et al. (2019). A deep learning model to predict a diagnosis of Alzheimer disease by using 18F-FDG PET of the brain. Radiology 290, 456–464. doi: 10.1148/radiol.2018180958
Du, J., Vong, C. M., and Chen, C. P. (2020). Novel efficient RNN and LSTM-like architectures: recurrent and gated broad learning systems and their applications for text classification. IEEE Trans. Cybern. 51, 1586–1597. doi: 10.1109/TCYB.2020.2969705
Feng, S., and Chen, C. P. (2018). Fuzzy broad learning system: a novel neuro-fuzzy model for regression and classification. IEEE Trans. Cybern. 50, 414–424. doi: 10.1109/TCYB.2018.2857815
Forouzannezhad, P., Abbaspour, A., Li, C., Fang, C., Williams, U., Cabrerizo, M., et al. (2020). A Gaussian-based model for early detection of mild cognitive impairment using multimodal neuroimaging. J. Neurosci. Methods 333, 108544. doi: 10.1016/j.jneumeth.2019.108544
Gong, X., Zhang, T., Chen, C. P., and Liu, Z. (2021). Research review for broad learning system: algorithms, theory, and applications. IEEE Trans. Cybern. 52, 8922–8950. doi: 10.1109/TCYB.2021.3061094
Hamdi, M., Bourouis, S., Rastislav, K., and Mohmed, F. (2022). Evaluation of neuro images for the diagnosis of Alzheimer's disease using deep learning neural network. Front. Public Health 10, 35. doi: 10.3389/fpubh.2022.834032
He, K., Zhang, X., Ren, S., and Sun, J. (2016). “Deep residual learning for image recognition,” in Proceedings of the IEEE Conference on Computer Vision and Pattern Recognition (Las Vegas, NV: IEEE). doi: 10.1109/CVPR.2016.90
Hoffman, J. M., Welsh-Bohmer, K. A., Hanson, M., Crain, B., Hulette, C., Earl, N., et al. (2000). FDG PET imaging in patients with pathologically verified dementia. J. Nucl. Med. 41, 1920–1928.
Huang, Y., Xu, J., Zhou, Y., Tong, T., Zhuang, X., and Alzheimer's Disease Neuroimaging Initiative (ADNI). (2019). Diagnosis of Alzheimer's disease via multi-modality 3D convolutional neural network. Front. Neurosci. 13, 509. doi: 10.3389/fnins.2019.00509
Jack, C. R. Jr, Bernstein, M. A., Fox, N. C., Thompson, P., Alexander, G., Harvey, D., et al. (2008). The Alzheimer's disease neuroimaging initiative (ADNI): MRI methods. J. Magnet. Reson. Imag. Off. J. Int. Soc. Magnet. Reson. Med. 27, 685–691. doi: 10.1002/jmri.21049
Jagust, W., Gitcho, A., Sun, F., Kuczynski, B., Mungas, D., and Haan, M. (2006). Brain imaging evidence of preclinical Alzheimer's disease in normal aging. Ann. Neurol. Off. J. Am. Neurol. Assoc. Child Neurol. Soc. 59, 673–681. doi: 10.1002/ana.20799
Jara-Maldonado, M., Alarcon-Aquino, V., and Rosas-Romero, R. (2022). A new machine learning model based on the broad learning system and wavelets. Eng. Appl. Artif. Intell. 112, 104886. doi: 10.1016/j.engappai.2022.104886
Jessen, F., Wolfsgruber, S., Wiese, B., Bickel, H., Mösch, E., Kaduszkiewicz, H., et al. (2014). AD dementia risk in late MCI, in early MCI, and in subjective memory impairment. Alzheimer's Dementia 10, 76–83. doi: 10.1016/j.jalz.2012.09.017
Kobylecki, C., Langheinrich, T., Hinz, R., Vardy, E. R., Brown, G., Martino, M. E., et al. (2015). 18F-florbetapir PET in patients with frontotemporal dementia and Alzheimer disease. J. Nucl. Med. 56, 386–391. doi: 10.2967/jnumed.114.147454
Levin, F., Ferreira, D., Lange, C., Dyrba, M., Westman, E., Buchert, R., et al. (2021). Data-driven FDG-PET subtypes of Alzheimer's disease-related neurodegeneration. Alzheimer's Res. Therapy 13, 1–14. doi: 10.1186/s13195-021-00785-9
Liu, M., Cheng, D., Yan, W., and Alzheimer's Disease Neuroimaging Initiative. (2018). Classification of Alzheimer's disease by combination of convolutional and recurrent neural networks using FDG-PET images. Front. Neuroinform. 12, 35. doi: 10.3389/fninf.2018.00035
Lu, D., Popuri, K., Ding, G. W., Balachandar, R., Beg, M. F., and Alzheimer's Disease Neuroimaging Initiative. (2018). Multiscale deep neural network based analysis of FDG-PET images for the early diagnosis of Alzheimer's disease. Med. Image Anal. 46, 26–34. doi: 10.1016/j.media.2018.02.002
Marcus, C., Mena, E., and Subramaniam, R. M. (2014). Brain PET in the diagnosis of Alzheimer's disease. Clin. Nucl. Med. 39, e413. doi: 10.1097/RLU.0000000000000547
Mosconi, L., Tsui, W. H., Herholz, K., Pupi, A., Drzezga, A., Lucignani, G., et al. (2008). Multicenter standardized 18F-FDG PET diagnosis of mild cognitive impairment, Alzheimer's disease, and other dementias. J. Nucl. Med. 49, 390–398. doi: 10.2967/jnumed.107.045385
Nozadi, S. H., Kadoury, S., and Alzheimer's Disease Neuroimaging Initiative. (2018). Classification of Alzheimer's and MCI patients from semantically parcelled PET images: a comparison between AV45 and FDG-PET. Int. J. Biomed. Imag. 2018, 7430. doi: 10.1155/2018/1247430
Ossenkoppele, R., Tolboom, N., Foster-Dingley, J. C., Adriaanse, S. F., Boellaard, R., Yaqub, M., et al. (2012). Longitudinal imaging of Alzheimer pathology using [11C] PIB,[18F] FDDNP and [18F] FDG PET. Eur. J. Nucl. Med. Mol. Imag. 39, 990–1000. doi: 10.1007/s00259-012-2102-3
Pan, X., Adel, M., Fossati, C., Gaidon, T., and Guedj, E. (2018). Multilevel feature representation of FDG-PET brain images for diagnosing Alzheimer's disease. IEEE J. Biomed. Health Inform. 23, 1499–1506. doi: 10.1109/JBHI.2018.2857217
Pao, Y. H., and Takefuji, Y. (1992). Functional-link net computing: theory, system architecture, and functionalities. Computer 25, 76–79.
Singh, S., Srivastava, A., Mi, L., Caselli, R. J., Chen, K., Goradia, D., et al. (2017). “Deep-learning-based classification of FDG-PET data for Alzheimer's disease categories,” in Proceedings of the 13th International Conference on Medical Information Processing and Analysis (Washington, DC: SPIE). doi: 10.1117/12.2294537
Suk, H. I., and Shen, D. (2013). “Deep learning-based feature representation for AD/MCI classification,” in International Conference on Medical Image Computing and Computer-Assisted Intervention (Berlin, Heidelberg: Springer). doi: 10.1007/978-3-642-40763-5_72
Wu, G., and Duan, J. (2022). BLCov: a novel collaborative–competitive broad learning system for COVID-19 detection from radiology images. Eng. Appl. Artif. Intell. 115, 105323. doi: 10.1016/j.engappai.2022.105323
Keywords: Alzheimer's disease, PET, broad learning system, neural network, computer-aided diagnosis
Citation: Duan J, Liu Y, Wu H, Wang J, Chen L and Chen CLP (2023) Broad learning for early diagnosis of Alzheimer's disease using FDG-PET of the brain. Front. Neurosci. 17:1137567. doi: 10.3389/fnins.2023.1137567
Received: 04 January 2023; Accepted: 13 February 2023;
Published: 13 March 2023.
Edited by:
Ahmed Shalaby, University of Texas Southwestern Medical Center, United StatesReviewed by:
Peixin Lu, Wuhan University, ChinaCopyright © 2023 Duan, Liu, Wu, Wang, Chen and Chen. This is an open-access article distributed under the terms of the Creative Commons Attribution License (CC BY). The use, distribution or reproduction in other forums is permitted, provided the original author(s) and the copyright owner(s) are credited and that the original publication in this journal is cited, in accordance with accepted academic practice. No use, distribution or reproduction is permitted which does not comply with these terms.
*Correspondence: Junwei Duan, andkdWFuQGpudS5lZHUuY24=; Jing Wang, d2pfYWRyQDE2My5jb20=
Disclaimer: All claims expressed in this article are solely those of the authors and do not necessarily represent those of their affiliated organizations, or those of the publisher, the editors and the reviewers. Any product that may be evaluated in this article or claim that may be made by its manufacturer is not guaranteed or endorsed by the publisher.
Research integrity at Frontiers
Learn more about the work of our research integrity team to safeguard the quality of each article we publish.