- 1School of Precision Instruments and Optoelectronics Engineering, Tianjin University, Tianjin, China
- 2Academy of Medical Engineering and Translational Medicine, Tianjin University, Tianjin, China
- 3Beijing Machine and Equipment Institute, Beijing, China
- 4International School for Optoelectronic Engineering, Qilu University of Technology (Shandong Academy of Sciences), Jinan, China
Objective: The motor imagery (MI)-based brain–computer interface (BCI) is one of the most popular BCI paradigms. Common spatial pattern (CSP) is an effective algorithm for decoding MI-related electroencephalogram (EEG) patterns. However, it highly depends on the selection of EEG frequency bands. To address this problem, previous researchers often used a filter bank to decompose EEG signals into multiple frequency bands before applying the traditional CSP.
Approach: This study proposed a novel method, i.e., transformed common spatial pattern (tCSP), to extract the discriminant EEG features from multiple frequency bands after but not before CSP. To verify its effectiveness, we tested tCSP on a dataset collected by our team and a public dataset from BCI competition III. We also performed an online evaluation of the proposed method.
Main results: As a result, for the dataset collected by our team, the classification accuracy of tCSP was significantly higher than CSP by about 8% and filter bank CSP (FBCSP) by about 4.5%. The combination of tCSP and CSP further improved the system performance with an average accuracy of 84.77% and a peak accuracy of 100%. For dataset IVa in BCI competition III, the combination method got an average accuracy of 94.55%, which performed best among all the presented CSP-based methods. In the online evaluation, tCSP and the combination method achieved an average accuracy of 80.00 and 84.00%, respectively.
Significance: The results demonstrate that the frequency band selection after CSP is better than before for MI-based BCIs. This study provides a promising approach for decoding MI EEG patterns, which is significant for the development of BCIs.
1. Introduction
Brain–computer interfaces (BCIs) are systems that directly measure brain activities and convert them into artificial outputs. BCIs can replace, restore, enhance, supplement, or improve the natural central nervous system outputs (Birbaumer et al., 2008; Wolpaw and Wolpaw, 2012; Chaudhary et al., 2016; Coogan and He, 2018; Xu et al., 2021; Ju et al., 2022). Currently, scalp electroencephalogram (EEG) is the most popular brain signal for BCIs due to its relatively high temporal resolution and low cost (Park et al., 2012; Xu et al., 2018, 2020; Meng et al., 2020). Among all BCI paradigms, motor imagery (MI)-based BCI is considered more natural than others, which depends on decoding sensorimotor cortex activation patterns induced by imagining movements of specific body parts (Pfurtscheller and Neuper, 2001; Wolpaw et al., 2002).
Event-related desynchronization/synchronization (ERD/ERS) is the most typical EEG feature related to the brain movement intention, which shows a power decrease/increase in specific frequency bands (Pfurtscheller and Da Silva, 1999). For MI-BCIs, it is a key issue to accurately detect the ERD/ERS features. Currently, there are three main categories of MI-BCI algorithms (Herman et al., 2008; Brodu et al., 2011; Lotte et al., 2018), i.e., deep learning-based, Riemannian geometry-based and traditional filtering-based methods. Deep learning (Craik et al., 2019; Zhang et al., 2019) and Riemannian (Fang et al., 2022) methods are recently developed algorithms, both showing good classification performance in MI-BCIs. Deep learning techniques aim to uncover most of the valuable discriminative information within datasets for good classification performance (Goodfellow et al., 2016; Al-Saegh et al., 2021). Both effective features and classifiers are jointly learned directly from the raw EEG. The idea of the Riemannian method is to map the EEG data directly onto a geometrical space equipped with a suitable metric (Barachant et al., 2010, 2012; Yger et al., 2017). Due to its intrinsic nature Riemannian method is robust to noise and provides a good generalization capability (Waytowich et al., 2016; Zanini et al., 2018). The filtering-based methods first filter EEG data in both time and spatial domains and then extract the discriminative features. As a kind of filtering-based method, common spatial pattern (CSP) has been widely used for MI-BCIs due to its conciseness and effectiveness (Ramoser et al., 2000; Lotte et al., 2018). CSP is one of the most efficient and popular methods to extract band-power discriminative features (Ramoser et al., 2000; Blankertz et al., 2007; Chen et al., 2018; Wang et al., 2020). This study aims further to improve the performance of CSP in MI-based BCIs.
The idea of CSP is to maximize the variance of one class and minimize that of the other class simultaneously (Blankertz et al., 2007; Grosse-Wentrup and Buss, 2008; Li et al., 2016; Wang et al., 2020). However, the performance of CSP heavily depends on the selection of EEG frequency bands. It would degrade with inappropriate frequency bands. Previous studies have demonstrated a great deal of ERD/ERS variability among subjects regarding their frequency characteristics (Pfurtscheller et al., 1997; Guger et al., 2000). To address this problem, researchers have proposed several advanced versions of CSP to optimize the selection of frequency bands before applying CSP. For example, Lemm et al. (2005) designed the common spatio-spectral pattern (CSSP) algorithm, which could individually tune frequency filters at each electrode position. However, the frequency filter setting in CSSP is inflexible (Dornhege et al., 2006). Dornhege et al. (2006) proposed the common sparse spectral spatial pattern (CSSSP), which could simultaneously optimize a finite impulse response (FIR) filter and a spatial filter to select the individual-specific frequency bands automatically. It yielded better performance than CSSP, but the optimization process of CSSSP is complicated and time-consuming. Later, Novi et al. (2007) tried to decompose the EEG signals into sub-bands using a filter bank instead of temporal FIR filtering, called sub-band common spatial pattern (SBCSP). SBCSP could mitigate the time-consuming problem of the fine-tuning process during the construction of BCI classification models. In 2008, the filter bank common spatial pattern (FBCSP) was proposed by Kai Keng et al. (2008), which had the best performance in frequency band selection (Ang et al., 2012).
Besides, the regularization method has also been studied to further boost the performance of CSP. Lu et al. (2009) proposed the regularized common spatial pattern (R-CSP), which regularized the covariance matrix estimation for typical CSP. Park and Lee (2017) utilized principal component analysis (PCA) to extract R-CSP features from all frequency sub-bands, called sub-band regularized common spatial pattern (SBRCSP). Later, Park et al. (2017) proposed the regularized filter bank common spatial pattern (FBRCSP), which combined R-CSP with the filter bank structure. Both SBRCSP and FBRCSP showed better performance than CSP, FBCSP, and R-CSP.
This study proposed a novel algorithm called transformed common spatial pattern (tCSP) to further improve the selection of optimal frequency bands. Unlike traditional approaches that optimize the frequency selection before CSP filtering, the proposed tCSP selects the subject-specific frequency after CSP filtering. Two offline datasets and an online evaluation were employed to verify the effectiveness of tCSP.
2. Materials and methods
2.1. Dataset description
This study uses two offline datasets to evaluate the performance of the proposed algorithms. One is the dataset (not publicly available) from an experiment performed by our team. This experiment is called experiment one in this paper. The other is the Dataset IVa of BCI Competition III (Blankertz et al., 2006), which is always used for testing CSP-based algorithms. Moreover, we performed the second experiment, i.e., experiment two, to assess the effectiveness and suitability of the proposed algorithm in the online operation.
2.1.1. The dataset of experiment one
The dataset contains EEG signals from eleven healthy subjects aged 21–26 years. In the experiment, they were required to perform two different MI tasks of left- and right-hand movements. Figure 1A shows the timing of a trial paradigm. An electrode placed on the nose served as the reference, and the ground electrode was placed on the forehead. The data were acquired by a SynAmps2 system with a 64-channel EEG quick-cap, and 60 channels were measured at positions of the international 10/20-system. The data were sampled at 1000 Hz, band-pass filtered between 0.5 and 100 Hz. A notch filter with 50 Hz was also used to remove the power grid noise during the data acquisition. The experiment was composed of 10 blocks, and each block consisted of 8 trials (4 trials for each hand). The sequence of cues for different MI tasks was presented randomly in each block. The experiment was approved by the ethical committee of Tianjin University.
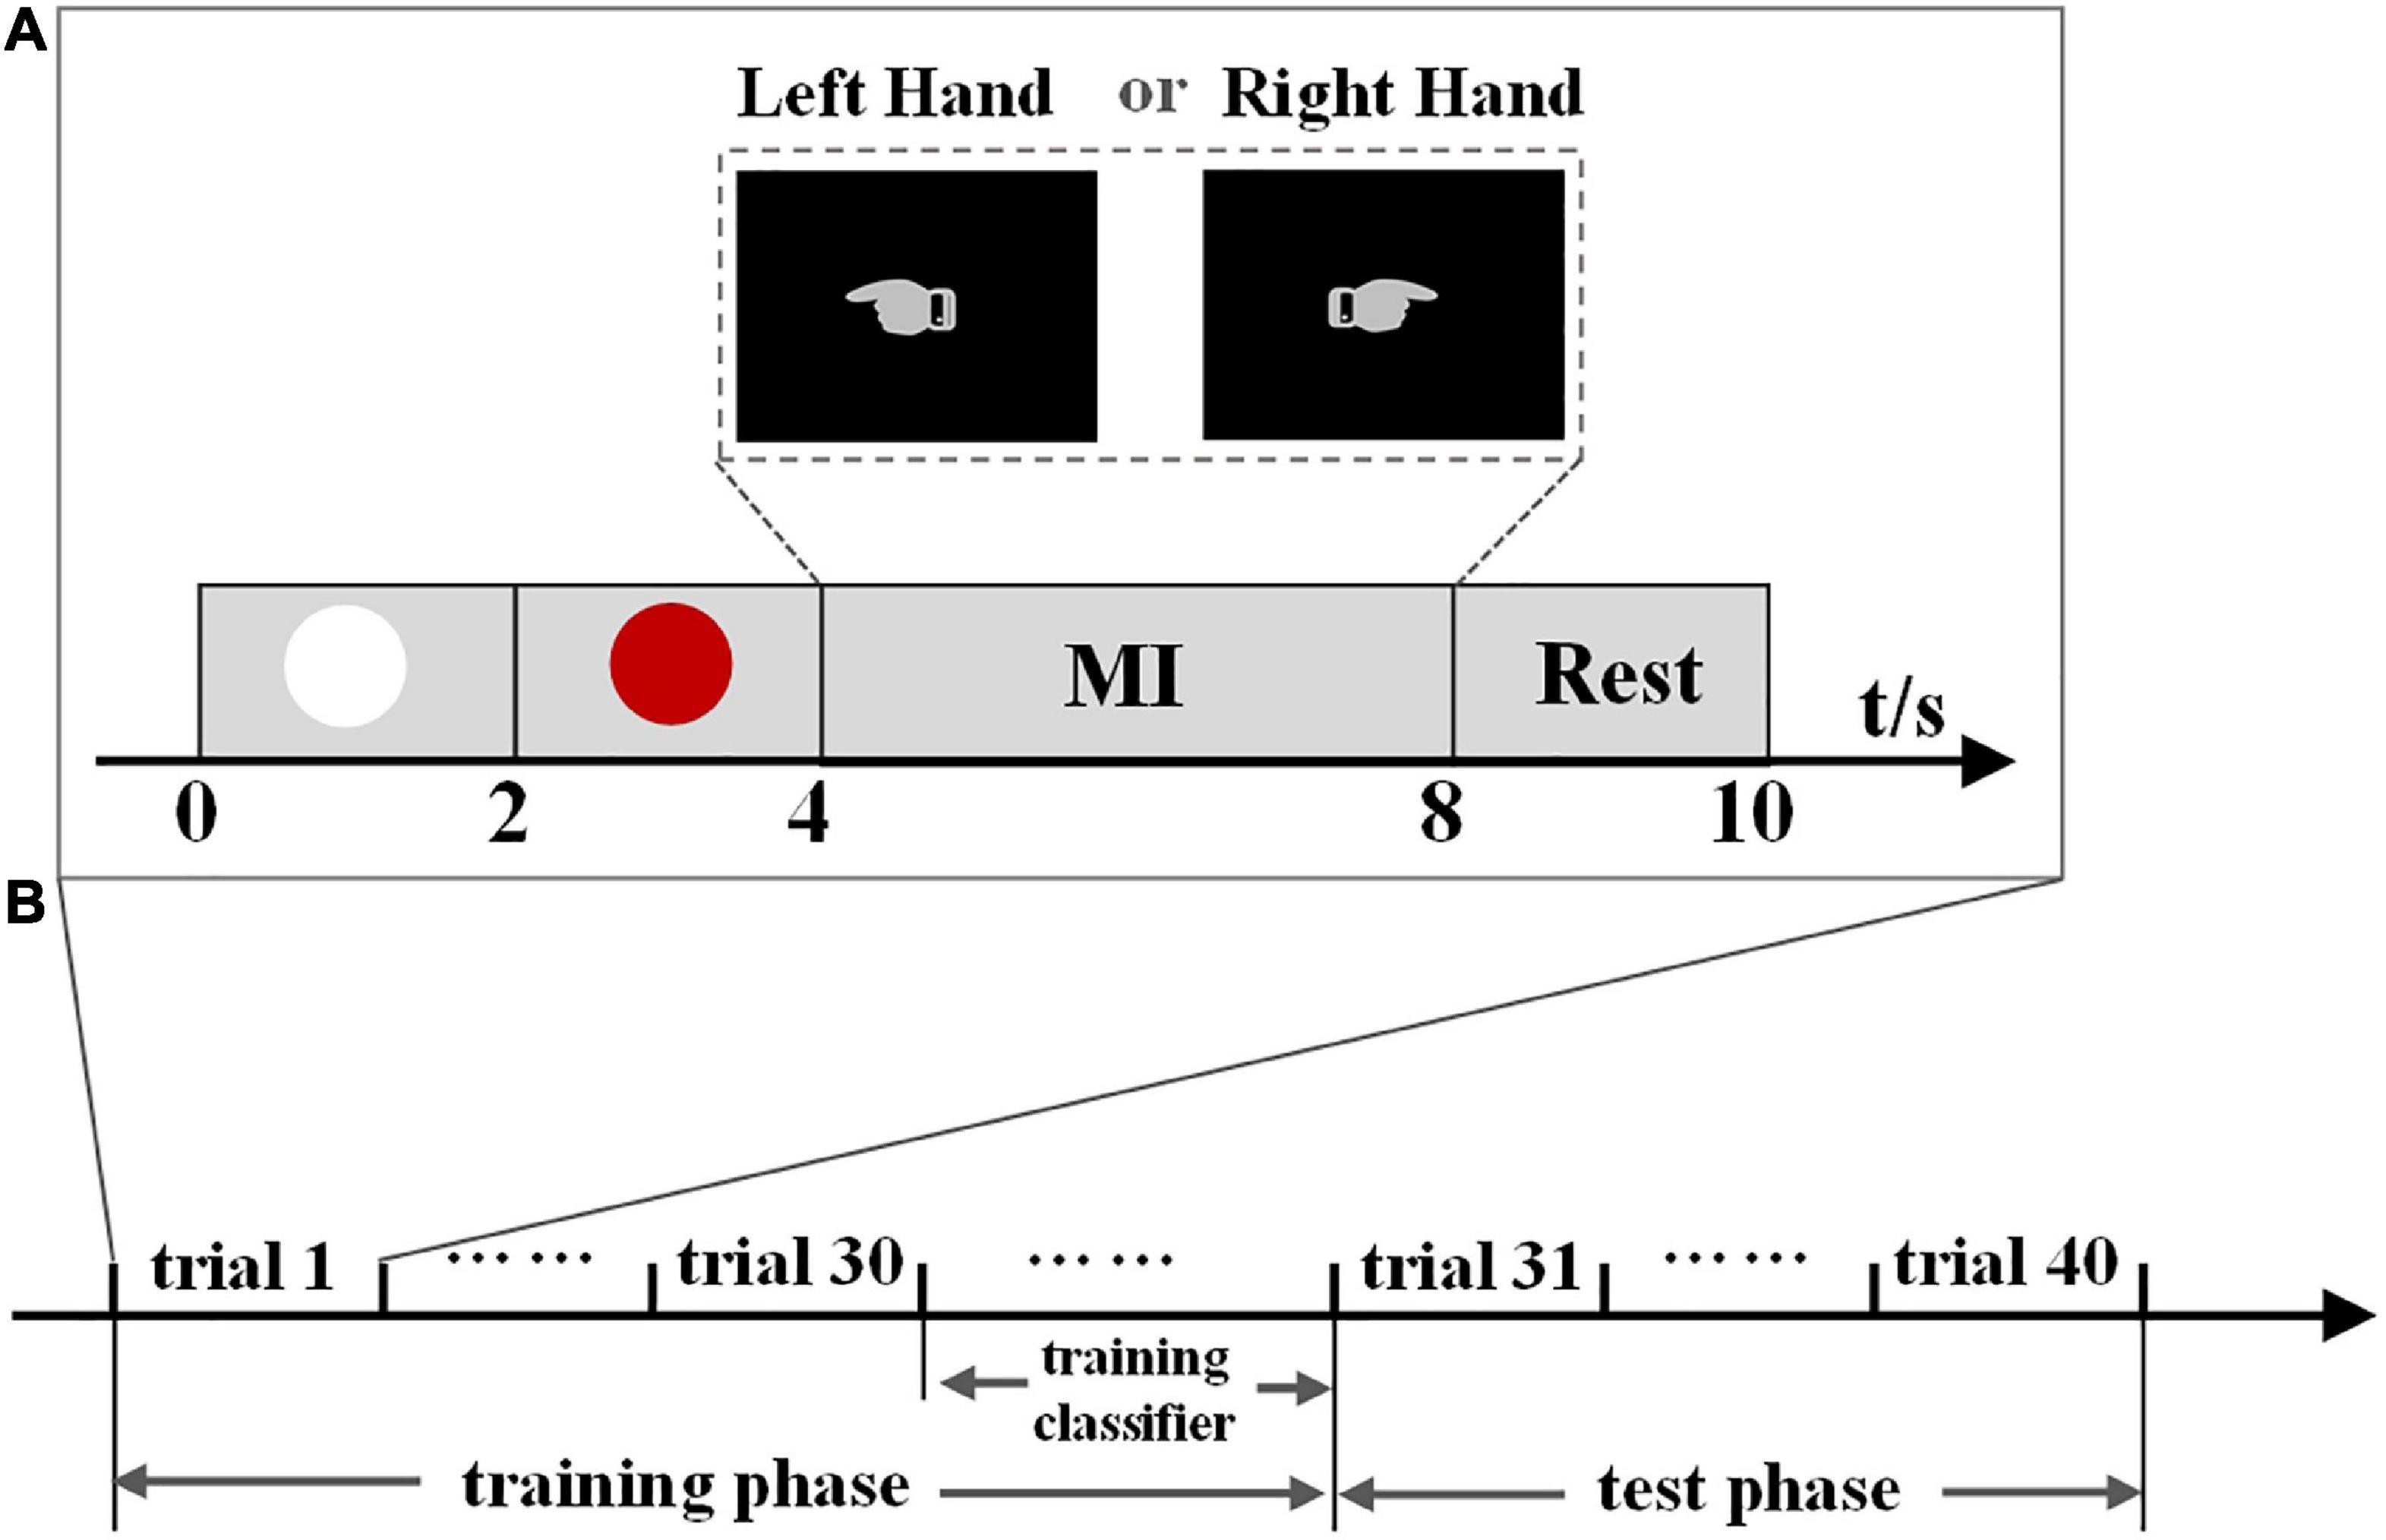
Figure 1. (A) Timing of a trial paradigm of experiment one and experiment two. A white circle is displayed for 2 s at the beginning, then a red circle appears 2 s later, reminding the subject to be prepared for an experiment task. From the 4 to 8 s, the subject performs the MI task. A hand pointing to the left indicates the left-hand MI task and pointing to the right indicates the right-hand MI task. In the test phase of experiment two, subjects were informed of the output after each MI task. Finally, the subject is asked to keep a resting state for 2 s. (B) Experiment phases of experiment two. We use the proposed methods to train a classifier in the training phase, then evaluate its performance in the test phase.
2.1.2. Dataset IVa of BCI competition III
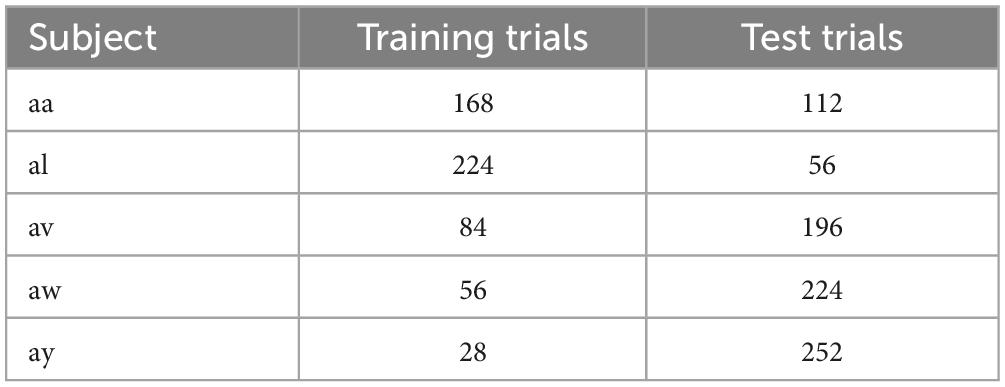
The Dataset IVa of BCI Competition III was recorded from five healthy subjects. This dataset contains two MI tasks, i.e., the right-hand and right-foot movements. The data were captured by a BrainAmp amplifier system with a 128-channel Ag/AgCl electrode cap, and 118 EEG channels were measured at positions of the extended international 10/20-system. The data were sampled at 1,000 Hz and then band-pass filtered between 0.05 and 200 Hz. There were 280 trials for each subject, namely 140 trials for each task. Table 1 shows the number of trials for training and test data for the five subjects. In each trial, a visual cue was shown for 3.5 s, and the subjects performed the MI task. The presentation of target clues was intermitted by periods of random length from 1.75 to 2.25 s so that the subjects could take a short break. In this dataset, the training and test sets consisted of different sizes for each subject.
2.1.3. Online evaluation
The most effective BCI research usually incorporates offline and online evaluations (Wolpaw and Wolpaw, 2012). We performed the experiment two to evaluate the performance of the proposed algorithm in the online operation. Ten right-handed and healthy subjects (four males and six females, aged 22–32) participated in the experiment. Four subjects had no prior experience with MI-based BCIs. All the subjects signed a consent form in advance. The purpose and procedure of the experiment were clearly explained to each subject before the EEG recording. The study was approved by the ethical committee of Tianjin University.
Figure 1A shows the timing of a trial paradigm, which is the same as experiment one. A hand pointing to the left indicates the left-hand MI task, and pointing to the right indicates the right-hand MI task. During the experiment, subjects were seated in a chair about 1 m from a monitor that displayed the task cues on a black background. The subjects were required to perform left- and right-hand MI tasks. Experiment two consisted of training and test phases (Figure 1B), containing forty trials. The training phase contained 30 trials (15 for each hand) used as the training dataset to generate individual classification parameters. The data in the test phase, containing five trials for each hand, was used as the test dataset to evaluate the performance of the proposed method. The BCI system operated in real-time in experiment two. In the test phase, subjects were informed of the output after each MI task so that they could adjust their brain signals to ensure that the correct intent could be continuously accomplished in the following MI tasks. The sequence of cues for different tasks was presented randomly in the training and test phases. An electrode placed on the vertex served as the reference, and the ground electrode was placed on the forehead. The EEG data were acquired by a Neuroscan SynAmps2 system with a 64-channel quick-cap using the international 10–20 system, and data were sampled at 1,000 Hz.
2.2. Preprocessing
First, the EEG data were subjected to a band-pass FIR filter to remove slow signal drifts and high-frequency noise and down-sampled to 100 Hz. Then, the data were processed by the common average reference (CAR) and extracted to form an epoch. Finally, we divided each dataset into training, calibration and test data.
For the datasets from experiment one and experiment two, the EEG data were band-pass filtered from 8 to 32 Hz. The data between 0.5 and 3.0 s, with respect to cue onset, were extracted for classification. For Dataset IVa, we filtered the data from 7 to 30 Hz and extracted the data between 0.5 and 2.5 s with respect to cue onset for classification. For evaluating the performance of the proposed algorithm, we used a 10-fold cross-validation method for the dataset of experiment one and a 5-fold cross-validation method for Dataset IVa. For experiment one, eight-tenths of the data were used as training data and the remaining two-tenths were divided equally as calibration and test data. For Dataset IVa, three-fifths of the data were used as training data, one-fifths as calibration data and the remaining one-fifths as test data. We used a 10-fold cross-validation method for the training classifier in the training phase of experiment two. Nine-tenths of the data from the training phase were used as training data and the remaining data were used as calibration data. The data from the test phase were used as test data.
2.3. CSP filtering
We performed spatial filtering using the CSP on the preprocessed data. The CSP filter W can be obtained using the training data of two classes. The EEG data can be presented as a matrix , where i denotes the i-th trial, n (i.e., 1,2) denotes each of the two MI tasks, N is the number of channels, and T is the number of samples per channel. The CSP method can be summarized using the following steps.
Firstly, the data were decentered as follows:
where n = 1,2 and is the average over the trials of each group.
Secondly, we calculated the normalized spatial covariance of , which can be obtained from:
where (⋅)’ denotes the transpose operator, trace(X) is the sum of the diagonal elements of X and denotes the average spatial covariance of all trials for class n. The composite spatial covariance is given as:
where the subscript c is short for composite. Thirdly, we calculated the whitening transformation matrix. The process of eigenvalue decomposition on Cc is shown below:
where Vc is the matrix of eigenvectors and Dc is the diagonal matrix of eigenvalues sorted in descending order, and the whitening transformation matrix is presented as:
Fourthly, we performed a whitening transformation:
then S1 and S2 share the same eigenvectors, and they can be factored as:
where B is the matrix of eigenvectors and Λn (n = 1,2) is the diagonal matrix of eigenvalues, which are sorted in descending order. The eigenvectors with the largest eigenvalues for S1 had the smallest eigenvalues for S2 and vice versa. The spatial filter can be expressed as:
Finally, with the spatial filter W, the original EEG can be transformed into uncorrelated components:
where i denotes the i-th trial. For each of the two imagery movements, the variances of only a few signals that correspond to the first and last M eigenvalues are most suitable for discrimination. Hence, after spatial filtering, we got the data Zi ∈ R2M=T. We selected the first and last four eigenvectors of the W for feature extraction, i.e., the M was set to 4 in this paper. The CSP features are calculated as:
where Z denotes the transformed data in Equation 9, and the log transformation, i.e., the log(⋅) in Equation 10, approximates the normal distribution of the data. We finally get 2M features for one trial, forming a feature vector yc.
2.4. Data transformation and concatenation
After CSP spatial filtering (Equation 9), we transferred the data Zi to the time-frequency domain with Morlet wavelet to present more discriminative information. The time-frequency transferred data can be presented as a matrix Gi∈R2M × J × T, where J denotes the number of frequency points. Then we concatenated the transferred data in the time dimension, i.e., the data Gi was reconstituted to a matrix Hi ∈ RJ×Tw, where Tw = T × 2M.
2.5. Feature extraction and pattern classification
In this section, we first extracted tCSP features from the concatenated data Hi at all frequency points. Then we selected the optimal frequency point for classification by the calibration procedure, which was a process of data-dimension reduction to remove redundant frequency information for each subject. Furthermore, CSP features were extracted and combined with tCSP features to further enhance the classification performance of BCI systems.
2.5.1. tCSP feature extraction
Transformed common spatial pattern feature consists of Pearson correlation coefficients ρ. To extract tCSP features, we first selected the data at frequency point j from the matrix Hi of training data, which can be presented as a vector Ki,j ∈ RTw. Then we calculated the templates according to:
where I denotes the number of training-data trials, i denotes the i-th trial, n denotes each of the two MI tasks, tr denotes the training data. Finally, we calculated tCSP features of all data according to:
where corr(⋅) is Pearson-correlation calculating, ρi,j denotes the tCSP features of the i-th trial at the frequency point j.
2.5.2. Fisher discriminant analysis
In this paper, fisher discriminant analysis (FDA) (Mika et al., 1999) was used for pattern classification. FDA is a classical classifier that maximizes the ratio between inter-class and intra-class variance. FDA classifier is mainly based on the decision function defined as follows:
where y is the feature vector obtained from the above steps, U is a weight vector, and ω0 is a threshold. The values of the weight vector and the threshold are identified by employing fisher’s criterion on the training data. The classification process is based on the separation by the hyperplane as described in the following:
where D1 and D2 are two different classes. In this study, the method of N-fold cross-validation was applied to evaluate the classification performance of the proposed method.
2.5.3. tCSP feature selection
We utilized the calibration data to find out the subject-specific optimal frequency points for classification. Concretely, the calibration features were used as the inputs of an FDA classifier, which was trained by training data, and then we got a classification accuracy matrix Q∈RA ×J, where A indicates the number of subjects, and J indicates the number of the frequency points. To get stable and reliable results, we applied 10-fold cross-validation to calculate the classification accuracy at each frequency point. We used a sparse matrix F∈RA ×P to select the optimal frequency point Fa as:
In the sparse matrix F, the elements where the highest classification accuracies occur in the calibration process were set to one for each subject, and the others were set to zero. Then the training and test features at Fa were extracted. Finally, we got a tCSP feature vector yt for each subject.
2.5.4. Feature combination
To further improve the performance of the MI-based BCI, we combined the selected tCSP features and CSP features, getting a fusion feature vector Y=[yt,yc]′, to provide more discriminative information for classification. The fusion features were used to evaluate the performance of the proposed method.
The main processes of the method are illustrated in Figure 2, and the pseudocode of tCSP is shown in the Appendix.
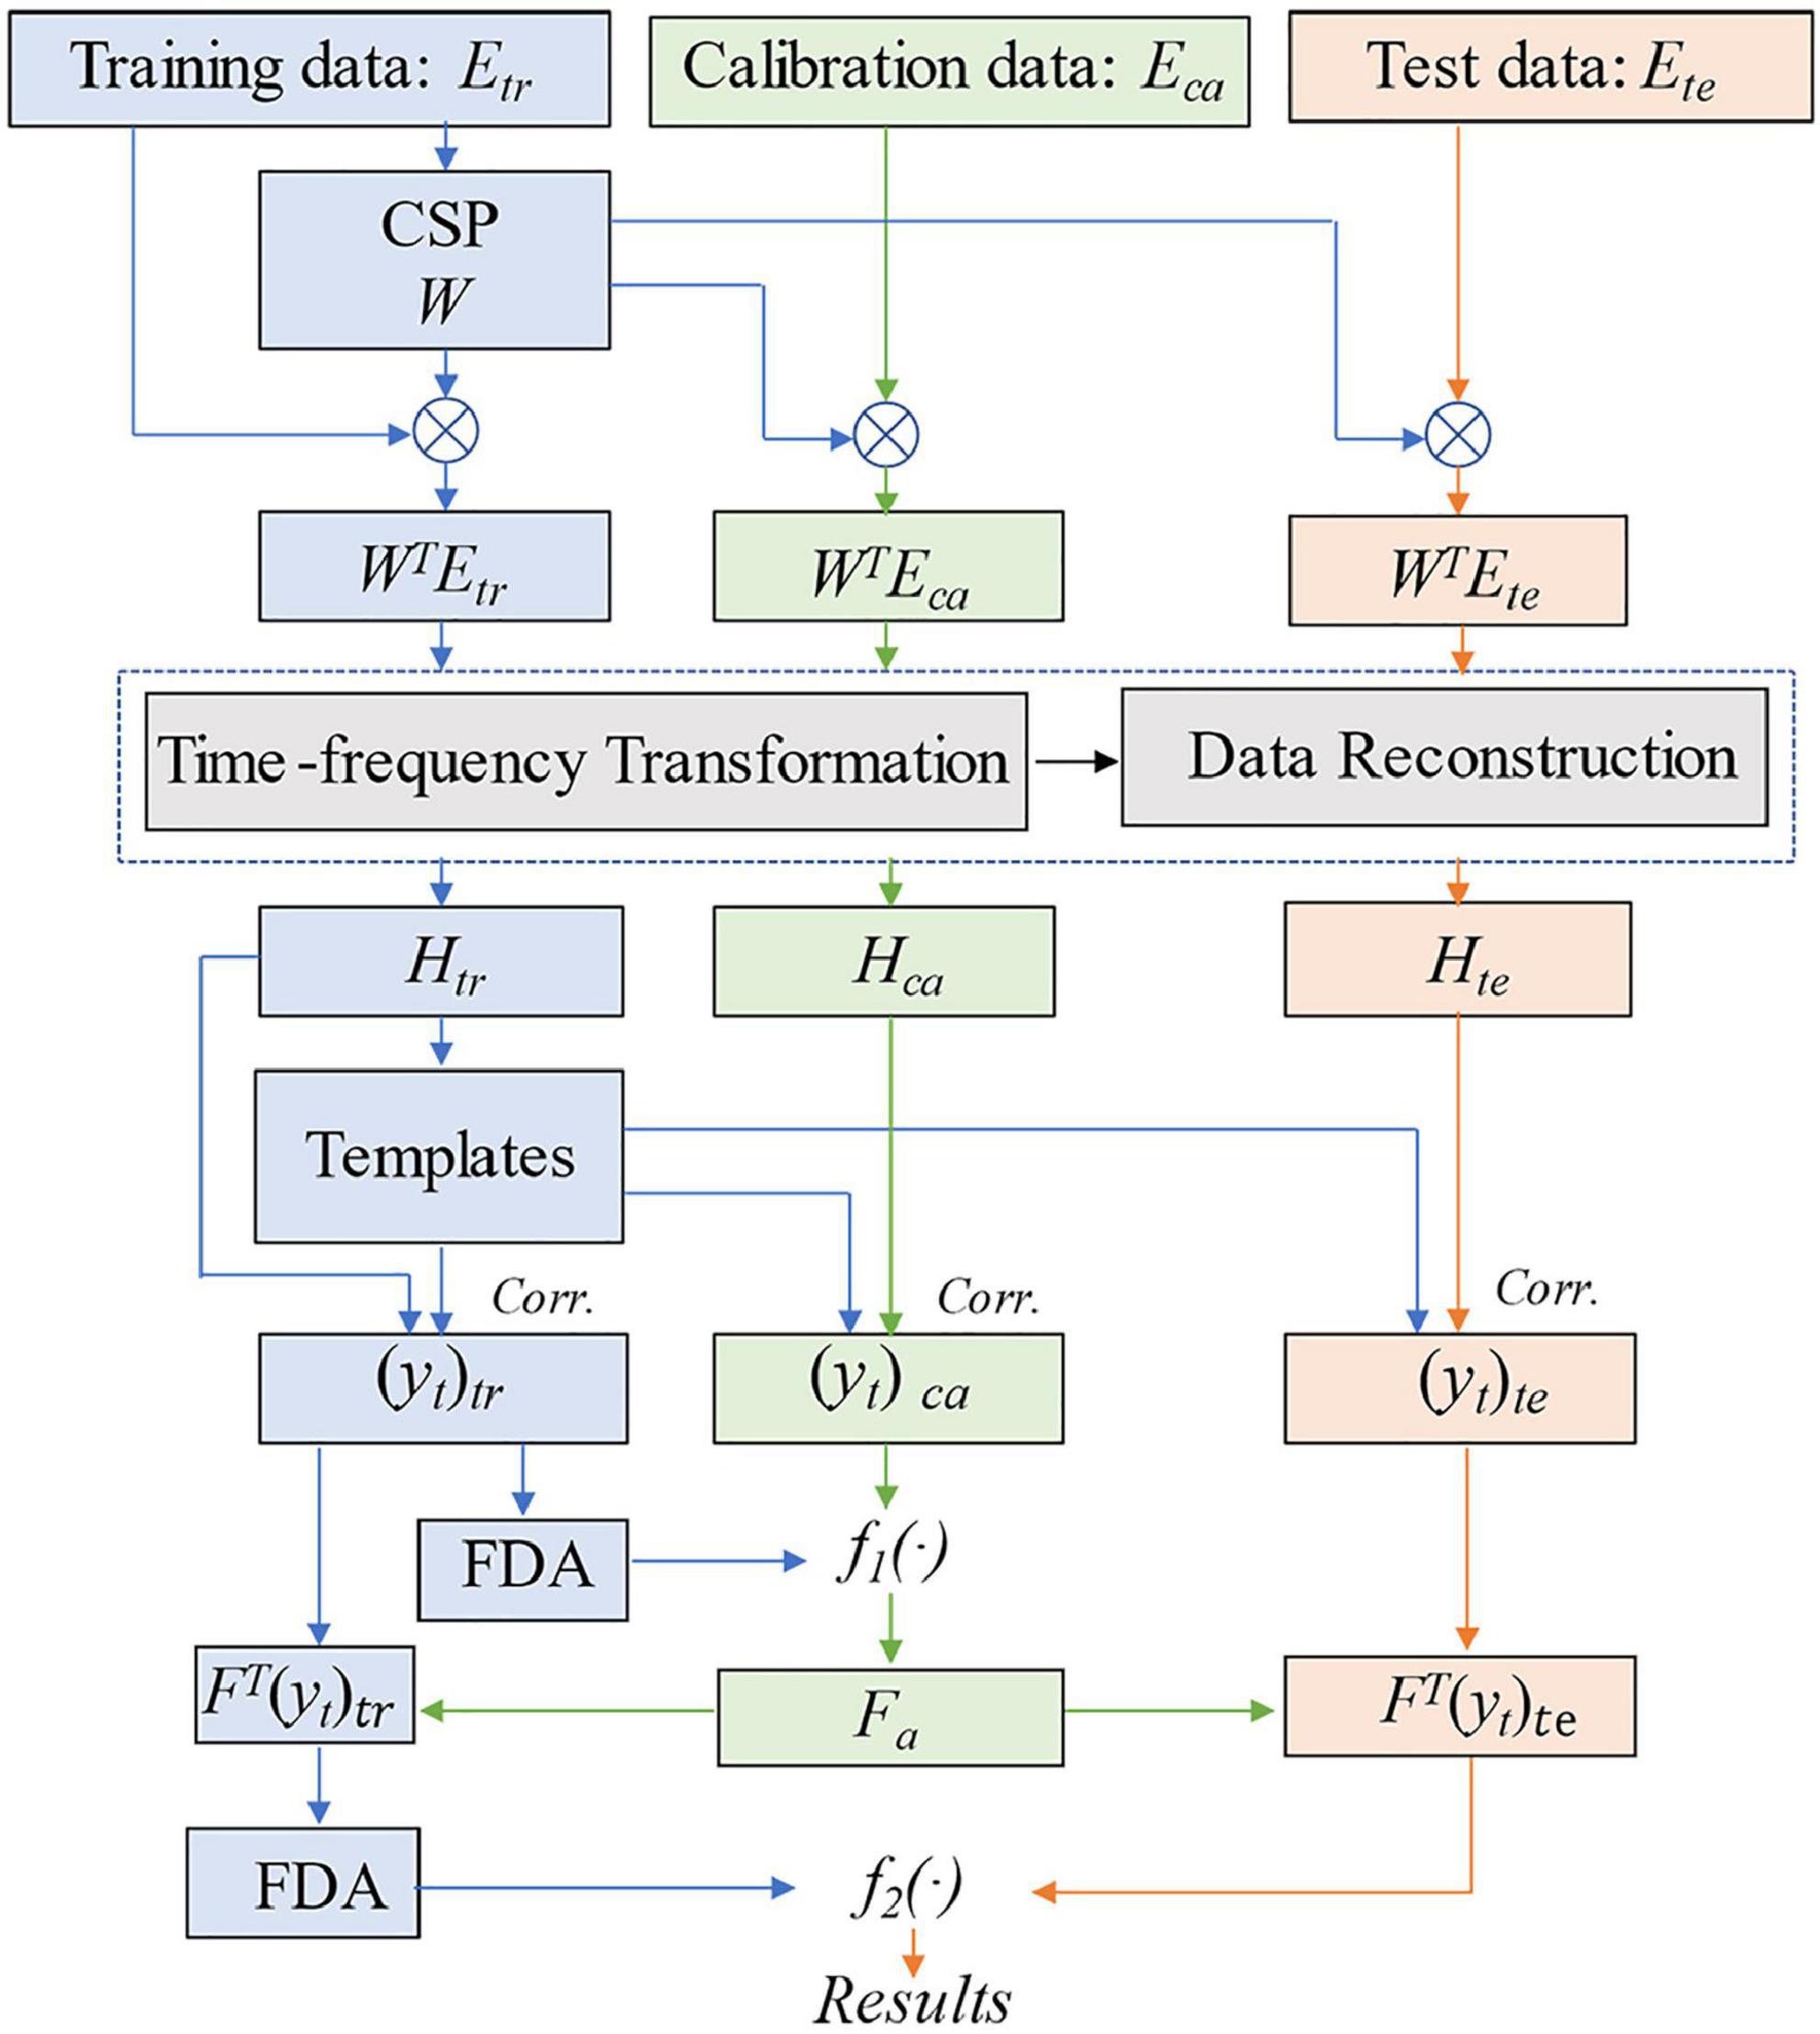
Figure 2. Flow chart of the proposed tCSP. tr indicates training data, ca indicates calibration data, te indicates test data, H indicates the concatenated time-frequency data, Corr. indicates Pearson correlation, yt indicates the tCSP feature, Fa indicates the optimal frequency point, f1(⋅) and f2(⋅) indicate decision functions.
3. Results
3.1. ERD patterns of left- and right-hand MI tasks
The mu (8–14 Hz) and beta (14–30 Hz) ERDs reflect the brain oscillation patterns induced by MI. Event-related spectral perturbation (ERSP) measures the mean dynamic changes from baseline in terms of the power spectrum over time in a broad frequency range (Makeig, 1993; Delorme and Makeig, 2004; Makeig et al., 2004). It can provide detailed information on ERD/ERS patterns. Hence, we first analyzed the ERD patterns between the frequency range of 8–32 Hz and the time range of −1 to 5 s for each MI task by ERSP. The baseline is the mean of the data ranging from −1s to 0 s. The average ERSP values of electrodes C3 and C4 are compared for the left- and right-hand MI tasks.
Figure 3A presents the averaged time-frequency maps of C3 and C4 across all the subjects of experiment one. The EEG power decreased after the zero-time point when the subjects performed the MI tasks, especially in the frequency range of 8–14 Hz, which refers to ERD. In addition, the phenomenon of contralateral dominance is distinctly observed in Figure 3A. The ERD of the mu band (8–14 Hz) is more significant at C4 than C3 for the left-hand MI task. On the contrary, the right-hand MI task induces lower ERD at C3. However, not all the subjects show distinguishable ERD patterns, such as the time-frequency patterns of subject 4 in Figure 3B.

Figure 3. Time-frequency maps on C3 and C4 channels of experiment one. Left indicates the left-hand MI task, and right indicates the right-hand MI task. Blue indicates the ERD, red indicates the ERS, and black dashed lines indicate the task onset. (A) Time-frequency maps averaged across trials of all subjects. The left-hand MI task induces a stronger mu-band ERD on C4 than on C3, and the right-hand MI task induces a stronger ERD on C3. (B) Time-frequency maps averaged across trials of subject S4, showing little ERD patterns when performing MI tasks.
3.2. tCSP feature extraction
After CSP filtering and time-frequency transformation, we obtained eight time-frequency data segments with a time window of 2.5 s. Figure 4A shows the concatenated time-frequency maps averaged across trials of subject S9. The four segments before 10 s correspond to the first four eigenvectors of CSP filter W, and the last four segments correspond to the last four eigenvectors of W. The frequency ranges from 8 to 32 Hz. We can observe the spectral power increase in the mu band induced by the left- and right-hand MI tasks. Figure 4B shows waveforms of the templates at the optimal frequency point of subject S9. The templates are calculated according to Equation 10. The templates show a distinct discriminative ability for the left- and right-hand MI tasks.

Figure 4. (A) Concatenated time-frequency maps averaged across trials of subject S9. After CSP filtering, we obtain eight channels’ data with a time window of 2.5 s. We transform the CSP-filtered data into the time-frequency domain and get eight time-frequency data segments. Then we concatenate the eight time-frequency data segments, forming the concatenated time-frequency data of 20 s. (B) Waveforms of the templates at the optimal frequency point (11.87 Hz) of subject S9. After data concatenation, the optimal frequency points for classification are selected through the method of section “2.5.3. tCSP feature selection”. The templates are calculated using training concatenated time-frequency data at the optimal frequency point.
We also visualized the features to understand the proposed method’s effect further. Figure 5 displays the feature distribution maps transformed by t-SNE (Van der Maaten and Hinton, 2008) for subjects S2, S6, and S9 from experiment one. The features were extracted by CSP, FBCSP, and tCSP with 40 training samples (Figure 5A) and 8 training samples (Figure 5B) for each subject. The tCSP features of different MI tasks are more diverse than those of CSP and FBCSP. The two tasks could be better separated with more training samples for all methods.
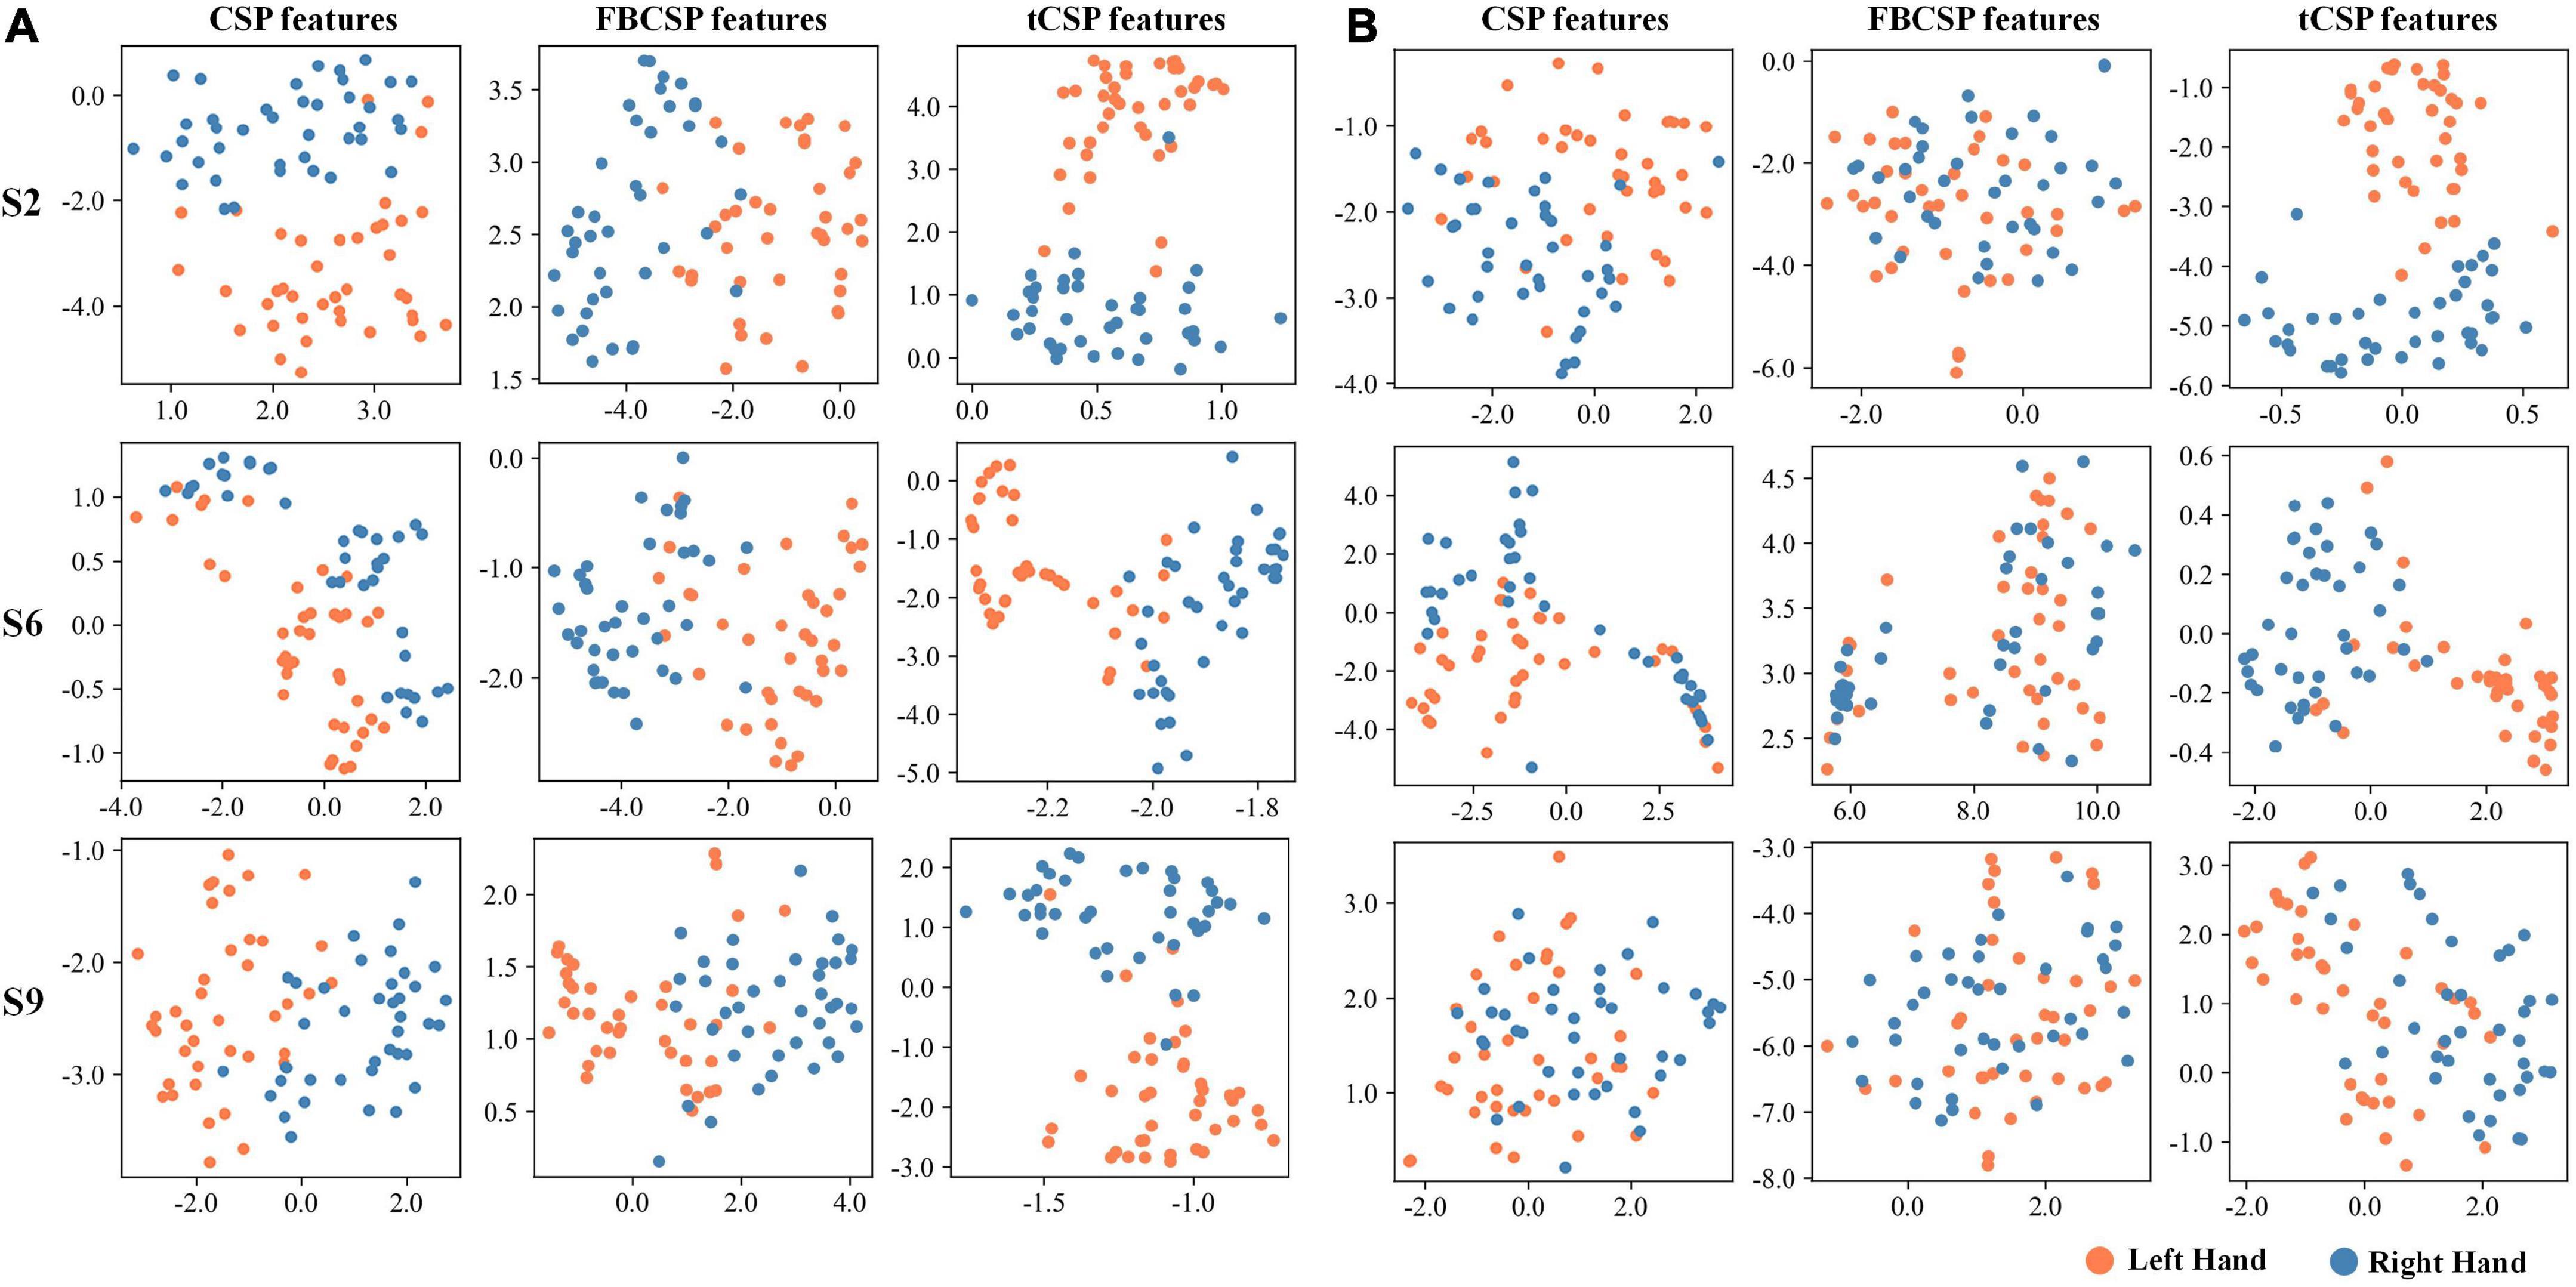
Figure 5. Feature visualization of different methods using t-SNE. Orange dots indicate samples of left-hand MI tasks, blue dots indicate right-hand MI tasks. The training processes used 40 samples (A) and eight (B).
3.3. Optimal frequency points selection
We transferred the data ranging from 8 to 32 Hz to the time-frequency domain with a step of about 0.8 Hz, generating 32 frequency points for each subject. In the calibration process, we first calculated the classification accuracies of all frequency points for each subject using the calibration data with a 10-fold cross-validation approach. Figure 6 shows the classification performance for all subjects of experiment one. The darker red color denotes higher classification accuracy. Then we selected the frequency points with the highest classification accuracy as the optimal frequency points Fa for each subject. Finally, we tested the performance of the proposed methods using the test data at Fa. Figure 6 shows that most optimal frequency points are distributed in the mu and beta bands with individual variation.
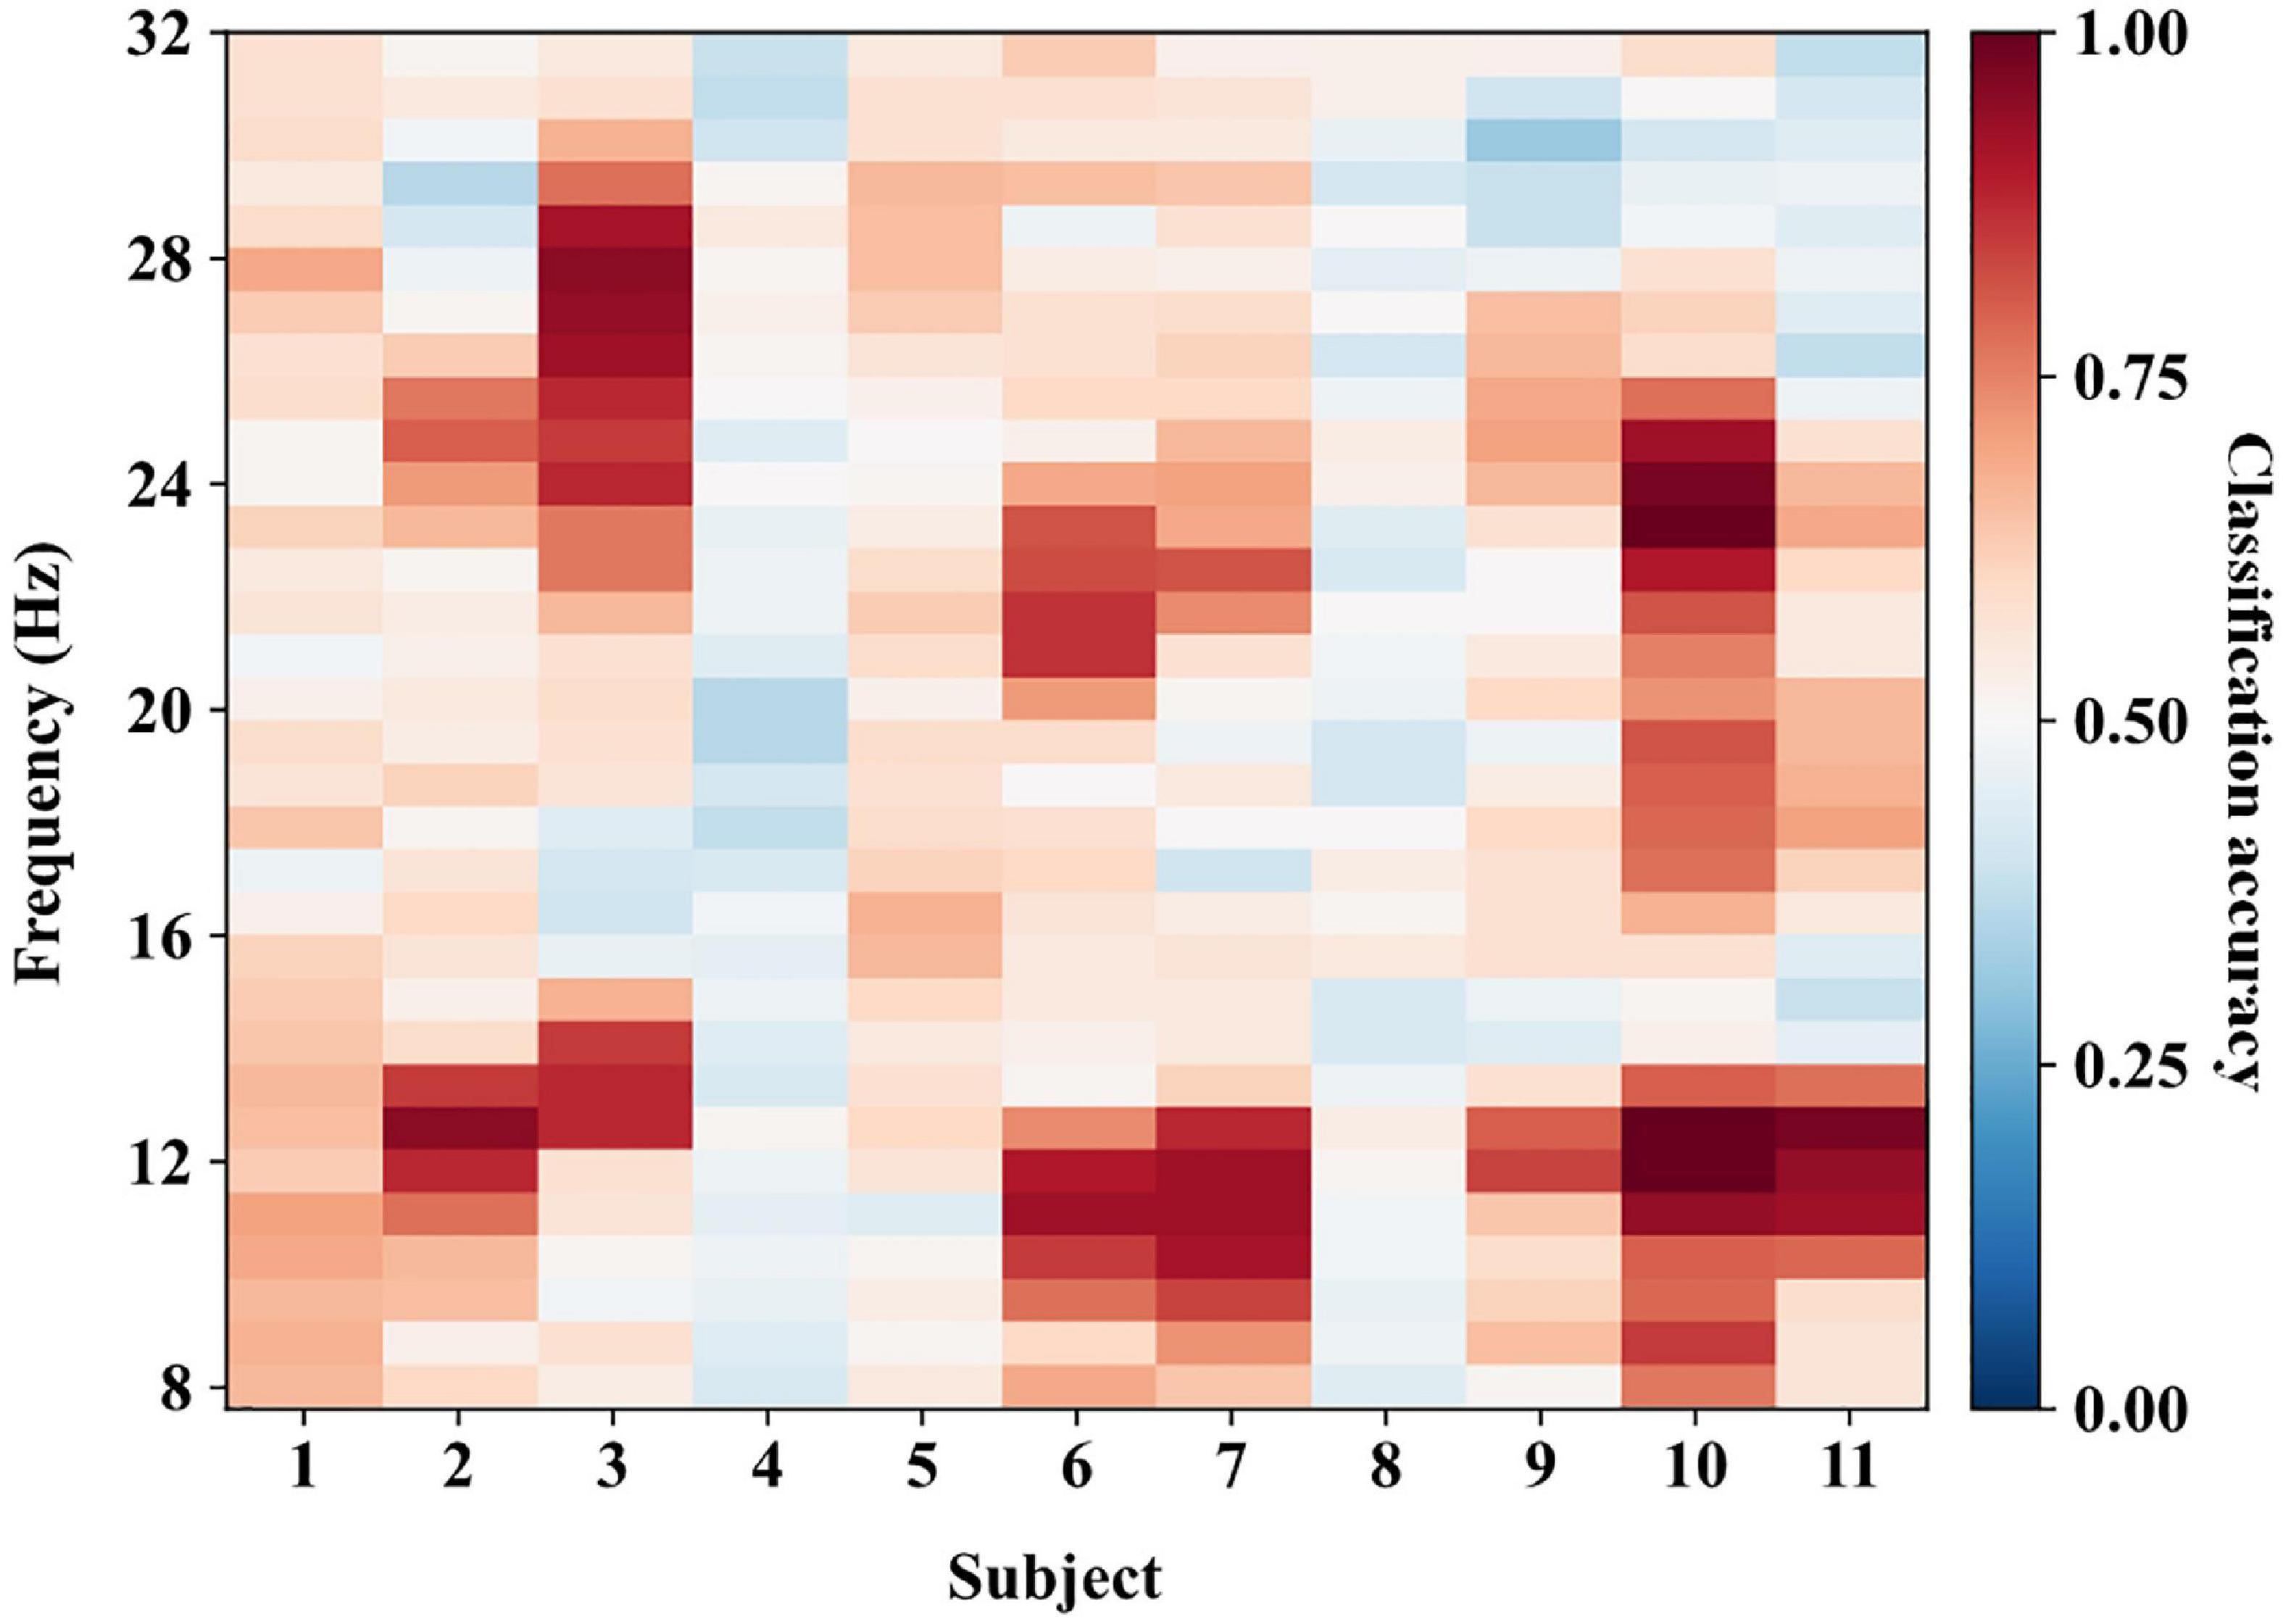
Figure 6. The classification performance in the calibration process of experiment one. We calculated the classification accuracies using calibration data at all frequency points. The frequency points with the highest classification accuracy are selected as the optimal frequency points for each subject.
3.4. Classification performance of experiment one
Table 2 summarizes the classification accuracies of CSP, FBCSP, tCSP, and the combination methods. All the methods shared the same parameters, such as the frequency band and time window for feature extraction. To get reliable experimental results, we used a 10-fold cross-validation approach. The highest classification accuracy was highlighted in bold for each row in the table. One-way repeated measures ANOVAs were employed to indicate whether the accuracy differences among methods reached the statistical significance level.
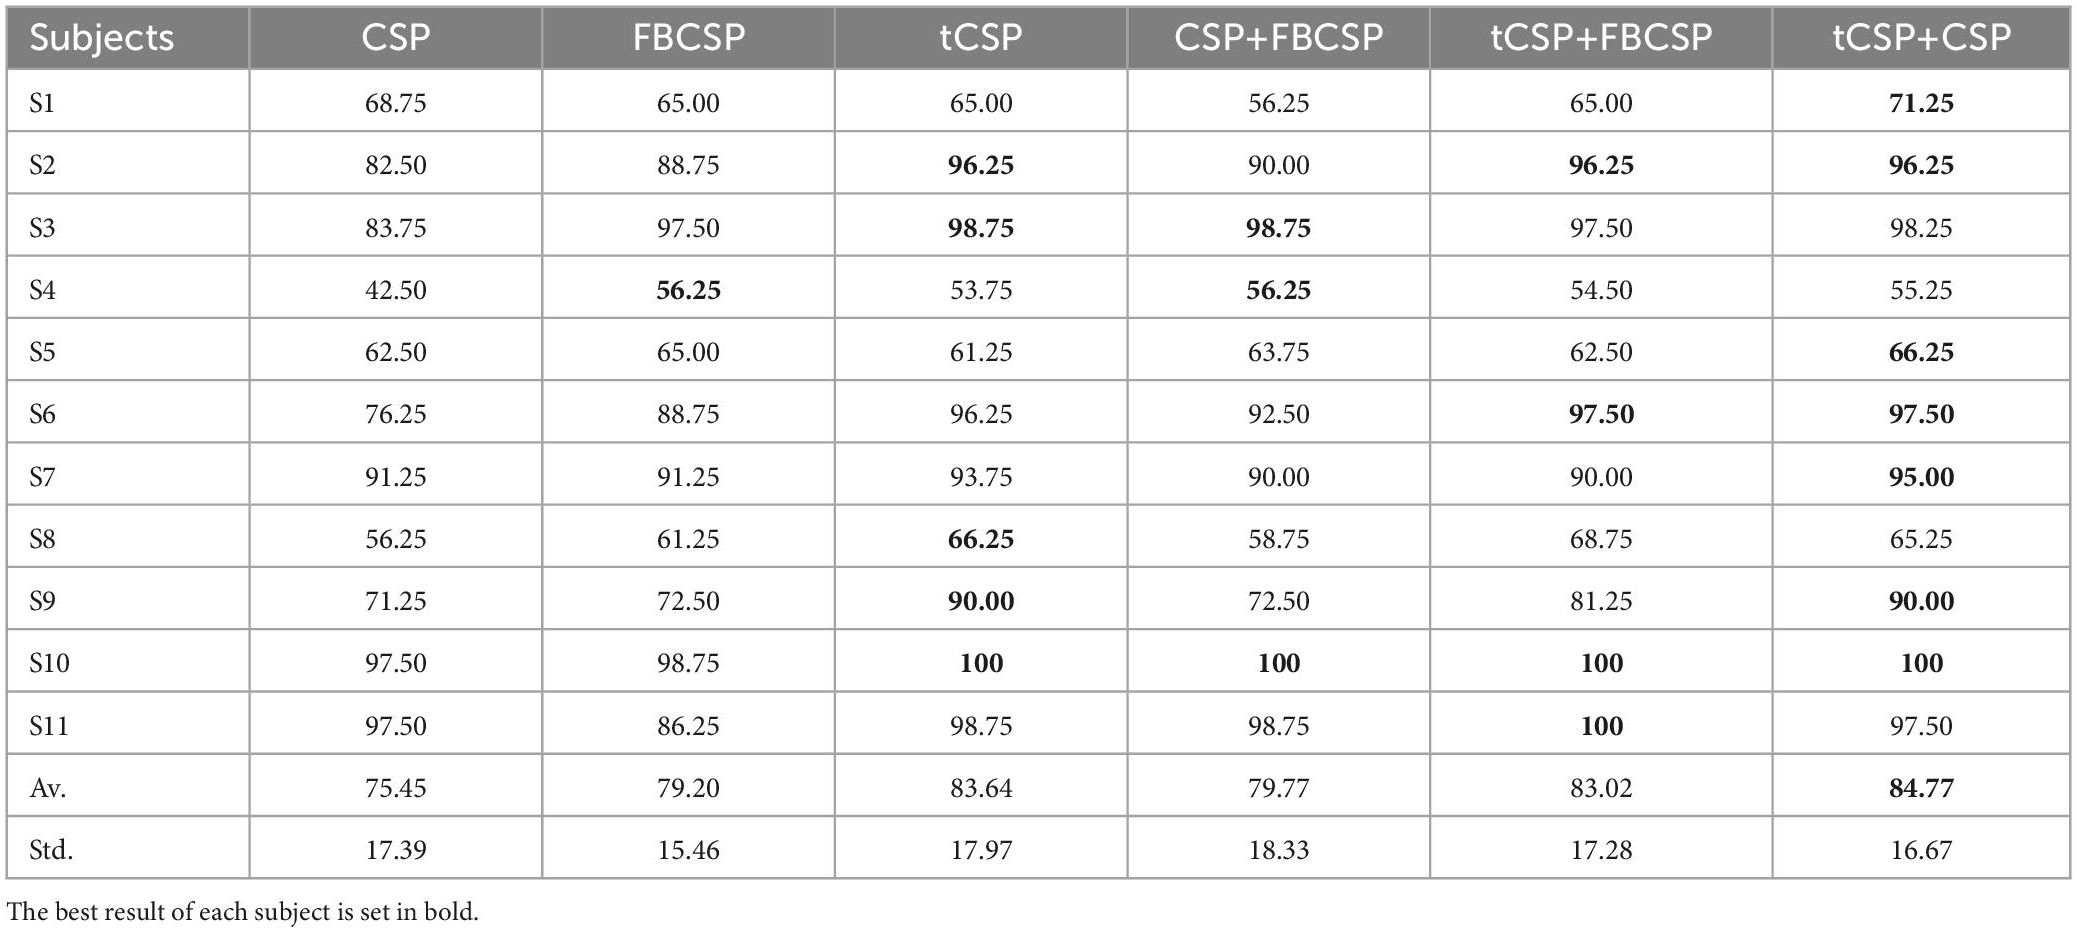
Table 2. The classification accuracies (%) of all subjects from experiment one using CSP, FBCSP, tCSP and the combination method.
Mauchly’s test indicated that the assumption of sphericity was violated. Hence, Correction was done using the Greenhouse–Geisser criterion. The results revealed that the accuracy differences were significant for all the methods [F(2.84, 28.37) = 7.06, p < 0.01]). The tCSP method got an average accuracy of 83.64%, which was significantly better than that obtained by CSP (t10 = 3.28, p < 0.01) and FBCSP (t10 = 2.29, p < 0.05). The combination method of tCSP and CSP achieved an average accuracy of 84.77%, yielding statistically better performance than CSP (t10 = 4.24, p < 0.01), FBCSP (t10 = 3.38, p < 0.01), and CSP+FBCSP (t10 = 2.63, p < 0.05). The performance of tCSP+FBCSP was significantly better than CSP+FBCSP (t10 = 2.36, p < 0.05). At the same time, there was no significant difference between tCSP and the combination methods of tCSP+CSP and tCSP+FBCSP (p > 0.05).
Figure 7 shows the average classification accuracies across all subjects with the different number of training samples for all methods. The classification accuracies had a rising trend with the increase of training samples. It should be noted that tCSP achieved significantly better performance than CSP and FBCSP for all conditions. The tCSP+CSP method achieved the best performance when the number of training samples was between 24 and 56.
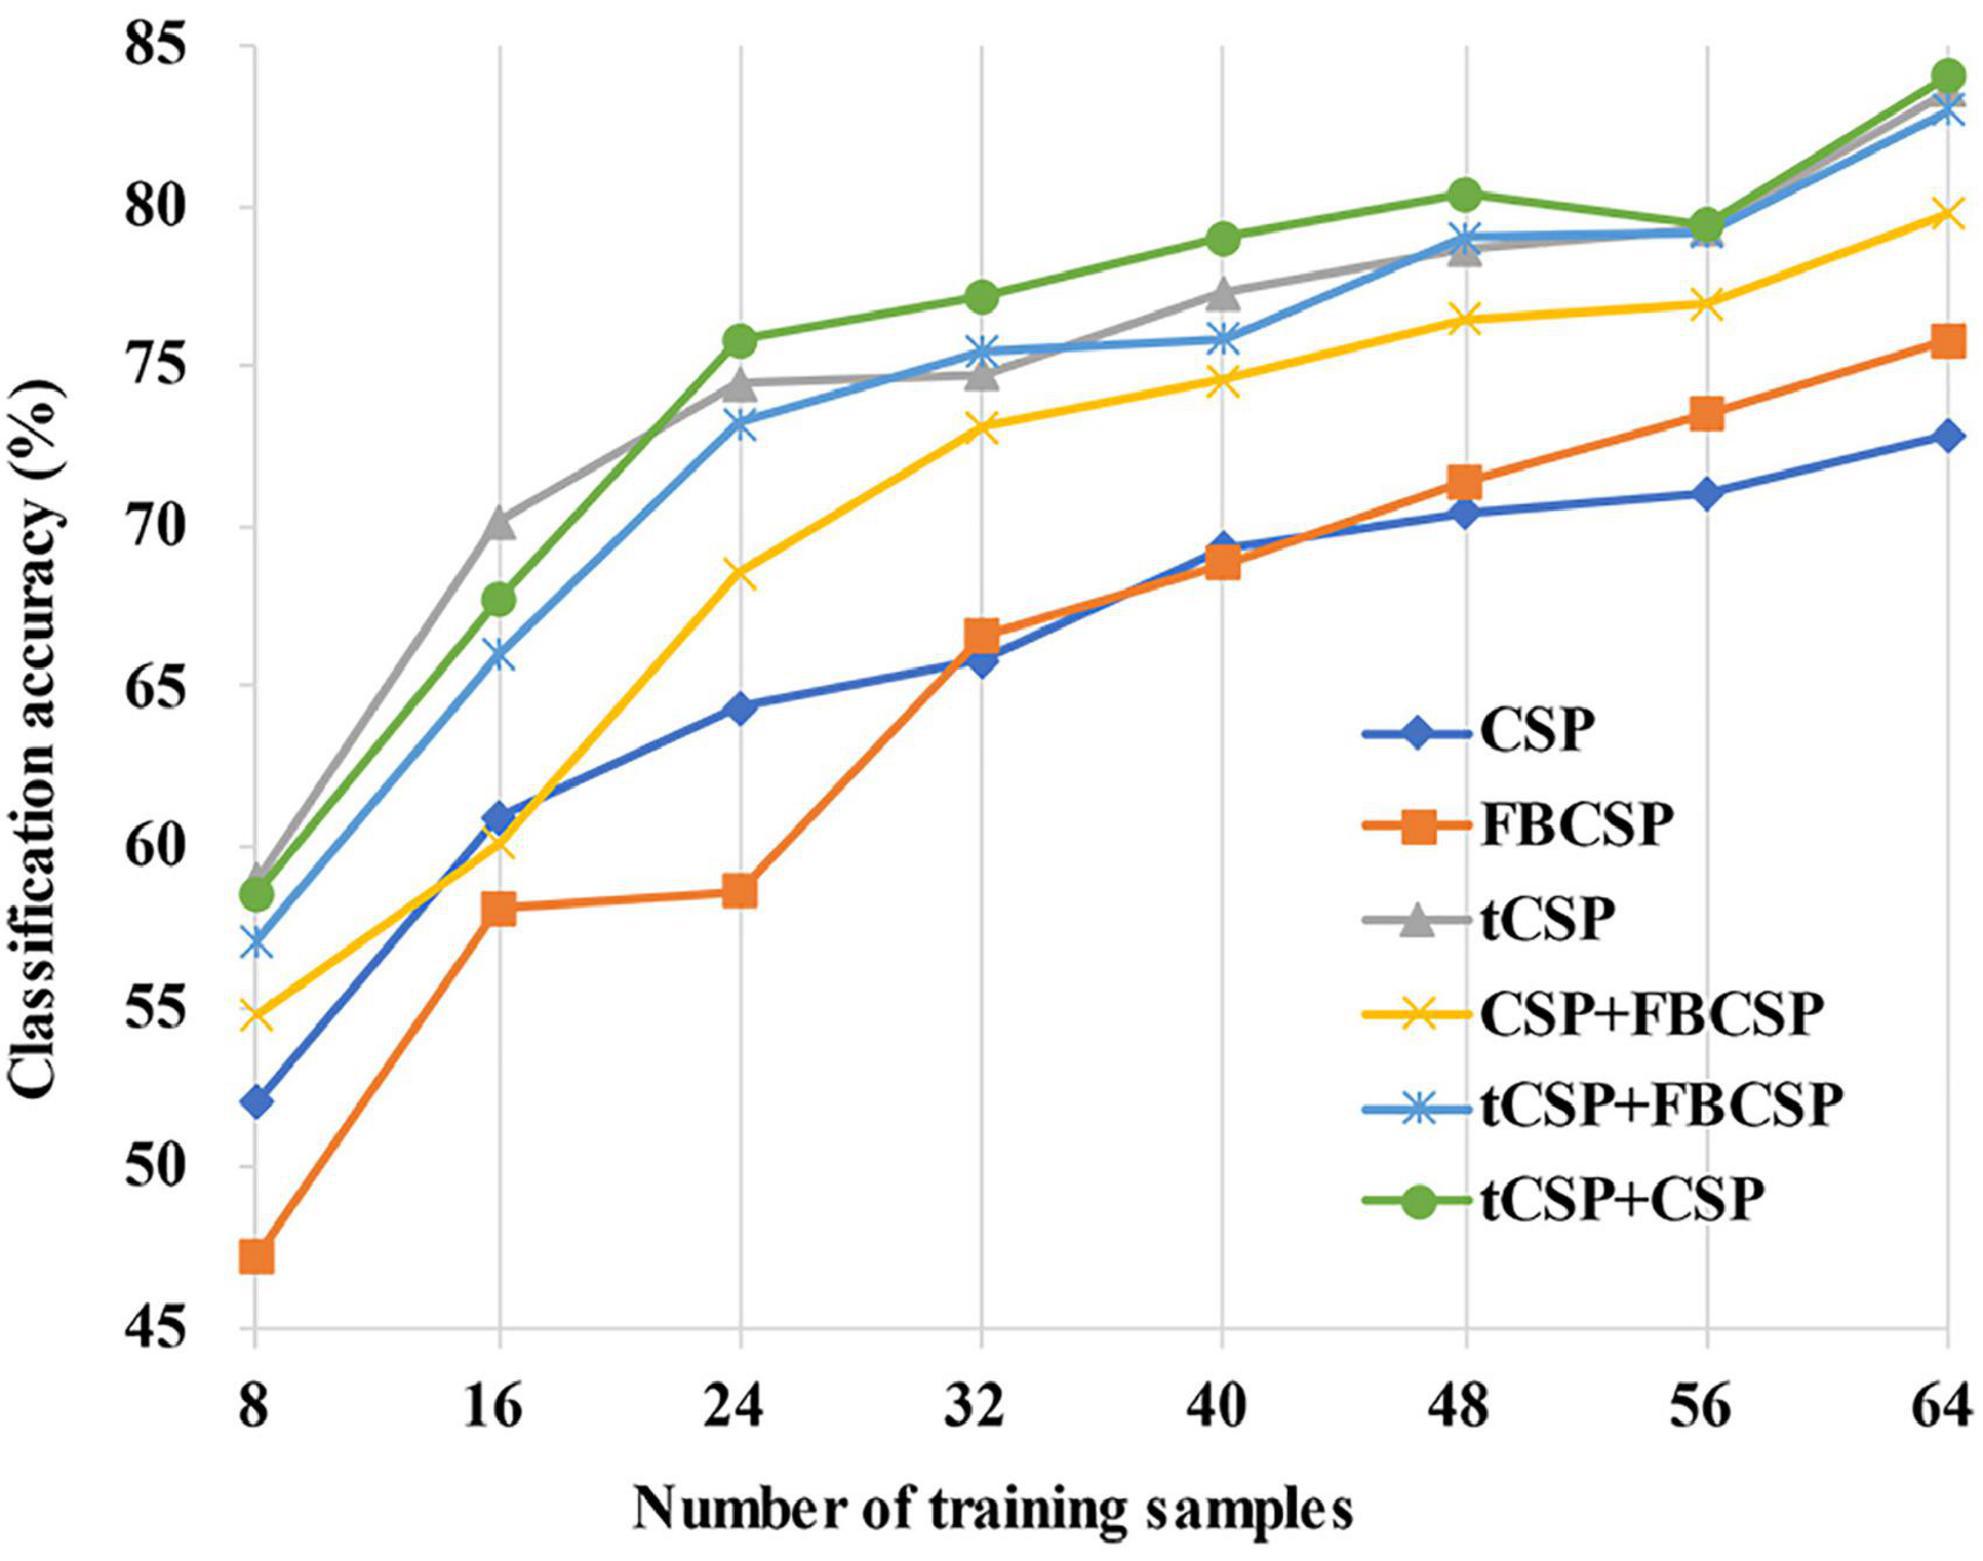
Figure 7. The variation trend of average classification accuracies with different training sample sizes. The classification accuracies rise with the increase of training samples for all methods. The proposed methods achieve better classification performance than the others, even in small-sample setting conditions.
3.5. Classification performance of dataset IVa
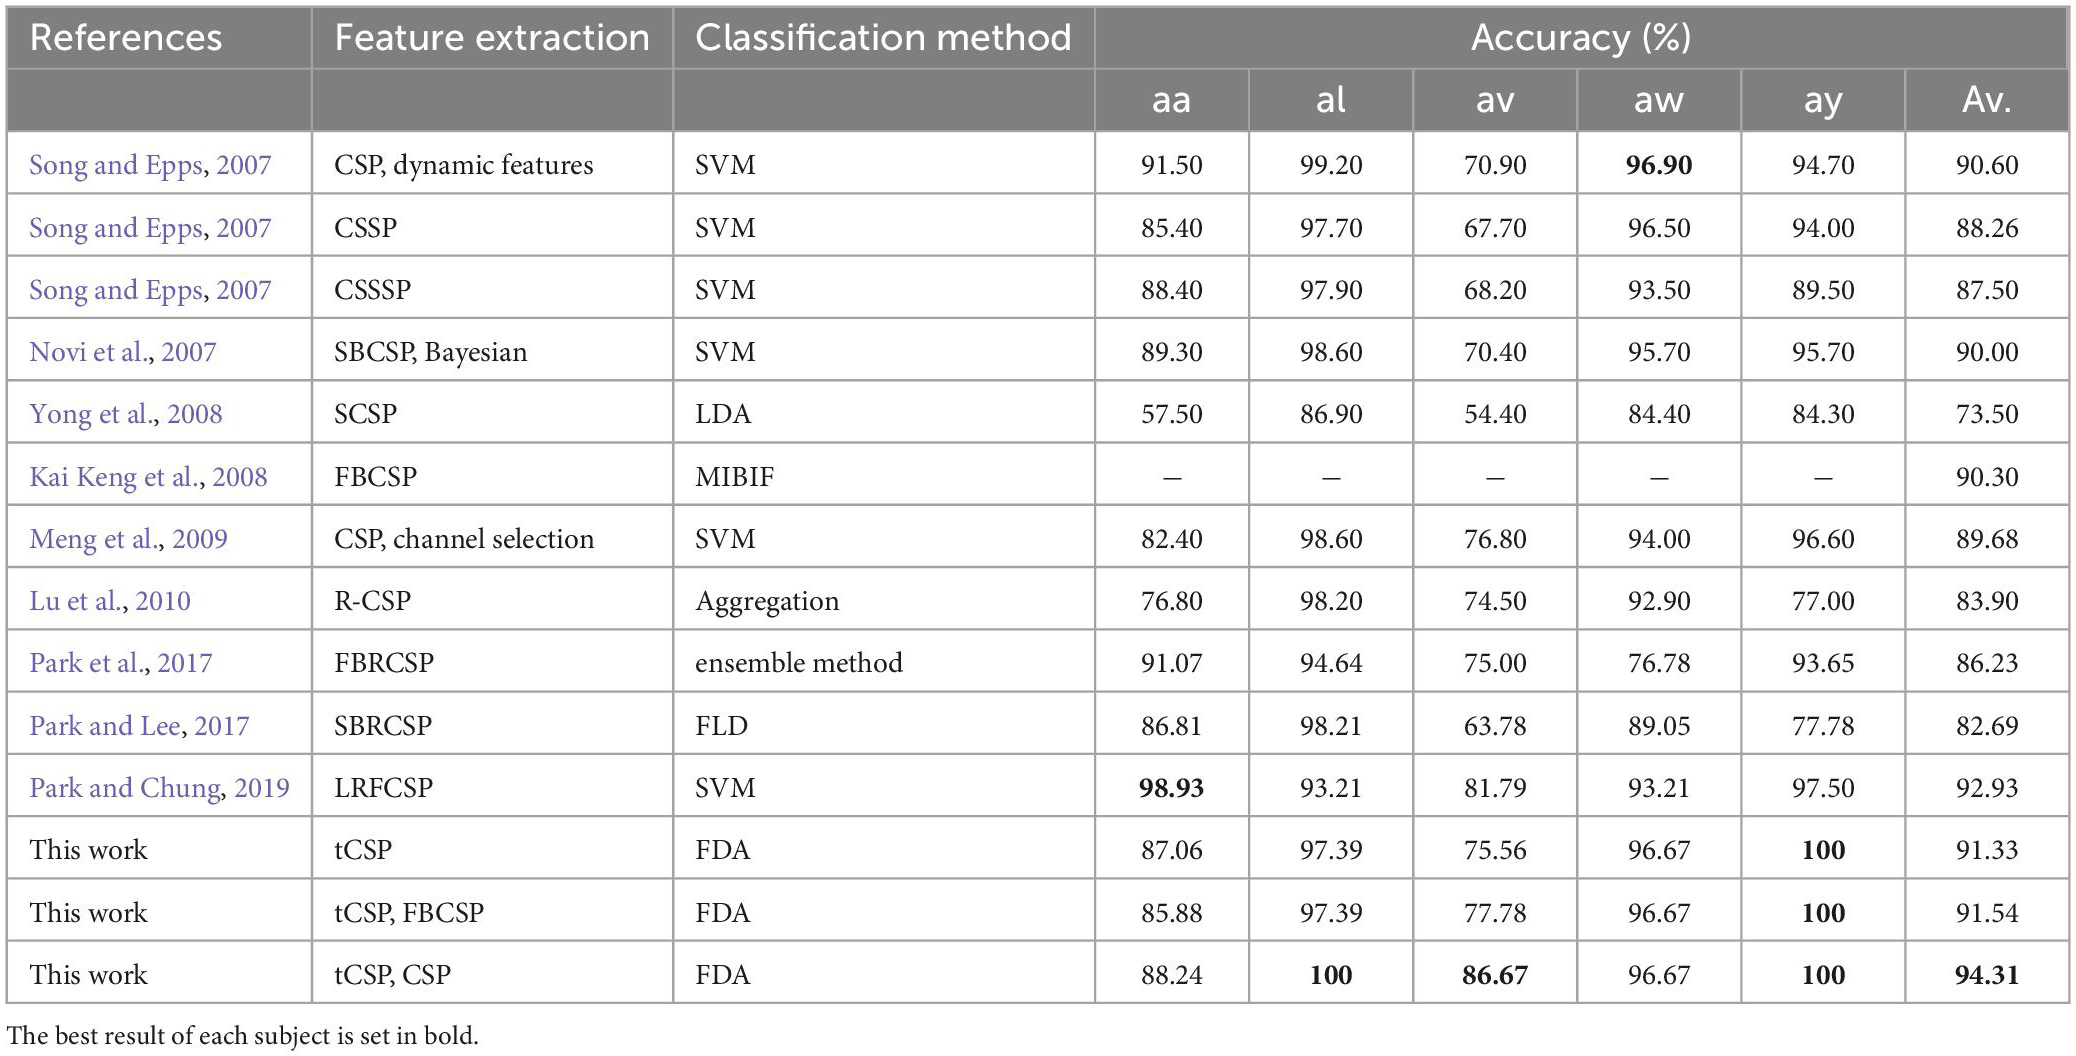
Table 3 compares the classification results of the proposed methods with some other CSP-based approaches. In this study, the raw data were bandpass filtered between 7 and 30 Hz. The data from 0.5 to 2.5 s after cue onset were selected for feature extraction and classification. A 5-fold cross-validation was applied to evaluate the classification performance of the proposed method. tCSP achieved an average classification accuracy of 91.33%, and the combination method of tCSP and CSP achieved an average classification accuracy of 94.31%, with two subjects achieving 100% accuracy, which obtained the highest average classification accuracy.
3.6. Results of the online evaluation
The classification parameters in experiment two, such as frequency ranges and the sampling rate, were selected in accordance with experiment one. Furthermore, we also performed the pseudo-online evaluation of CSP, FBCSP, CSP+FBCSP and tCSP+FBCSP using the same data collected from experiment two. Figure 8 shows the classification results of all subjects. The accuracy differences were significant for all the methods [F(5, 45) = 3.27, p < 0.05]. tCSP achieved an average accuracy of 80.00%, with two subjects getting an accuracy of 100%. The combination method of tCSP and CSP achieved an average accuracy of 84.00%, with three subjects getting an accuracy of 100%, which was significantly better than that obtained by CSP (t9 = 2.81, p < 0.05), FBCSP (t9 = 2.28, p < 0.05), CSP+FBCSP (t9 = 2.70, p < 0.05), and tCSP+FBCSP (t9 = 2.75, p < 0.05). There was no significant difference between the classification accuracies of tCSP and CSP or FBCSP (p > 0.05).
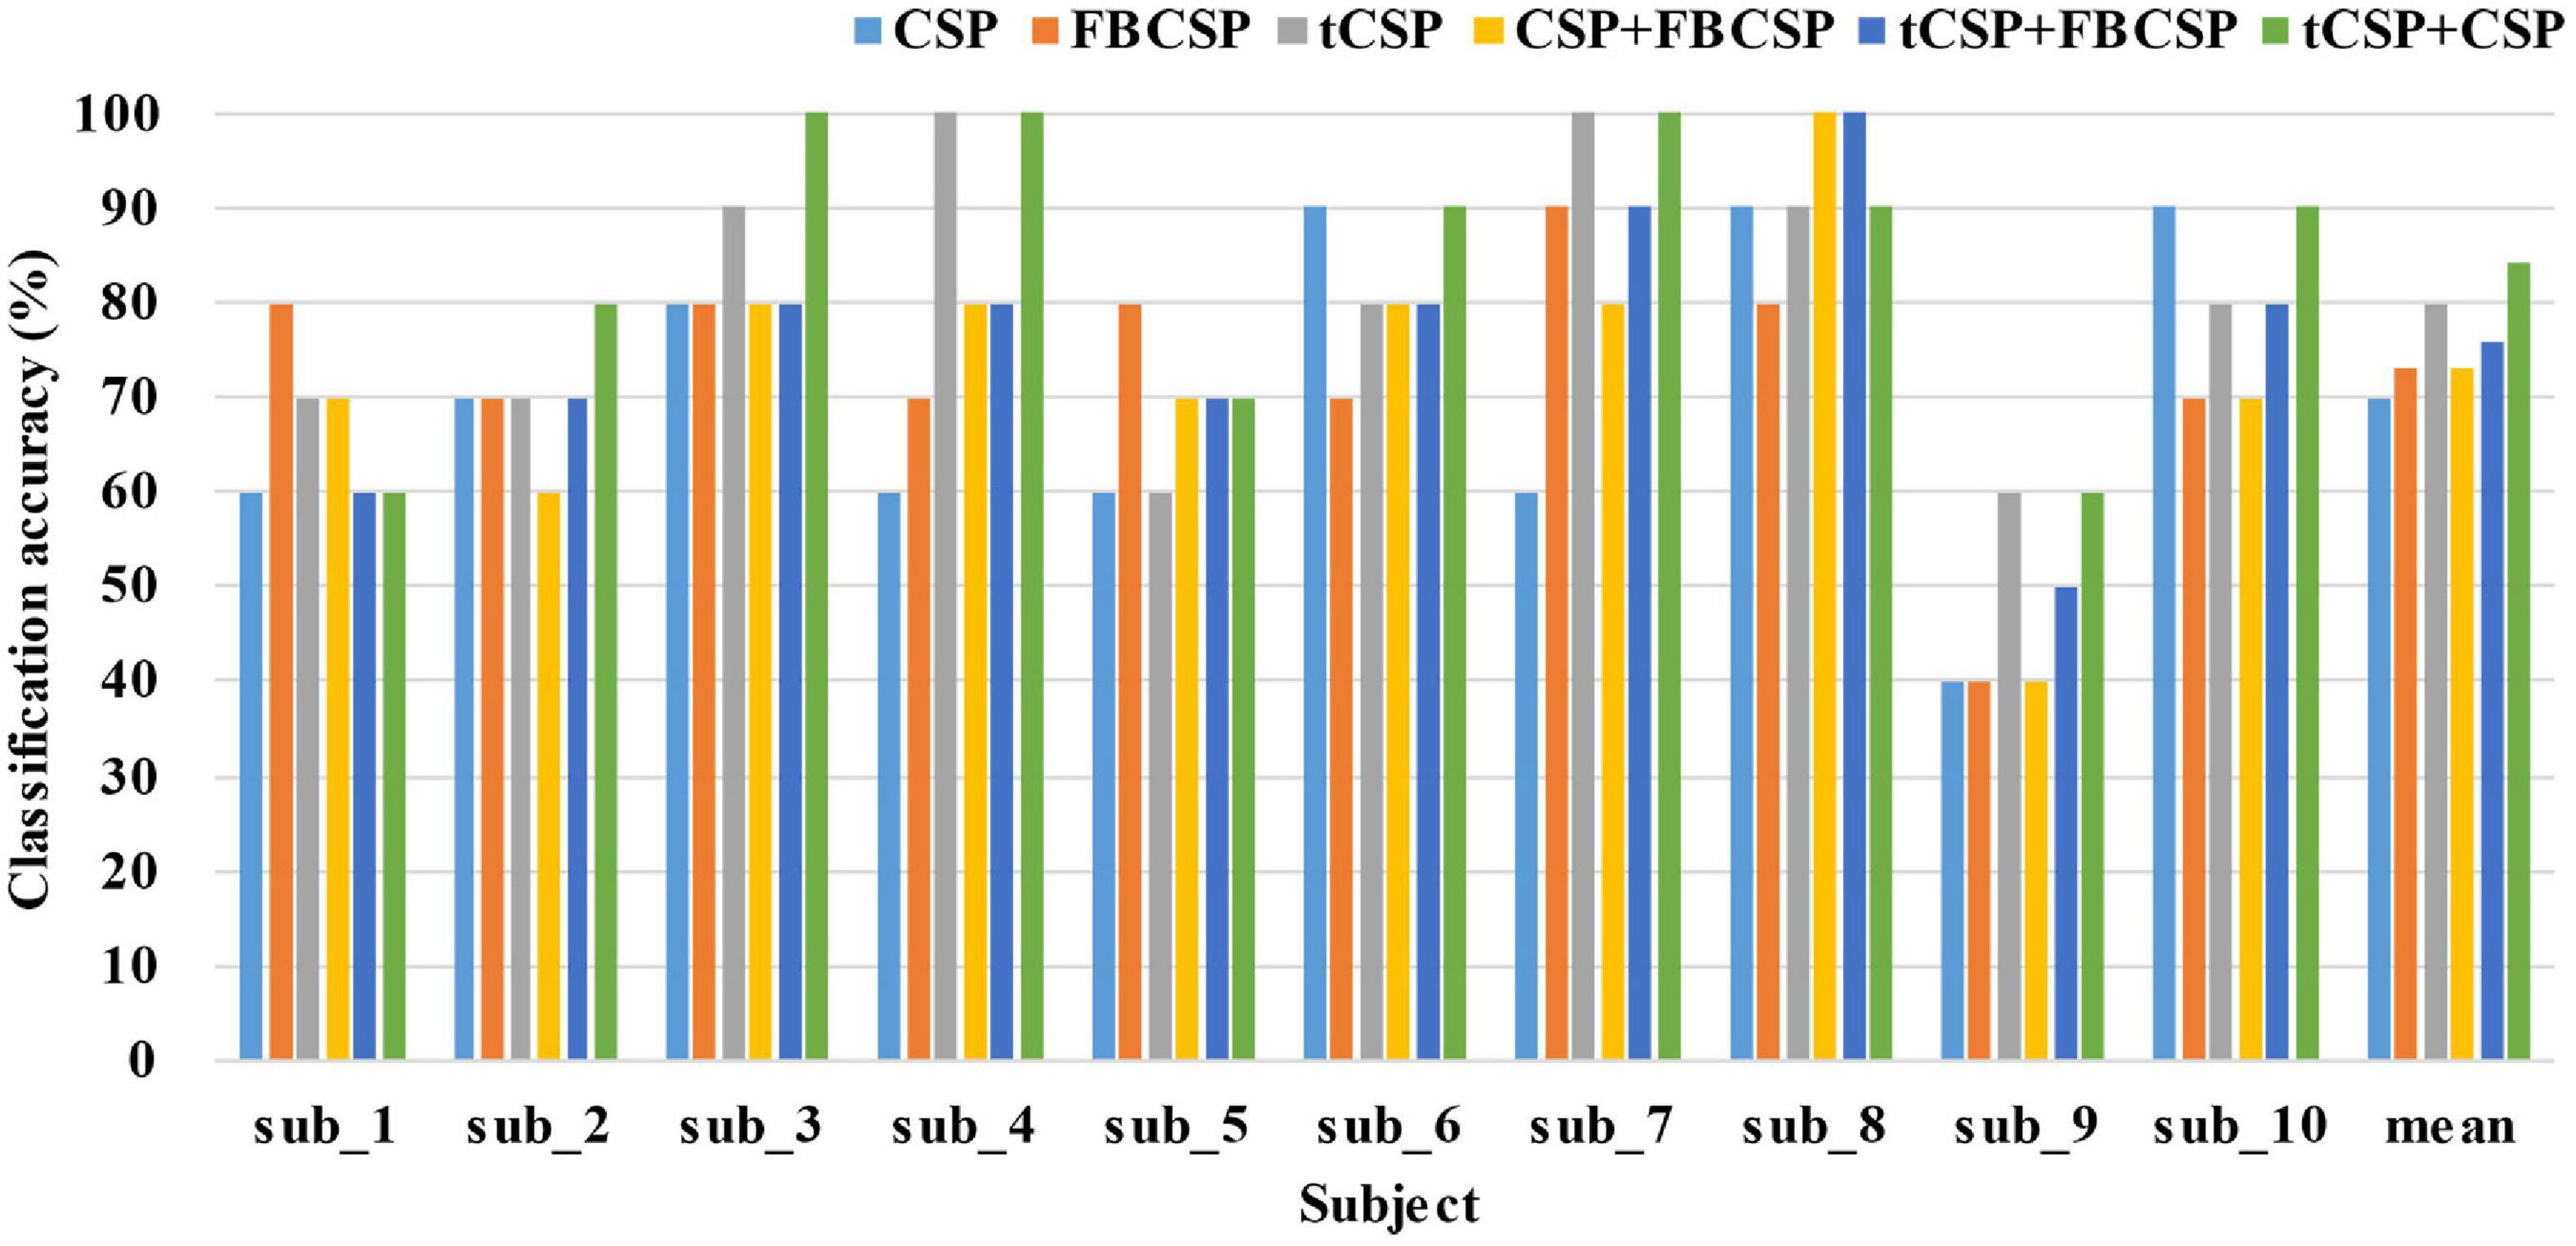
Figure 8. The classification accuracies of different methods in experiment two. The mean indicates the average classification accuracies across all the subjects. tCSP or tCSP+CSP achieves the highest classification accuracies for most subjects.
4. Discussion
As a typical algorithm for ERD-feature extraction, CSP heavily depends on selecting frequency bands. However, not all subjects show distinct ERD patterns with strong discriminant ability when performing MI tasks (Figure 3B). CSP features generally yield poor classification performance with an inappropriate frequency band (Novi et al., 2007). Hence, selecting appropriate subject-specific frequency ranges before CSP is an effective and popular measure to improve the performance of MI-based BCIs (Novi et al., 2007; Kai Keng et al., 2008; Park and Lee, 2017; Park et al., 2017). This study proposed tCSP method to optimize the frequency selection after CSP filtering, achieving significant better performance than the traditional CSP methods.
tCSP addresses the MI-induced EEG features in both spatial and frequency domains. After spatial filtering by CSP, we increased the dimension of the data, i.e., the time-frequency transformation and data concatenation, aiming to present more detailed discriminative information in the time-frequency domain (Figure 4A). Then, we reduced the dimension of the data by selecting the optimal subject-specific frequency points for classification. The data dimension increasing and reducing processes may reinforce features’ discriminability. As a result, from Figure 5, we can see that the distribution of tCSP features had a more obvious divergence with better discriminability than CSP and FBCSP, especially when the number of training samples was limited.
CSP features reflect a broad frequency-band power variation of MI EEG data (Ramoser et al., 2000; Kai Keng et al., 2008). In contrast, tCSP extracts feature from frequency point ranges, which may get finer discriminative information in the frequency domain than CSP. Thus, tCSP got better performance than CSP. The tCSP and CSP features may reflect different fineness levels of frequency optimization, so the combination of tCSP and CSP may provide comprehensive discriminative information to further improve the performance of MI classification. From the results in Table 2, the tCSP+CSP method got the best performance on average with the highest accuracy of 100%, which was significantly better than CSP, FBCSP, and CSP+FBCSP. For dataset IVa (Table 3) and the online evaluation (Figure 8), the combination of tCSP and CSP got the best performance on average.
Generally speaking, a limited number of training samples would bring about a high variance for the covariance estimation, which might result in a biased estimation of eigenvalues (Friedman, 1989). Thus, a small-sample setting condition usually results in poor performance of classifiers. From the results of this study, the proposed method performed relatively well in small-sample setting conditions. For the dataset of experiment one (Figure 7), the tCSP method achieved an average accuracy of about 70% with 16 training samples, approximately equal to that of traditional CSP and FBCSP with 48 training samples.
5. Conclusion
This study designed a novel feature extraction method, i.e., tCSP, to optimize the frequency selection after CSP filtering. tCSP could achieve better performance than the traditional CSP and filter bank CSP. Furthermore, the combination of tCSP and CSP could extract more discriminative information and further improve the performance of MI-based BCIs. The results of a dataset collected by our team, a public dataset and an online evaluation verified the feasibility and effectiveness of the proposed tCSP. In general, optimizing the frequency selection after CSP is a promising approach to enhance the decoding of MI EEG patterns, which is significant for the development of BCIs.
Data availability statement
The raw data supporting the conclusions of this article will be made available by the authors, without undue reservation.
Ethics statement
The studies involving human participants were reviewed and approved by the Ethical Committee of Tianjin University. The patients/participants provided their written informed consent to participate in this study.
Author contributions
ZM, KW, MX, and DM conceived the study. ZM and WY designed and conducted the experiments. ZM performed data analyses. ZM and KW wrote and edited the initial draft. MX, FX, and DM performed proofreading and finalizing of the manuscript. All authors contributed to the article and approved the submitted version.
Funding
This work was supported by STI 2030—Major Projects 2022ZD0208900, National Natural Science Foundation of China (62122059, 61976152, 62206198, 81925020, and 62006014), and Introduce Innovative Teams of 2021 “New High School 20 Items” Project (2021GXRC071).
Acknowledgments
We sincerely thank all participants for their voluntary participation.
Conflict of interest
The authors declare that the research was conducted in the absence of any commercial or financial relationships that could be construed as a potential conflict of interest.
Correction note
This article has been corrected with minor changes. These changes do not impact the scientific content of the article.
Publisher’s note
All claims expressed in this article are solely those of the authors and do not necessarily represent those of their affiliated organizations, or those of the publisher, the editors and the reviewers. Any product that may be evaluated in this article, or claim that may be made by its manufacturer, is not guaranteed or endorsed by the publisher.
References
Al-Saegh, A., Dawwd, S. A., and Abdul-Jabbar, J. M. (2021). Deep learning for motor imagery EEG-based classification: a review. Biomed. Signal Processing Control 63:102172. doi: 10.1016/j.bspc.2020.102172
Ang, K. K., Chin, Z. Y., Wang, C., Guan, C., and Zhang, H. (2012). Filter bank common spatial pattern algorithm on BCI competition IV Datasets 2a and 2b. Front. Neurosci. 6:39. doi: 10.3389/fnins.2012.00039
Barachant, A., Bonnet, S., Congedo, M., and Jutten, C. (2010). “Common spatial pattern revisited by riemannian geometry,” in Proceedings of the IEEE International Workshop on Multimedia Signal Processing, (Piscataway, NJ: IEEE).
Barachant, A., Bonnet, S., Congedo, M., and Jutten, C. (2012). Multiclass brain-computer interface classification by riemannian geometry. IEEE Trans. Biomed. Eng. 59, 920–928. doi: 10.1109/TBME.2011.2172210
Birbaumer, N., Murguialday, A. R., and Cohen, L. (2008). Brain–computer interface in paralysis. Curr. Opin. Neurol. 21, 634–638. doi: 10.1097/WCO.0b013e328315ee2d
Blankertz, B., Muller, K.-R., Krusienski, D. J., Schalk, G., Wolpaw, J. R., Schlogl, A., et al. (2006). The BCI competition III: validating alternative approaches to actual BCI problems. IEEE Trans. Neural Syst. Rehabil. Eng. 14, 153–159. doi: 10.1109/TNSRE.2006.875642
Blankertz, B., Tomioka, R., Lemm, S., Kawanabe, M., and Muller, K.-R. (2007). Optimizing spatial filters for robust EEG single-trial analysis. IEEE Signal Process. Mag. 25, 41–56. doi: 10.1109/MSP.2008.4408441
Brodu, N., Lotte, F., and Lécuyer, A. (2011). “Comparative study of band-power extraction techniques for motor imagery classification,” in Proceedings of the IEEE Symposium on Computational Intelligence, Cognitive Algorithms, Mind, and Brain (CCMB), (Piscataway, NJ: IEEE). doi: 10.1109/CCMB.2011.5952105
Chaudhary, U., Birbaumer, N., and Ramos-Murguialday, A. (2016). Brain-computer interfaces for communication and rehabilitation. Nat. Rev. Neurol. 12, 513–525. doi: 10.1038/nrneurol.2016.113
Chen, B., Li, Y., Dong, J., Lu, N., and Qin, J. (2018). Common spatial patterns based on the quantized minimum error entropy criterion. IEEE Trans. Syst. Man Cybern. Syst. 50, 4557–4568. doi: 10.1109/TSMC.2018.2855106
Coogan, C. G., and He, B. (2018). Brain-computer interface control in a virtual reality environment and applications for the internet of things. IEEE Access 6, 10840–10849. doi: 10.1109/ACCESS.2018.2809453
Craik, A., He, Y., and Contreras-Vidal, J. L. (2019). Deep learning for electroencephalogram (EEG) classification tasks: a review. J. Neural Eng. 16:031001. doi: 10.1088/1741-2552/ab0ab5
Delorme, A., and Makeig, S. (2004). EEGLAB: an open source toolbox for analysis of single-trial EEG dynamics including independent component analysis. J. Neurosci. Methods 134, 9–21. doi: 10.1016/j.jneumeth.2003.10.009
Dornhege, G., Blankertz, B., Krauledat, M., Losch, F., Curio, G., and Muller, K. R. (2006). Combined optimization of spatial and temporal filters for improving brain-computer interfacing. IEEE Trans. Biomed. Eng. 53, 2274–2281. doi: 10.1109/TBME.2006.883649
Fang, H., Jin, J., Daly, I., and Wang, X. (2022). Feature extraction method based on filter banks and riemannian tangent space in motor-imagery BCI. IEEE J. Biomed. Health Inform. 26, 2504–2514. doi: 10.1109/JBHI.2022.3146274
Friedman, J. H. (1989). Regularized discriminant analysis. J. Am. Stat. Assoc. 84, 165–175. doi: 10.1080/01621459.1989.10478752
Grosse-Wentrup, M., and Buss, M. (2008). Multiclass common spatial patterns and information theoretic feature extraction. IEEE Trans. Biomed. Eng. 55, 1991–2000. doi: 10.1109/TBME.2008.921154
Guger, C., Ramoser, H., and Pfurtscheller, G. (2000). Real-time EEG analysis with subject-specific spatial patterns for a brain-computer interface (BCI). IEEE Trans. Rehabil. Eng. 8, 447–456. doi: 10.1109/86.895947
Herman, P., Prasad, G., McGinnity, T. M., and Coyle, D. (2008). Comparative analysis of spectral approaches to feature extraction for EEG-based motor imagery classification. IEEE Trans. Neural Syst. Rehabil. Eng. 16, 317–326. doi: 10.1109/TNSRE.2008.926694
Ju, J., Feleke, A. G., Luo, L., and Fan, X. (2022). Recognition of drivers’ hard and soft braking intentions based on hybrid brain-computer interfaces. Cyborg Bionic Syst. 2022, 1–13. doi: 10.34133/2022/9847652
Kai Keng, A., Zhang Yang, C., Haihong, Z., and Cuntai, G. (2008). “Filter bank common spatial pattern (FBCSP) in brain-computer interface,” in Proceedings of the IEEE International Joint Conference on Neural Networks (IEEE World Congress on Computational Intelligence), (Piscataway, NJ: IEEE). doi: 10.1109/IJCNN.2008.4634130
Lemm, S., Blankertz, B., Curio, G., and Muller, K. R. (2005). Spatio-spectral filters for improving the classification of single trial EEG. IEEE Trans. Biomed. Eng. 52, 1541–1548. doi: 10.1109/TBME.2005.851521
Li, X., Lu, X., and Wang, H. (2016). Robust common spatial patterns with sparsity. Biomed. Signal Process. Control 26, 52–57. doi: 10.1016/j.bspc.2015.12.005
Lotte, F., Bougrain, L., Cichocki, A., Clerc, M., Congedo, M., Rakotomamonjy, A., et al. (2018). A review of classification algorithms for EEG-based brain-computer interfaces: a 10 year update. J. Neural Eng. 15:031005. doi: 10.1088/1741-2552/aab2f2
Lu, H., Eng, H.-L., Guan, C., Plataniotis, K. N., and Venetsanopoulos, A. N. (2010). Regularized common spatial pattern with aggregation for EEG classification in small-sample setting. IEEE Trans. Biomed. Eng. 57, 2936–2946. doi: 10.1109/TBME.2010.2082540
Lu, H., Plataniotis, K. N., and Venetsanopoulos, A. N. (2009). “Regularized common spatial patterns with generic learning for EEG signal classification,” in Proceedings of the Annual International Conference of the IEEE Engineering in Medicine and Biology Society, (Piscataway, NJ: IEEE).
Makeig, S. (1993). Auditory event-related dynamics of the EEG spectrum and effects of exposure to tones. Clin. Neurophysiol. 86, 283–293. doi: 10.1016/0013-4694(93)90110-H
Makeig, S., Debener, S., Onton, J., and Delorme, A. (2004). Mining event-related brain dynamics. Trends Cogn. Sci. 8, 204–210. doi: 10.1016/j.tics.2004.03.008
Meng, J., Liu, G., Huang, G., and Zhu, X. (2009). “Automated selecting subset of channels based on CSP in motor imagery brain-computer interface system,” in Proceedings of the IEEE International Conference on Robotics and Biomimetics (ROBIO), (Piscataway, NJ: IEEE), 2290–2294. doi: 10.1109/ROBIO.2009.5420462
Meng, J., Xu, M., Wang, K., Meng, Q., Han, J., Xiao, X., et al. (2020). Separable EEG features induced by timing prediction for active brain-computer interfaces. Sensors 20:3588. doi: 10.3390/s20123588
Mika, S., Ratsch, G., Weston, J., Scholkopf, B., and Mullers, K.-R. (1999). “Fisher discriminant analysis with kernels,” in Neural Networks for Signal Processing IX: Proceedings of the 1999 IEEE Signal Processing Society Workshop, (Piscataway, NJ: IEEE).
Novi, Q., Guan, C., Dat, T. H., and Xue, P. (2007). “Sub-band common spatial pattern (SBCSP) for brain-computer interface,” in Proceedings of the 3rd International IEEE/EMBS Conference on Neural Engineering, (Piscataway, NJ: IEEE). doi: 10.1109/CNE.2007.369647
Park, C., Looney, D., ur Rehman, N., Ahrabian, A., and Mandic, D. P. (2012). Classification of motor imagery BCI using multivariate empirical mode decomposition. IEEE Trans. Neural Syst. Rehabil. Eng. 21, 10–22. doi: 10.1109/TNSRE.2012.2229296
Park, S. H., Lee, D., and Lee, S. G. (2017). Filter bank regularized common spatial pattern ensemble for small sample motor imagery classification. IEEE Trans. Neural Syst. Rehabil. Eng. 26, 498–505. doi: 10.1109/TNSRE.2017.2757519
Park, S.-H., and Lee, S.-G. (2017). Small sample setting and frequency band selection problem solving using subband regularized common spatial pattern. IEEE Sensors J. 17, 2977–2983. doi: 10.1109/JSEN.2017.2671842
Park, Y., and Chung, W. (2019). Frequency-optimized local region common spatial pattern approach for motor imagery classification. IEEE Trans. Neural Syst. Rehabil. Eng. 27, 1378–1388. doi: 10.1109/TNSRE.2019.2922713
Pfurtscheller, G., and Da Silva, F. L. (1999). Event-related EEG/MEG synchronization and desynchronization: basic principles. Clin. Neurophysiol. 110, 1842–1857. doi: 10.1016/S1388-2457(99)00141-8
Pfurtscheller, G., and Neuper, C. (2001). Motor imagery and direct brain-computer communication. Proc. IEEE 89, 1123–1134. doi: 10.1109/5.939829
Pfurtscheller, G., Neuper, C., Flotzinger, D., and Pregenzer, M. (1997). EEG-based discrimination between imagination of right and left hand movement. Electroencephalogr. Clin. Neurophysiol. 103, 642–651. doi: 10.1016/S0013-4694(97)00080-1
Ramoser, H., Muller-Gerking, J., and Pfurtscheller, G. (2000). Optimal spatial filtering of single trial EEG during imagined hand movement. IEEE Trans. Rehabil. Eng. 8, 441–446. doi: 10.1109/86.895946
Song, L., and Epps, J. (2007). Classifying EEG for brain-computer interface: learning optimal filters for dynamical system features. Comput. Intell. Neurosci. 2007:57180. doi: 10.1155/2007/57180
Van der Maaten, L., and Hinton, G. (2008). Visualizing data using t-SNE. J. Mach. Learn. Res. 9, 2579–2605.
Wang, K., Xu, M., Wang, Y., Zhang, S., Chen, L., and Ming, D. (2020). Enhance decoding of pre-movement EEG patterns for brain-computer interfaces. J. Neural Eng. 17:016033. doi: 10.1088/1741-2552/ab598f
Waytowich, N. R., Lawhern, V. J., Bohannon, A. W., Ball, K. R., and Lance, B. J. (2016). Spectral transfer learning using information geometry for a user-independent brain-computer interface. Front. Neurosci. 10:430. doi: 10.3389/fnins.2016.00430
Wolpaw, J., and Wolpaw, E. W. (2012). Brain-Computer Interfaces: Principles and Practice. Oxford: Oxford University Press. doi: 10.1093/acprof:oso/9780195388855.001.0001
Wolpaw, J. R., Birbaumer, N., McFarland, D. J., Pfurtscheller, G., and Vaughan, T. M. (2002). Brain–computer interfaces for communication and control. Clin. Neurophysiol. 113, 767–791. doi: 10.1016/S1388-2457(02)00057-3
Xu, M., Han, J., Wang, Y., Jung, T. P., and Ming, D. (2020). Implementing over 100 command codes for a high-speed hybrid brain-computer interface using concurrent P300 and SSVEP features. IEEE Trans. Biomed. Eng. 67, 3073–3082. doi: 10.1109/TBME.2020.2975614
Xu, M., He, F., Jung, T.-P., Gu, X., and Ming, D. (2021). Current challenges for the practical application of electroencephalography-based brain–computer interfaces. Engineering 7, 1710–1712. doi: 10.1016/j.eng.2021.09.011
Xu, M., Xiao, X., Wang, Y., Qi, H., Jung, T. P., and Ming, D. (2018). A brain-computer interface based on miniature-event-related potentials induced by very small lateral visual stimuli. IEEE Trans. Biomed. Eng. 65, 1166–1175. doi: 10.1109/TBME.2018.2799661
Yger, F., Berar, M., and Lotte, F. (2017). Riemannian approaches in brain-computer interfaces: a review. IEEE Trans. Neural Syst. Rehabil. Eng. 25, 1753–1762. doi: 10.1109/TNSRE.2016.2627016
Yong, X., Ward, R. K., and Birch, G. E. (2008). “Sparse spatial filter optimization for EEG channel reduction in brain-computer interface,” in Proceedings of the IEEE International Conference on Acoustics, Speech and Signal Processing, (Piscataway, NJ: IEEE), 417–420.
Zanini, P., Congedo, M., Jutten, C., Said, S., and Berthoumieu, Y. (2018). Transfer learning: a riemannian geometry framework with applications to brain-computer interfaces. IEEE Trans. Biomed. Eng. 65, 1107–1116. doi: 10.1109/TBME.2017.2742541
Zhang, R., Zong, Q., Dou, L., and Zhao, X. (2019). A novel hybrid deep learning scheme for four-class motor imagery classification. J. Neural Eng. 16:066004. doi: 10.1088/1741-2552/ab3471
Appendix
Here is the pseudocode of the tCSP:
Algorithm: tCSP
Input: EEG dataset E∈RN×T.
Output: The tCSP feature vector yt.
Step 1 (Preprocessing):
• Divide the dataset into training, calibration and test data.
Step 2 (CSP Filtering):
• Center the training data as , where n = 1,2 and i denotes the i-th trial.
• Calculate composite spatial covariance .
• Eigenvalue decomposition: .
• Calculate .
• Whitening transformation: .
• Eigenvalue decomposition: .
• Calculate W=B′P.
• Transform all the data as Zi=W′Ei.
Step 3 (Data transformation and concatenation):
• Transfer the data Zi to the time-frequency domain Gi∈R2M × J × T.
• Reconstitute the data Gi to a matrix Hi ∈ RJ×Tw, where Tw = T × 2M.
Step 4 (feature extraction):
• For j = 1: J
1. Select the data Ki,j ∈ RTw from Hi at frequency point j
2. Calculate using the training data
3. Calculate tCSP features as
4. Train an FDA classifier using training features, then calculate a classification accuracy using calibration features
5. All the classification accuracies form a matrix Q∈RA×J, where A indicates the number of subjects
6. Break and go to next step
• Select the frequency points with the highest classification accuracies as Fa=Q⋅F′, where F is a sparse matrix.
• Select the tCSP features at F_a to form a feature vector yt.
Keywords: brain–computer interface (BCI), electroencephalography (EEG), motor imagery (MI), common spatial pattern (CSP), transformed common spatial pattern (tCSP)
Citation: Ma Z, Wang K, Xu M, Yi W, Xu F and Ming D (2023) Transformed common spatial pattern for motor imagery-based brain-computer interfaces. Front. Neurosci. 17:1116721. doi: 10.3389/fnins.2023.1116721
Received: 05 December 2022; Accepted: 20 February 2023;
Published: 07 March 2023;
Corrected: 01 August 2025.
Edited by:
Paul Ferrari, Helen DeVos Children’s Hospital, United StatesReviewed by:
Yangyang Miao, East China University of Science and Technology, ChinaMinmin Miao, Huzhou University, China
Jun Wang, The University of Texas at Austin, United States
Copyright © 2023 Ma, Wang, Xu, Yi, Xu and Ming. This is an open-access article distributed under the terms of the Creative Commons Attribution License (CC BY). The use, distribution or reproduction in other forums is permitted, provided the original author(s) and the copyright owner(s) are credited and that the original publication in this journal is cited, in accordance with accepted academic practice. No use, distribution or reproduction is permitted which does not comply with these terms.
*Correspondence: Minpeng Xu, bWlucGVuZy54dUB0anUuZWR1LmNu; Dong Ming, cmljaGFyZG1pbmdAdGp1LmVkdS5jbg==
†These authors have contributed equally to this work
 Zhen Ma
 Kun Wang
 Minpeng Xu
 Weibo Yi
 Fangzhou Xu
 Dong Ming