 Arunima Debnath
 Paul D. E. Williams
 Bruce A. Bamber
94% of researchers rate our articles as excellent or good
Learn more about the work of our research integrity team to safeguard the quality of each article we publish.
Find out more
ORIGINAL RESEARCH article
Front. Neurosci., 22 July 2022
Sec. Brain Imaging Methods
Volume 16 - 2022 | https://doi.org/10.3389/fnins.2022.931328
This article is part of the Research TopicOptical Imaging in Neuroscience and Brain DiseaseView all 6 articles
Neuromodulators regulate neuronal excitability and bias neural circuit outputs. Optical recording of neuronal Ca2+ transients is a powerful approach to study the impact of neuromodulators on neural circuit dynamics. We are investigating the polymodal nociceptor ASH in Caenorhabditis elegans to better understand the relationship between neuronal excitability and optically recorded Ca2+ transients. ASHs depolarize in response to the aversive olfactory stimulus 1-octanol (1-oct) with a concomitant rise in somal Ca2+, stimulating an aversive locomotory response. Serotonin (5-HT) potentiates 1-oct avoidance through Gαq signaling, which inhibits L-type voltage-gated Ca2+ channels in ASH. Although Ca2+ signals in the ASH soma decrease, depolarization amplitudes increase because Ca2+ mediates inhibitory feedback control of membrane potential in this context. Here, we investigate octopamine (OA) signaling in ASH to assess whether this negative correlation between somal Ca2+ and depolarization amplitudes is a general phenomenon, or characteristic of certain neuromodulatory pathways. Like 5-HT, OA reduces somal Ca2+ transient amplitudes in ASH neurons. However, OA antagonizes 5-HT modulation of 1-oct avoidance behavior, suggesting that OA may signal through a different pathway. We further show that the pathway for OA diminution of ASH somal Ca2+ consists of the OCTR-1 receptor, the Go heterotrimeric G-protein, and the G-protein activated inwardly rectifying channels IRK-2 and IRK-3, and this pathway reduces depolarization amplitudes in parallel with somal Ca2+ transient amplitudes. Therefore, even within a single neuron, somal Ca2+ signal reduction may indicate either increased or decreased depolarization amplitude, depending on which neuromodulatory signaling pathways are activated, underscoring the need for careful interpretation of Ca2+ imaging data in neuromodulatory studies.
Neuromodulation alters neuronal circuit function through regulation of neuronal excitability and synaptic strengths, thereby reconfiguring circuit outputs (Bargmann, 2012; Marder, 2012). Well studied neuromodulators include monoamines such as serotonin (5-HT) and dopamine, and neuropeptides such as vasopressin and oxytocin. Neuromodulators function through G-protein signaling cascades to regulate behavior in both vertebrates and invertebrates, including feeding behavior, learning and memory, attention and arousal (Hasselmo, 1999, 2006; Lee et al., 2004; Sara, 2009; Al-Anzi et al., 2010; Harris-Warrick and Johnson, 2010; Elphick, 2012; Sara and Bouret, 2012; Ko et al., 2015; Schwarz and Luo, 2015; Ballinger et al., 2016; Koelle, 2018; Nässel et al., 2019; Bacqué-Cazenave et al., 2020; Ranjbar-Slamloo and Fazlali, 2020). Multiple different neuromodulators often act on the same neuron through different receptors and signaling pathways resulting in differential behavioral effects (Chase and Koelle, 2007; Wragg et al., 2007; Li et al., 2018). G-protein coupled receptors (GPCRs) involved in neuromodulation signal through the heterotrimeric G-protein families Gs, Gq, and Gi/o, which dissociate into activated Gα subunits and Gβγ subunits upon activation by GPCRs. Gs signaling increases neurotransmission through the adenylyl cyclase/protein kinase A pathway (Reynolds et al., 2005; Schade et al., 2005; Koelle, 2018). Gq signaling increases neurotransmission through the downstream effectors phospholipase Cβ and the Rho guanine nucleotide exchange factor Trio. Phospholipase Cβ generates diacylglycerol (DAG) and inositol triphosphate (IP3), which gates Ca2+ release from intracellular stores, while Trio also promotes increased DAG levels. DAG and Ca2+ increase synaptic vesicle and dense core vesicle release through UNC-13 and protein kinase C (Koelle, 2018), while Ca2+ plays other, independent, roles in cell signaling (see below). Gi/o signaling inhibits neurotransmission through several potential pathways including inhibition of adenylyl cyclase and antagonism of Gαq signaling by Gαi/o (Koelle, 2018; Muntean et al., 2021). However, the predominant mechanism of Gi/o signaling appears to be through the release of Gβγ subunits upon GPCR activation, which hyperpolarize membranes by activating G-protein coupled inward rectifying potassium channels (GIRKs) (Kano et al., 2019), inhibit adenylate cyclase (Muntean et al., 2021), reduce synaptic vesicle release by inhibiting voltage-gated Ca2+ channels (VGCCs) at presynaptic terminals (Waterman, 2000), and directly inhibit synaptic vesicle release by binding key components of the synaptic vesicle release machinery (Blackmer et al., 2001; Hamid et al., 2014; Hamm and Alford, 2020; Alten et al., 2022).
The study of neuromodulation in the context of intact circuits is greatly facilitated by non-invasive imaging techniques. Ca2+ imaging is a powerful and widely used approach (Patriarchi et al., 2018; Corkrum et al., 2020; Redolfi et al., 2021) and, thus far, preferred over fluorescent voltage indicators due to superior sensitivity, kinetics, and ease of expression (Vogt, 2015; Inagaki and Nagai, 2016; Mollinedo-Gajate et al., 2019; Inoue, 2021; Zhu et al., 2021). Ca2+ imaging utilizes fluorescent calcium indicators, often encoded by transgenes with neuron specific promoters, enabling selective labeling in nervous system areas with high cellular heterogeneity. Quantitatively, Ca2+ signal amplitudes and depolarization amplitudes are believed to rise or fall in parallel (Akerboom et al., 2012; Shidara et al., 2013; Kato et al., 2014; Ghosh et al., 2016). However, examples have been documented where this positive correlation does not hold true (Ferkey et al., 2007; Lindy et al., 2014; Zahratka et al., 2015). Ca2+ signals are an indirect representation of neuronal depolarization, since Ca2+ enters the cytoplasm through VGCCs, which activate downstream of depolarization. Potential sources of error include non-linearity in the ratio of Ca2+ to depolarization introduced by the modulation of VGCCs by intracellular signaling pathways and the release of Ca2+ from internal stores, which creates a Ca2+ pool independent of depolarization. Furthermore, Ca2+ itself is a potent second messenger which can modulate membrane potential by activating downstream ion channels (Grissmer, 2007). For these reasons, interpretation of a change in Ca2+ transient amplitude is not always straightforward.
Recent studies of neuromodulation in the nematode Caenorhabditis elegans have provided a particularly salient example of the need to carefully interpret changes in Ca2+ transient amplitudes. The aversive response of C. elegans to 1-octanol (1-oct) is mediated by ASH polymodal nociceptive neurons and is heavily modulated by monoamines and neuropeptides (Chao et al., 2004; Wragg et al., 2007; Harris et al., 2010; Komuniecki et al., 2012; Mills et al., 2012). 5-HT potentiates aversive locomotory responses to sub-maximal 1-oct stimulation (i.e., 1-oct diluted to 30% in ethanol), in part, through the Gαq-coupled SER-5 receptor in ASHs (Harris et al., 2009). Surprisingly, ASH somal Ca2+ transients are reduced in this context (Zahratka et al., 2015). However, 5-HT actually increases depolarization amplitudes because SER-5/Gαq reduces Ca2+ influx, and Ca2+ inhibits ASHs through Ca2+ activated K+ channels (KCa) (Zahratka et al., 2015; Williams et al., 2018b). Is this inverse relationship between somal Ca2+ transient amplitude and depolarization amplitude a general characteristic of this particular neuron, or is it necessary to evaluate each instance of modulation individually, even within the same neuron type? To answer this question, we have compared the modulation of ASHs by the neuromodulator octopamine (OA), which diminishes 1-oct responses through the OCTR-1 receptor expressed in ASHs.
Strains were cultured on nematode growth media (NGM) plates seeded with Escherichia coli OP50 bacteria as per standard protocols. The following strains were used: N2 (Bristol wild type), FY928 grIs17 [Psra-6::GCaMP3] (wild type expressing GCaMP3 in ASH), VC224 octr-1(ok371) (octr-1 null mutants), FY991 octr-1(ok371); grIs17 [Psra-6::GCaMP3] (octr-1 null mutants expressing GCaMP3 in ASH), FY1030 ser-3(ad1774); grIs17 [Psra-6::GCaMP3] (ser-3 null mutants expressing GCaMP3 in ASH), FY1053 irk-1(n4895); grIs17 [Psra-6::GCaMP3] (irk-1 null mutants expressing GCaMP3 in ASH), FY1056 irk-2(n4896); grIs17 [Psra-6::GCaMP3] (irk-2 null mutants expressing GCaMP3 in ASH), FY1061 irk-3(n5049); grIs17 [Psra-6::GCaMP3] (irk-3 null mutants expressing GCaMP3 in ASH), FY1063 goa-1(n1134); grIs17 [Psra-6::GCaMP3] (goa-1 null mutants expressing GCaMP3 in ASH), MT15934 irk-1(n4895) (irk-1 null mutants), FQ295 irk-2(n4896) (irk-2 null mutants), MT17360 irk-3(n5049) (irk-3 null mutants), and LX1751 lin-15(n765) X; vsEx700 (ASH::PTX worms, expressing pertussis toxin (PTX) in ASH under the control of the osm-10 promoter). The Psra-6::GCaMP3 transgene was obtained as the extrachromosomal array kyEx2865 in strain CX10979 (Kato et al., 2014). The Posm-10::PTX transgene was obtained as extrachromosomal array vsEx700 in strain LX1751 (Hofler and Koelle, 2011). MT15934, FQ295, and MT17360 were kindly supplied by N. Ringstad (Skirball Institute, New York, NY, United States), LX1751 was a kind gift from M. Koelle (Yale University, New Haven, CT, United States), and CX10979 was generously supplied by C. Bargmann.
Calcium imaging experiments were performed as previously described (Mills et al., 2012; Zahratka et al., 2015; Williams et al., 2018b). Worms were glued down using WormGlu cyanoacrylate glue (GluStitch, Delta, BC, Canada), on a 15 mm diameter round coverslip coated with Sylgard (Dow Corning, Midland, MI, United States), immersed in external solution (see below). The coverslips were then placed in a laminar flow chamber (Warner RC26G, Warner Instruments, Hamden, CT, United States) which was continuously perfused with external solution; 150 mM NaCl, 5 mM KCl, 5 mM CaCl2, 1 mM MgCl2, 10 mM glucose, 15 mM HEPES, pH 7.30, 327–333 mOsm. Saturated 1-oct (2.37 mM in external solution) was delivered under gravity feed through Luer valves using a perfusion pencil (AutoMate Scientific, Berkeley, CA, United States) or homemade equivalent. Fluorescent tracer sulforhodamine 101 (SR101, 1 μM, Thermo Fisher Scientific) was used in the 1-oct solution for visual inspection of flow and to check for staining of the worm’s nose, indicative of successful stimulus application. All solutions were delivered using the perfusion pencil as described above, mounted on a SF77B Perfusion Fast Step device (step size 200 μM, Warner Instruments, Hamden, CT, United States) to provide precise computer control of pipette position. After each exposure, we visually examined the animals for SR101 staining. No response was observed in ASHs to external solution containing 1 μM SR101 alone. The sra-6 promoter is active in ASH and ASI neurons, which are distinguishable based on their relative positions in the head. ASI neurons did not respond to 1-oct.
We partially dissected the animals to expose the ASH to external solution for Ca2+ imaging experiments with high K+ stimulation and in experiments where OA was acutely applied to the ASHs. Dissection was performed according to previously described procedure (Goodman et al., 1998). The ASH was exposed by slitting the cuticle with a glass patch pipette (TW150-3, World Precision Instruments) that had been melted, drawn to a fine point and broken back to create a sharp-ended cutter using a Narishige MF-83 microforge (Narishige, Setagaya-ku, Tokyo, Japan). Cutters were mounted on a micromanipulator (Sutter MP285, Sutter Instruments, Novato, CA, United States) to slit open the cuticle, exposing one of the two ASHs to the external bath solution (Williams et al., 2018b). High K+ external solution was composed of 120 mM NaCl, 30 mM KCl, 1 mM MgCl2, 15 mM HEPES, 5 mM CaCl2, 10 mM glucose, with pH 7.3, 327–333 mOsm. High K+ containing external solution was applied using a four-barrel glass puffer with barrel cross section of 300 μm, mounted on a SF77B Perfusion Fast Step device. Solutions were delivered using a syringe pump (KD Scientific, Holliston, MA, United States). Recordings were performed on an Axioskop 2 FS Plus upright compound microscope (40× Achroplan water immersion objective, GFP filter set # 38) (Zeiss, Germany), fitted with an Orca ER CCD camera (Hamamatsu, Skokie, IL, United States) and an automated shutter (Uniblitz, Vincent Associates, Rochester, NY, United States). Minimal illumination intensity was used to prevent GCaMP3 photobleaching, and we did not observe differential photobleaching rates between different genotypes and treatment groups. Exposure times were 50 ms with 4× binning and frame rate of 15 frames/s. Monoamine (OA/5-HT/OA + 5-HT, Sigma-Aldrich, St. Louis, MO, United States) exposure was performed by either incubating the animals on NGM plates containing monoamine(s) at 4 mM each, or by direct application to ASH neurons in partially dissected worms. For plate incubation, each monoamine was added to the NGM agar at 4 mM, and worms were incubated for 30–45 min. OA, 5-HT, OA + 5-HT plates were prepared fresh on each day of recording. Direct application of OA was achieved using a two-opening theta (θ) glass tube that had been heated and drawn to a fine caliber by hand. A PE10 polyethylene tube (0.61 OD × 0.28 ID) (Warner Instruments, Hamden, CT, United States) was inserted into the back of each barrel and sealed using Sylgard to supply external (control) and OA-containing solutions. Solutions flow was regulated using nylon three-way Luer Lock stopcocks; and delivered, using a syringe pump (KD Scientific, Holliston, MA, United States), such that only one barrel of the theta tubing (i.e., buffer or OA) was flowing at a time. Either stream delivered from the dual-chambered pipette was able to shield the exposed ASH from the 1-oct stimulus; inadvertent exposure of exposed ASHs was immediately obvious due to SR101 staining, and such recordings were discarded. Fluorescent images were acquired via MetaVue 7.6.5 (MDS Analytical Technologies, Sunnyvale, CA, United States). For quantifying fluorescence changes in the soma, a square region of interest was drawn, such that the entire soma was the only fluorescent object present. For ASH amphids, a square region was drawn around the ciliated endings located at the worm’s nose, excluding the dendrite. The acquired images were analyzed using Jmalyze software (Rex Kerr). Roughly circular or oval regions of interest limited to the cell soma or amphid were tracked using Jmalyze. Fluorescence amplitude was calculated as ΔF/Fo, where the fluorescence at a given time point (F) minus the fluorescence immediately before stimulus application (Fo) was divided by Fo [i.e., (F − Fo)/Fo]. For quantitative comparisons, the maximal ΔF/Fo over the time course of the stimulus was plotted in the bar graphs and used for statistical analysis. Wild-type non-drug-treated controls were routinely run in parallel with experimental samples.
For patch-clamp analysis, animals were glued and placed in the recording chamber as described above. ASH cell bodies (identified by GCaMP3 expression) were exposed for whole-cell recordings by partially dissecting the animals as described above, taking care to distinguish ASH neurons and ASI neurons. Dissection quality was validated by ensuring that the dendrite of the exposed ASH had not been severed. Whole cell recordings were performed as previously described (Zahratka et al., 2015). Briefly, we used pressure-polished patch pipettes (Goodman and Lockery, 2000) with 12–30 MΩ resistance containing low Cl– internal solution (15 mM KCl, 115 mM K gluconate, 10 mM HEPES, 5 mM MgCl2, 0.25 mM CaCl2, 5 mM EGTA, 20 mM sucrose, 5 mM MgATP, 0.25 mM NaGTP, pH 7.20, 315 mOsm). OA was directly applied on the exposed ASH using a perfusion pencil (AutoMate Scientific, Berkeley, CA, United States) as described above and delivered using a syringe pump (KD Scientific, Holliston, MA, United States). 1-oct was delivered as described above and the cells were observed after each 1-oct application for SR101 staining to ensure there had not been inadvertent exposure of the cell soma to the 1-oct solution. Signals were recorded with an Axopatch 200B amplifier (Molecular Devices, Sunnyvale, CA, United States) in current-clamp mode (0 pA injected current, 10 kHz sampling, 2 kHz filtering), digitized with a Digidata 1440A digitizer, and analyzed using pCLAMP10 software (Molecular Devices, Sunnyvale, CA, United States).
Behavioral responses to 1-oct were assayed as previously described (Chao et al., 2004; Harris et al., 2009). L4 animals were picked the night before the assay onto fresh NGM plates seeded with OP50. Plates containing 4 mM 5-HT, 4 mM OA, or 4 mM 5-HT + 4 mM OA were prepared fresh, 2 h before the experiment. 1-oct was diluted to 30% in 100% ethanol (v/v) and was presented to a forward moving animal via a glass capillary. For assays in the absence of any monoamine, animals were transferred from their regular stock plate to a food free intermediate plate for 1 min to remove any OP50 and then transferred to a food free assay plate and tested 10 min later. In contrast, for assays in the presence of monoamines, animals were transferred to the respective monoamine containing assay plate after the intermediate plate and tested 30 min later. All reagents were obtained from Fisher Scientific (Waltham, MA, United States) or Sigma-Aldrich (St. Louis, MO, United States).
For behavioral experiments, a minimum of 20 young adult hermaphrodites were analyzed for each treatment/mutation. For Ca2+ imaging and electrophysiology experiments, minimum of five young adult hermaphrodites were recorded each day, where practical. All experiments were performed between 19°C and 23°C. All reagents were prepared fresh before the experiment. Statistical analysis was performed using unpaired, two-tailed Student’s t-tests or one-way ANOVA with Tukey post-test, using GraphPad Prism software (San Diego, CA, United States) with data presented as mean ± SD.
5-HT decreases the amplitude of 1-oct-dependent Ca2+ transients in the soma of ASH neurons while increasing depolarization amplitude and potentiating 1-oct-stimulated avoidance behavior, dependent on SER-5/Gαq signaling within ASHs (Harris et al., 2009; Zahratka et al., 2015; Williams et al., 2018b). Like 5-HT, OA (4 mM) also reduces 1-oct-stimulated Ca2+ transients in the ASH soma (Figures 1A,B; baseline Ca2+ levels were not affected by the monoamines, alone or in combination, Supplementary Figure S1). OA does not affect 30% 1-oct avoidance behavior on its own, but does antagonize 5-HT potentiation, dependent on the cell autonomous effects of the OCTR-1 OA receptor in ASHs (Wragg et al., 2007). We confirmed the OA antagonism of 5-HT potentiation (Figure 1C). Despite reversing the 5-HT effect on behavior, OA does not reverse the effect of 5-HT on 1-oct-dependent Ca2+ transients in the ASH soma when worms are co-incubated with both monoamines (Figures 1A,B). These results imply that 5-HT and OA activate different signaling pathways which converge on the optically measurable somal Ca2+ transient, and indicate that, in terms of behavior, the OA pathway dominates the 5-HT pathway when both are active simultaneously. These results also reinforce the idea that somal Ca2+ transient modulation may not be a reliable predictor of a neuron’s output to the downstream locomotory circuitry.
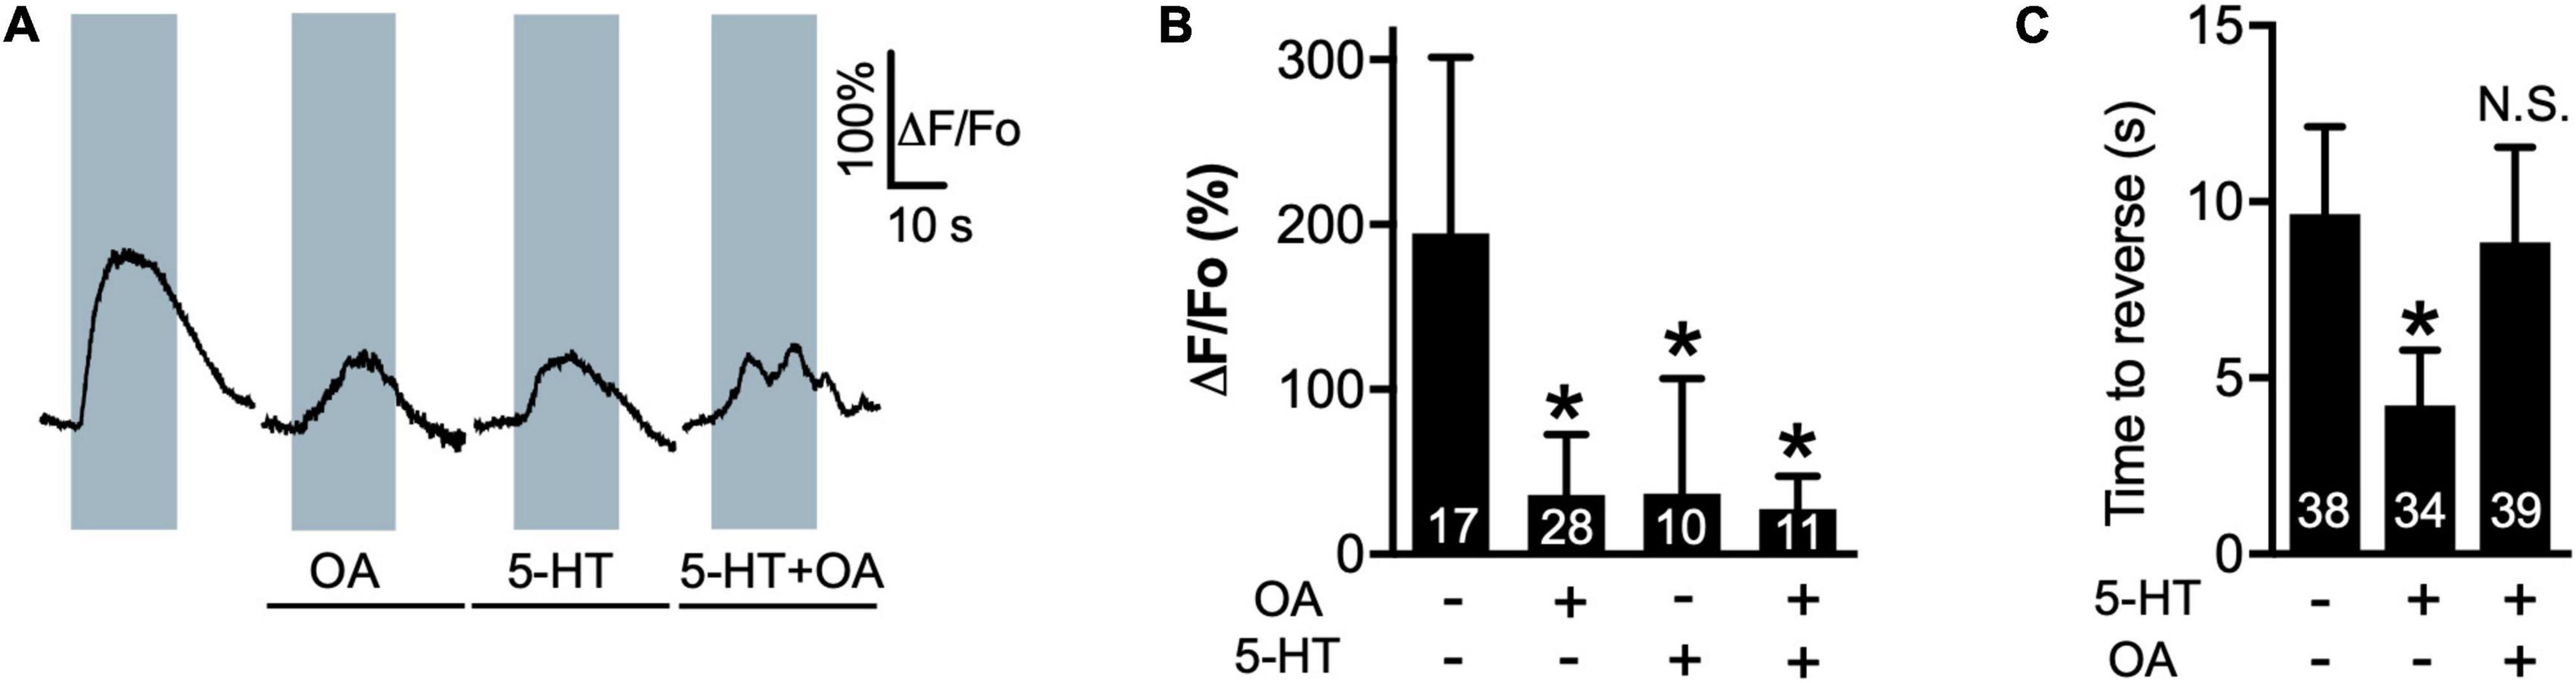
Figure 1. OA reverses 5-HT modulation of 1-oct avoidance behavior but does not reverse 5-HT modulation of somal Ca2+ transients in ASH. (A) Representative traces of ASH somal Ca2+ transients in response to 1-oct exposure in control (far left), OA, 5-HT, and 5-HT + OA treated worms. Gray boxes represent duration of 1-oct exposure. (B) Quantification of 5-HT and OA effects on 1-oct-induced ASH somal Ca2+ transients. (C) OA antagonizes 5-HT potentiation of 1-oct avoidance behavior (30% 1-oct stimulus). *Significantly different from untreated control (p < 0.0001, ANOVA). N.S., not significantly different compared with untreated control (p > 0.05, ANOVA). ΔF/Fo, change in fluorescence relative to original fluorescence intensity. Values are mean ± SD. Numbers within bars indicate n.
To better understand how OA signaling affects ASH responses to 1-oct, we further investigated the OA intracellular signaling cascade. We investigated octr-1 null mutants to test the potential role for the OCTR-1 receptor, based on previous behavioral results (Wragg et al., 2007). OCTR-1 is a GPCR in C. elegans homologous to the mammalian α2A adrenoceptor (Sellegounder et al., 2018). OCTR-1 binds OA with high affinity and tyramine with lower affinity (Wragg et al., 2007), and activates Go signaling when expressed in Xenopus oocytes (Mills et al., 2012). The octr-1 promoter drives expression in ASHs as well as several other neurons and non-neuronal cells (Wragg et al., 2007). OCTR-1 is involved in innate immunity and the unfolded protein response in C. elegans (Liu et al., 2016; Sellegounder et al., 2018), and plays a key role in the OA modulation of 1-oct aversive responses (Wragg et al., 2007; Mills et al., 2012). First, we confirmed that OCTR-1 was essential for OA to counteract 5-HT potentiation of 1-oct avoidance behavior in our hands (Figure 2A, compare to Figure 1C), which had been reported previously (Wragg et al., 2007). We then showed the OA-dependent reduction in 1-oct-stimulated Ca2+ transients in the ASH soma was absent in octr-1 mutants (Figure 2B). These findings suggest that OCTR-1 initiates a signaling cascade which inhibits both ASH somal Ca2+ transients and avoidance behavior. OCTR-1 couples to Go in Xenopus oocytes (Mills et al., 2012) and Go signaling is required in ASHs for OA signaling based on neuron-specific RNAi experiments (Harris et al., 2010). To provide further evidence for Go signaling involvement, we examined worms expressing PTX under the control of the osm-10 promoter, which expresses strongly in ASH and weakly in ASI (Hofler and Koelle, 2011). PTX inactivates Go signaling through ADP-ribosylation of Gαo (Gierschik, 1992; Darby and Falkow, 2001). OA inhibition of 5-HT potentiation was defective in these transgenic strains, while 5-HT potentiation itself, and OA inhibition in wild type controls tested in the same experiment, were both normal (Figure 2C), confirming a role for Go signaling downstream of OCTR-1 in OA modulation of aversive behavior. Unfortunately, we could not test OA modulation of ASH somal Ca2+ transients in the ASH::PTX transgenic strains because they also expressed a strong GFP marker in ASH which interfered with GCaMP imaging. Instead, we performed Ca2+ imaging in ASHs of goa-1 mutants, which lack Gαo and are therefore defective in Go signaling (Ségalat et al., 1995). OA failed to inhibit 1-oct induced somal ASH Ca2+ transients in the goa-1 background (Figure 2D), demonstrating a role for Go signaling downstream of OCTR-1 in OA modulation of somal Ca2+ transient amplitudes as well. Taken together, these results support a model in which OA activates OCTR-1 and Go signaling in ASHs, leading to reduced somal Ca2+ transient amplitudes in ASHs and behavioral inhibition.

Figure 2. OCTR-1 and GOA-1 are required for OA effects on 1-oct-stimulated avoidance behavior and ASH somal Ca2+ signals. (A) OA fails to antagonize the 5-HT potentiation of aversive behavior in octr-1 null mutants. (B) OA fails to inhibit ASH somal Ca2+ transients in octr-1 null mutants. (C) The ability of OA to reverse 5-HT signaling is evident in wild type animals (left three bars), but absent in ASH::PTX animals (right three bars) (30% 1-oct stimulus). 5-HT signaling is unaffected in ASH::PTX animals. (D) OA does not inhibit ASH somal Ca2+ transients in goa-1 null mutants. *Significantly different from untreated control (p < 0.0001, ANOVA). N.S., not significantly different compared with untreated control (p > 0.05, unpaired t-test). ΩSignificantly different from untreated wild type (p < 0.0001, ANOVA). ΨSignificantly different from 5-HT treated wild type (p < 0.0001, ANOVA) but not significantly different from untreated wild type (p > 0.05, ANOVA). †Significantly different from untreated ASH::PTX animals (p < 0.0001, ANOVA) but not significantly different from 5-HT treated wild type. φNot significantly different from 5-HT treated ASH::PTX animals (p > 0.05, ANOVA) but significantly different from untreated ASH::PTX animals (p < 0.0001, ANOVA. Values are mean ± SD. Numbers within bars indicate n.
How does OCTR-1/Go signaling modulate ASH responses to 1-oct? Gαo can inhibit olfactory transduction in mammalian olfactory receptor cells (Corey et al., 2021), suggesting that OA could be inhibiting primary sensory transduction at the ASH cilia, at the amphid openings. Ca2+ influxes in the ASH cilia are due to activation of OSM-9/OCR-2 TRP channel, downstream of odorant binding to its receptor (Ferkey et al., 2021). Therefore, these influxes can be interpreted as a marker of the efficiency of primary sensory transduction, upstream of any potential effect on cellular excitability (Williams et al., 2018b). 1-oct exposure caused a sharp rise in the Ca2+ signal in the amphid region which was not significantly decreased by OA incubation (Figures 3A–C), suggesting that OA did not affect the primary olfactory transduction cascade.
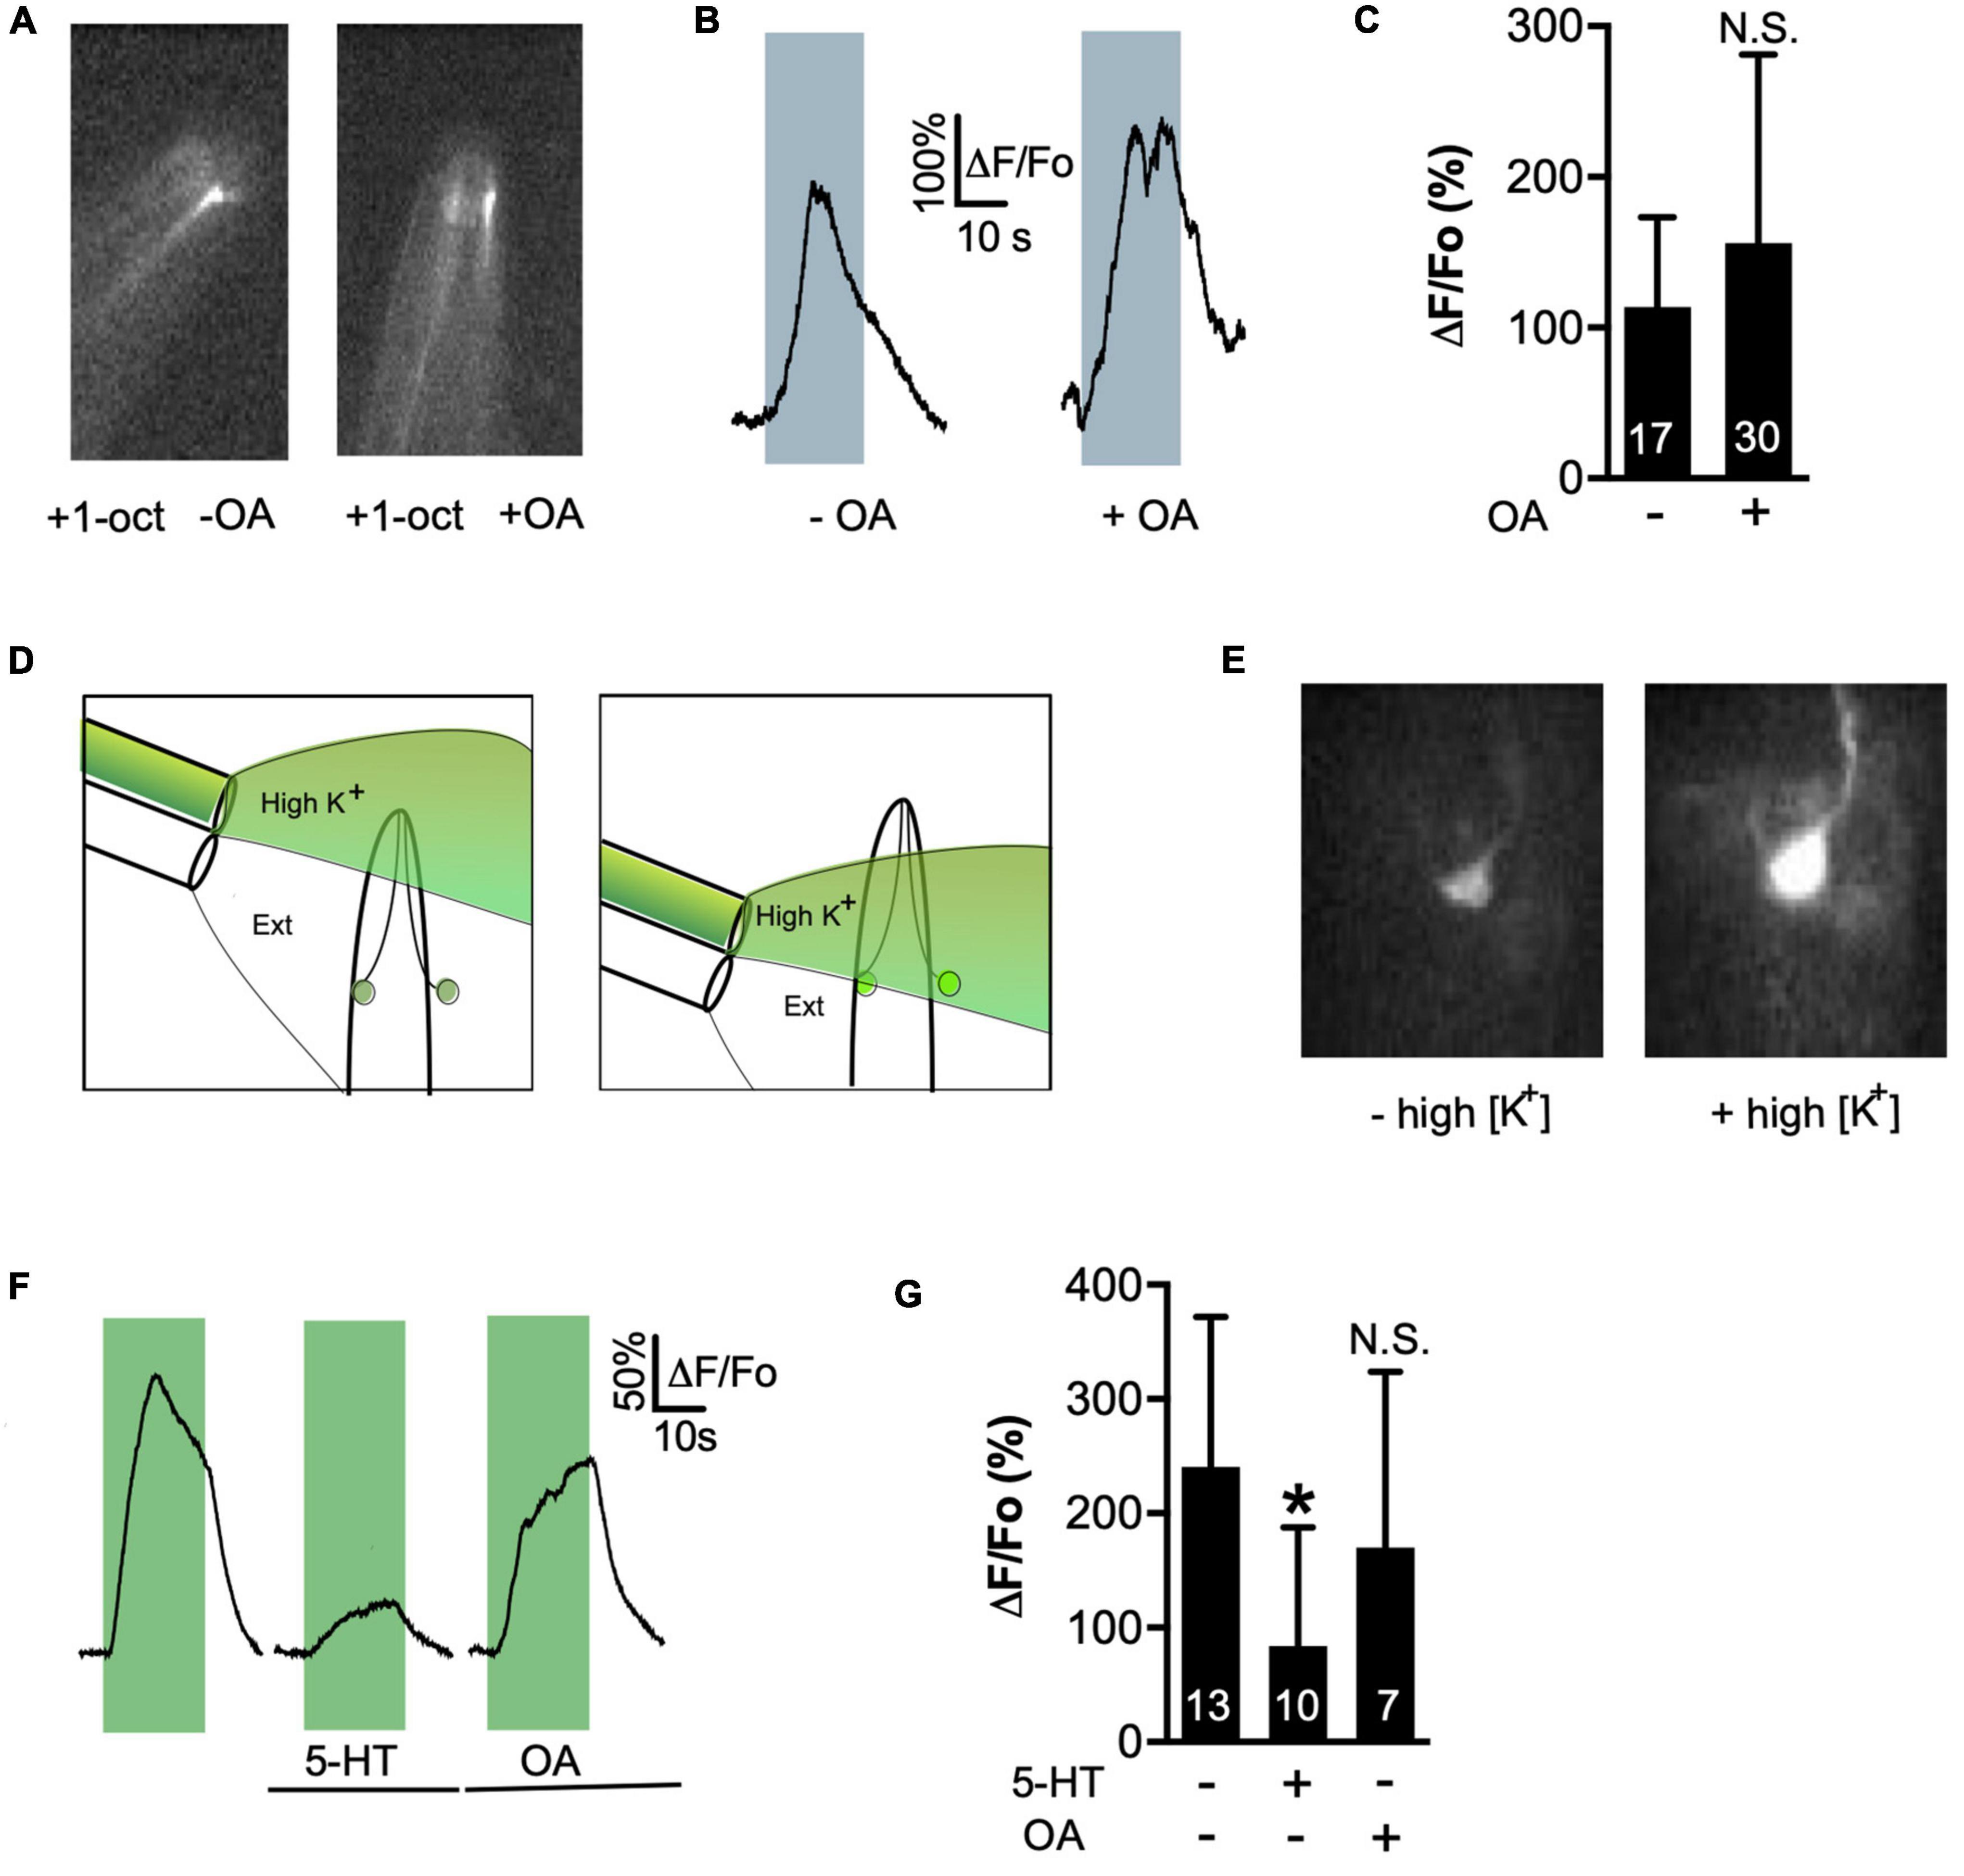
Figure 3. OA does not inhibit primary signal transduction of 1-oct or L-VGCC activity. (A,B) Ca2+ transients induced by 1-oct in wild-type ASH amphids. Gray boxes in (B) represent duration of 1-oct exposure. (C) Quantification of amphid Ca2+ signals. N.S., not significantly different from untreated counterpart (p = 0.1966, unpaired t-test). (D) Experimental approach for high K+ stimulation of ASH neurons, showing the two-barrel puffer used to deliver the stimulus. Puffer is mounted on a motorized drive and can be moved to deliver stimuli at precise intervals (i.e., compare left and right panels). Neuron on right is partially dissected and exposed to bath. (E) Images of GCaMP3 fluorescence in a dissected ASH soma before (left) and during (right) exposure to 30 mM K+ solution. (F) Representative traces of high K+-stimulated somal Ca2+ transients. Green boxes represent duration of high K+ exposure. (G) Quantification of 5-HT and OA effects on high K+-stimulated somal Ca2+ signals. *Significantly different from untreated control (p = 0.0196, ANOVA). N.S., not significantly different from untreated control (p = 0.4799, ANOVA). Values are mean ± SD. Numbers within bars indicate n.
An alternative mechanism for OA to reduce ASH Ca2+ transients could be direct inhibition of L-type VGCCs by OA signaling. We previously observed this phenomenon in the ASH soma, where 5-HT signaling through SER-5/Gαq induced the release of Ca2+ from intracellular stores, leading to calcineurin (CaN)-dependent dephosphorylation and inactivation of the L-VGCC (Williams et al., 2018b). Go signaling can also directly inhibit L-VGCC activation through Gβγ subunits, which are released upon dissociation of activated heterotrimeric G proteins (Waterman, 2000). To test whether these mechanisms were operating, we depolarized neurons with high K+-containing external solution after partially dissecting worms to expose the soma of one ASH neuron to the bath. Exposure to solutions containing 30 mM K+ reliably depolarizes neurons leading to activation of L-VGCCs, which allows direct inhibition of L-VGCCs by monoamine signaling to be detected (Williams et al., 2018b). Importantly, this approach bypasses any upstream steps in the neuronal activation pathway, so any effect of monoamine signaling would necessarily be due to modulation of L-VGCC open channel probabilities (Williams et al., 2018b). Switching from normal external solution to high K+ external solution led to robust Ca2+ transients in the soma of bath-exposed ASH neurons (Figures 3D,E). These transients were strongly inhibited by 5-HT treatment, as previously reported (Williams et al., 2018b), but were not significantly reduced by OA treatment (Figures 3F,G). These results reinforce our conclusion that while 5-HT and OA have similar quantitative effects on somal Ca2+ transients in ASH neurons, the underlying signal transduction pathways of the two monoamines are very different.
Go signaling can also hyperpolarize neuronal membranes through the activation of GIRK channels by Gβγ subunits (Kano et al., 2019). OCTR-1, heterologously expressed in Xenopus oocytes, is capable of signaling in this manner (Mills et al., 2012). The C. elegans genome contains three GIRK genes (irk-1, irk-2, and irk-3), which are widely expressed in the nervous system (Emtage et al., 2012; Hobert, 2013; WormBase, 2022). Therefore, we hypothesized that these IRK proteins could play a role downstream of OCTR-1/Go. To test the potential involvement of GIRK channels in OA signaling, we performed calcium imaging in the three different GIRK null mutants (irk-1, irk-2, and irk-3). OA did not significantly inhibit ASH somal Ca2+ transients in the irk-2 and irk-3 null backgrounds but produced normal inhibition in the irk-1 background (Figure 4). This result indicates that IRK-2 and IRK-3 are required downstream of OCTR-1/Go signaling and suggests that the OA inhibition of ASH somal Ca2+ transients is due to reduction of ASH excitability. Behavioral analysis revealed a role for all three GIRK channels in OA modulation of 1-oct avoidance, but the results did not cleanly correspond to the circumscribed role for these channels predicted by our model for OA signaling in ASH (see Discussion), possibly due to the expression of IRK channels in neurons other than ASHs, and the involvement of additional circuits and OA signaling pathways controlling 1-oct aversive responses (Supplementary Figure S2).
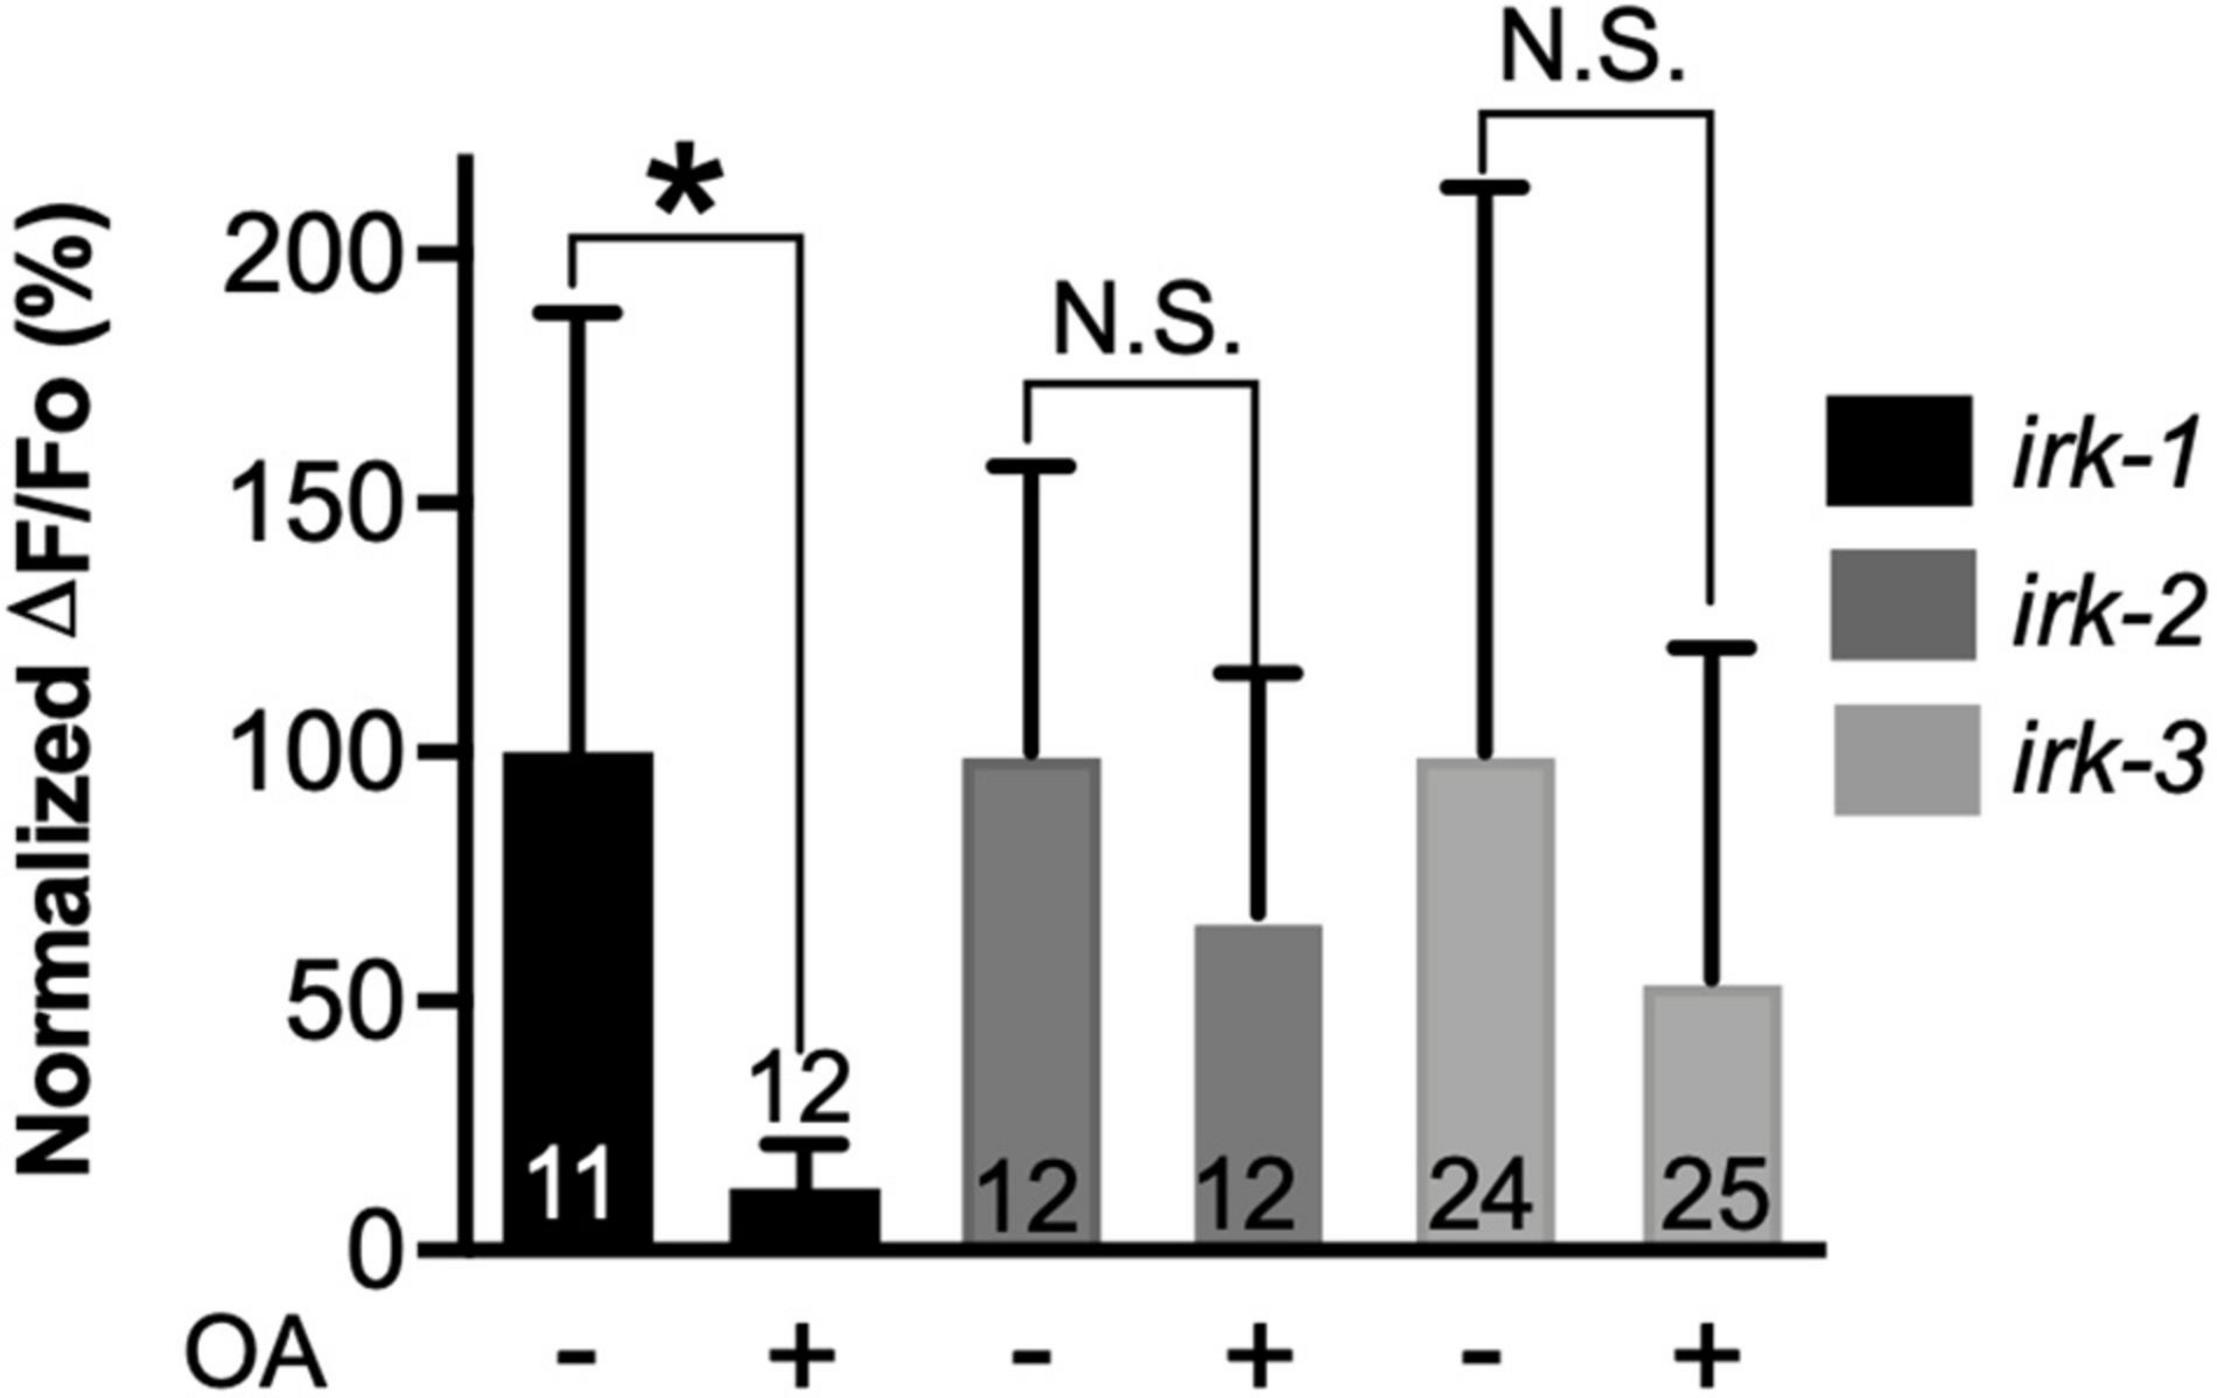
Figure 4. Octopamine inhibition of 1-oct-induced somal Ca2+ transients in ASHs requires IRK-2 and IRK-3. *Significantly different from untreated control (p < 0.005, unpaired t-test). N.S., not significantly different compared with untreated control (p > 0.05, unpaired t-test). Values are mean ± SD. Numbers within bars indicate n.
To determine whether OA reduces ASH excitability, we performed direct electrophysiological recordings on the ASHs. These recordings are performed on partially dissected worms in which an ASH soma is exposed to the bath, taking care not to sever the dendritic process connecting the soma to the amphid opening (Zahratka et al., 2015; Williams et al., 2018b). Dissection and proper placement of flow pipettes generally takes longer than the perdurance of OA signaling when worms are pre-incubated on OA plates, which was the approach used in the above experiments (see section “Materials and Methods”). Therefore, it was necessary to treat ASHs with OA after they had been dissected. Incubation of C. elegans with monoamines on plates requires very high concentrations because of low cuticular permeability to polar compounds, which prevents accurate determination of effective internal monoamine concentrations (Williams et al., 2018a). Therefore, it was first necessary to determine a minimal effective concentration of OA for these electrophysiological experiments. Using Ca2+ imaging in the exposed ASH soma as a readout, we performed paired recordings on individual neurons before and after exposure to OA at 1, 10, and 100 nM for 60 s (Figure 5A). 1-oct responses were unaltered at 1 nM OA, but significantly decreased at 10 and 100 nM (Figures 5B,C), establishing 10 nM as an appropriate OA concentration, comparable to the minimal effective concentrations observed for 5-HT receptors from C. elegans and other species (Adolph and Tuan, 1972; Bunin and Wightman, 1998). Significantly, octr-1 mutants did not show reduced 1-oct dependent Ca2+ transients after 10 nM OA treatment (Figures 5B,C), confirming that OCTR-1 is the relevant receptor for OA inhibition of ASH somal Ca2+ transients under these conditions. A second OA receptor, SER-3, also acts in ASHs at higher OA concentrations (Mills et al., 2012), but ser-3 mutants still showed inhibition of 1-oct Ca2+ transients in the presence of 10 nM OA, confirming the central role for OCTR-1 in OA modulation of somal Ca2+ transients in ASH.
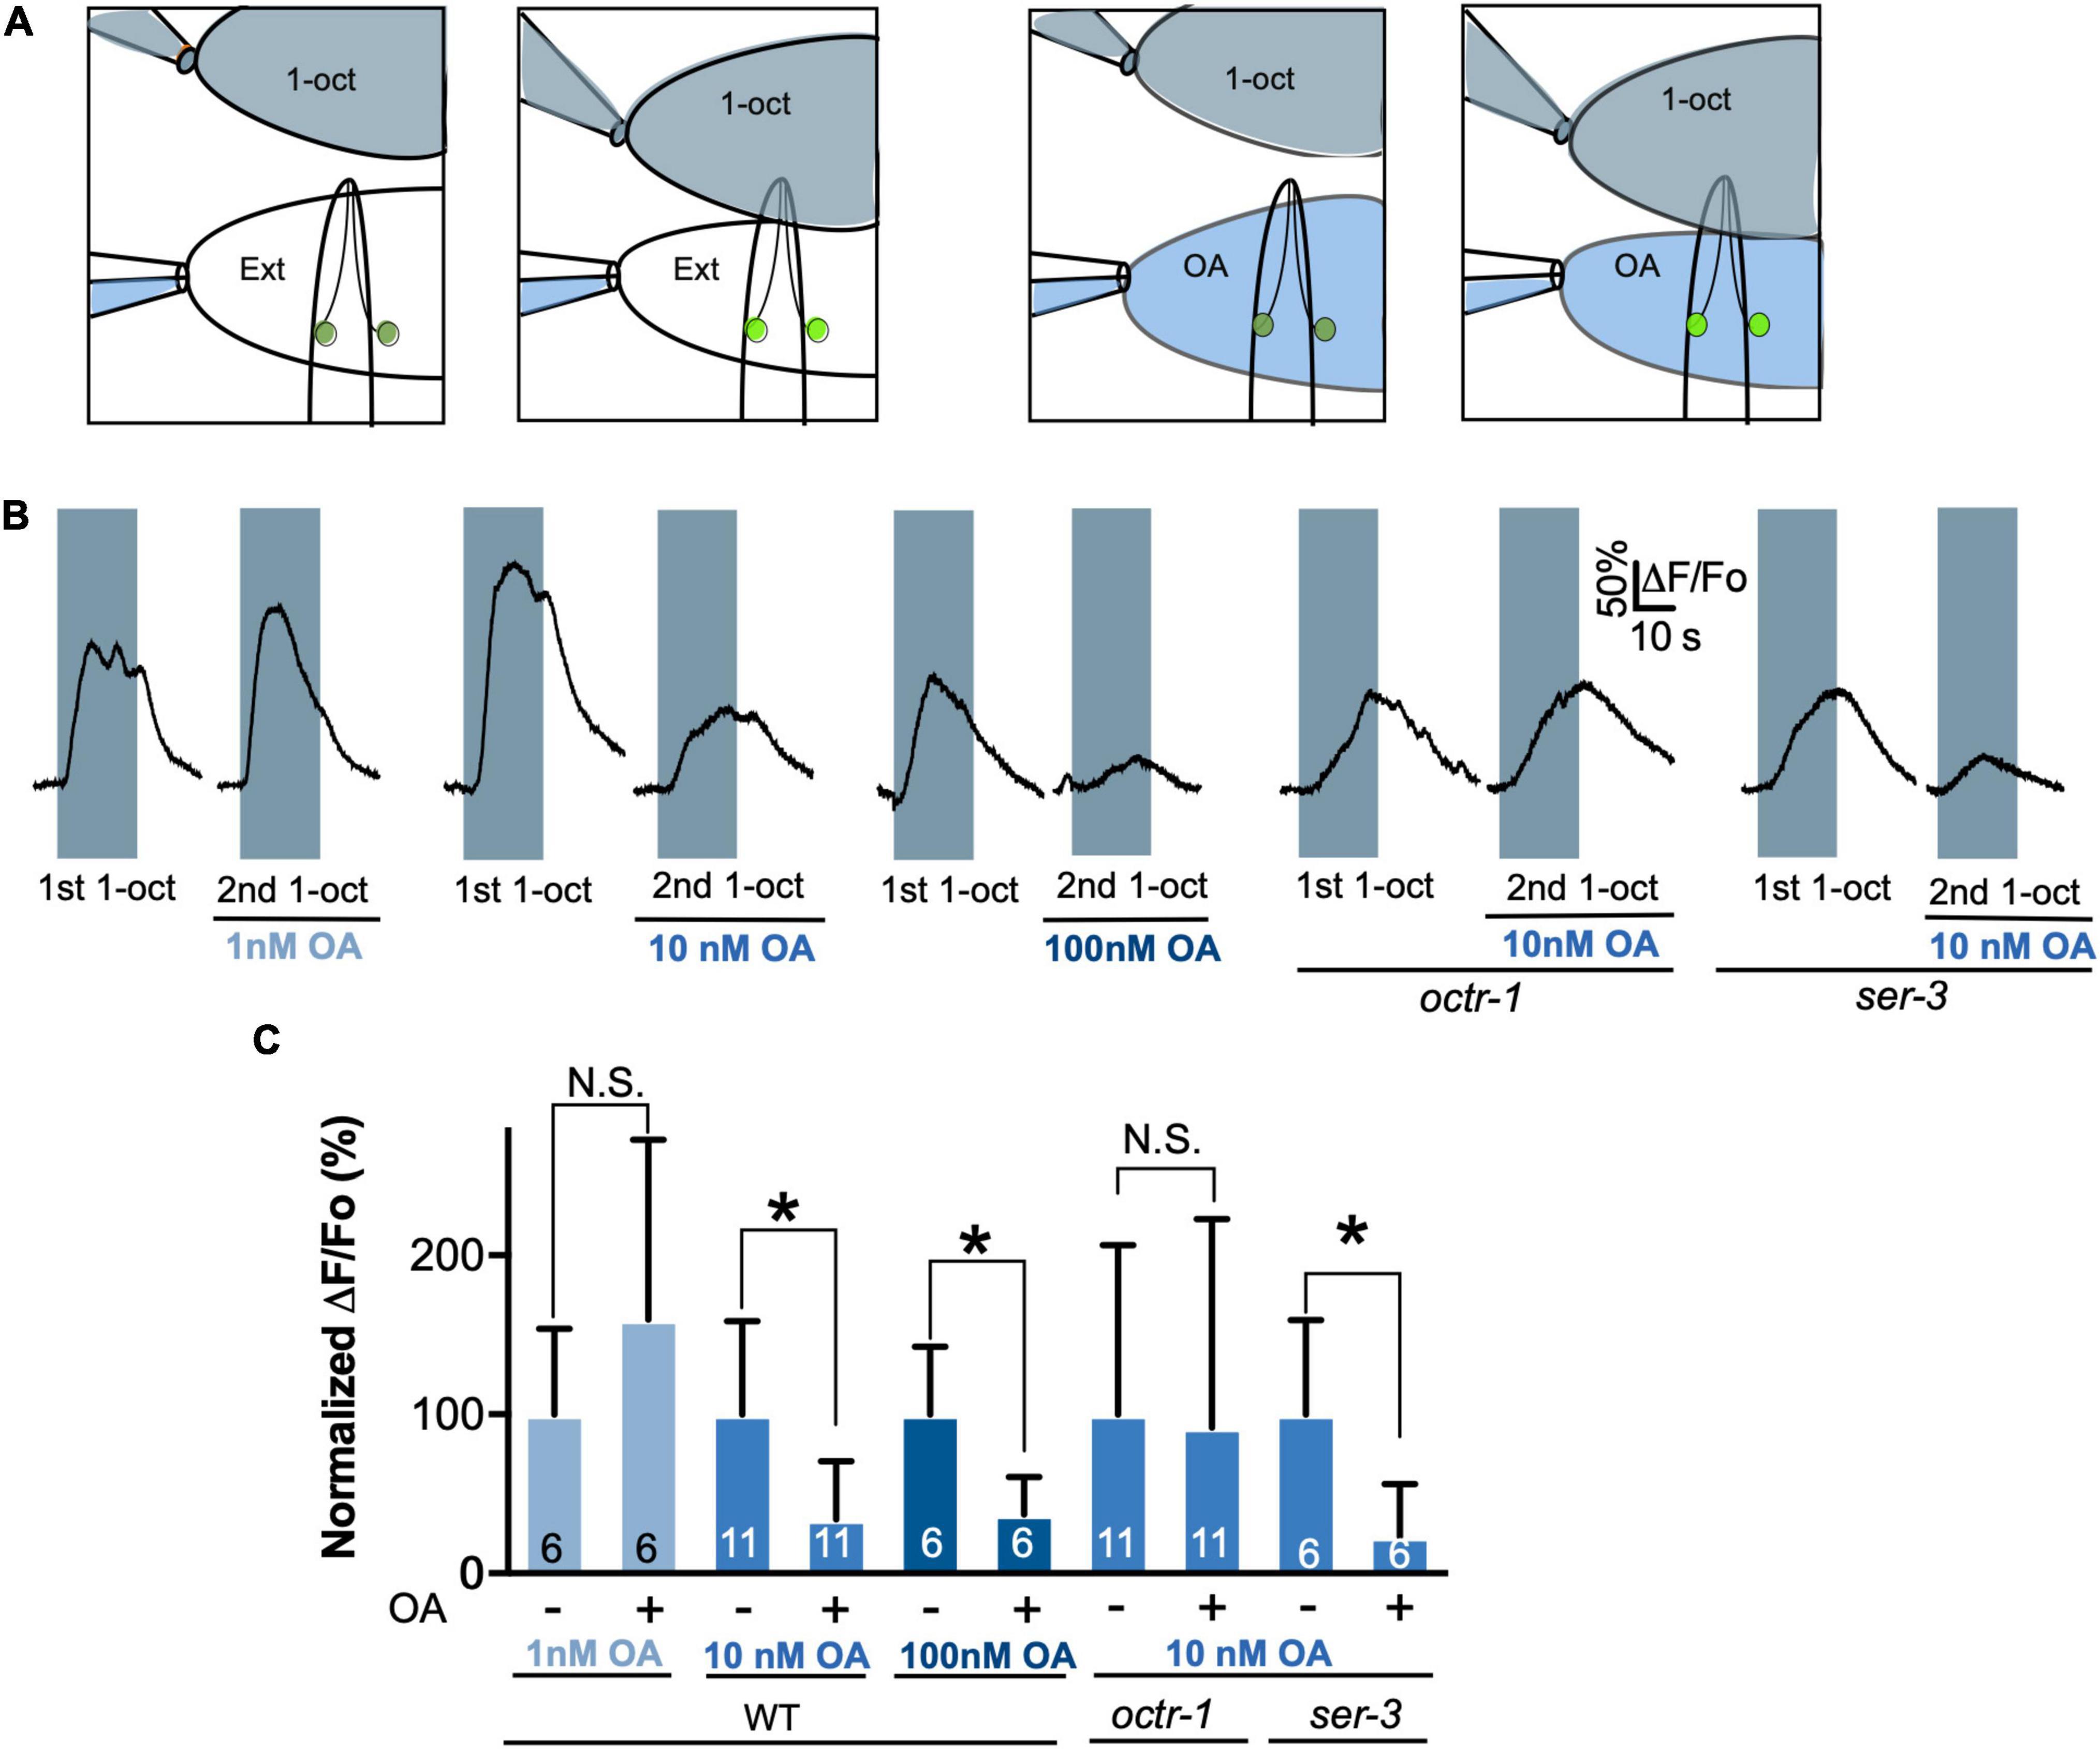
Figure 5. Determination of the physiological concentration range for OA/OCTR-1 signaling. (A) Diagram illustrating dual pipette perfusion system. Upper pipette delivers the olfactory stimulus, which is a saturated solution of 1-oct in external solution (shaded gray). Pipette is mounted on a motorized drive, which is moved to deliver stimuli at precise intervals. Lower pipette delivers external solutions, with or without OA, separated from one another by a glass septum that allows for rapid switching. This stream also deflects the 1-oct solution away from the exposed cell body to prevent direct contact of the exposed cell soma with 1-oct. (B) Representative traces of 1-oct-stimulated ASH somal Ca2+ transients at various OA concentrations in wild type and OA receptor mutants. Gray boxes represent duration of 1-oct exposure. (C) Quantification of 1-oct induced ASH somal Ca2+ transients. *Significantly different from untreated control (p < 0.05, paired t-test). N.S., not significantly different compared with untreated control (p > 0.05, paired t-test). Values are mean ± SD. Numbers within bars indicate n.
Patch clamp recordings demonstrated that OA treatment reduced the amplitude of 1-oct-induced depolarization in ASHs. In control samples, exposing the tip of the worm’s nose to 2.2 mM 1-oct in external solution (a saturating concentration) resulted in a slowly developing +15 mV depolarization which returned to baseline following 1-oct removal (Figures 6A,C), comparable to previously published results (Zahratka et al., 2015; Williams et al., 2018b). The placement of flow pipettes provided a constant stream of clean external solution to the ASH soma, shielding it from direct 1-oct exposure (Figure 6A), so we can confidently attribute the observed depolarization to olfactory signaling at the ASH sensory ending (Zahratka et al., 2015), not the direct exposure of the ASH soma to 1-oct. Sixty second pre-treatment of the ASH soma with 10 nM OA significantly reduced this 1-oct response (Figures 6B,C). While OA signaling inhibited 1-oct-dependent depolarization, it did not appear to hyperpolarize ASH neurons at rest, since somal Ca2+ levels in individual bath-exposed ASHs were not decreased by 10 nM OA application (Figure 6D). This result implies that the membrane potential of unstimulated ASH neurons may be at or near the K+ reversal potential. Based on these results, we conclude that OA inhibition of 1-oct-stimulated Ca2+ transients in the soma of ASH neurons reflects Go-dependent activation of GIRK channels leading to reduced neuronal depolarization, which stands in contrast to 5-HT inhibition of ASH somal Ca2+ transients, which reflects Gαq-dependent inhibition of L-VGCCs leading to enhanced neuronal depolarization.
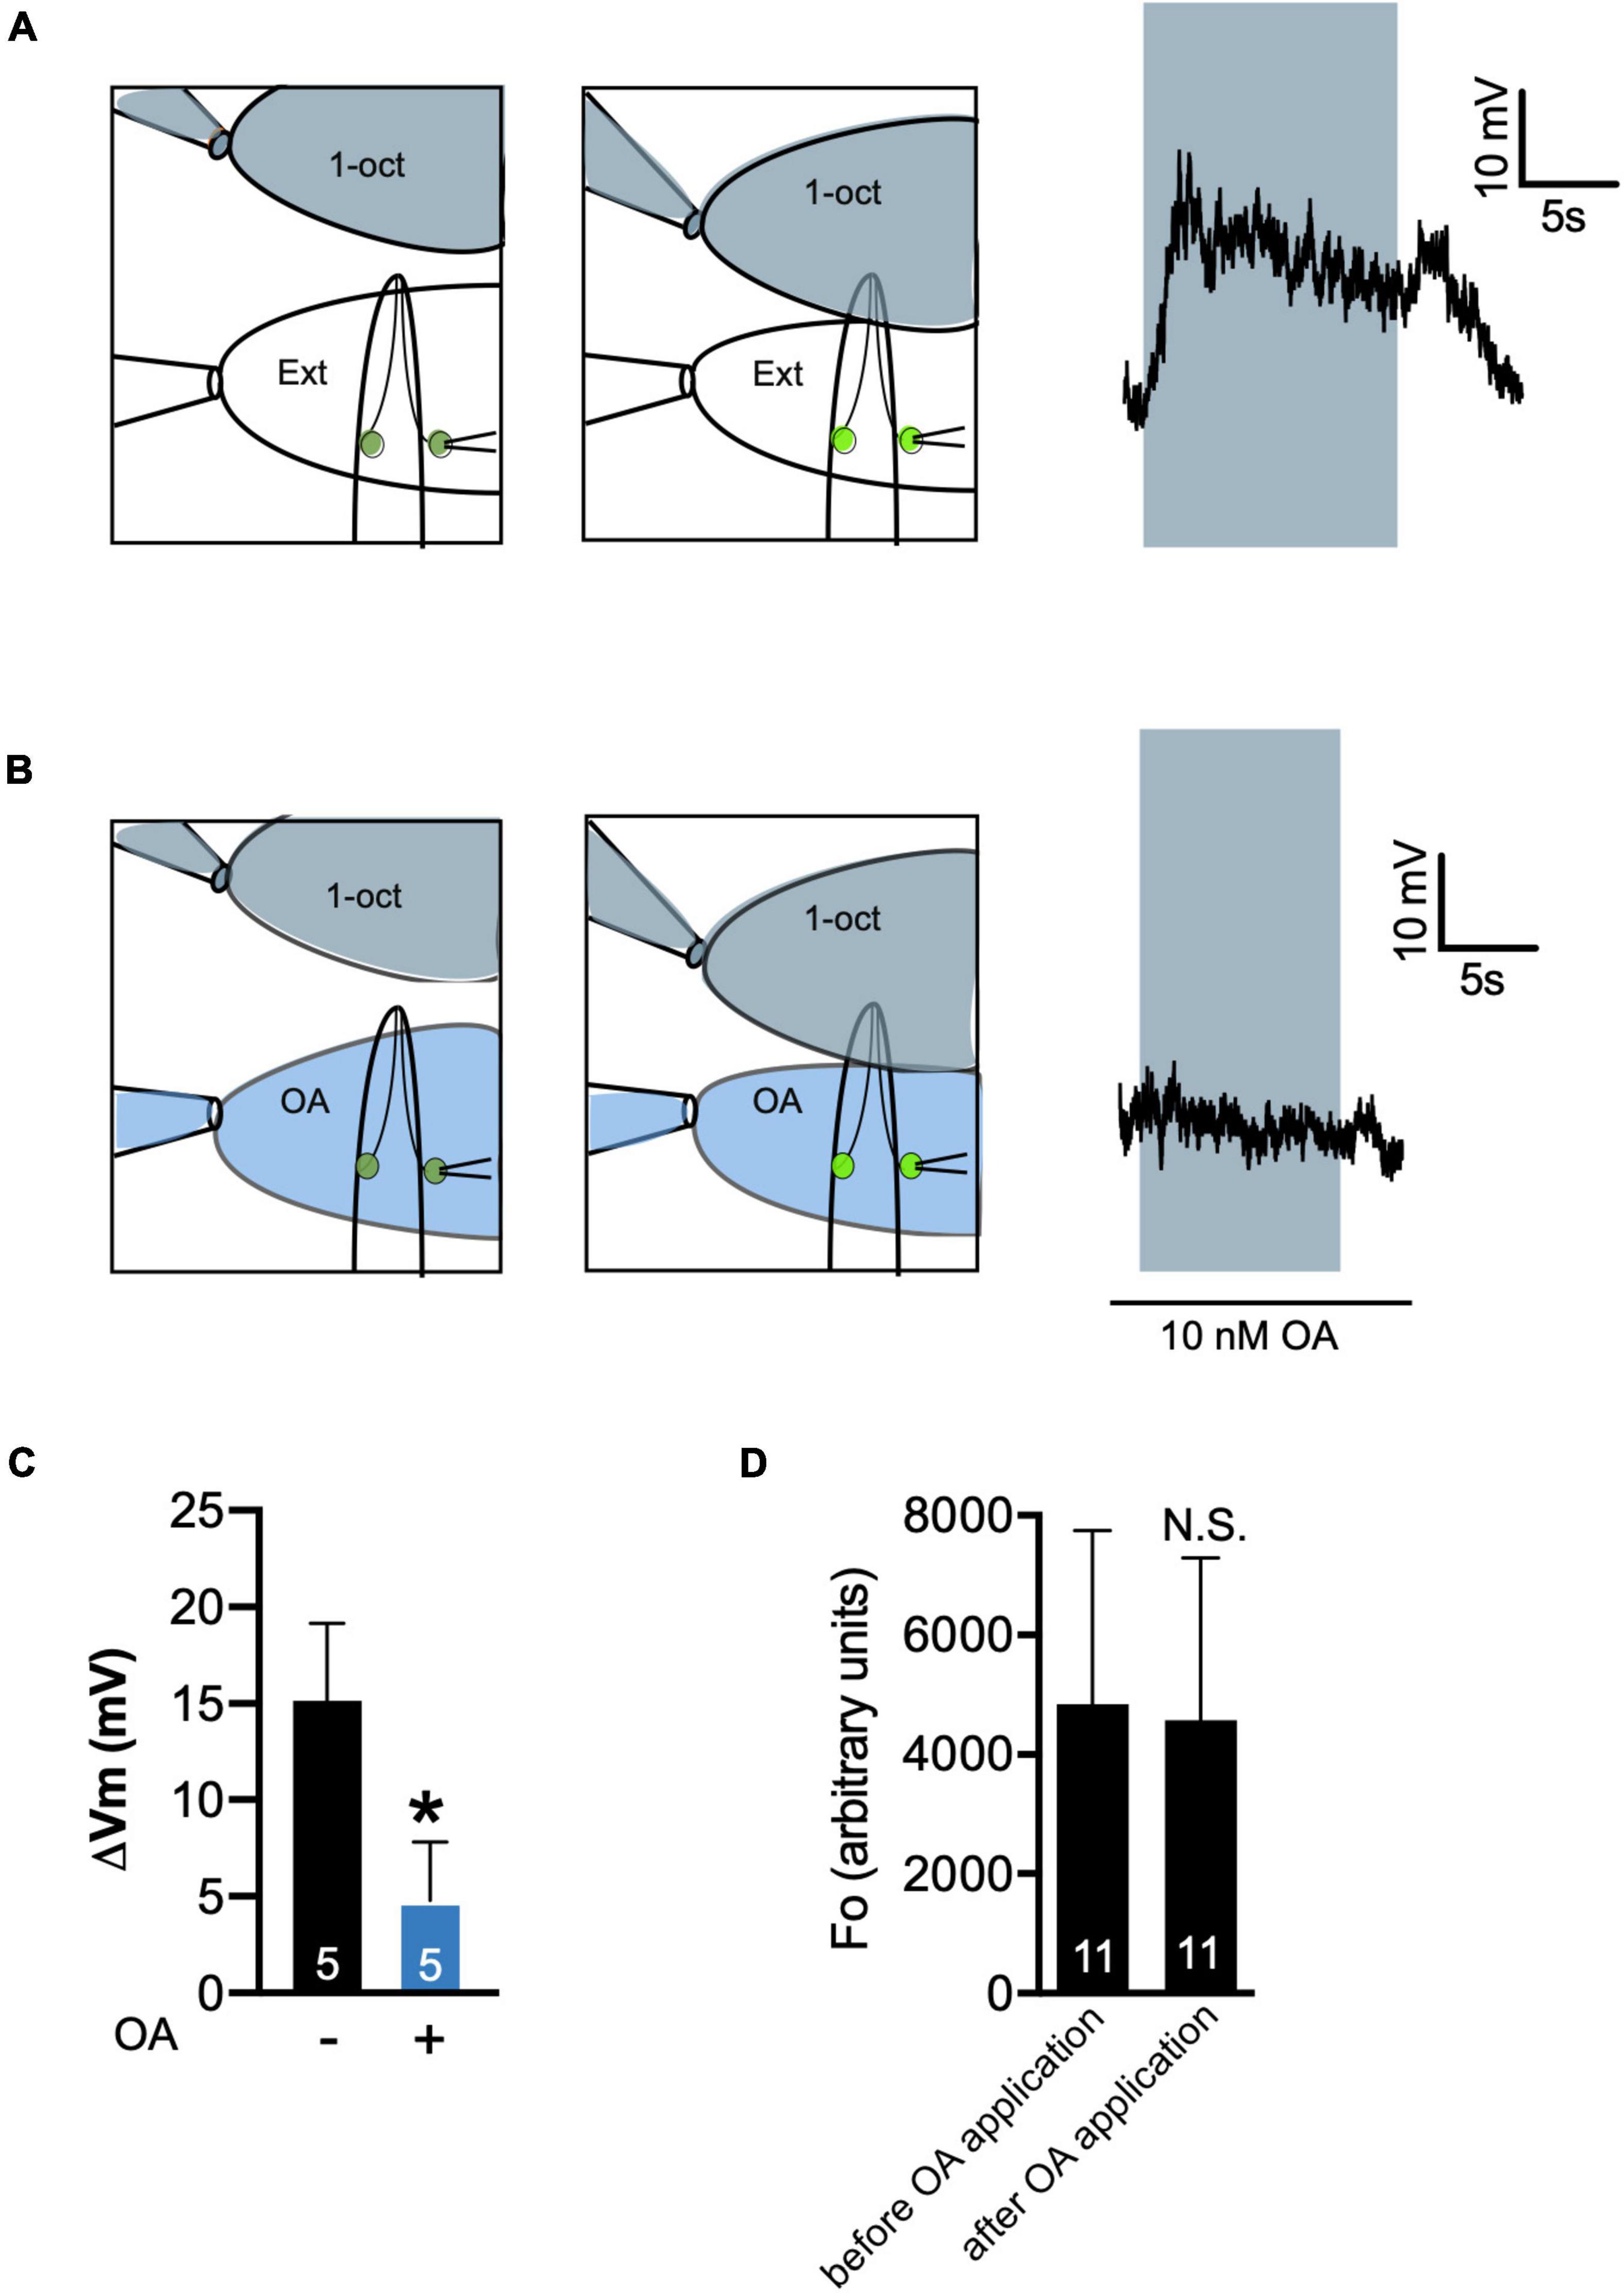
Figure 6. Octopamine inhibits 1-oct-stimulated depolarization in ASH neurons. (A,B) Recording protocol (left) and representative trace (right) of 1-oct-stimulated depolarization in ASH in the absence (A) and presence (B) of 10 nM OA. 1-Oct solution shaded gray, 10 nM OA shaded blue, neuron on right exposed to bath to provide access to the patch pipette. Gray box over trace indicates duration of 1-oct exposure. (C) Quantification of OA inhibition of ASH depolarization. ΔVm, change in membrane potential. (D) OA treatment does not decrease resting Ca2+ levels in the soma of ASH neurons. Average somal GCaMP3 fluorescence values in bath-exposed ASH neurons before and after 10 nM OA application. N.S., not significantly different compared with untreated control (p > 0.05, paired t-test). *Significantly different from untreated control (p < 0.005, unpaired t-test). Values are mean ± SD. Numbers within bars indicate n.
Neuromodulators increase or decrease neuronal excitability in a graded manner to regulate neural circuit outputs. Measuring these changes using Ca2+ imaging in intact circuits is a critical tool for understanding how neuromodulators affect animal behavior. Therefore, it is essential to correctly interpret quantitative changes in Ca2+ transient amplitudes when studying neuromodulator actions at the circuit level. Because neuronal Ca2+ transients are the result of the activation of VGCCs, it is frequently assumed that increased Ca2+ transient amplitudes indicate increased depolarization amplitudes and vice versa. However, ASH neurons in C. elegans exhibit the opposite correlation when modulated by 5-HT, with decreasing somal Ca2+ transients indicating increased depolarization. To determine whether this unexpected relationship holds true consistently for this cell type, we investigated how another neuromodulator, OA, affects the ASH neuron. We show that OA utilizes a completely independent signaling pathway, inhibiting ASH somal Ca2+ transients and ASH depolarization in parallel. Therefore, quantitative relationships between somal Ca2+ signal amplitudes and depolarization amplitudes may be different even within a single cell type.
Detailed analysis of ASH signaling reveals three signaling pathways operating in an integrated manner to regulate excitability (Figure 7). The main sensory activation pathway depolarizes the neuron, which leads to synaptic vesicle fusion, the release of neurotransmitters onto postsynaptic targets, and initiation of aversive locomotory responses (Bargmann et al., 1993; Chao et al., 2004; Zahratka et al., 2015). However, this pathway branches to activate L-VGCCs, which produce the optically detectable Ca2+ signals in the ASH soma (Mills et al., 2012; Zahratka et al., 2015). This Ca2+ influx does not facilitate or amplify depolarization but actually inhibits it, through negative feedback. This interpretation is supported by action of Nemadipine A, a L-VGCC blocker, which demonstrably reduces the Ca2+ influx while increasing depolarization amplitude (Williams et al., 2018b). 5-HT signaling impinges on the negative feedback branch of the sensory activation pathway. 5-HT activates Gαq signaling (Harris et al., 2009), leading to release of Ca2+ from intracellular stores and the activation of CaN, resulting in dephosphorylation and inhibition of the L-VGCC (Williams et al., 2018b). Thus, for 5-HT, optically measurable Ca2+ transients in the ASH soma decrease while ASH depolarization amplitude increases (Zahratka et al., 2015; Williams et al., 2018b). OA signaling impinges on the main sensory activation pathway. Through the OCTR-1 receptor, OA activates Go signaling resulting in GIRK channel activation, presumably through the release of Gβγ subunits, thus inhibiting the initial 1-oct dependent depolarization. Surprisingly, the recently released CeNGEN neuronal gene expression profile dataset did not show octr-1 or irk-2 expression in ASH neurons (Taylor et al., 2021; WormBase, 2022). However, expression of several other genes which function in adult ASHs was also not detected (Harris et al., 2009; Aoki et al., 2011; Mills et al., 2012; Chatzigeorgiou et al., 2013; Ezcurra et al., 2016). It is possible that some functionally significant neuronal genes become expressed at higher levels in adults than in L4 larvae (the source of the RNA for the transcriptional profiling), or that low abundance transcripts may still be functionally significant even if below the detection threshold of scRNA-seq. However, we cannot rule possible non-cell autonomous roles for octr-1 and irk-2 in modulating ASH responses.
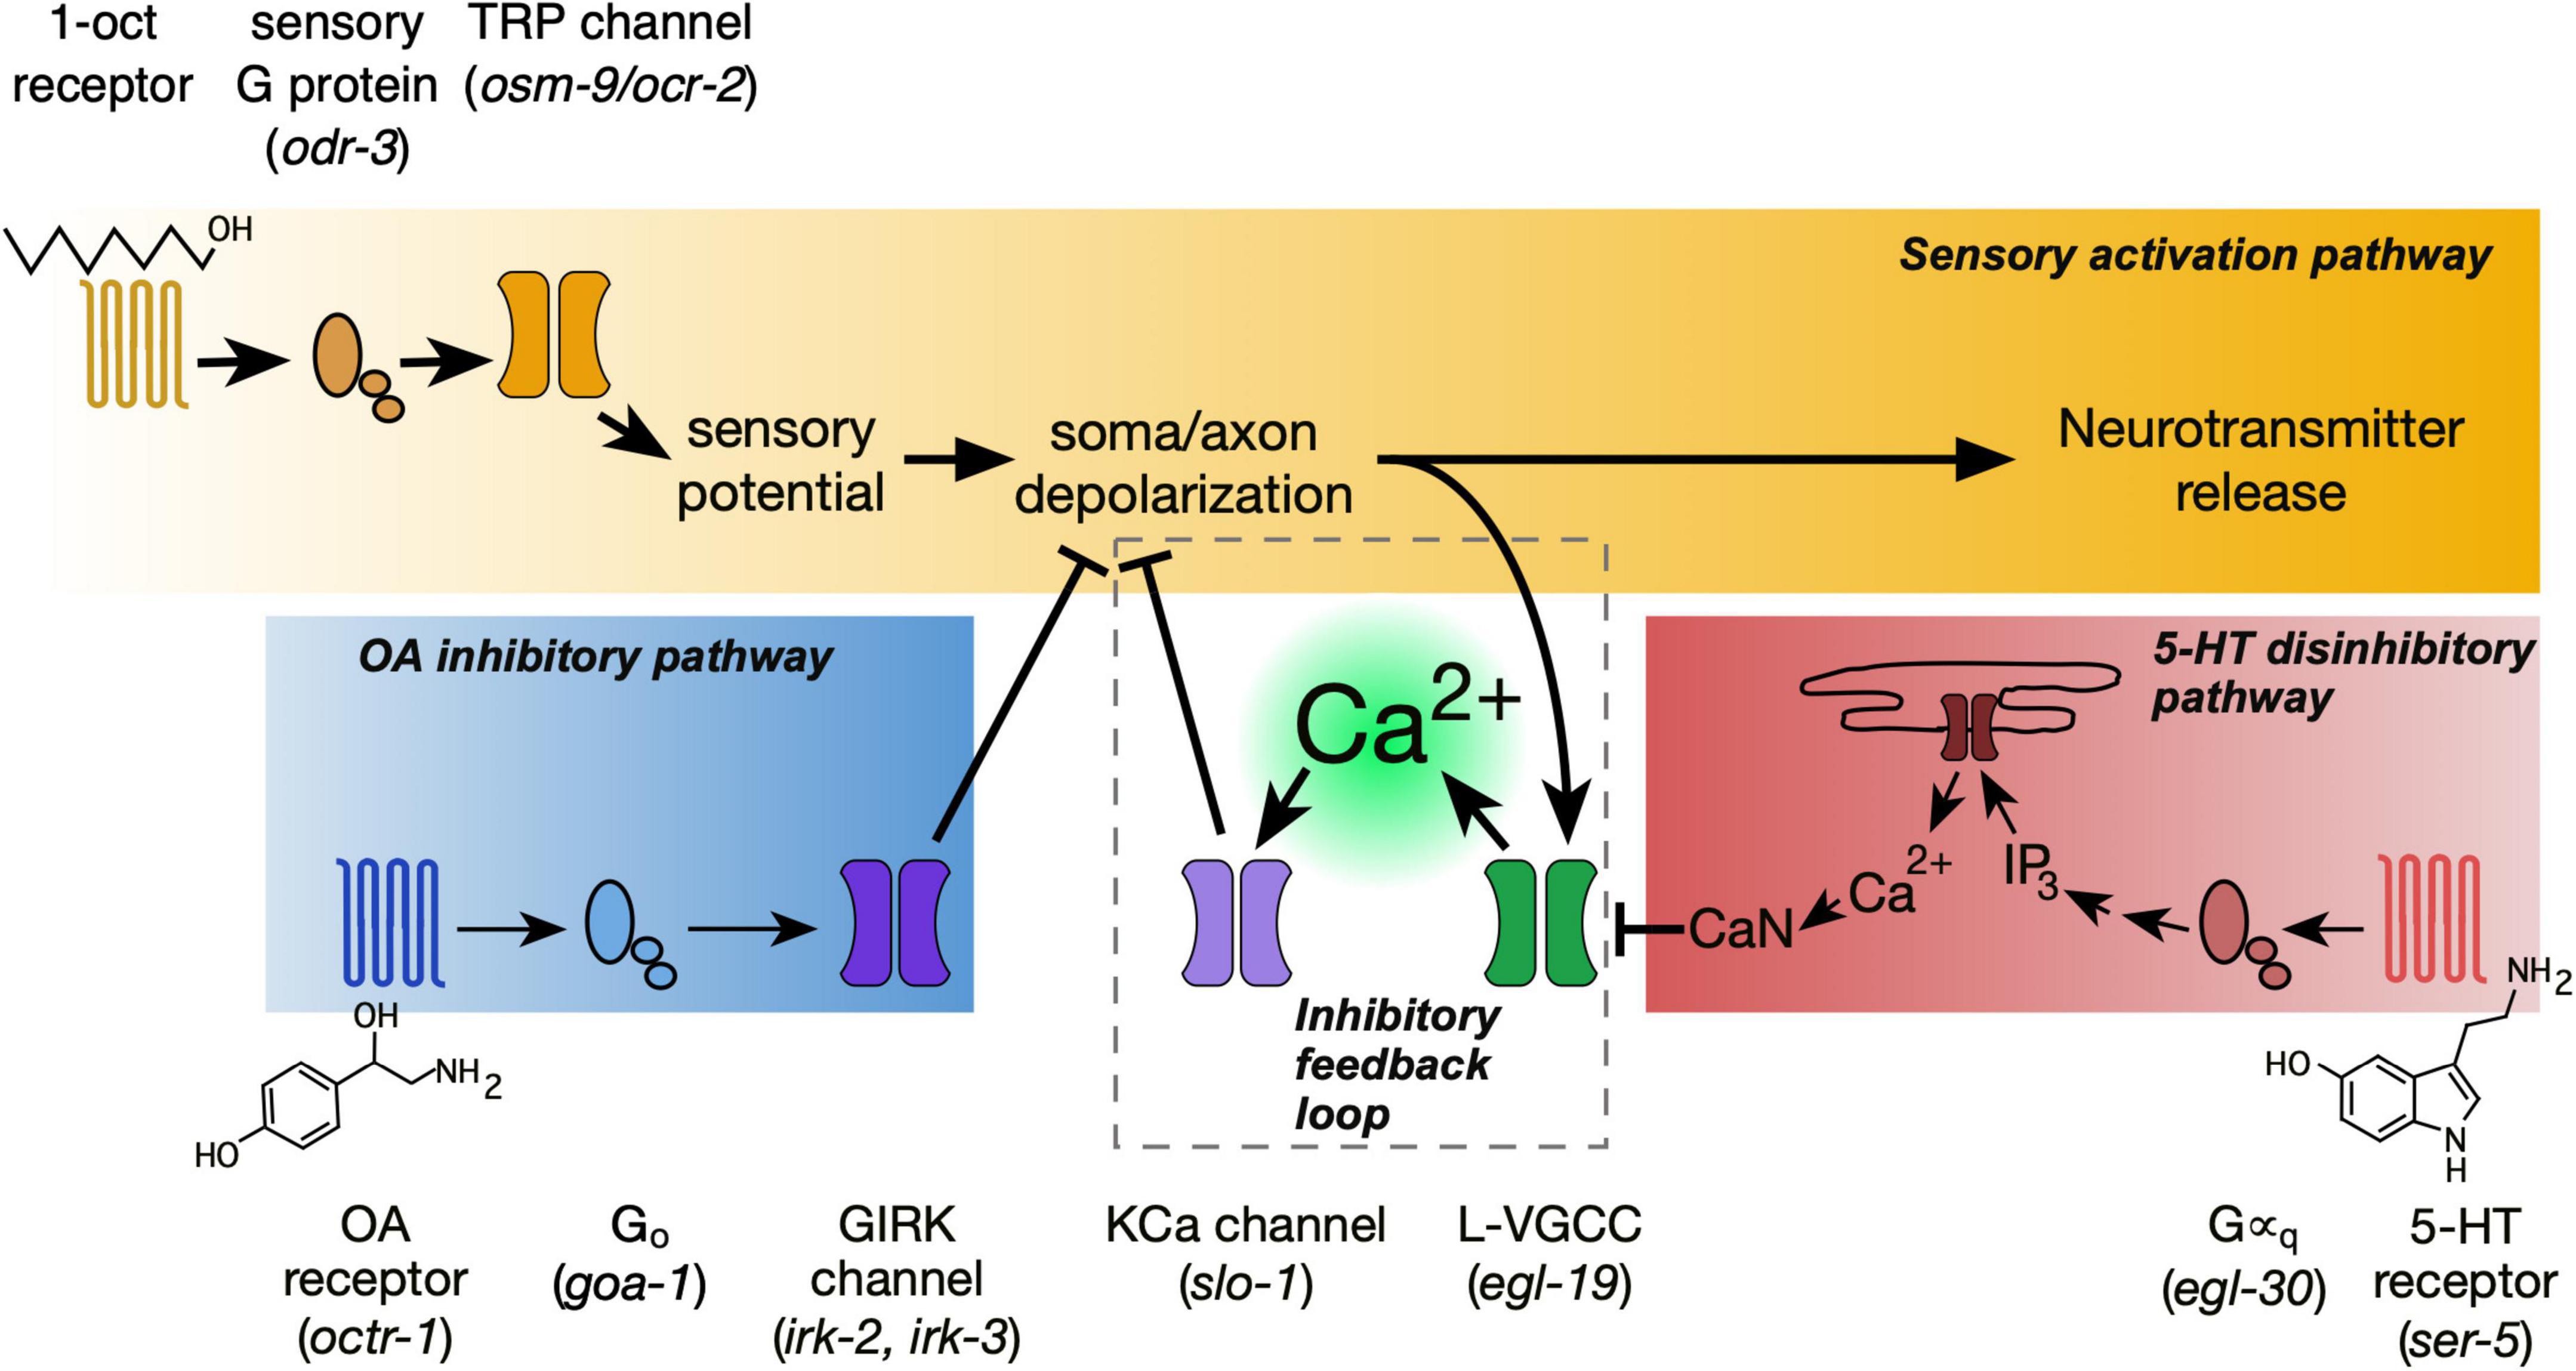
Figure 7. Interacting signaling pathways within the ASH neuron regulate the strength of sensory responses. The sensory activation pathway (gold) depolarizes the neuron, leading to synaptic vesicle release and excitatory signaling to downstream aversive locomotory circuitry. Ca2+ entering through L-VGCCs, responsible for optically measurable somal Ca2+ transients, provides negative feedback on depolarization (dashed box). 5-HT signaling (red) inhibits this Ca2+-mediated inhibition, and therefore disinhibits depolarization. Finally, OA signaling (blue) blocks sensory-dependent depolarization through OCTR-1, Go, and GIRK channels. Identity of signaling proteins indicated by text above and below pathways. Corresponding mutants shown in parentheses.
The respective endpoints of 5-HT and OA signaling in our model explain why OA signaling overrides 5-HT signaling, instead of the other way around. When, in the presence of OA, the ASH soma fails to depolarize, L-VGCC activity remains low. There is little somal Ca2+ influx and little negative feedback on depolarization. With low L-VGCC activity to begin with, any further reduction due to 5-HT signaling will have a comparatively small impact on overall membrane excitability, and therefore will not overcome the OA effect. Furthermore, open GIRK channels may exert a continuous hyperpolarizing influence, which could compensate for any residual decrease in Ca2+-activated K+ channel activity due to 5-HT signaling. These insights underscore the value of studying neural circuit dynamics in small, defined model nervous systems such as C. elegans. Because of the stereotyped anatomy of C. elegans, the pair of ASH neurons may be unambiguously identified from one animal to the next. Therefore, results obtained at different times, with different neuromodulators and different analytical techniques may be cross correlated with high confidence, strongly supporting the interpretation that all three pathways operate together in time and space.
Correctly inferring how neuronal depolarization is modulated based on Ca2+ recording is particularly important where membrane potentials undergo graded changes, as opposed to the all-or-none depolarizations seen with action potentials. In C. elegans (with a few exceptions) (Mellem et al., 2008; Liu et al., 2018) the vast majority of neuronal communication is believed to rely on graded potentials, because C. elegans lacks voltage-gated sodium channels (Bargmann, 1998). C. elegans is a powerful model for understanding sensory motor processing and circuit modulation because of its small size and fully characterized neuronal connectivity. Recently, it has also become possible to perform whole-brain recordings in C. elegans, in which activity patterns for large numbers of neurons may be recorded simultaneously, with each Ca2+ profile assigned to a uniquely identified neuron (Yemini et al., 2021). These powerful tools will significantly advance our knowledge of how intrinsic patterns of neuronal activity are generated, how incoming sensory information impacts those patterns (Kato et al., 2015), and how these circuit dynamics are modulated through monoamine and neuropeptide signaling (Zhang et al., 2005; Harris et al., 2010; Mills et al., 2012; Liu et al., 2022). Comparative genomic, connectomic, and transcriptomic studies have revealed striking parallels in molecular mechanisms and functional organization with mammalian nervous systems, providing a robust framework for applying insights from C. elegans to the human brain (Bargmann, 1998; Milo et al., 2002; Varshney et al., 2011; Rengarajan and Hallem, 2016; Arnatkevic̆iūtė et al., 2018). However, graded changes in membrane potential are also important in nervous systems which do utilize action potentials. Dendrites integrate large numbers of synaptic inputs and perform logical computations based on the strength and geometrical distribution of co-incident excitatory and inhibitory postsynaptic potentials (Stuart and Spruston, 2015), studied extensively using Ca2+ imaging (Roome and Kuhn, 2018; Ali and Kwan, 2020). Active signaling (i.e., dendritic spiking) is observed, facilitating supra-linear summation of multiple inputs (Stuart and Spruston, 2015). However, passive non-regenerative signaling also plays an important role, facilitating linear and sub-linear summation of inputs, which is critical in primary visual and somatosensory cortices (Longordo et al., 2013; Jia et al., 2014; Stuart and Spruston, 2015). The relationship between dendritic Ca2+ signals and depolarization dynamics is clearly complex (Roome and Kuhn, 2018; Ali and Kwan, 2020), and even includes an example, in cortical layer 5 pyramidal neurons, where larger amplitude Ca2+ signals in dendritic spines correlate with smaller excitatory postsynaptic potentials at the cell soma dependent on Ca2+-activated K+ channels (Tazerart et al., 2022), reminiscent of ASH neurons in C. elegans in the presence of 5-HT (Williams et al., 2018b). Insights gained from the study of ASH neurons into neuromodulatory mechanisms and, especially, the relationship between Ca2+ signaling intensity and membrane excitability may prove to be particularly relevant to dendritic signal processing, given that all of the major signaling proteins involved in modulation of ASHs are found localized to dendrites in mammalian neurons (Halpain et al., 1998; Vardi, 1998; Hartmann et al., 2004; Chen and Johnston, 2005; Segal and Korkotian, 2014; Sekerková et al., 2014; Cha et al., 2019; Xu et al., 2022).
The raw data supporting the conclusions of this article will be made available by the authors, without undue reservation.
AD, PW, and BB contributed to conception of research. AD and BB designed the research, interpreted the results of experiments, prepared the figures, and wrote the manuscript. AD performed the experiments and analyzed the data. All authors contributed to the article and approved the submitted version.
This work was supported by the Ohio Third Frontier Technology Validation Startup Fund (17-0063) and The University of Toledo deArce-Koch Memorial Endowment Program. Some strains were provided by the CGC, which was funded by the NIH Office of Research Infrastructure Programs (P40 OD010440).
The authors declare that the research was conducted in the absence of any commercial or financial relationships that could be construed as a potential conflict of interest.
All claims expressed in this article are solely those of the authors and do not necessarily represent those of their affiliated organizations, or those of the publisher, the editors and the reviewers. Any product that may be evaluated in this article, or claim that may be made by its manufacturer, is not guaranteed or endorsed by the publisher.
We thank N. Ringstad for the kind gifts of MT15934 irk-1(n4895), FQ295 irk-2(n4896), MT17360 irk-3(n5049); M. Koelle for the kind gift of the LX1751 lin-15(n765) X; vsEx700; and Yifan Xu and C. Bargmann for the kind gift of the ASH::GCaMP3 marker.
The Supplementary Material for this article can be found online at: https://www.frontiersin.org/articles/10.3389/fnins.2022.931328/full#supplementary-material
Adolph, A. R., and Tuan, F. J. (1972). Serotonin and inhibition in Limulus lateral eye. J. Gen. Physiol. 60, 679–697. doi: 10.1085/jgp.60.6.679
Akerboom, J., Chen, T. W., Wardill, T. J., Tian, L., Marvin, J. S., Mutlu, S., et al. (2012). Optimization of a GCaMP calcium indicator for neural activity imaging. J. Neurosci. 32, 13819–13840. doi: 10.1523/jneurosci.2601-12.2012
Al-Anzi, B., Armand, E., Nagamei, P., Olszewski, M., Sapin, V., Waters, C., et al. (2010). The leucokinin pathway and its neurons regulate meal size in Drosophila. Curr. Biol. 20, 969–978. doi: 10.1016/j.cub.2010.04.039
Ali, F., and Kwan, A. C. (2020). Interpreting in vivo calcium signals from neuronal cell bodies, axons, and dendrites: a review. Neurophotonics 7:e011402. doi: 10.1117/1.NPh.7.1.011402
Alten, B., Guzikowski, N. J., Zurawski, Z., Hamm, H. E., and Kavalali, E. T. (2022). Presynaptic mechanisms underlying GABA(B)-receptor-mediated inhibition of spontaneous neurotransmitter release. Cell Rep. 38:110255. doi: 10.1016/j.celrep.2021.110255
Aoki, R., Yagami, T., Sasakura, H., Ogura, K.-I., Kajihara, Y., Ibi, M., et al. (2011). A seven-transmembrane receptor that mediates avoidance response to dihydrocaffeic acid, a water-soluble repellent in Caenorhabditis elegans. J. Neurosci. 31, 16603–16610. doi: 10.1523/jneurosci.4018-11.2011
Arnatkevic̆iūtė, A., Fulcher, B. D., Pocock, R., and Fornito, A. (2018). Hub connectivity, neuronal diversity, and gene expression in the Caenorhabditis elegans connectome. PLoS Comput. Biol. 14:e1005989. doi: 10.1371/journal.pcbi.1005989
Bacqué-Cazenave, J., Bharatiya, R., Barrière, G., Delbecque, J. P., Bouguiyoud, N., Di Giovanni, G., et al. (2020). Serotonin in animal cognition and behavior. Int. J. Mol. Sci. 21:1649. doi: 10.3390/ijms21051649
Ballinger, E. C., Ananth, M., Talmage, D. A., and Role, L. W. (2016). Basal forebrain cholinergic circuits and signaling in cognition and cognitive decline. Neuron 91, 1199–1218.
Bargmann, C. I. (1998). Neurobiology of the Caenorhabditis elegans genome. Science 282, 2028–2033. doi: 10.1126/science.282.5396.2028
Bargmann, C. I. (2012). Beyond the connectome: how neuromodulators shape neural circuits. Bioessays 34, 458–465.
Bargmann, C. I., Hartwieg, E., and Horvitz, H. R. (1993). Odorant-selective genes and neurons mediate olfaction in C. elegans. Cell 74, 515–527. doi: 10.1016/0092-8674(93)80053-H
Blackmer, T., Larsen, E. C., Takahashi, M., Martin, T. F., Alford, S., and Hamm, H. E. (2001). G protein betagamma subunit-mediated presynaptic inhibition: regulation of exocytotic fusion downstream of Ca2+ entry. Science 292, 293–297. doi: 10.1126/science.1058803
Bunin, M. A., and Wightman, R. M. (1998). Quantitative evaluation of 5-hydroxytryptamine (serotonin) neuronal release and uptake: an investigation of extrasynaptic transmission. J. Neurosci. 18, 4854–4860. doi: 10.1523/jneurosci.18-13-04854.1998
Cha, H. L., Choi, J. M., Oh, H. H., Bashyal, N., Kim, S. S., Birnbaumer, L., et al. (2019). Deletion of the α subunit of the heterotrimeric Go protein impairs cerebellar cortical development in mice. Mol. Brain 12:57. doi: 10.1186/s13041-019-0477-9
Chao, M. Y., Komatsu, H., Fukuto, H. S., Dionne, H. M., and Hart, A. C. (2004). Feeding status and serotonin rapidly and reversibly modulate a Caenorhabditis elegans chemosensory circuit. Proc. Natl. Acad. Sci. U.S.A. 101, 15512–15517. doi: 10.1073/pnas.0403369101
Chase, D. L., and Koelle, M. R. (2007). Biogenic amine neurotransmitters in C. elegans. WormBook 20, 1–15. doi: 10.1895/wormbook.1.132.1
Chatzigeorgiou, M., Bang, S., Hwang, S. W., and Schafer, W. R. (2013). tmc-1 encodes a sodium-sensitive channel required for salt chemosensation in C. elegans. Nature 494, 95–99. doi: 10.1038/nature11845
Chen, X., and Johnston, D. (2005). Constitutively active G-protein-gated inwardly rectifying K+ channels in dendrites of hippocampal CA1 pyramidal neurons. J. Neurosci. 25, 3787–3792. doi: 10.1523/jneurosci.5312-04.2005
Corey, E. A., Ukhanov, K., Bobkov, Y. V., McIntyre, J. C., Martens, J. R., and Ache, B. W. (2021). Inhibitory signaling in mammalian olfactory transduction potentially mediated by Gαo. Mol. Cell. Neurosci. 110:103585. doi: 10.1016/j.mcn.2020.103585
Corkrum, M., Covelo, A., Lines, J., Bellocchio, L., Pisansky, M., Loke, K., et al. (2020). Dopamine-evoked synaptic regulation in the nucleus accumbens requires astrocyte activity. Neuron 105, 1036.e5–1047.e5. doi: 10.1016/j.neuron.2019.12.026
Darby, C., and Falkow, S. (2001). Mimicry of a G protein mutation by pertussis toxin expression in transgenic Caenorhabditis elegans. Infect. Immun. 69, 6271–6275. doi: 10.1128/iai.69.10.6271-6275.2001
Elphick, M. R. (2012). The evolution and comparative neurobiology of endocannabinoid signalling. Philos. Trans. R. Soc. Lond. B Biol. Sci. 367, 3201–3215. doi: 10.1098/rstb.2011.0394
Emtage, L., Aziz-Zaman, S., Padovan-Merhar, O., Horvitz, H. R., Fang-Yen, C., and Ringstad, N. (2012). IRK-1 potassium channels mediate peptidergic inhibition of Caenorhabditis elegans serotonin neurons via a G(o) signaling pathway. J. Neurosci. 32, 16285–16295. doi: 10.1523/jneurosci.2667-12.2012
Ezcurra, M., Walker, D. S., Beets, I., Swoboda, P., and Schafer, W. R. (2016). Neuropeptidergic signaling and active feeding state inhibit nociception in Caenorhabditis elegans. J. Neurosci. 36, 3157–3169. doi: 10.1523/jneurosci.1128-15.2016
Ferkey, D. M., Hyde, R., Haspel, G., Dionne, H. M., Hess, H. A., Suzuki, H., et al. (2007). C. elegans G protein regulator RGS-3 controls sensitivity to sensory stimuli. Neuron 53, 39–52. doi: 10.1016/j.neuron.2006.11.015
Ferkey, D. M., Sengupta, P., and L’Etoile, N. D. (2021). Chemosensory signal transduction in Caenorhabditis elegans. Genetics 217:iyab004. doi: 10.1093/genetics/iyab004
Ghosh, D. D., Sanders, T., Hong, S., McCurdy, L. Y., Chase, D. L., Cohen, N., et al. (2016). Neural architecture of hunger-dependent multisensory decision making in C. elegans. Neuron 92, 1049–1062. doi: 10.1016/j.neuron.2016.10.030
Gierschik, P. (1992). ADP-ribosylation of signal-transducing guanine nucleotide-binding proteins by pertussis toxin. Curr. Top. Microbiol. Immunol. 175, 69–96. doi: 10.1007/978-3-642-76966-5_4
Goodman, M. B., Hall, D. H., Avery, L., and Lockery, S. R. (1998). Active currents regulate sensitivity and dynamic range in C. elegans neurons. Neuron 20, 763–772. doi: 10.1016/s0896-6273(00)81014-4
Goodman, M. B., and Lockery, S. R. (2000). Pressure polishing: a method for re-shaping patch pipettes during fire polishing. J. Neurosci. Methods 100, 13–15. doi: 10.1016/s0165-0270(00)00224-7
Grissmer, S. (2007). “Calcium-sensitive potassium channels,” in xPharm: The Comprehensive Pharmacology Reference, eds S. J. Enna and D. B. Bylund (New York, NY: Elsevier), 1–4.
Halpain, S., Hipolito, A., and Saffer, L. (1998). Regulation of F-actin stability in dendritic spines by glutamate receptors and calcineurin. J. Neurosci. 18, 9835–9844. doi: 10.1523/jneurosci.18-23-09835.1998
Hamid, E., Church, E., Wells, C. A., Zurawski, Z., Hamm, H. E., and Alford, S. (2014). Modulation of neurotransmission by GPCRs is dependent upon the microarchitecture of the primed vesicle complex. J. Neurosci. 34, 260–274. doi: 10.1523/jneurosci.3633-12.2014
Hamm, H. E., and Alford, S. T. (2020). Physiological roles for neuromodulation via G(i/o) GPCRs working through Gβγ-SNARE interaction. Neuropsychopharmacology 45:221. doi: 10.1038/s41386-019-0497-2
Harris, G., Mills, H., Wragg, R., Hapiak, V., Castelletto, M., Korchnak, A., et al. (2010). The monoaminergic modulation of sensory-mediated aversive responses in Caenorhabditis elegans requires glutamatergic/peptidergic cotransmission. J. Neurosci. 30, 7889–7899. doi: 10.1523/jneurosci.0497-10.2010
Harris, G. P., Hapiak, V. M., Wragg, R. T., Miller, S. B., Hughes, L. J., Hobson, R. J., et al. (2009). Three distinct amine receptors operating at different levels within the locomotory circuit are each essential for the serotonergic modulation of chemosensation in Caenorhabditis elegans. J. Neurosci. 29, 1446–1456. doi: 10.1523/jneurosci.4585-08.2009
Harris-Warrick, R. M., and Johnson, B. R. (2010). Checks and balances in neuromodulation. Front. Behav. Neurosci. 4:47. doi: 10.3389/fnbeh.2010.00047
Hartmann, J., Blum, R., Kovalchuk, Y., Adelsberger, H., Kuner, R., Durand, G. M., et al. (2004). Distinct roles of Galpha(q) and Galpha11 for Purkinje cell signaling and motor behavior. J. Neurosci. 24, 5119–5130. doi: 10.1523/jneurosci.4193-03.2004
Hasselmo, M. E. (1999). Neuromodulation: acetylcholine and memory consolidation. Trends Cogn. Sci. 3, 351–359.
Hasselmo, M. E. (2006). The role of acetylcholine in learning and memory. Curr. Opin. Neurobiol. 16, 710–715.
Hobert, O. (2013). The neuronal genome of Caenorhabditis elegans. WormBook 1, 1–106. doi: 10.1895/wormbook.1.161.1
Hofler, C., and Koelle, M. R. (2011). AGS-3 alters Caenorhabditis elegans behavior after food deprivation via RIC-8 activation of the neural G protein G αo. J. Neurosci. 31, 11553–11562. doi: 10.1523/jneurosci.2072-11.2011
Inagaki, S., and Nagai, T. (2016). Current progress in genetically encoded voltage indicators for neural activity recording. Curr. Opin. Chem. Biol. 33, 95–100. doi: 10.1016/j.cbpa.2016.05.023
Inoue, M. (2021). Genetically encoded calcium indicators to probe complex brain circuit dynamics in vivo. Neurosci. Res. 169, 2–8. doi: 10.1016/j.neures.2020.05.013
Jia, H., Varga, Z., Sakmann, B., and Konnerth, A. (2014). Linear integration of spine Ca2+ signals in layer 4 cortical neurons in vivo. Proc. Natl. Acad. Sci. U.S.A. 111, 9277–9282. doi: 10.1073/pnas.1408525111
Kano, H., Toyama, Y., Imai, S., Iwahashi, Y., Mase, Y., Yokogawa, M., et al. (2019). Structural mechanism underlying G protein family-specific regulation of G protein-gated inwardly rectifying potassium channel. Nat. Commun. 10:2008. doi: 10.1038/s41467-019-10038-x
Kato, S., Kaplan, H. S., Schrödel, T., Skora, S., Lindsay, T. H., Yemini, E., et al. (2015). Global brain dynamics embed the motor command sequence of Caenorhabditis elegans. Cell 163, 656–669. doi: 10.1016/j.cell.2015.09.034
Kato, S., Xu, Y., Cho, C. E., Abbott, L. F., and Bargmann, C. I. (2014). Temporal responses of C. elegans chemosensory neurons are preserved in behavioral dynamics. Neuron 81, 616–628. doi: 10.1016/j.neuron.2013.11.020
Ko, K. I., Root, C. M., Lindsay, S. A., Zaninovich, O. A., Shepherd, A. K., Wasserman, S. A., et al. (2015). Starvation promotes concerted modulation of appetitive olfactory behavior via parallel neuromodulatory circuits. eLife 4:e08298. doi: 10.7554/eLife.08298
Koelle, M. R. (2018). Neurotransmitter signaling through heterotrimeric G proteins: insights from studies in C. elegans. WormBook 18, 1–52. doi: 10.1895/wormbook.1.75.2
Komuniecki, R., Harris, G., Hapiak, V., Wragg, R., and Bamber, B. (2012). Monoamines activate neuropeptide signaling cascades to modulate nociception in C. elegans: a useful model for the modulation of chronic pain? Invert. Neurosci. 12, 53–61. doi: 10.1007/s10158-011-0127-0
Lee, K. S., You, K. H., Choo, J. K., Han, Y. M., and Yu, K. (2004). Drosophila short neuropeptide F regulates food intake and body size. J. Biol. Chem. 279, 50781–50789. doi: 10.1074/jbc.M407842200
Li, X., Bucher, D., and Nadim, F. (2018). Distinct co-modulation rules of synapses and voltage-gated currents coordinate interactions of multiple neuromodulators. J. Neurosci. 38, 8549–8562. doi: 10.1523/jneurosci.1117-18.2018
Lindy, A. S., Parekh, P. K., Zhu, R., Kanju, P., Chintapalli, S. V., Tsvilovskyy, V., et al. (2014). TRPV channel-mediated calcium transients in nociceptor neurons are dispensable for avoidance behaviour. Nat. Commun. 5:4734. doi: 10.1038/ncomms5734
Liu, H., Wu, T., Canales, X. G., Wu, M., Choi, M. K., Duan, F., et al. (2022). Forgetting generates a novel state that is reactivatable. Sci. Adv. 8:eabi9071. doi: 10.1126/sciadv.abi9071
Liu, Q., Kidd, P. B., Dobosiewicz, M., and Bargmann, C. I. (2018). C. elegans AWA olfactory neurons fire calcium-mediated all-or-none action potentials. Cell 175, 57.e17–70.e17. doi: 10.1016/j.cell.2018.08.018
Liu, Y., Sellegounder, D., and Sun, J. (2016). Neuronal GPCR OCTR-1 regulates innate immunity by controlling protein synthesis in Caenorhabditis elegans. Sci. Rep. 6:36832. doi: 10.1038/srep36832
Longordo, F., To, M.-S., Ikeda, K., and Stuart, G. J. (2013). Sublinear integration underlies binocular processing in primary visual cortex. Nat. Neurosci. 16, 714–723. doi: 10.1038/nn.3394
Marder, E. (2012). Neuromodulation of neuronal circuits: back to the future. Neuron 76, 1–11. doi: 10.1016/j.neuron.2012.09.010
Mellem, J. E., Brockie, P. J., Madsen, D. M., and Maricq, A. V. (2008). Action potentials contribute to neuronal signaling in C. elegans. Nat. Neurosci. 11, 865–867. doi: 10.1038/nn.2131
Mills, H., Wragg, R., Hapiak, V., Castelletto, M., Zahratka, J., Harris, G., et al. (2012). Monoamines and neuropeptides interact to inhibit aversive behaviour in Caenorhabditis elegans. EMBO J. 31, 667–678. doi: 10.1038/emboj.2011.422
Milo, R., Shen-Orr, S., Itzkovitz, S., Kashtan, N., Chklovskii, D., and Alon, U. (2002). Network motifs: simple building blocks of complex networks. Science 298, 824–827. doi: 10.1126/science.298.5594.824
Mollinedo-Gajate, I., Song, C., and Knöpfel, T. (2019). Genetically encoded fluorescent calcium and voltage indicators. Handb. Exp. Pharmacol. 260, 209–229. doi: 10.1007/164_2019_299
Muntean, B. S., Masuho, I., Dao, M., Sutton, L. P., Zucca, S., Iwamoto, H., et al. (2021). Gαo is a major determinant of cAMP signaling in the pathophysiology of movement disorders. Cell Rep. 34:108718. doi: 10.1016/j.celrep.2021.108718
Nässel, D. R., Zandawala, M., Kawada, T., and Satake, H. (2019). Tachykinins: neuropeptides that are ancient, diverse, widespread and functionally pleiotropic. Front. Neurosci. 13:1262. doi: 10.3389/fnins.2019.01262
Patriarchi, T., Cho, J. R., Merten, K., Howe, M. W., Marley, A., Xiong, W. H., et al. (2018). Ultrafast neuronal imaging of dopamine dynamics with designed genetically encoded sensors. Science 360:eaat4422. doi: 10.1126/science.aat4422
Ranjbar-Slamloo, Y., and Fazlali, Z. (2020). Dopamine and noradrenaline in the brain; overlapping or dissociate functions? Front. Mol. Neurosci. 12:334. doi: 10.3389/fnmol.2019.00334
Redolfi, N., García-Casas, P., Fornetto, C., Sonda, S., Pizzo, P., and Pendin, D. (2021). Lighting up Ca(2+) dynamics in animal models. Cells 10:2133. doi: 10.3390/cells10082133
Rengarajan, S., and Hallem, E. A. (2016). Olfactory circuits and behaviors of nematodes. Curr. Opin. Neurobiol. 41, 136–148. doi: 10.1016/j.conb.2016.09.002
Reynolds, N. K., Schade, M. A., and Miller, K. G. (2005). Convergent, RIC-8-dependent Galpha signaling pathways in the Caenorhabditis elegans synaptic signaling network. Genetics 169, 651–670. doi: 10.1534/genetics.104.031286
Roome, C. J., and Kuhn, B. (2018). Simultaneous dendritic voltage and calcium imaging and somatic recording from Purkinje neurons in awake mice. Nat. Commun. 9:3388. doi: 10.1038/s41467-018-05900-3
Sara, S. J. (2009). The locus coeruleus and noradrenergic modulation of cognition. Nat. Rev. Neurosci. 10, 211–223.
Sara, S. J., and Bouret, S. (2012). Orienting and reorienting: the locus coeruleus mediates cognition through arousal. Neuron 76, 130–141. doi: 10.1016/j.neuron.2012.09.011
Schade, M. A., Reynolds, N. K., Dollins, C. M., and Miller, K. G. (2005). Mutations that rescue the paralysis of Caenorhabditis elegans ric-8 (Synembryn) mutants activate the gαs pathway and define a third major branch of the synaptic signaling network. Genetics 169, 631–649. doi: 10.1534/genetics.104.032334
Schwarz, L. A., and Luo, L. (2015). Organization of the locus coeruleus-norepinephrine system. Curr. Biol. 25, R1051–R1056.
Segal, M., and Korkotian, E. (2014). Endoplasmic reticulum calcium stores in dendritic spines. Front. Neuroanat. 8:64. doi: 10.3389/fnana.2014.00064
Ségalat, L., Elkes, D. A., and Kaplan, J. M. (1995). Modulation of serotonin-controlled behaviors by Go in Caenorhabditis elegans. Science 267, 1648–1651. doi: 10.1126/science.7886454
Sekerková, G., Watanabe, M., Martina, M., and Mugnaini, E. (2014). Differential distribution of phospholipase C beta isoforms and diaglycerol kinase-beta in rodents cerebella corroborates the division of unipolar brush cells into two major subtypes. Brain Struct. Funct. 219, 719–749. doi: 10.1007/s00429-013-0531-9
Sellegounder, D., Yuan, C. H., Wibisono, P., Liu, Y., and Sun, J. (2018). Octopaminergic signaling mediates neural regulation of innate immunity in Caenorhabditis elegans. mBio 9:e01645-18. doi: 10.1128/mBio.01645-18
Shidara, H., Kobayashi, J., Tanamoto, R., Hotta, K., and Oka, K. (2013). Odorant-induced membrane potential depolarization of AIY interneuron in Caenorhabditis elegans. Neurosci. Lett. 541, 199–203. doi: 10.1016/j.neulet.2013.02.016
Stuart, G. J., and Spruston, N. (2015). Dendritic integration: 60 years of progress. Nat. Neurosci. 18, 1713–1721. doi: 10.1038/nn.4157
Taylor, S. R., Santpere, G., Weinreb, A., Barrett, A., Reilly, M. B., Xu, C., et al. (2021). Molecular topography of an entire nervous system. Cell 184, 4329.e3–4347.e3. doi: 10.1016/j.cell.2021.06.023
Tazerart, S., Blanchard, M. G., Miranda-Rottmann, S., Mitchell, D. E., Navea Pina, B., Thomas, C. I., et al. (2022). Selective activation of BK channels in small-headed dendritic spines suppresses excitatory postsynaptic potentials. J. Physiol. 600, 2165–2187. doi: 10.1113/jp282303
Vardi, N. (1998). Alpha subunit of Go localizes in the dendritic tips of ON bipolar cells. J. Comp. Neurol. 395, 43–52.
Varshney, L. R., Chen, B. L., Paniagua, E., Hall, D. H., and Chklovskii, D. B. (2011). Structural properties of the Caenorhabditis elegans neuronal network. PLoS Comput. Biol. 7:e1001066. doi: 10.1371/journal.pcbi.1001066
Vogt, N. (2015). Voltage sensors: challenging, but with potential. Nat. Methods 12, 921–924. doi: 10.1038/nmeth.3591
Waterman, S. A. (2000). Voltage-gated calcium channels in autonomic neuroeffector transmission. Prog. Neurobiol. 60, 181–210. doi: 10.1016/s0301-0082(99)00025-8
Williams, P. D. E., Zahratka, J. A., and Bamber, B. A. (2018a). “Getting under the hood” of neuronal signaling in Caenorhabditis elegans. J. Exp. Neurosci. 12:1179069518781326. doi: 10.1177/1179069518781326
Williams, P. D. E., Zahratka, J. A., Rodenbeck, M., Wanamaker, J., Linzie, H., and Bamber, B. A. (2018b). Serotonin disinhibits a Caenorhabditis elegans sensory neuron by suppressing Ca(2+)-dependent negative feedback. J. Neurosci. 38, 2069–2080. doi: 10.1523/jneurosci.1908-17.2018
WormBase (2022). WormBase Version WS284. Available online at: https://www.wormbase.org (accessed June 15, 2022)
Wragg, R. T., Hapiak, V., Miller, S. B., Harris, G. P., Gray, J., Komuniecki, P. R., et al. (2007). Tyramine and octopamine independently inhibit serotonin-stimulated aversive behaviors in Caenorhabditis elegans through two novel amine receptors. J. Neuroscience 27, 13402–13412. doi: 10.1523/jneurosci.3495-07.2007
Xu, X., Wei, Z., and Wu, G. (2022). Specific motifs mediate post-synaptic and surface transport of G protein-coupled receptors. iScience 25:103643.
Yemini, E., Lin, A., Nejatbakhsh, A., Varol, E., Sun, R., Mena, G. E., et al. (2021). NeuroPAL: a multicolor atlas for whole-brain neuronal identification in C. elegans. Cell 184, 272.e11–288.e11. doi: 10.1016/j.cell.2020.12.012
Zahratka, J. A., Williams, P. D., Summers, P. J., Komuniecki, R. W., and Bamber, B. A. (2015). Serotonin differentially modulates Ca2+ transients and depolarization in a C. elegans nociceptor. J. Neurophysiol. 113, 1041–1050. doi: 10.1152/jn.00665.2014
Zhang, Y., Lu, H., and Bargmann, C. I. (2005). Pathogenic bacteria induce aversive olfactory learning in Caenorhabditis elegans. Nature 438, 179–184. doi: 10.1038/nature04216
Keywords: neuromodulation, Ca2+ dynamics, depolarization, signal integration, graded potentials
Citation: Debnath A, Williams PDE and Bamber BA (2022) Reduced Ca2+ transient amplitudes may signify increased or decreased depolarization depending on the neuromodulatory signaling pathway. Front. Neurosci. 16:931328. doi: 10.3389/fnins.2022.931328
Received: 28 April 2022; Accepted: 27 June 2022;
Published: 22 July 2022.
Edited by:
Mengyu Jia, Tianjin University, ChinaReviewed by:
Yusu Xie, Institute of Oceanology (CAS), ChinaCopyright © 2022 Debnath, Williams and Bamber. This is an open-access article distributed under the terms of the Creative Commons Attribution License (CC BY). The use, distribution or reproduction in other forums is permitted, provided the original author(s) and the copyright owner(s) are credited and that the original publication in this journal is cited, in accordance with accepted academic practice. No use, distribution or reproduction is permitted which does not comply with these terms.
*Correspondence: Bruce A. Bamber, QnJ1Y2UuQmFtYmVyQHV0b2xlZG8uZWR1
Disclaimer: All claims expressed in this article are solely those of the authors and do not necessarily represent those of their affiliated organizations, or those of the publisher, the editors and the reviewers. Any product that may be evaluated in this article or claim that may be made by its manufacturer is not guaranteed or endorsed by the publisher.
Research integrity at Frontiers
Learn more about the work of our research integrity team to safeguard the quality of each article we publish.