 Zichun Yan†‡
 Xiaohua Wang†‡
 Qiyuan ZhuZhuowei ShiXiaoya ChenYongliang HanQiao Zheng
 Yiqiu Wei
 Jingjie Wang*‡
 Yongmei Li*‡
- Department of Radiology, The First Affiliated Hospital of Chongqing Medical University, Chongqing, China
Objectives: To investigate whether patients with neuromyelitis optica spectrum disorder (NMOSD) have tract-specific alterations in the white matter (WM) and the correlations between the alterations and cognitive impairment.
Materials and Methods: In total, 40 patients with NMOSD and 20 healthy controls (HCs) who underwent diffusion tensor imaging (DTI) scan and neuropsychological scale assessments were enrolled. Automated fiber-tract quantification (AFQ) was applied to identify and quantify 100 equally spaced nodes of 18 specific WM fiber tracts for each participant. Then the group comparisons in DTI metrics and correlations between different DTI metrics and neuropsychological scales were performed.
Results: Regardless of the entire or pointwise level in WM fiber tracts, patients with NMOSD exhibited a decreased fractional anisotropy (FA) in the left inferior fronto-occipital fasciculus (L_IFOF) and widespread increased mean diffusion (MD), axial diffusivity (AD), and radial diffusivity (RD), especially for the thalamic radiation (TR), corticospinal tract (CST), IFOF, inferior longitudinal fasciculus (ILF), superior longitudinal fasciculus (SLF) [p < 0.05, false discovery rate (FDR) correction], and the pointwise analyses performed more sensitive. Furthermore, the negative correlations among MD, AD, RD, and symbol digit modalities test (SDMT) scores in the left TR (L_TR) were found in NMOSD.
Conclusion: Patients with NMOSD exhibited the specific nodes of WM fiber tract damage, which can enhance our understanding of WM microstructural abnormalities in NMOSD. In addition, the altered DTI metrics were correlated with cognitive impairment, which can be used as imaging markers for the early identification of NMOSD cognitive impairment.
Introduction
Neuromyelitis optica spectrum disorder (NMOSD) is an autoimmune inflammatory disease characterized by severe episodes of optic neuritis (ON), long-segment transverse myelitis (LETM), and area postrema syndrome (APS). It is mediated by perivascular immunoglobulin deposition and complement activation against the aquaporin-4 (AQP4) water channel in the central nervous system (Wingerchuk et al., 2007). With the deep understanding of NMOSD, 57–67% of NMOSD patients are accompanied by cognitive impairment, which mainly affects the prognosis of the disease (Saji et al., 2013; Liu et al., 2015; Moore et al., 2016).
Most neuroimaging studies of NMOSD have reported that structural damage predominantly restricted to white matter (WM) by diffusion tensor imaging (DTI) technology (Liu et al., 2012; Kimura et al., 2014; Pache et al., 2016; Kim et al., 2017; Cacciaguerra et al., 2021; Chen et al., 2021). Previous studies based on DTI mainly used voxel-based morphometry (VBM) and tract-based spatial statistics (TBSS) aimed at the voxel level but had the disadvantage of inaccurate positioning (Jones et al., 2005; Yeatman et al., 2012), and a few studies focused on the entire fiber tracts to analyze DTI parameters in patients with NMOSD (Kimura et al., 2014; Kuchling et al., 2018). However, it was known that only one segment of WM fiber tracts in patients with mild cognitive impairment (MCI) was destroyed with the other parts intact, and in the process of Alzheimer’s disease, the destruction of some WM fiber tracts follows a specific pattern (Zhang et al., 2019). Same as a neurological disease, we speculate that specific segments of WM fiber tract damage were similar in patients with NMOSD.
Automated fiber-tract quantification (AFQ) is an advanced DTI method for automated reconstruction of WM fiber tracts and segmentation of the fiber tracts into multiple nodes. It can provide more detailed information on WM damage and has been applied to MCI, schizophrenia, cerebral small vessel disease, benign childhood epilepsy, end-stage renal disease, and so on (Sun et al., 2015; Chen et al., 2020; Jiang et al., 2021; Shu et al., 2021; Stone et al., 2021). To our knowledge, the application of AFQ for patients with NMOSD has not been studied.
In this present study, the AFQ has been applied to (1) study the damage patterns of different 100 nodes of 20 specific cerebral WM fiber tracts in patients with NMOSD and (2) explore the correlations between the changes of DTI metrics and clinical cognitive performance.
Materials and Methods
Participants
This retrospective study has been approved by the Institutional Review Board of the First Affiliated Hospital of Chongqing Medical University, Chongqing, China, and written informed consent was obtained from each participant before magnetic resonance imaging (MRI) scans. In addition, demographic data and neuropsychological scales of the participants, such as gender, age, education level, disease duration, Hamilton depression (HAMD) scale, Hamilton anxiety (HAMA) scale, fatigue severity scale (FSS), digit span test (DST), symbol digit modalities test (SDMT), minimum mental state examination (MMSE), and Montreal Cognitive Assessment (MoCA) scores were also collected.
A total of 40 patients diagnosed with NMOSD and 20 sex-, age-, and education level-matched healthy controls (HCs) were enrolled between March 2021 and March 2022. Patients have received a confirmed diagnosis of NMOSD based on the standard diagnosis criteria (Wingerchuk et al., 2015), which has been free from relapse and not on the treatment of disease-modified medications within 4 weeks before MRI scans. All patients with NMOSD were serum positive for the AQP4 antibody. The exclusion criteria were (1) significant neurologic disease other than NMOSD; (2) image artifacts or incomplete clinical information; and (3) contraindications for MRI scans.
Magnetic Resonance Imaging Acquisition
All MR scans were performed on a 3.0T MR scanner (Magnetom Skyra, Siemens Healthcare GmbH, Erlangen, Germany) using a 32-channel head coil. The MRI protocol included a 3-dimensional (3D) T1-weighted magnetization prepared rapid gradient echo (MPRAGE) sequence: echo time (TE) = 2.26 ms, repetition time (TR) = 2,300 ms, inversion time (TI) = 900 ms, 192 slices, field of view (FOV) = 256 mm, voxel size = 1.0 mm × 1.0 mm × 1.0 mm, and acquisition time (TA) = 5:21 min. In addition, a diffusion kurtosis imaging (DKI) sequence: TE = 97 ms, TR = 5,100 ms, 72 slices, FOV = 220 mm, voxel size = 1.7 mm × 1.7 mm × 2.0 mm, TA = 6:13 min, Parallel Acquisition Techniques (PATs) acceleration factor = 4, and three b-values (0, 1,000, and 2000) with diffusion encoding in 30 directions.
Data Pre-processing
All DTI data were obtained by retaining b-values of 0 and 1,000 for DKI data and converting the data format by using the MRIcron software.1 Then the DTI images were preprocessed by using FMRIB Software Library (FSL) software,2 which included the following steps: (1) correction of subject motion, eddy-currents, and susceptibility-induced distortions; (2) generation of individual brain masks based on the B0 images of each subject by using a brain extraction tool (BET); (3) calculation of DTI matrix by using DTIFIT command of FSL to obtain fractional anisotropy (FA), mean diffusion (MD), axial diffusivity (AD), radial diffusivity (RD), eigenvalues (λ1, λ2, and λ3), eigenvectors (L1, L2, and L3), and a raw T2 image without diffusion weighting (S0).
For the 3D-T1 images, the pre-processing procedure included the following steps: (1) removal of non-brain structures by using BET; (2) calibration of the anterior commissure-posterior commissure (AC-PC) plane by using mrAnatAverageAcpcNifti function for subsequent alignment in VistaSoft package3; (3) alignment of T1 images to S0 images and transition of the DTI data to the format, which was fit for AFQ processing by using dtiMakeDt6FromFsl script in MATLAB R2012b.
Automated Fiber Quantification
The open-source MATLAB version of AFQ software4 was applied to identify and quantify 100 equally spaced nodes of 20 specific WM fiber tracts for each participant (Yeatman et al., 2012). The entire processing procedure steps were as follows: (1) whole-brain deterministic fiber tractography with thresholds of FA > 0.2, turning angle < 30°, and fiber length between 50 and 250 mm; (2) waypoint regions of interest (ROIs)-based tract segmentation; (3) fiber tracts refinement based on probability maps; (4) fiber tracts cleaning into a compact tract spanning between cortical regions; and (5) fiber tracts quantification by clipping each fiber in the fiber group to the portion that spans between the two waypoint ROIs and resampling each fiber to 100 nodes.
The identified 20 WM fiber tracts included bilateral thalamic radiation (TR), corticospinal tract (CST), cingulum cingulate (CC), cingulum hippocampus (CH), inferior fronto-occipital fasciculus (IFOF), inferior longitudinal fasciculus (ILF), superior longitudinal fasciculus (SLF), uncinate fasciculus (UF), arcuate fasciculus (AF), callosum forceps major (CF_major), and callosum forceps minor (CF_minor). However, there were nearly half of the subjects who failed to identify bilateral CH fiber tracts due to the AFQ’s strict criteria for fiber tract identification (Table 1). Therefore, we excluded the two fiber tracts and enrolled the other 18 fiber tracts in our study for further analysis. The 18 identified WM fiber tracts are showed in Figure 1.
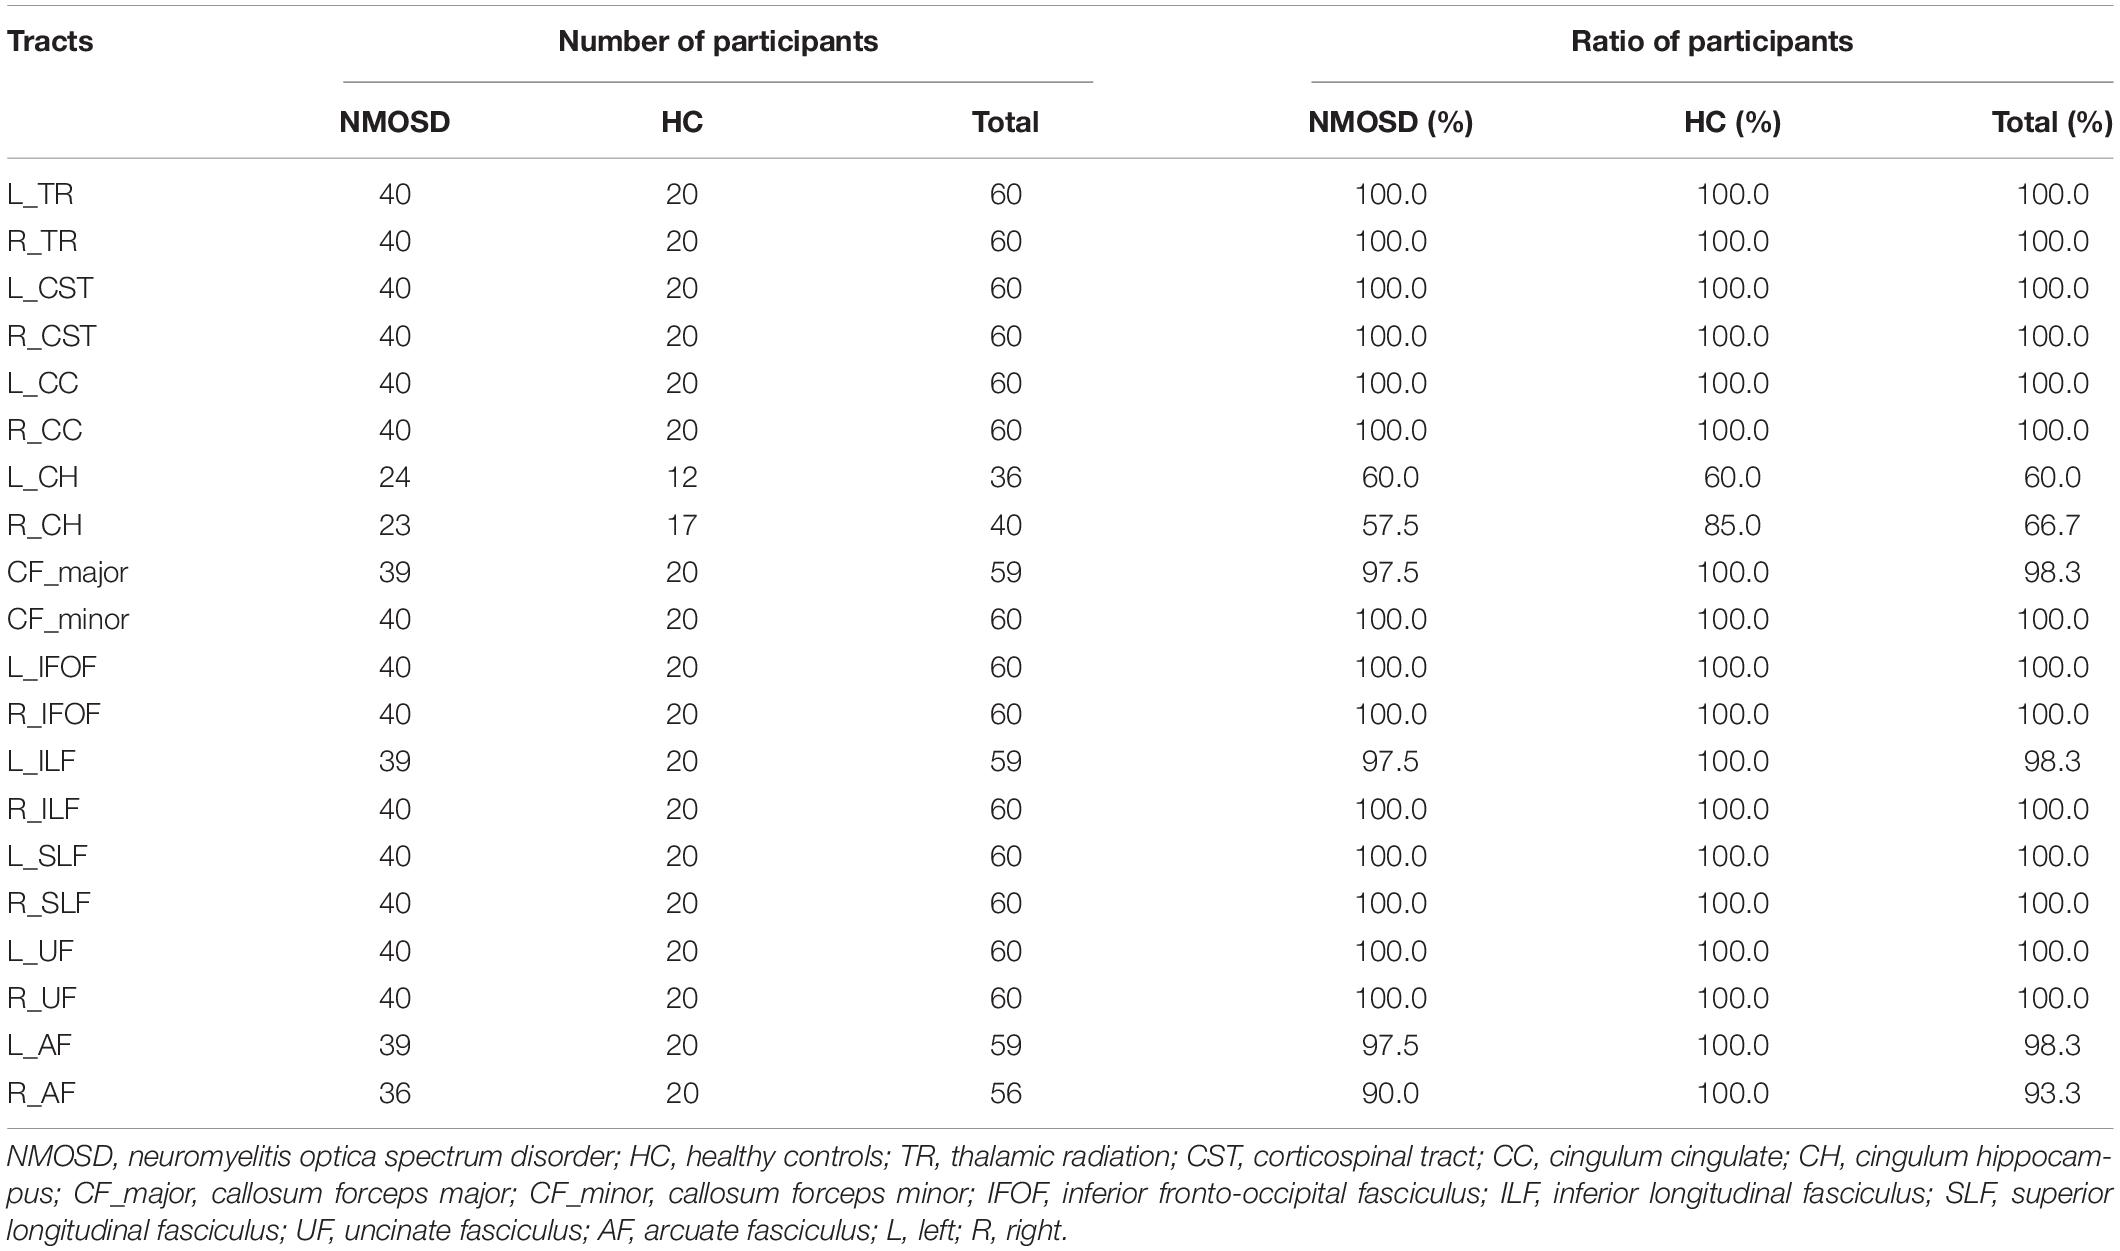
Table 1. Identification number and ratio for 20 WM fiber tracts in NMOSD and HC.
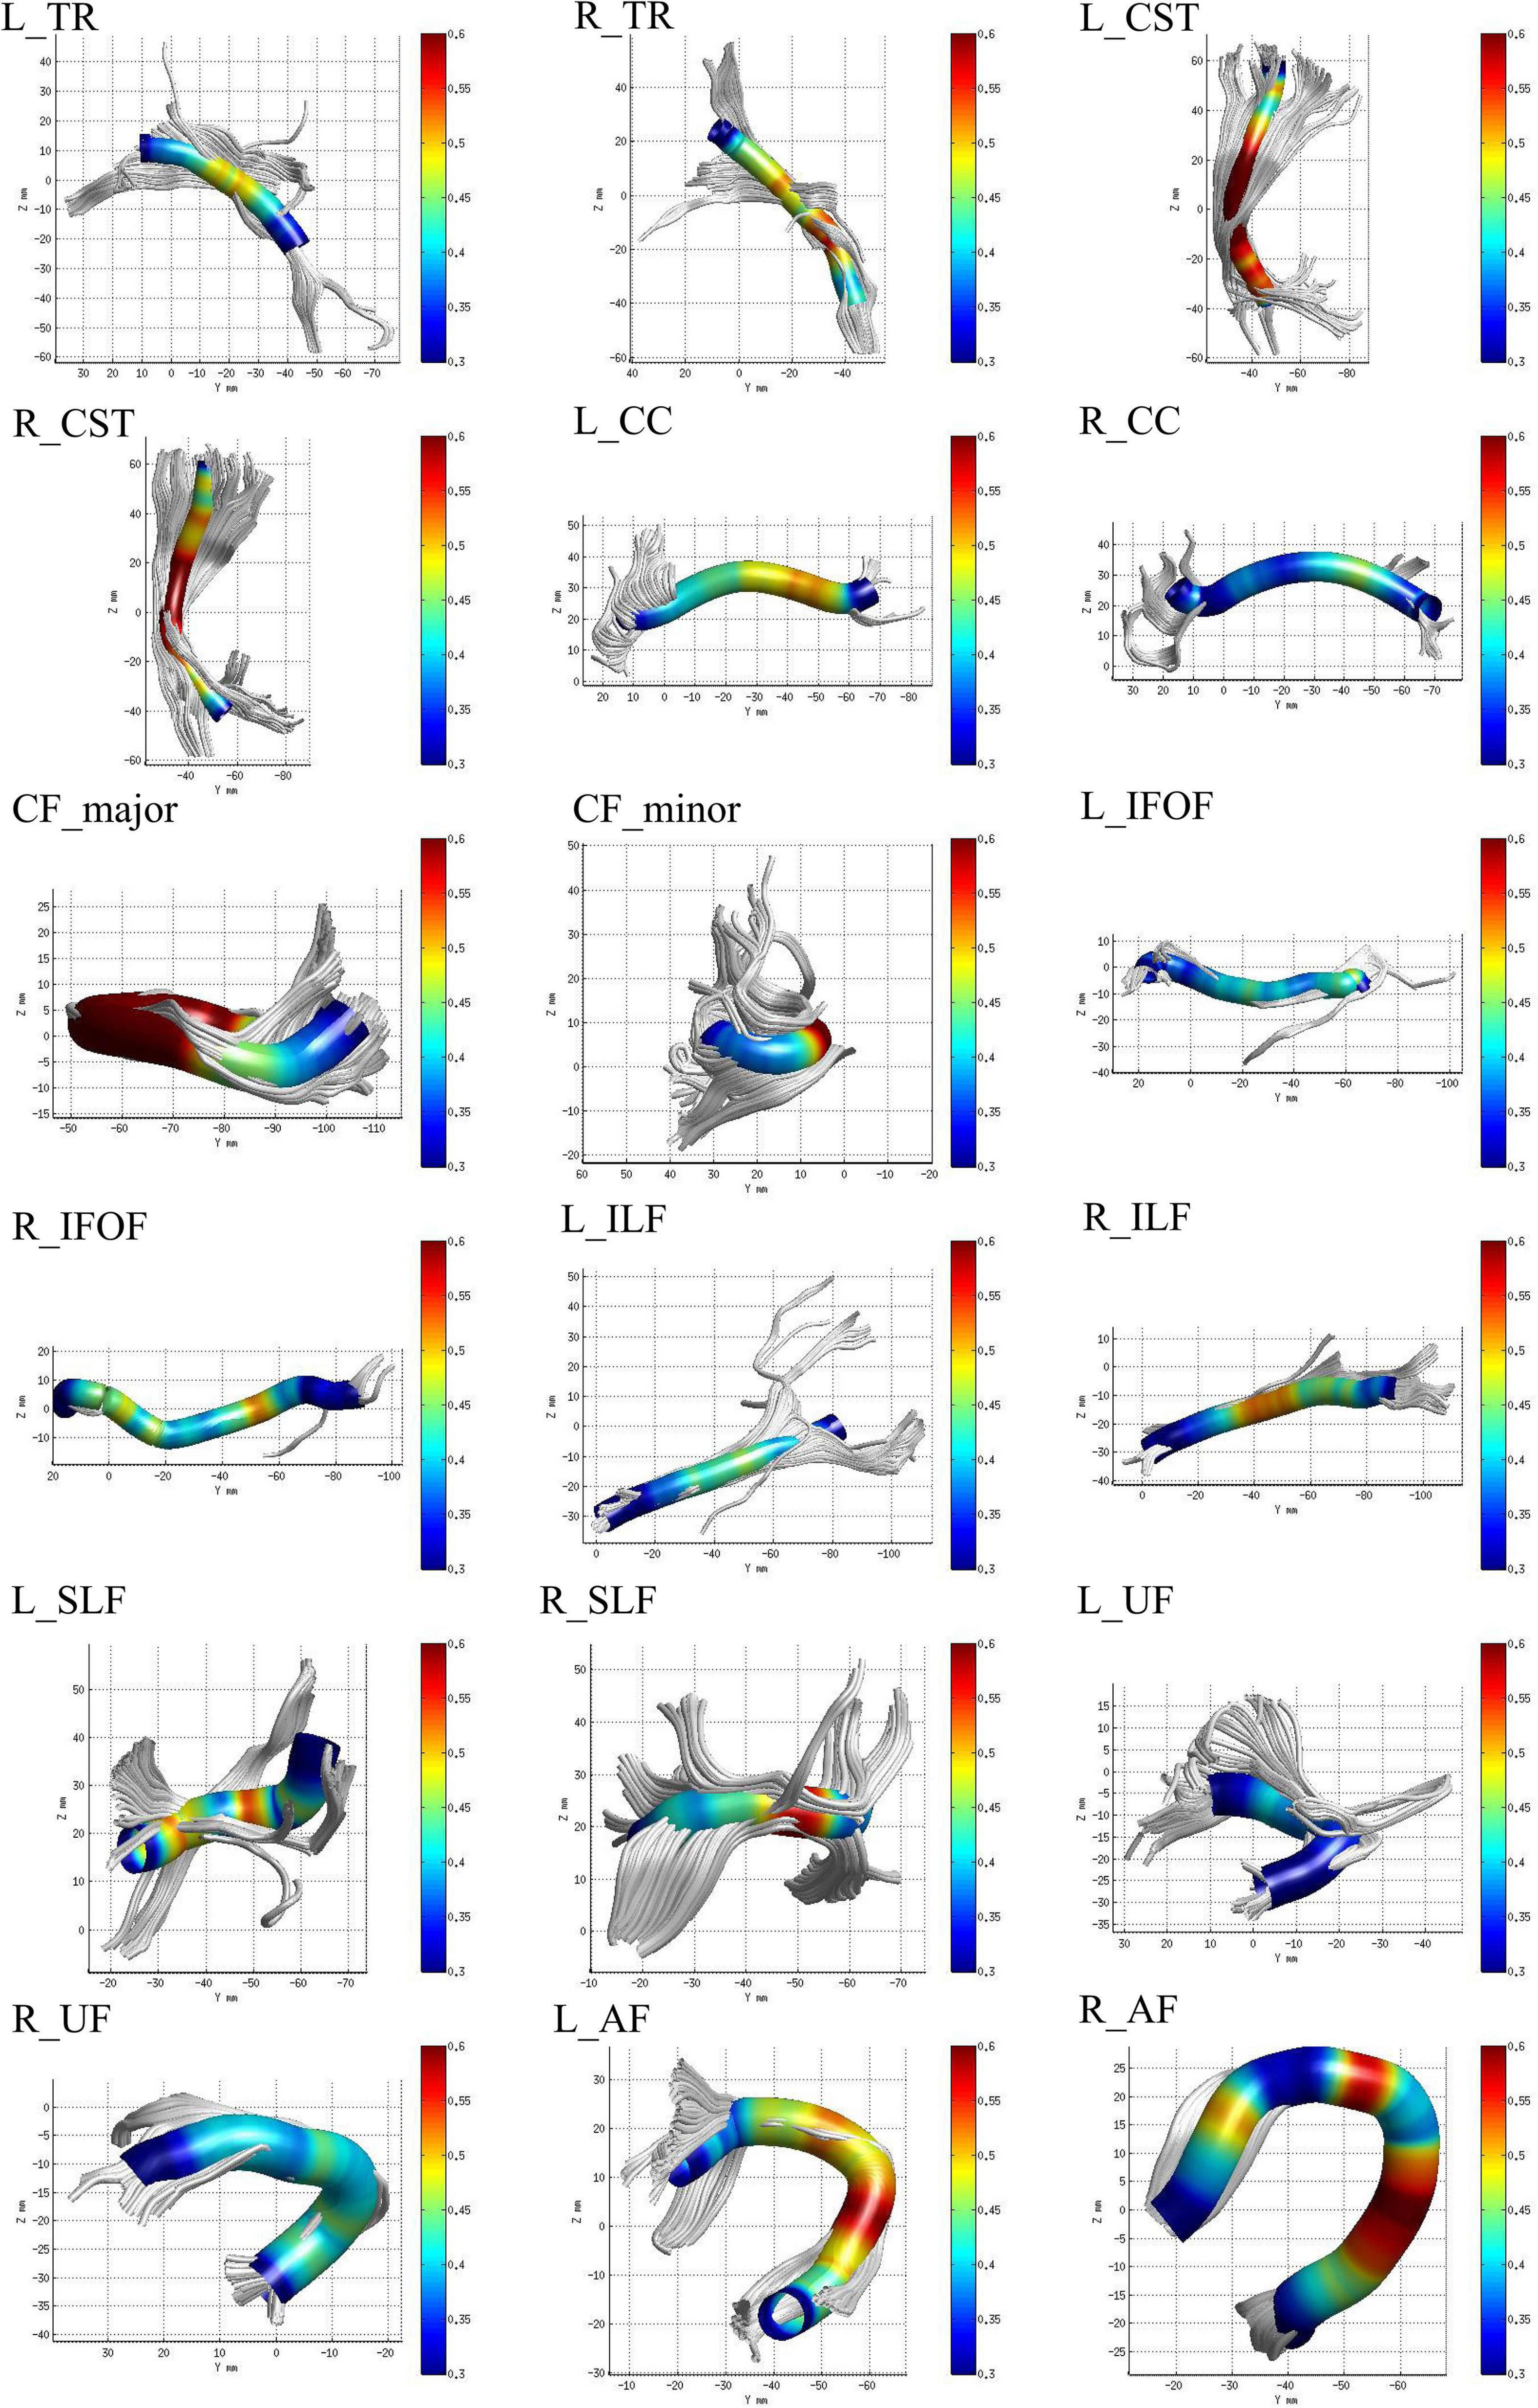
Figure 1. The 18 identified white matter (WM) fiber tracts, such as bilateral thalamic radiation (TR), corticospinal tract (CST), cingulum cingulate (CC), inferior fronto-occipital fasciculus (IFOF), inferior longitudinal fasciculus (ILF), superior longitudinal fasciculus (SLF), uncinate fasciculus (UF), arcuate fasciculus (AF), callosum forceps major (CF_major), and minor (CF_minor) by automated fiber-tract quantification (AFQ).
Statistical Analysis
All statistical analyses, such as demographic data and neuropsychological scales, were performed by using the SPSS software (version 25.0; SPSS, Chicago, IL, United States). The normal distribution of the data was assessed by using the Kolmogorov-Smirnov test. According to the data whether normally distributed, independent samples t-tests or Mann–Whitney U tests were used to assess between-group differences. The gender of the subjects was analyzed using Pearson’s Chi-square tests. p < 0.05 was considered statistically significant.
The DTI metrics, such as FA, MD, AD, and RD, at each node along the 18 identified WM fiber tracts were compared between NMOSD and HCs in entire and pointwise manners using independent samples t-tests. All statistical results were considered significant when p < 0.05 after false discovery rate (FDR) correction for multiple comparisons. In a pointwise manner, only significant differences observed at ≥ 3 adjacent nodes were reported (Banfi et al., 2019).
The further Pearson or Spearman correlation analyses were performed between the neuropsychological scales and mean DTI metrics of WM fiber clusters or entire fiber tracts where significant differences were investigated in patients with NMOSD. After FDR correction, p-value < 0.05 represents the significant difference.
Results
Demographic Data and Neuropsychological Scales
The demographic data and neuropsychological scales of participants are summarized in Table 2. There were no significant differences in gender, age, and education level between NMOSD and HCs. However, when compared to HCs, NMOSD showed higher HAMD, HAMA, FSS, and lower DST, SDMT, MMSE, MoCA scores (p < 0.05).
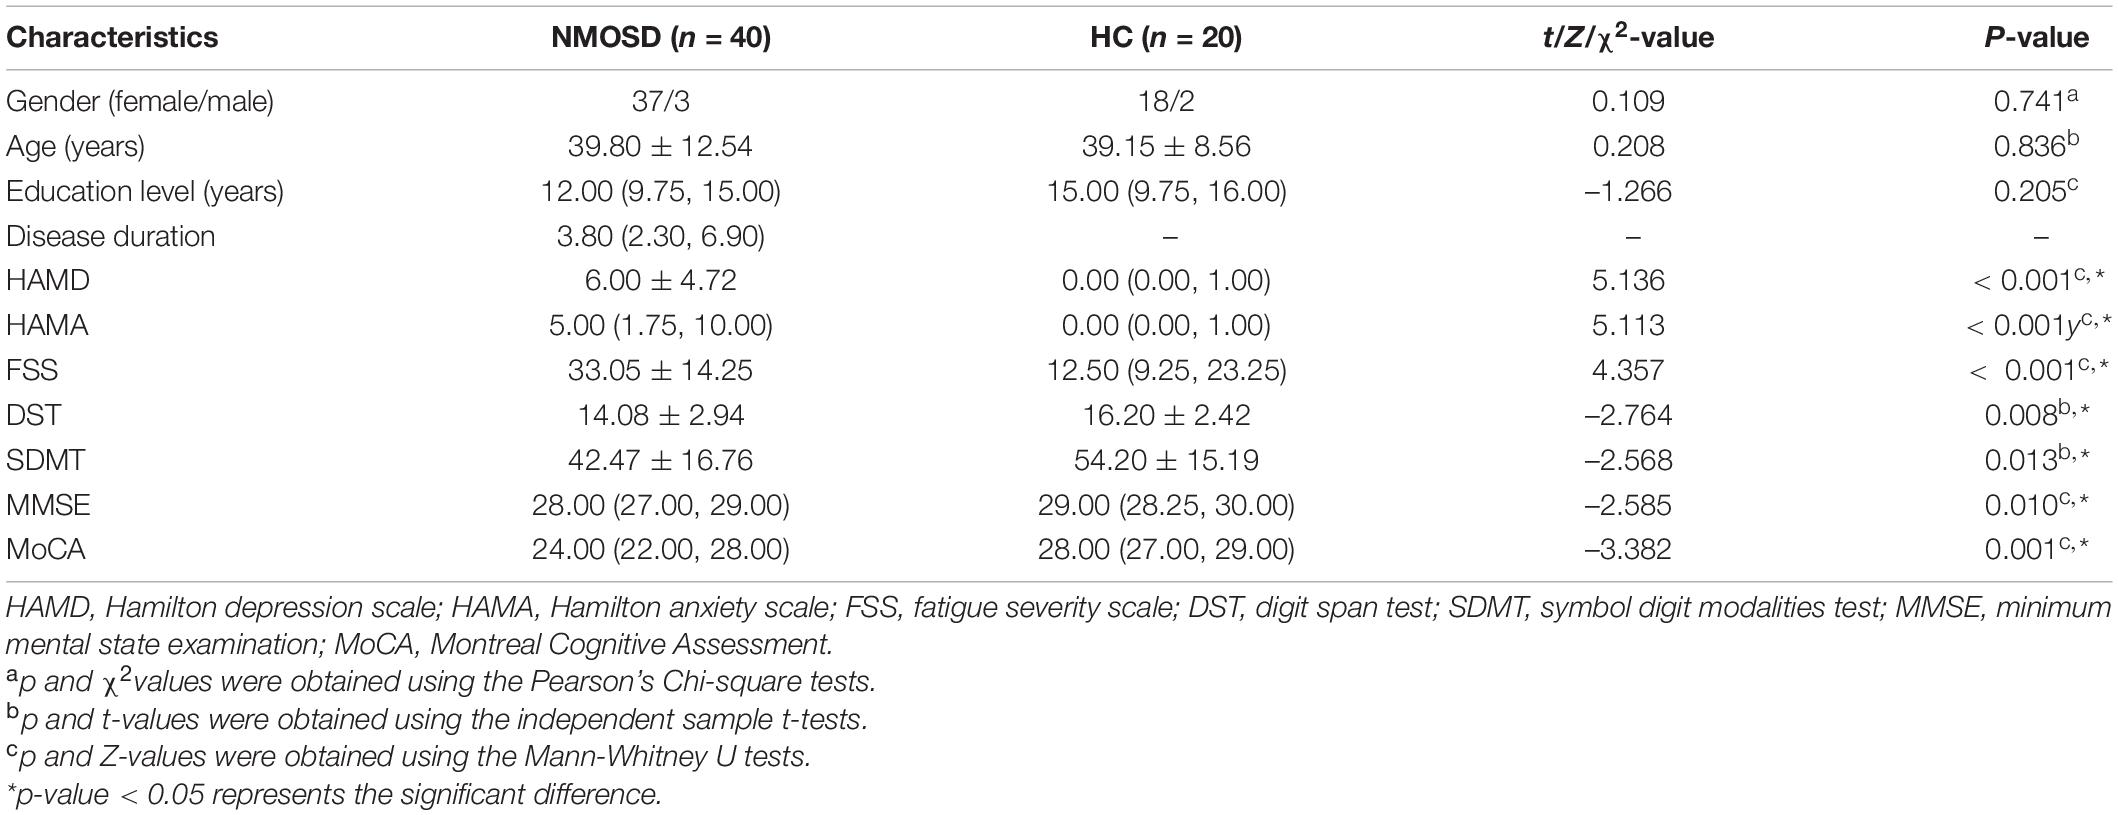
Table 2. Demographic data and neuropsychological scales of participants.
Alterations in Entire White Matter Fiber Tracts
For FA of the entire WM fiber tracts, as compared to HC, NMOSD showed a significant reduction in the L_IFOF (t = –2.254, p = 0.026).
For MD of the entire WM fiber tracts, NMOSD showed a significant increment in the L_TR (t = 2.388, p = 0.020), L_CST (t = 4.403, p < 0.001), R_CST (t = 3.359, p = 0.001), R_CC (t = 2.892, p = 0.005), L_IFOF (t = 2.226, p = 0.030), R_IFOF (t = 3.370, p = 0.001), L_ILF (t = 2.081, p = 0.042), L_SLF (t = 3.361, p = 0.001), and R_AF (t = 2.408, p = 0.019).
For AD of the entire WM fiber tracts, NMOSD showed a significant increment in the L_TR (t = 2.606, p = 0.012), L_CST (t = 2.442, p = 0.018), R_CST (t = 2.551, p = 0.013), R_CC (t = 3.040, p = 0.004), R_IFOF (t = 2.705, p = 0.009), L_SLF (t = 2.768, p = 0.008), R_UF (t = 2.431, p = 0.018), and L_AF (t = 3.420, p = 0.001).
For RD of the entire WM fiber tracts, NMOSD showed a significant increment in the L_CST (t = 2.515, p = 0.015), R_CST (t = 2.054, p = 0.044), L_IFOF (t = 2.435, p = 0.018), R_IFOF (t = 2.592, p = 0.012), L_ILF (t = 2.243, p = 0.029), and L_SLF (t = 2.234, p = 0.029). All group differences in entire WM fiber tracts of DTI metrics, such as FA, AD, MD, and RD, are showed in Figure 2.
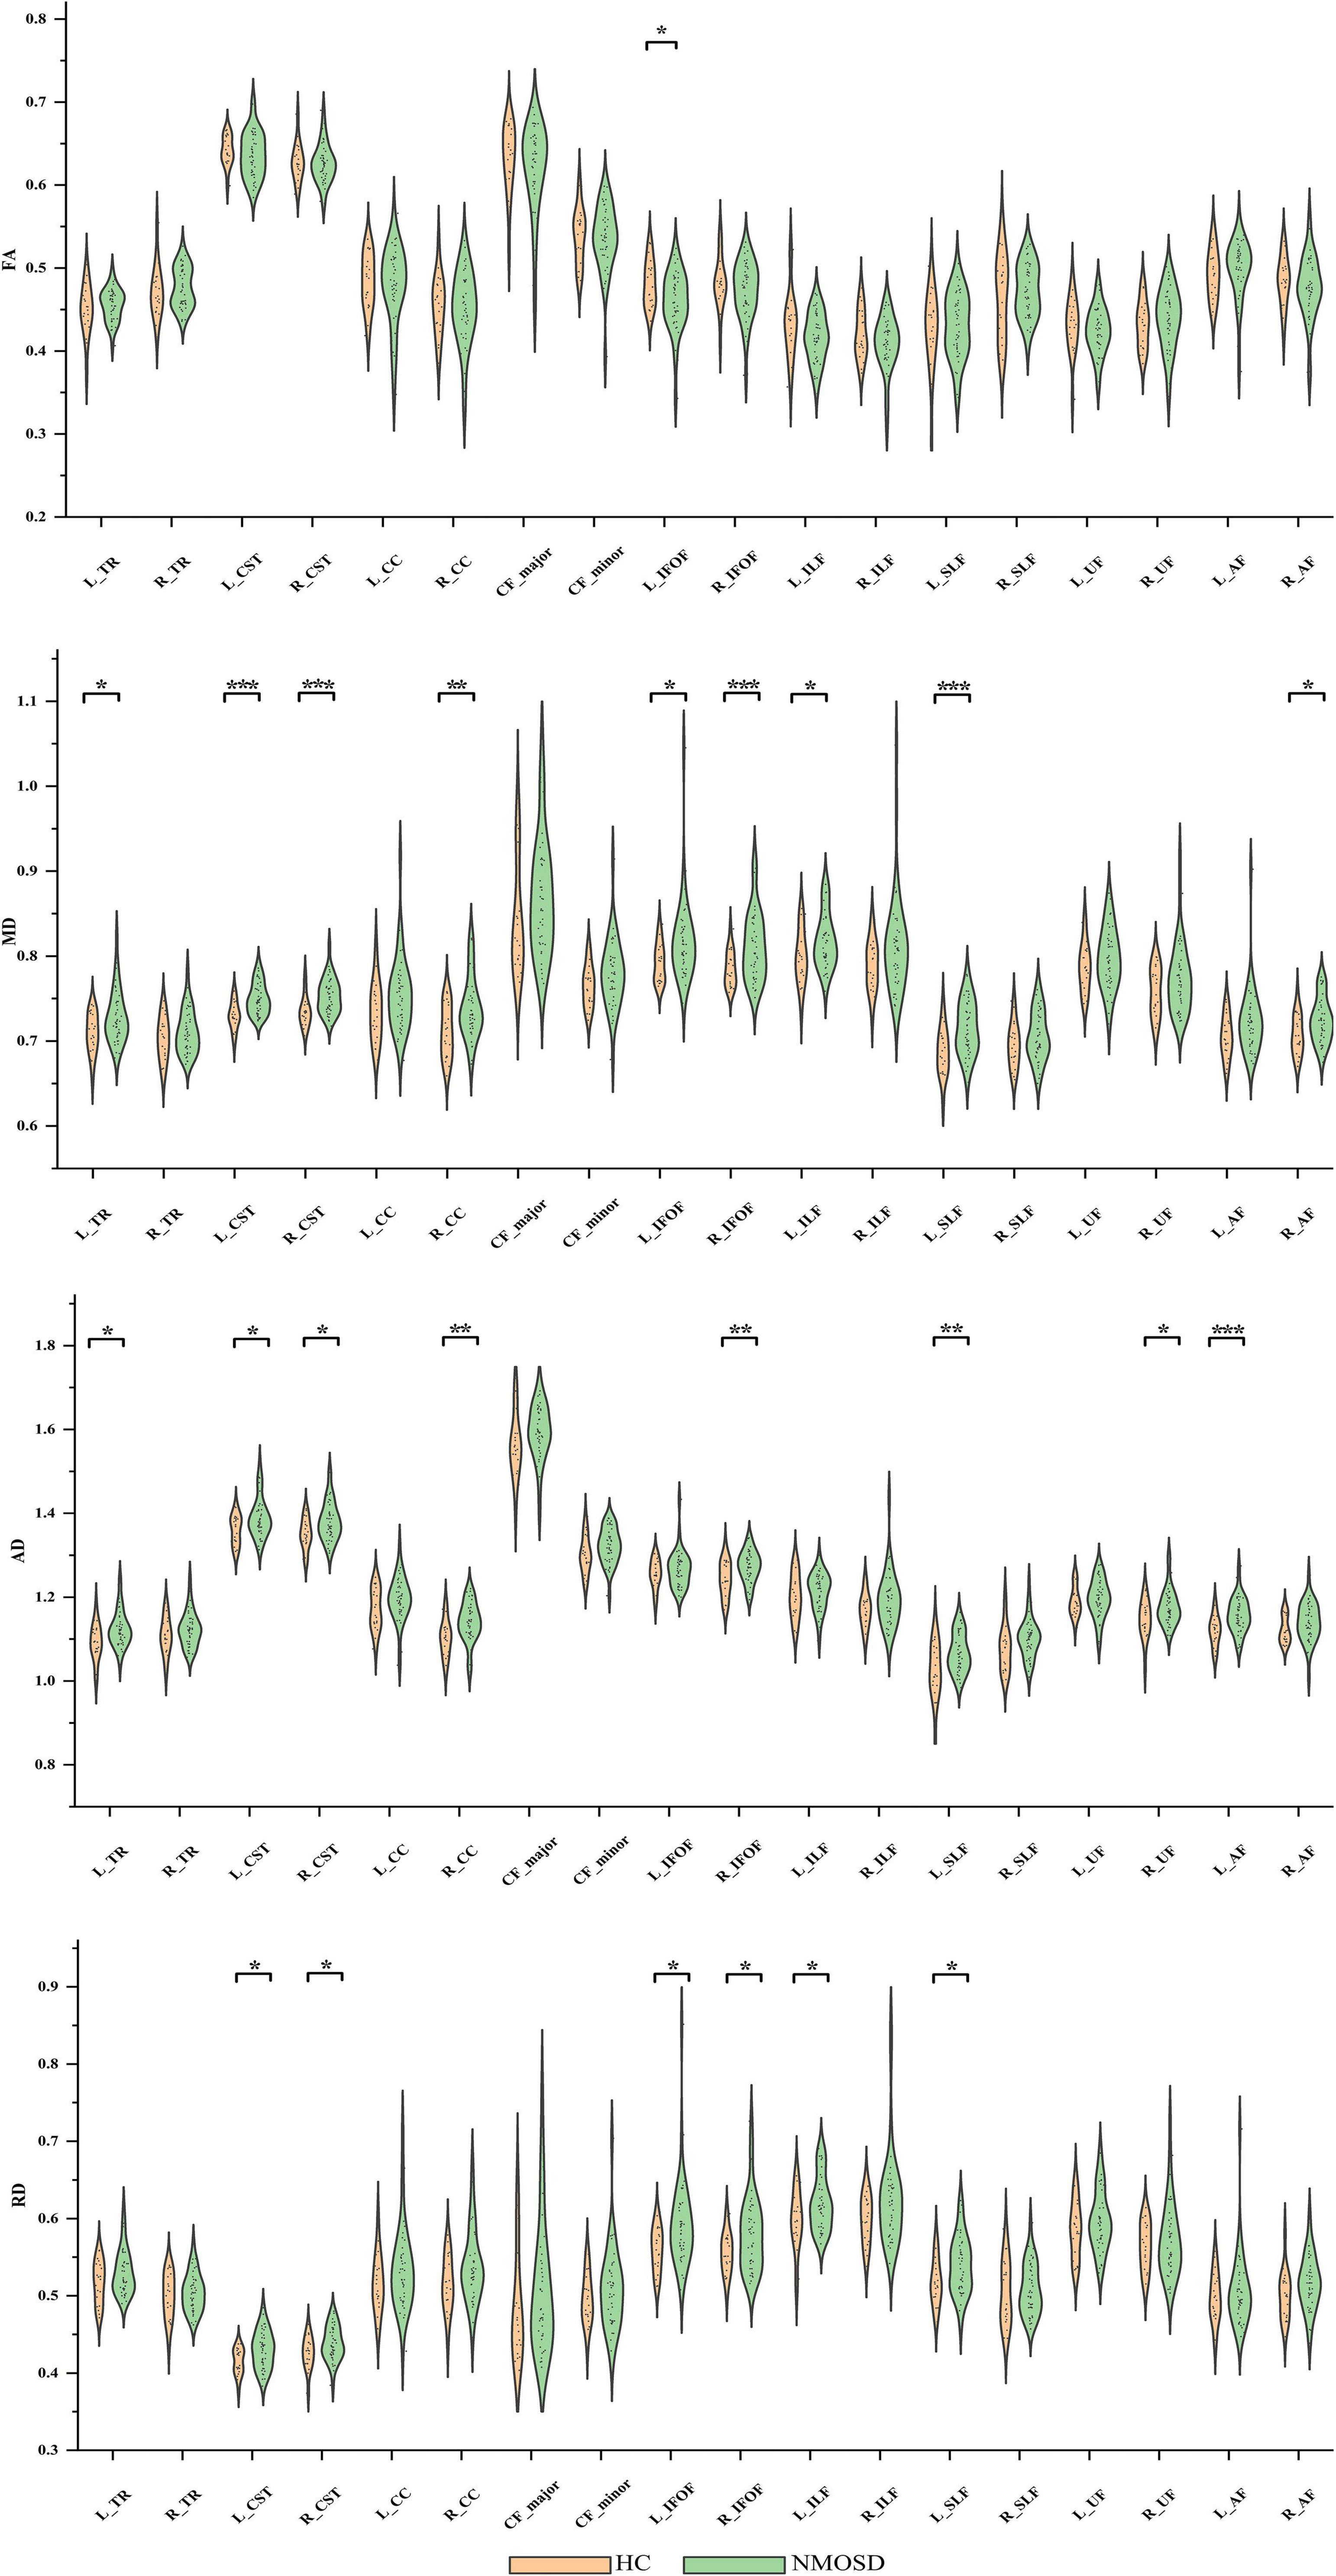
Figure 2. Group differences in entire white matter (WM) fiber tracts of diffusion tensor imaging (DTI) metrics, such as fractional anisotropy (FA), mean diffusion (MD), axial diffusivity (AD), and radial diffusivity (RD). *p < 0.05, **p < 0.01, ***p < 0.001. NMOSD, neuromyelitis optica spectrum disorder; HC, healthy controls.
Alterations in Pointwise White Matter Fiber Tracts
In the pointwise WM fiber tracts comparison of FA, when compared to HCs, NMOSD showed a significant reduction in the anterior portion of the L_IFOF (nodes 2–6 and 38–42; Figure 3, p < 0.05, FDR correction).
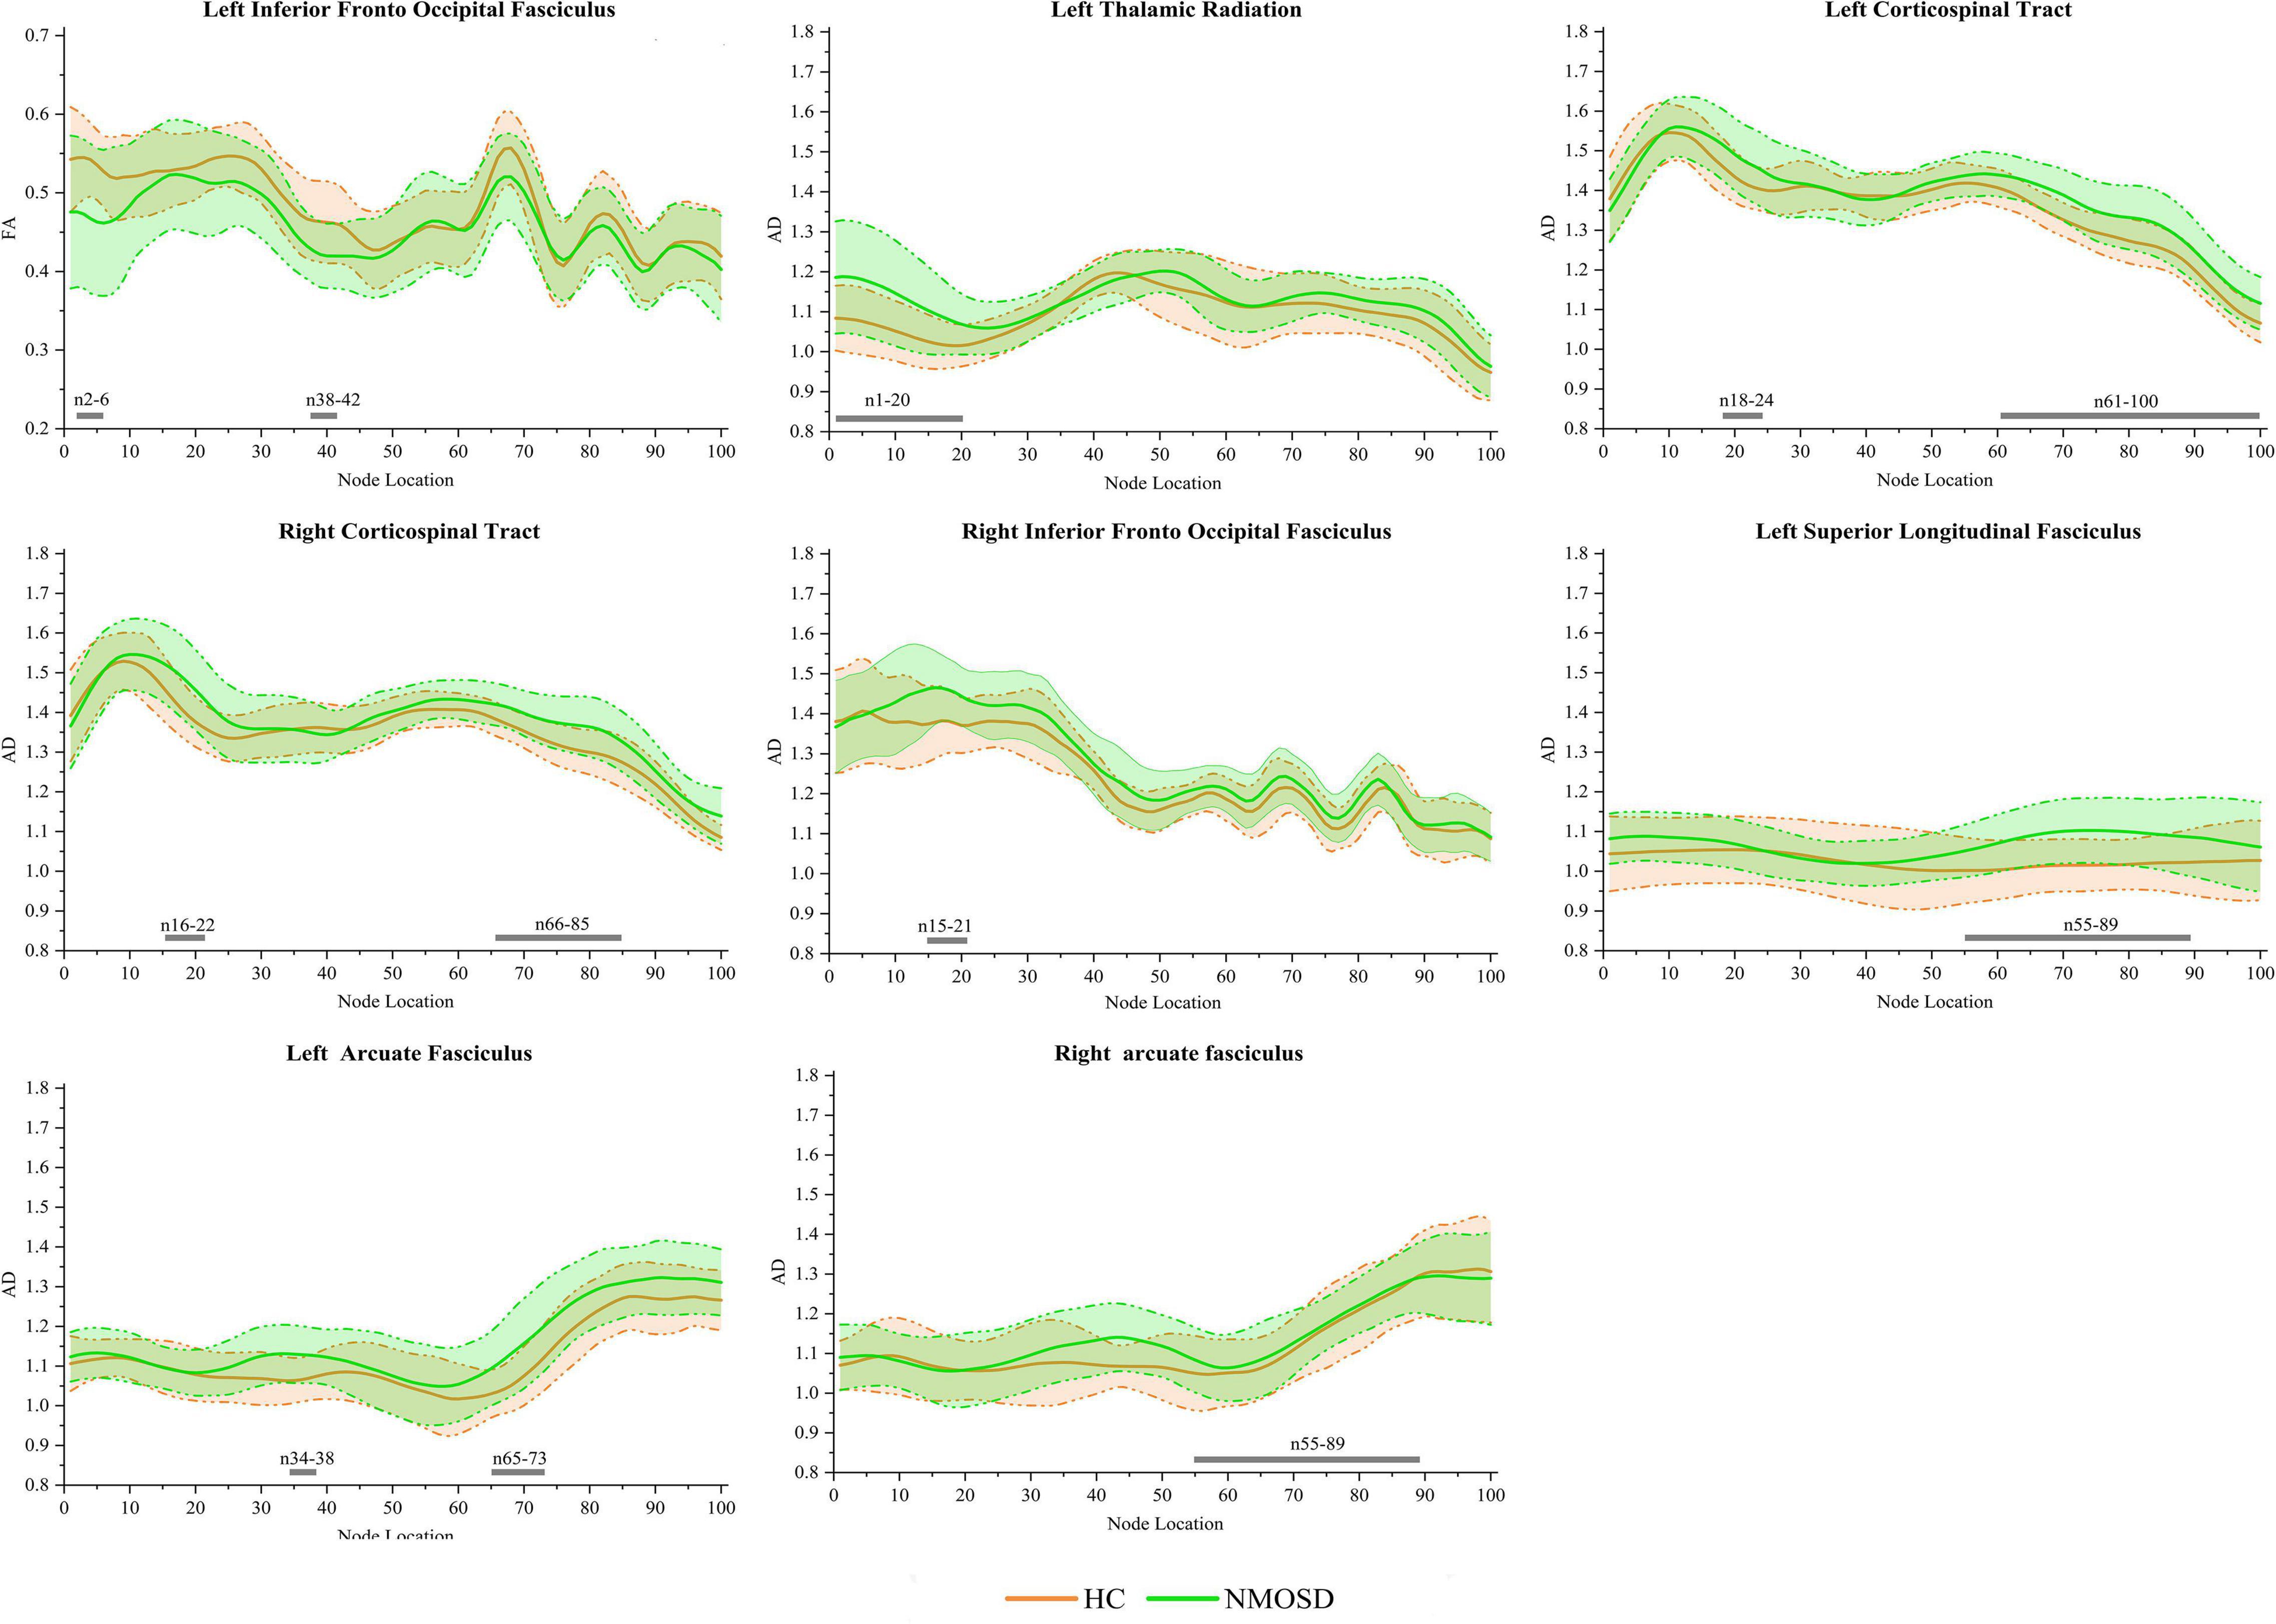
Figure 3. Group differences in pointwise white matter (WM) fiber tracts of fractional anisotropy (FA) and axial diffusivity (AD) between neuromyelitis optica spectrum disorder (NMOSD) and healthy controls [HCs; p < 0.05, false discovery rate (FDR) correction]. The green line represents the NMOSD group, and the orange line represents the HC group [solid lines for means and shaded regions for standard deviations (SDs)]. The gray bars at the bottom are the location of the fiber nodes with significant differences between the two groups.
In the pointwise WM fiber tracts comparison of AD, NMOSD showed a significant increment in widespread positions as follows: (1) the anterior portion of the L_TR (nodes 1–20); (2) the anterior and posterior portions of the L_CST (nodes 18–24 and 61–100); (3) the anterior and posterior portions of the R_CST (nodes 16–22 and 66–85); (4) the anterior portion of the R_IFOF (nodes 15–21); (5) the posterior portion of the L_SLF (nodes 55–89); (6) the anterior and posterior portions of the L_AF (nodes 34–38 and 65–73); and (7) the posterior portion of the R_AF (nodes 55–89; Figure 3, p < 0.05, FDR correction).
In the pointwise WM fiber tract comparison of MD, NMOSD showed a significant increment in widespread positions as follows: (1) the anterior portion of the L_TR (nodes 1–21); (2) the anterior portion of the R_TR (nodes 8–22); (3) the anterior and posterior portions of the L_CST (nodes 11–37, 45–50, and 67–100); (4) the anterior and posterior portions of the R_CST (nodes 13–27 and 74–100); (5) the anterior and posterior portions of the R_CC (nodes 18–26, 38–41, 66–70, and 94–98); (6) the anterior portion of the L_IFOF (nodes 34–43); (7) the anterior portion of the R_IFOF (nodes 14–39); (8) the anterior portion of the L_ILF (nodes 1–26); and (9) almost entire portion of the L_SLF (nodes 1–85; Figure 4, p < 0.05, FDR correction).
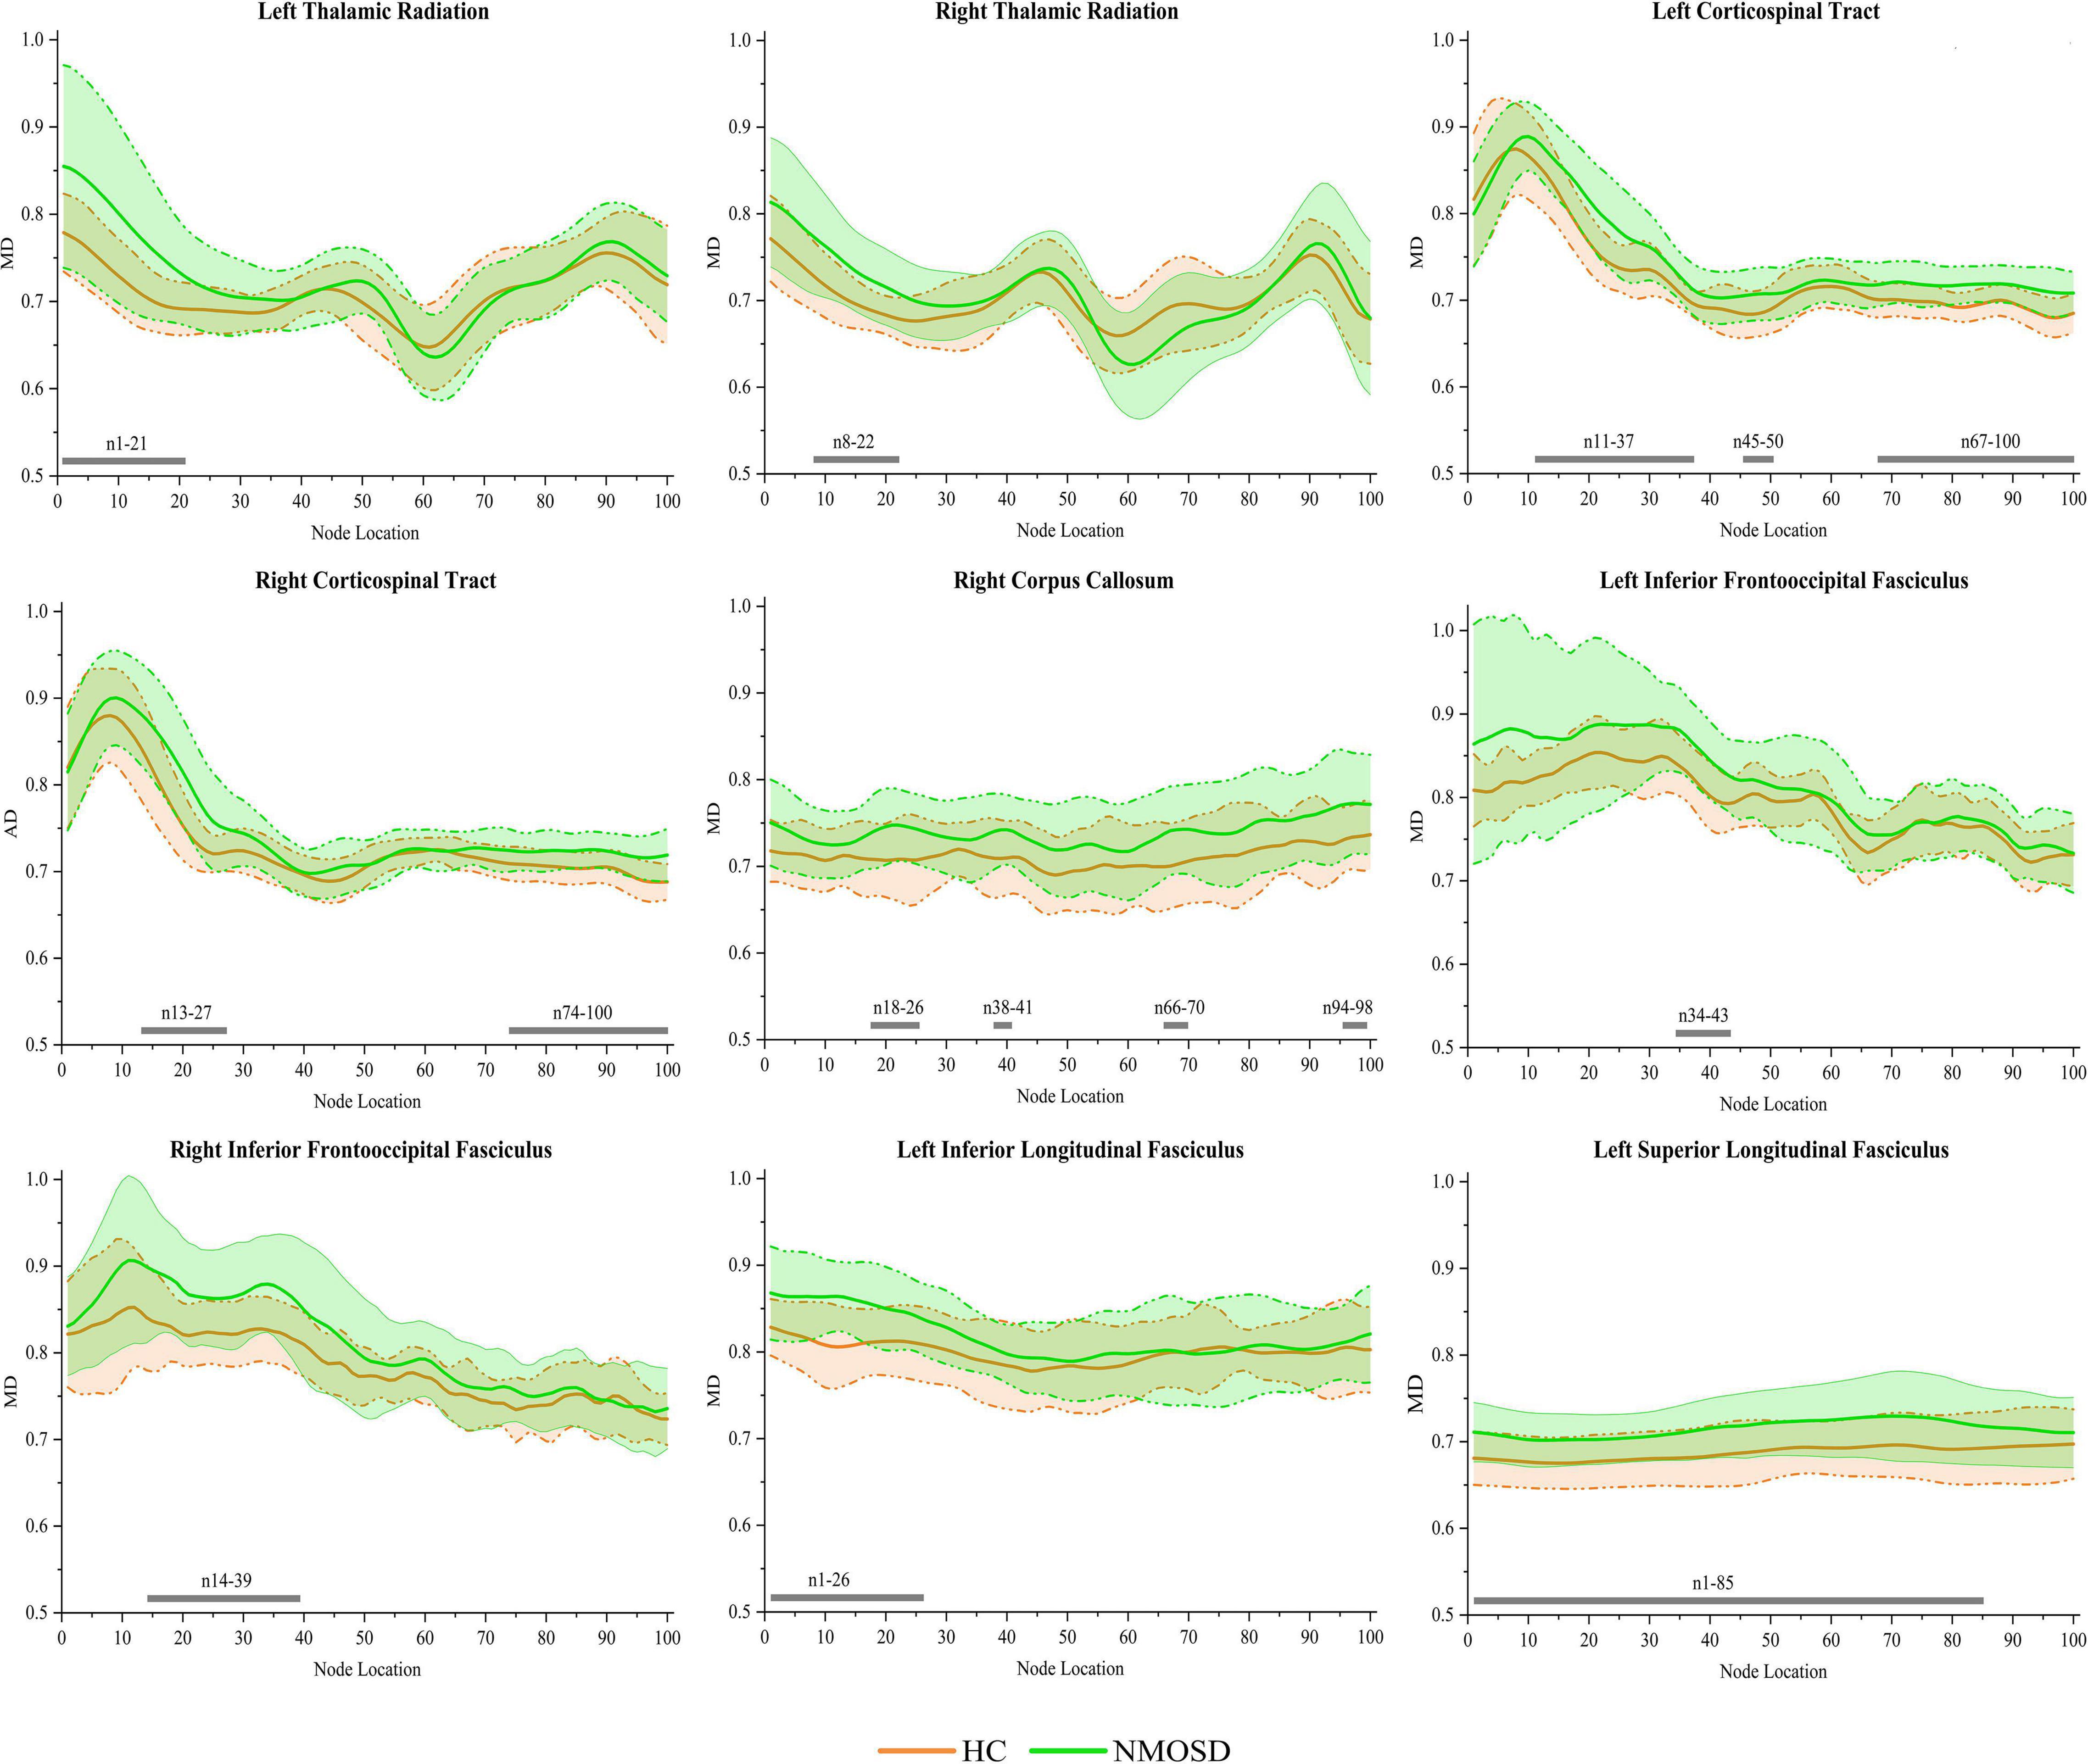
Figure 4. Group differences in pointwise white matter (WM) fiber tracts of mean diffusion (MD) between NMOSD and healthy control [HC; p < 0.05, false discovery rate (FDR) correction]. The green line represents the NMOSD group, and the orange line represents the HC group (solid lines for means and shaded regions for standard deviations). The gray bars at the bottom are the location of the fiber nodes with significant differences between the two groups.
In the pointwise WM fiber tract comparison of RD, NMOSD showed a significant increment in widespread positions as follows: (1) the anterior portion of the L_TR (nodes 1–19); (2) the anterior portion of the R_TR (nodes 9–20); (3) the anterior portion of the L_CST (nodes 16–39 and 44–47); (4) the anterior portion of the R_CST (nodes 18–25); (5) the anterior portion of the L_IFOF (nodes 3–11 and 34–44); (6) the anterior portion of the R_IFOF (nodes 18–24 and 30–39); (7) the anterior portion of the L_ILF (nodes 1–16, 23–25, and 32–38); and (8) the anterior portion of the L_SLF (nodes 18–50; Figure 5, p < 0.05, FDR correction).
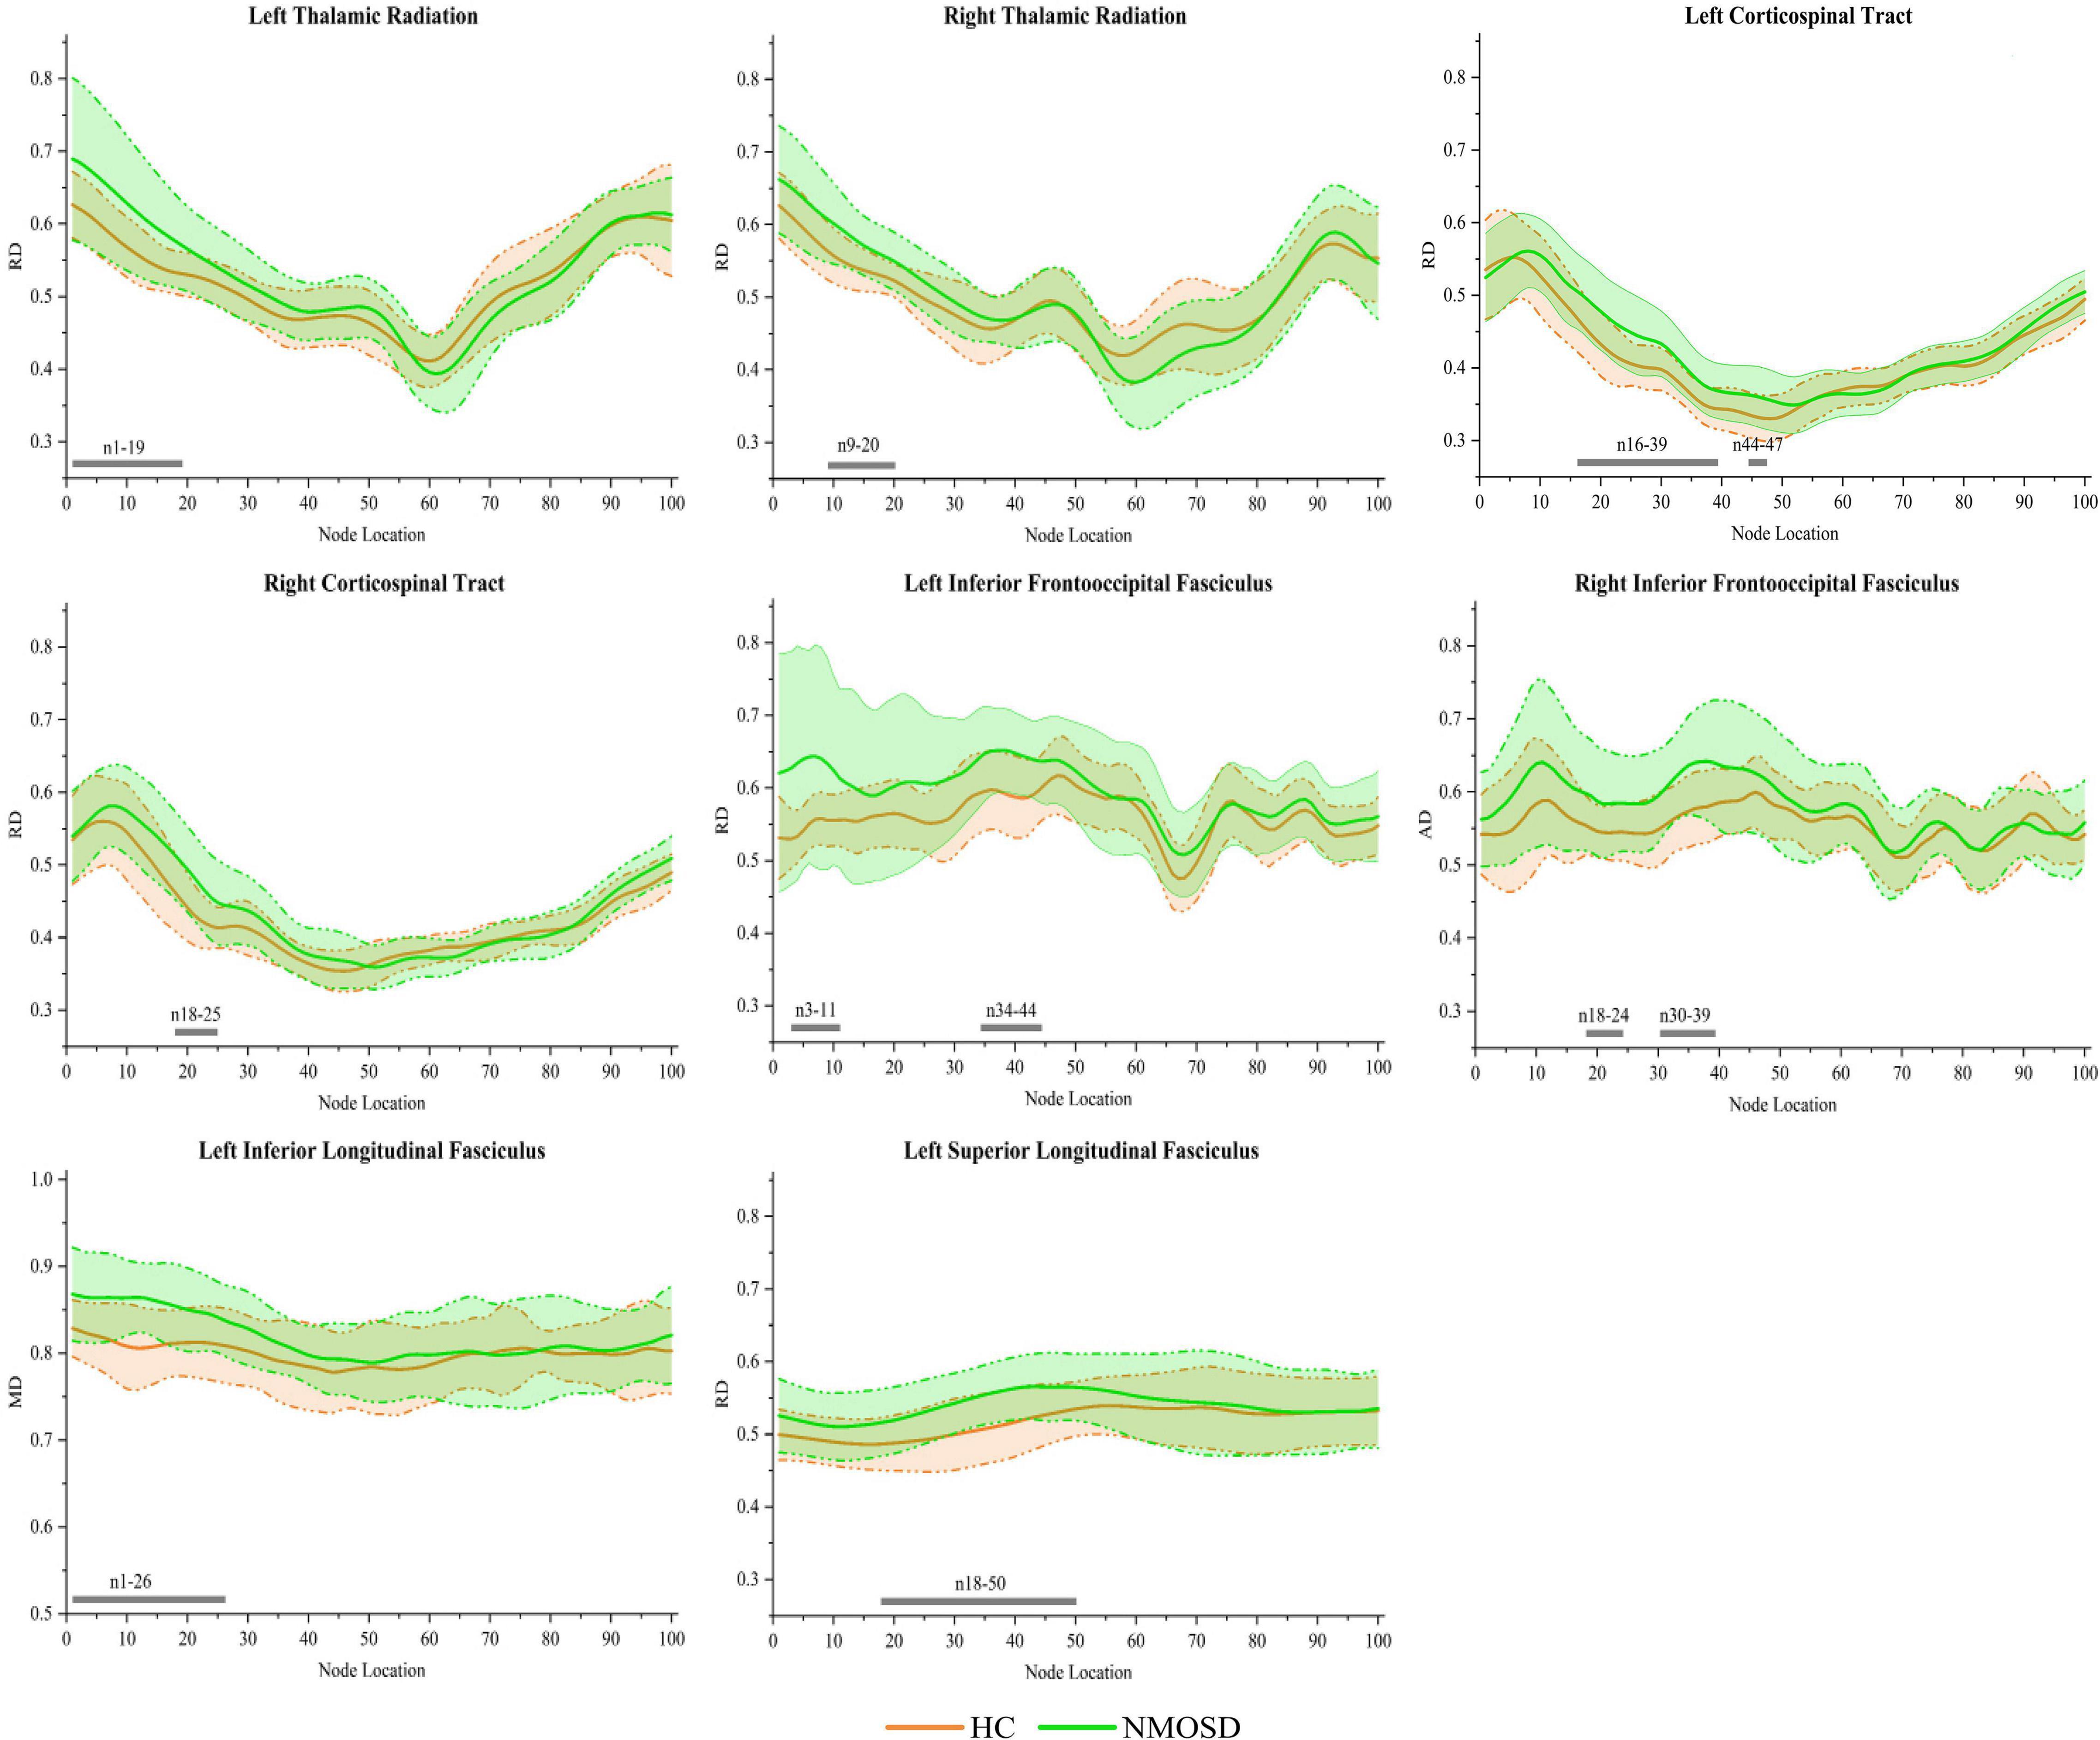
Figure 5. Group differences in pointwise white matter (WM) fiber tracts of radial diffusivity (RD) between neuromyelitis optica spectrum disorder (NMOSD) and healthy control [HC; p < 0.05, false discovery rate (FDR) correction]. The green line represents the NMOSD group, and the orange line represents the HC group (solid lines for means and shaded regions for standard deviations). The gray bars at the bottom are the location of the fiber nodes with significant differences between the two groups.
Correlations Between Diffusion Tensor Imaging Metrics and Clinical Cognitive Performance
Mean diffusion in nodes 1–21 of the L_TR (r = –0.601, p < 0.001), AD in nodes 1–20 of the L_TR (r = –0.569, p < 0.001), and RD in nodes 1–19 of the L_TR (r = –0.585, p < 0.001) had negative correlations with the SDMT scores (Figure 6, p < 0.05, FDR correction).
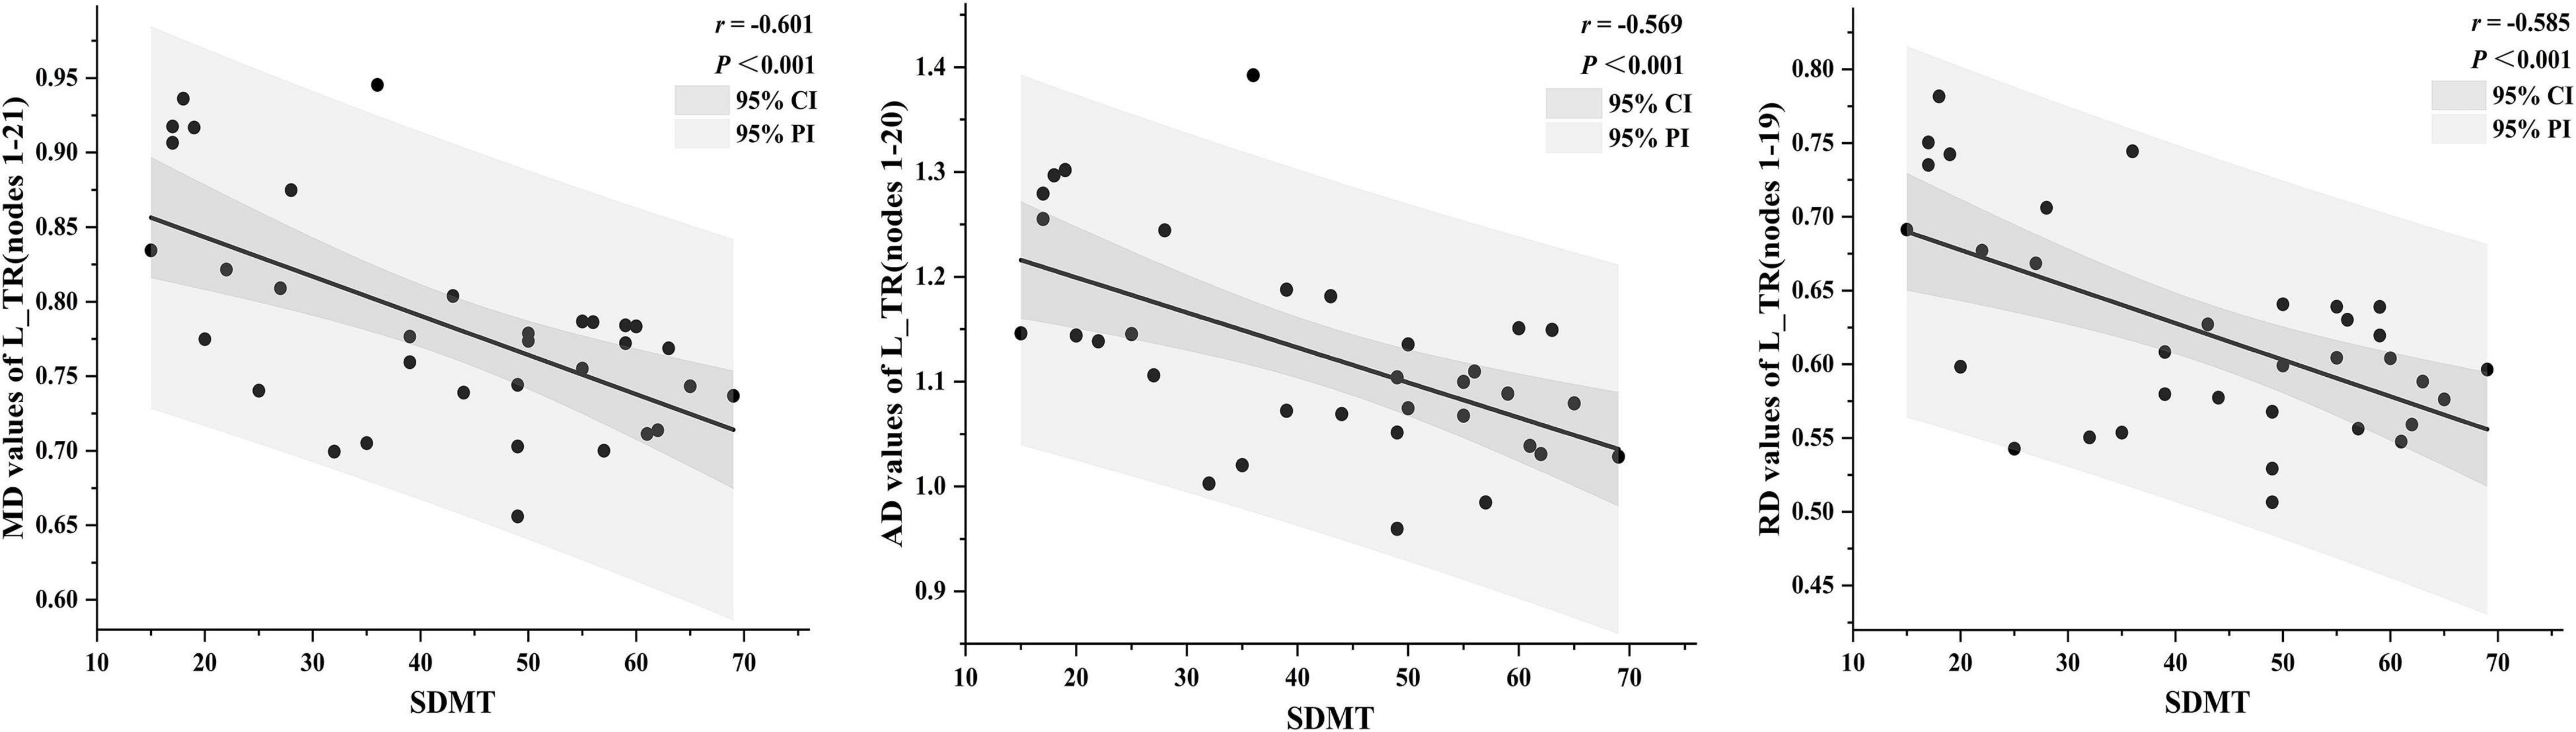
Figure 6. The correlations between diffusion tensor imaging (DTI) metrics and clinical cognitive performance [p < 0.05, false discovery rate (FDR) correction]. The dark gray region represents the 95% confidence interval (CI), and the light gray region represents the 95% prediction interval (PI). SDMT, symbol digit modalities test.
However, no significant correlations between DTI metrics and the other neuropsychological scales, such as HAMA, HAMD, FSS, DST, MMSE, and MoCA, were observed in patients with NMOSD (p > 0.05, FDR correction).
Discussion
In the present study, we investigated the alterations of the tract-specific WM integrity in patients with NMOSD by AFQ and their correlations with cognitive impairment. We found that patients with NMOSD had an extensive WM fiber tract microstructural damage not only at the entire but also at the pointwise level, and the pointwise analyses were performed more sensitively. Furthermore, the DTI metrics, such as MD, AD, and RD, extracted from L_TR showed negative correlations with cognitive impairment.
Diffusion tensor imaging technology is a powerful non-invasive tool for studying complex brain tissue structures. The DTI metrics, such as FA, MD, AD, and RD, are highly sensitive to detect microstructural characteristics, such as fiber density, fiber coherence, fiber orientation, degree of myelination, and WM integrity. In addition, the AFQ is an ideal algorithm based on DTI, which can provide more precise information on the fiber tracts than VBM, TBSS, and traditional tractography. It has been applied to various WM damage-related diseases but NMOSD.
In the current study, for the entire WM fiber tracts, as compared to HC, patients with NMOSD exhibited a decreased FA in the L_IFOF and increased MD, AD, and RD in a wide range of WM fiber tracts, which indicated widespread diffusion changes in patients with NMOSD. It was in agreement with some recent research studies (Kim et al., 2017; Cacciaguerra et al., 2021). However, as reported in several previous studies, only the FA reduction was found in patients with NMOSD, which indicated that the integrity of axons had been damaged, but the extent of the damage may still be relatively minor (Jeong et al., 2016; Chen et al., 2021). It may be due to the longer disease duration and the more lesions contribution of patients included in this study, resulting in more severe WM damage, which can be confirmed by comparison with another research (Kim et al., 2017). It showed the patients with NMOSD had significantly lower mean global FA, higher MD and RD in many WM tracts based on TBSS and ROIs analysis, which was similar to ours. FA reflects the ratio of anisotropic components of water molecules to the entire diffusion tensor, indirectly reflecting the integrity of WM fiber tracts; MD value reflects the degree of diffusion of all water molecules in all directions, showing the diffusion ability of water molecules in tissues; AD reflects the diffusion of water molecules parallel to the direction of nerve fibers, which can provide information on axonal integrity. RD reflects the diffusion of water molecules perpendicular to the direction of nerve fibers, which can provide information about the number of myelin sheaths around nerve cells (Le Bihan et al., 2001; Assaf and Pasternak, 2008). Thus, the reduced FA in the L_IFOF and widespread increased MD, AD, and RD may reflect diffused abnormalities of myelin and fiber axons to cause the widespread WM damage in patients with NMOSD. Interestingly, based on the results, we speculate that MD, AD, and RD seemed to be more sensitive to WM damage than FA, consistent with the previous studies (Jin et al., 2017; Chen et al., 2020). It is worth noting that based on the whole WM fiber tracts by previous TBSS or ROI analysis, it just found out the abnormality of the fiber tracts, its specific regional abnormality was not clear, but the pointwise comparative analysis by AFQ can make up for this defect.
In the pointwise comparison of WM fiber tracts, not only the damaged segments of the different tracts that were more accurately detected but also a few segments of the tracts without differences were also shown. It proved our hypothesis that the destruction of some WM fiber tracts in NMOSD followed a specific pattern. It was also noteworthy that regardless of the entire or pointwise level, the results showed a widespread WM damage, especially for the TR, projection fiber (CST), and association fibers (IFOF, ILF, and SLF), which indicated that the extent of the above WM fiber tract damage may be relatively greater. The TR connects the thalamus with the cerebral hemispheres, while the damage occurred in the thalamus whether in the acute or stable phase of NMOSD (Zhao et al., 2012). The CST is a collection of axons that carry movement-related information from the cerebral cortex to the spinal cord. In addition, the IFOF, ILF, and SLF are the long associative tracts of neurons in the human brain, and it connects various parts, which makes them more vulnerable than other tracts (Chen et al., 2020). These results were similar to several previous TBSS studies explained by the WM secondary degeneration that occurred owing to ON and myelitis (Rueda Lopes et al., 2012; Kim et al., 2017), however, our study can identify more accurate damage location by AFQ.
Similar to the prior studies that reported cognitive impairment in NMOSD, our study showed that NMOSD had higher HAMD, HAMA, and FSS and lower DST, SDMT, MMSE, and MoCA scores than HC (Pache et al., 2016; Zheng et al., 2021). In addition, the correlation analyses were performed between the neuropsychological scales and mean DTI metrics of WM fiber clusters or entire fiber tracts where significant differences were investigated in patients with NMOSD. After FDR correction, our results showed that the SDMT scores had negative correlations with MD, AD, and RD in the anterior portion of the L_TR, which suggests that the more serious the damage to WM microstructure, the worse is the cognitive performance. The TR connects the mediodorsal and anterior thalamus to the prefrontal cortex and the anterior cingulate cortex, and the thalamus is a complex structure, which affects the most sensory and motor pathways and acts as a source of information for the frontal and motor areas (Setiadi et al., 2021). Therefore, the damage to TR may be related to the cognitive impairment. In addition, the correlations were only found from TR in the left hemisphere. The parts of the reasons for the discovery were that (1) the WM vulnerability in NMOSD may have hemispheric heterogeneity similar to Alzheimer’s disease (Chen et al., 2020), and (2) the SDMT is widely used to assess cognitive performance, such as divided attention, perceptual processing speed, visual scanning, and memory. It may mainly be affected by the left hemisphere, which is the abstract thinking center. In conclusion, L_TR played an important role in the cognitive performance of patients with NMOSD, which can be used as imaging markers for the early identification of NMOSD cognitive impairment.
Several limitations also exist in this work. First, only a central portion of the fiber tract is analyzed by AFQ. Although in this way, we will miss some marginal information, it can avoid the need for additional coregistration procedures. Second, due to the AFQ’s strict criteria for fiber tract identification, we could not identify bilateral CH fiber tracts. Finally, the sample size was relatively small. Future work was required to increase the sample size to validate our results.
Conclusion
In conclusion, this study identified specific alterations of 18 WM fiber tracts using the AFQ approach, which will enhance our understanding of WM microstructural abnormalities in NMOSD. In addition, the correlations between DTI altered metrics and cognitive impairment in NMOSD can be used as imaging markers for early identification of NMOSD cognitive impairment.
Data Availability Statement
The raw data supporting the conclusions of this article will be made available by the authors, without undue reservation.
Ethics Statement
The studies involving human participants were reviewed and approved by the Institutional Review Board of the First Affiliated Hospital of Chongqing Medical University. The patients/participants provided their written informed consent to participate in this study.
Author Contributions
ZY offered the research ideas, performed the data processing, and prepared the manuscript. XW performed the statistical analyses and revised the manuscript. QZu performed the graphing. XC assisted in the methodology. ZS offered the data collection support. YH and QZe assisted in MRI scanning. YW provided the revision. JW and YL provided guidance and critical reviews. All authors contributed to the article and approved the submitted version.
Funding
This study was supported by the Key Project of Technological Innovation and Application Development of Chongqing Science and Technology Bureau (CSTC2021 jscx-gksb-N0008).
Conflict of Interest
The authors declare that the research was conducted in the absence of any commercial or financial relationships that could be construed as a potential conflict of interest.
Publisher’s Note
All claims expressed in this article are solely those of the authors and do not necessarily represent those of their affiliated organizations, or those of the publisher, the editors and the reviewers. Any product that may be evaluated in this article, or claim that may be made by its manufacturer, is not guaranteed or endorsed by the publisher.
Acknowledgments
We thank all the subjects who participated in this study.
Abbreviations
NMOSD, neuromyelitis optica spectrum disorder; WM, white matter; DTI, diffusion tensor imaging; AFQ, automated fiber-tract quantification; FA, fractional anisotropy; MD, mean diffusion; AD, axial diffusivity; RD, radial diffusivity; TR, thalamic radiation; CST, corticospinal tract; CC, cingulum cingulate; CH, cingulum hippocampus; IFOF, inferior fronto-occipital fasciculus; ILF, inferior longitudinal fasciculus; SLF, superior longitudinal fasciculus; UF, uncinate fasciculus; AF, arcuate fasciculus; CF_major, callosum forceps major; CF_minor, callosum forceps minor.
Footnotes
- ^ http://www.mricro.com
- ^ https://fsl.fmrib.ox.ac.uk/fsl/fslwiki/
- ^ https://github.com/vistalab/vistasoft
- ^ https://github.com/jyeatman/AFQ
References
Assaf, Y., and Pasternak, O. (2008). Diffusion tensor imaging (DTI)-based white matter mapping in brain research: a review. J. Mol. Neurosci. 34, 51–61. doi: 10.1007/s12031-007-0029-0
Banfi, C., Koschutnig, K., Moll, K., Schulte-Körne, G., Fink, A., and Landerl, K. (2019). White matter alterations and tract lateralization in children with dyslexia and isolated spelling deficits. Hum. Brain Mapp. 40, 765–776. doi: 10.1002/hbm.24410
Cacciaguerra, L., Rocca, M. A., Storelli, L., Radaelli, M., and Filippi, M. (2021). Mapping white matter damage distribution in neuromyelitis optica spectrum disorders with a multimodal MRI approach. Mult. Scler. 27, 841–854. doi: 10.1177/1352458520941493
Chen, H. F., Huang, L. L., Li, H. Y., Qian, Y., Yang, D., Qing, Z., et al. (2020). Microstructural disruption of the right inferior fronto-occipital and inferior longitudinal fasciculus contributes to WMH-related cognitive impairment. CNS Neurosci. Ther. 26, 576–588. doi: 10.1111/cns.13283
Chen, X., Roberts, N., Zheng, Q., Peng, Y., Han, Y., Luo, Q., et al. (2021). Progressive brain microstructural damage in patients with multiple sclerosis but not in patients with neuromyelitis optica spectrum disorder: a cross-sectional and follow-up tract-based spatial statistics study. Mult. Scler. Relat. Disord. 55:103178. doi: 10.1016/j.msard.2021.103178
Jeong, I. H., Choi, J. Y., Kim, S. H., Hyun, J. W., Joung, A., Lee, J., et al. (2016). Comparison of myelin water fraction values in periventricular white matter lesions between multiple sclerosis and neuromyelitis optica spectrum disorder. Mult. Scler. 22, 1616–1620. doi: 10.1177/1352458516636247
Jiang, Y., Liu, Y., Gao, B., Che, Y., Lin, L., Jiang, J., et al. (2021). Segmental Abnormalities of White Matter Microstructure in End-Stage Renal Disease Patients: an Automated Fiber Quantification Tractography Study. Front Neurosci. 15:765677. doi: 10.3389/fnins.2021.765677
Jin, Y., Huang, C., Daianu, M., Zhan, L., Dennis, E. L., Reid, R. I., et al. (2017). 3D tract-specific local and global analysis of white matter integrity in Alzheimer’s disease. Hum. Brain Mapp. 38, 1191–1207. doi: 10.1002/hbm.23448
Jones, D. K., Symms, M. R., Cercignani, M., and Howard, R. J. (2005). The effect of filter size on VBM analyses of DT-MRI data. NeuroImage 26, 546–554. doi: 10.1016/j.neuroimage.2005.02.013
Kim, S. H., Kwak, K., Hyun, J. W., Joung, A., Lee, S. H., Choi, Y. H., et al. (2017). Diffusion tensor imaging of normal-appearing white matter in patients with neuromyelitis optica spectrum disorder and multiple sclerosis. Euro. J. Neurol. 24, 966–973. doi: 10.1111/ene.13321
Kimura, M. C., Doring, T. M., Rueda, F. C., Tukamoto, G., and Gasparetto, E. L. (2014). In vivo assessment of white matter damage in neuromyelitis optica: a diffusion tensor and diffusion kurtosis MR imaging study. J. Neurol. Sci. 345, 172–175. doi: 10.1016/j.jns.2014.07.035
Kuchling, J., Backner, Y., Oertel, F. C., Raz, N., Bellmann-Strobl, J., Ruprecht, K., et al. (2018). Comparison of probabilistic tractography and tract-based spatial statistics for assessing optic radiation damage in patients with autoimmune inflammatory disorders of the central nervous system. NeuroImage Clin. 19, 538–550. doi: 10.1016/j.nicl.2018.05.004
Le Bihan, D., Mangin, J. F., Poupon, C., Clark, C. A., Pappata, S., Molko, N., et al. (2001). Diffusion tensor imaging: concepts and applications. J. Magn. Reson. Imaging. 13, 534–546. doi: 10.1002/jmri.1076
Liu, Y., Duan, Y., He, Y., Yu, C., Wang, J., Huang, J., et al. (2012). A tract-based diffusion study of cerebral white matter in neuromyelitis optica reveals widespread pathological alterations. Mult. Scler. 18, 1013–1021. doi: 10.1177/1352458511431731
Liu, Y., Fu, Y., Schoonheim, M. M., Zhang, N., Fan, M., Su, L., et al. (2015). Structural MRI substrates of cognitive impairment in neuromyelitis optica. Neurology 85, 1491–1499. doi: 10.1212/wnl.0000000000002067
Moore, P., Methley, A., Pollard, C., Mutch, K., Hamid, S., Elsone, L., et al. (2016). Cognitive and psychiatric comorbidities in neuromyelitis optica. J. Neurol. Sci. 360, 4–9. doi: 10.1016/j.jns.2015.11.031
Pache, F., Zimmermann, H., Finke, C., Lacheta, A., Papazoglou, S., Kuchling, J., et al. (2016). Brain parenchymal damage in neuromyelitis optica spectrum disorder – A multimodal MRI study. Euro. Radiol. 26, 4413–4422. doi: 10.1007/s00330-016-4282-x
Rueda Lopes, F. C., Doring, T., Martins, C., Cabral, F. C., Malfetano, F. R., Pereira, V. C., et al. (2012). The role of demyelination in neuromyelitis optica damage: diffusion-tensor MR imaging study. Radiology 263, 235–242. doi: 10.1148/radiol.12111241
Saji, E., Arakawa, M., Yanagawa, K., Toyoshima, Y., Yokoseki, A., Okamoto, K., et al. (2013). Cognitive impairment and cortical degeneration in neuromyelitis optica. Ann. Neurol. 73, 65–76. doi: 10.1002/ana.23721
Setiadi, T. M., Martens, S., Opmeer, E. M., Marsman, J. C., Tumati, S., Reesink, F. E., et al. (2021). Widespread white matter aberration is associated with the severity of apathy in amnestic Mild Cognitive Impairment: tract-based spatial statistics analysis. NeuroImage. Clin. 29:102567. doi: 10.1016/j.nicl.2021.102567
Shu, M., Yu, C., Shi, Q., Li, Y., Niu, K., Zhang, S., et al. (2021). Alterations in white matter integrity and asymmetry in patients with benign childhood epilepsy with centrotemporal spikes and childhood absence epilepsy: an automated fiber quantification tractography study. Epilepsy Behav. 123:108235. doi: 10.1016/j.yebeh.2021.108235
Stone, D. B., Ryman, S. G., Hartman, A. P., Wertz, C. J., and Vakhtin, A. A. (2021). Specific White Matter Tracts and Diffusion Properties Predict Conversion From Mild Cognitive Impairment to Alzheimer’s Disease. Front. Aging Neurosci. 13:711579. doi: 10.3389/fnagi.2021.711579
Sun, H., Lui, S., Yao, L., Deng, W., Xiao, Y., Zhang, W., et al. (2015). Two Patterns of White Matter Abnormalities in Medication-Naive Patients With First-Episode Schizophrenia Revealed by Diffusion Tensor Imaging and Cluster Analysis. JAMA Psychiatry 72, 678–686. doi: 10.1001/jamapsychiatry.2015.0505
Wingerchuk, D. M., Banwell, B., Bennett, J. L., Cabre, P., Carroll, W., Chitnis, T., et al. (2015). International consensus diagnostic criteria for neuromyelitis optica spectrum disorders. Neurology 85, 177–189. doi: 10.1212/wnl.0000000000001729
Wingerchuk, D. M., Lennon, V. A., Lucchinetti, C. F., Pittock, S. J., and Weinshenker, B. G. (2007). The spectrum of neuromyelitis optica. Lancet Neurol. 6, 805–815. doi: 10.1016/s1474-4422(07)70216-8
Yeatman, J. D., Dougherty, R. F., Myall, N. J., Wandell, B. A., and Feldman, H. M. (2012). Tract profiles of white matter properties: automating fiber-tract quantification. PLoS One. 7:e49790. doi: 10.1371/journal.pone.0049790
Zhang, X., Sun, Y., Li, W., Liu, B., Wu, W., Zhao, H., et al. (2019). Characterization of white matter changes along fibers by automated fiber quantification in the early stages of Alzheimer’s disease. NeuroImage. Clin. 22:101723. doi: 10.1016/j.nicl.2019.101723
Zhao, D. D., Zhou, H. Y., Wu, Q. Z., Liu, J., Chen, X. Y., He, D., et al. (2012). Diffusion tensor imaging characterization of occult brain damage in relapsing neuromyelitis optica using 3.0T magnetic resonance imaging techniques. NeuroImage 59, 3173–3177. doi: 10.1016/j.neuroimage.2011.11.022
Keywords: neuromyelitis optica spectrum disorder, white matter, diffusion tensor imaging, automated fiber-tract quantification, cognitive impairment
Citation: Yan Z, Wang X, Zhu Q, Shi Z, Chen X, Han Y, Zheng Q, Wei Y, Wang J and Li Y (2022) Alterations in White Matter Fiber Tracts Characterized by Automated Fiber-Tract Quantification and Their Correlations With Cognitive Impairment in Neuromyelitis Optica Spectrum Disorder Patients. Front. Neurosci. 16:904309. doi: 10.3389/fnins.2022.904309
Received: 25 March 2022; Accepted: 30 May 2022;
Published: 01 July 2022.
Edited by:
Hui Shen, National University of Defense Technology, ChinaReviewed by:
Yanwei Miao, Dalian Medical University, ChinaPeng Fang, Fourth Military Medical University, China
Copyright © 2022 Yan, Wang, Zhu, Shi, Chen, Han, Zheng, Wei, Wang and Li. This is an open-access article distributed under the terms of the Creative Commons Attribution License (CC BY). The use, distribution or reproduction in other forums is permitted, provided the original author(s) and the copyright owner(s) are credited and that the original publication in this journal is cited, in accordance with accepted academic practice. No use, distribution or reproduction is permitted which does not comply with these terms.
*Correspondence: Jingjie Wang, MzQ1MTUxMDk3QHFxLmNvbQ==; Yongmei Li, bHltemhhbmc3MEAxNjMuY29t
†These authors share first authorship
‡These authors have contributed equally to this work