
94% of researchers rate our articles as excellent or good
Learn more about the work of our research integrity team to safeguard the quality of each article we publish.
Find out more
ORIGINAL RESEARCH article
Front. Neurosci., 14 April 2022
Sec. Neurodegeneration
Volume 16 - 2022 | https://doi.org/10.3389/fnins.2022.819010
This article is part of the Research TopicThe Impact of Neurofilament Light Chain (NFL) Quantification in Serum and Cerebrospinal Fluid in Neurodegenerative DiseasesView all 17 articles
 Alexandros A. Polymeris1*
 Fabrice Helfenstein2
 Pascal Benkert2Stefanie Aeschbacher3,4
 David Leppert5
 Michael Coslovsky2,3
 Eline Willemse5Sabine Schaedelin2Manuel R. Blum6,7
 Nicolas Rodondi6,7Tobias Reichlin8Giorgio Moschovitis9
 Jens Wuerfel10
 Gian Marco De Marchis1
 Stefan T. Engelter1,11
 Philippe A. Lyrer1
 David Conen12
 Michael Kühne3,4Stefan Osswald3,4Leo H. Bonati1†
 Jens Kuhle5*† and the Swiss-AF Investigators
Objective: Serum neurofilament light chain (sNfL) is increasingly used as a neuroaxonal injury biomarker in the elderly. Besides age, little is known about how other physiological factors like renal function and body mass index (BMI) alter its levels. Here, we investigated the association of estimated glomerular filtration rate (eGFR) and BMI with sNfL in a large sample of elderly patients with atrial fibrillation (AF).
Methods: This is a cross-sectional analysis from the Swiss-AF Cohort (NCT02105844). We measured sNfL using an ultrasensitive single-molecule array assay. We calculated eGFR using the chronic kidney disease epidemiology collaboration (CKD-EPI) creatinine (eGFRcrea) and creatinine–cystatin C (eGFRcrea–cys) formulas, and BMI from weight and height measurements. We evaluated the role of eGFR and BMI as determinants of sNfL levels using multivariable linear regression and the adjusted R2 (R2adj).
Results: Among 2,277 Swiss-AF participants (mean age 73.3 years), eGFRcrea showed an inverse curvilinear association with sNfL after adjustment for age and cardiovascular comorbidities. BMI also showed an independent, inverse linear association with sNfL. The R2adj of models with age, eGFRcrea, and BMI alone was 0.26, 0.35, and 0.02, respectively. A model with age and eGFRcrea combined explained 45% of the sNfL variance. Sensitivity analyses (i) further adjusting for vascular brain lesions (N = 1,402 participants with MRI) and (ii) using eGFRcrea–cys yielded consistent results.
Interpretation: In an elderly AF cohort, both renal function and BMI were associated with sNfL, but only renal function explained a substantial proportion of the sNfL variance. This should be taken into account when using sNfL in elderly patients or patients with cardiovascular disease.
Neurofilament light chain (NfL) is a cytoskeletal protein exclusive to neurons. Following neuroaxonal damage, it is released into the extracellular space, cerebrospinal fluid, and eventually peripheral blood. Over the past years, NfL has been established as the first blood-based biomarker reflecting disease activity and treatment response in traumatic brain injury and neurodegenerative diseases (Khalil et al., 2018; Barro et al., 2020; Gafson et al., 2020). Considering the increasing use of blood NfL as a biomarker for neurological diseases in clinical research and the perspective of its diagnostic and prognostic applications in individual clinical practice, a deeper understanding of its homeostasis (including distribution and clearance) in the blood compartment is needed to elucidate physiological factors that might affect its association with disease processes (Barro et al., 2020; Gafson et al., 2020). This is becoming increasingly important for NfL-based investigations of normal aging (Khalil et al., 2020), as well as cerebrovascular disease (Gattringer et al., 2017; Duering et al., 2018; Tiedt et al., 2018; Peters et al., 2020), atrial fibrillation (AF) (Polymeris et al., 2020), and dementia (Zhao et al., 2019), where accumulating age-related comorbidities might both interfere with the homeostasis of NfL and directly induce neuronal damage per se (Barro et al., 2020; Gafson et al., 2020).
While the association of NfL blood levels with age has been consistently demonstrated across a variety of patient populations and healthy controls (Khalil et al., 2018, 2020), their association with renal function and body mass index (BMI) was only recently reported in elderly diabetic patients and younger patients with multiple sclerosis, respectively (Korley et al., 2019; Akamine et al., 2020; Manouchehrinia et al., 2020). However, little is known on how these factors impact NfL concentrations relative to age, one another, and cardiovascular comorbidities and vascular brain lesions, which are increasingly prevalent in the elderly (Vermeer et al., 2007; Wardlaw et al., 2013). Such data are necessary for a systematic appraisal of the importance of these factors as potential confounders and the need to account for them in future use of NfL as a laboratory measure in elderly individuals.
With this in mind, we investigated the association of (i) estimated glomerular filtration rate (eGFR) and (ii) BMI with serum NfL (sNfL) concentrations in a large, well-characterized cohort of elderly AF patients accounting for age, cardiovascular comorbidities, as well as vascular brain lesions and brain volume on neuroimaging.
This was a cross-sectional analysis using baseline data from the prospective observational Swiss-AF cohort study (NCT02105844), which was designed to investigate the relationship between AF, structural brain changes, and cognition. We selected the Swiss-AF cohort for this analysis due to the large sample size, the detailed clinical and neuroimaging characterization with a relatively high prevalence of cardiovascular comorbidities, and the availability of blood biomarker measurements. Swiss-AF enrolled 2,415 patients with AF between 2014 and 2017 across 14 centers in Switzerland. Included were patients aged 65 years or older, with an additional 15% of patients aged < 65 years. Patients with a recent ischemic stroke, transient ischemic attack (TIA) or other acute illness (< 4 weeks), and those unable to provide consent (e.g., patients with dementia) were excluded. The detailed methodology of Swiss-AF has been described previously (Conen et al., 2017, 2019; Polymeris et al., 2020). Baseline investigations included a standardized clinical assessment (sociodemographic parameters, comorbidities), weight and height measurements [from which BMI was calculated as (weight in kg)/(height in m)2], blood sampling, and brain MRI.
Baseline blood samples were collected following standard operating procedures. After centrifugation, serum samples were aliquoted into cryotubes and stored at -80°C in a centralized biobank. The concentration of sNfL was measured in duplicate using a previously described ultrasensitive single-molecule array assay (lower limit of quantification 1.0 pg/ml) (Disanto et al., 2017; Polymeris et al., 2020). Creatinine and cystatin C were measured using commercially available assays (cobas c 311 and Elecsys; Roche Diagnostics, Mannheim, Germany). In order to calculate eGFR as a measure of renal function, we used the Chronic Kidney Disease Epidemiology Collaboration (CKD-EPI) (i) creatinine equation (eGFRcrea) and (ii) the combined creatinine–cystatin C equation (eGFRcrea–cys) (Inker et al., 2012).
On baseline MRI, we assessed the presence and volume of small non-cortical infarcts (SNCIs), large non-cortical or cortical infarcts (LNCCIs), and white matter lesions (WMLs); the presence and count of microbleeds (MBs); and estimated the normalized brain volume (nBV) using SIENAX (Smith et al., 2002), as described previously in detail (Conen et al., 2019; Polymeris et al., 2020).
In this study, we included all Swiss-AF patients with quantifiable sNfL measurement and available data on clinical variables, creatinine and cystatin C (Supplementary Figure 1). The Ethics Committee of Northwest and Central Switzerland approved Swiss-AF, including this study (PB_2016-00793). Written informed consent was obtained from all study participants according to the Declaration of Helsinki. This study was conducted in accordance with the STROBE Statement for cross-sectional studies (von Elm et al., 2007).
As the first step to investigate the association of eGFR and BMI with sNfL, we fitted a multivariable linear regression model with log-transformed sNfL as the dependent variable and eGFR and BMI as independent variables. The model was adjusted for the following variables, known to be associated with sNfL from our previous work in this cohort (Polymeris et al., 2020): age, history of hypertension, diabetes mellitus, stroke or TIA, peripheral artery disease, heart failure, as well as mean arterial pressure [calculated as (1/3 × systolic blood pressure) + (2/3 × diastolic blood pressure)], smoking status (non, past, and current smoker), and alcohol consumption (in standard drinks per day). Continuous variables were centered on their mean (or, in case of skewed data, median) values, as appropriate. Visual inspection suggested curvilinear associations of age and eGFR with sNfL. We chose the best way to model these variables by fitting different univariable models (linear only, quadratic, cubic, cubic without quadratic term) and selecting the one with the best fit based on the Akaike’s information criterion (AIC). Considering the known strong association of age and diabetes with sNfL (Polymeris et al., 2020), we also included in the multivariable model the interactions GFR by age, BMI by age, and GFR by diabetes. We report the backtransformed model-based estimates, which represent multiplicative effects on the geometric mean of sNfL and are denoted by βmult (so that a one-unit increase in the independent variable is associated with an average βmult-fold change in sNfL), along with 95% confidence intervals (95% CI) and two-sided p-values.
In a second step, to investigate the relative contribution of eGFR, BMI, and age to the variance of sNfL concentrations, we fitted linear models with log-sNfL as the dependent variable and these factors as independent variables, alone and in combination with one another and with their interactions with age. We report the coefficient of determination (R2) and the adjusted R2 (R2adj; penalized for larger number of independent variables) as a measure of the proportion of the observed sNfL variance explained by each model.
Considering patients who also had baseline brain MRI available (Supplementary Figure 1), we further adjusted the multivariable linear model from the main analysis for the following imaging measures: log-volume of WMLs, presence and log-volume of LNCCIs, presence and log-volume of SNCIs, presence and count of MBs, and nBV, which were previously reported to be associated with sNfL concentrations (Polymeris et al., 2020). We reduced the model to a smaller set of variables via stepwise backward elimination based on AIC. As this is known to inflate the type I error, we refrained from providing p-values in this analysis and evaluated the explanatory importance of independent variables for sNfL concentrations based on whether they were selected or eliminated from the reduced model. Finally, we refitted the model without eGFR and report the R2 and R2adj for both models. We repeated all models using eGFRcrea–cys as a further sensitivity analysis.
All analyses were performed with R version 4.0.3 (2020-10-10).
A total of 2,277 Swiss-AF patients were available for the main analysis, after exclusion of 77 patients without sNfL measurement (no or insufficient blood sample), 16 with sNfL measurement below the limit of quantification, and 45 with other data missing (Supplementary Figure 1). The mean [standard deviation (SD)] age was 73.3 (8.5) years, mean (SD) eGFRcrea/eGFRcrea–cys was 59.1 (18.3)/58.6 (20.0) ml/min/1.73 m2, mean (SD) BMI was 27.6 (4.7) kg/m2, and the median (interquartile range) sNfL was 42.0 (29.0 – 65.1) pg/ml. All patient characteristics are provided in Table 1.
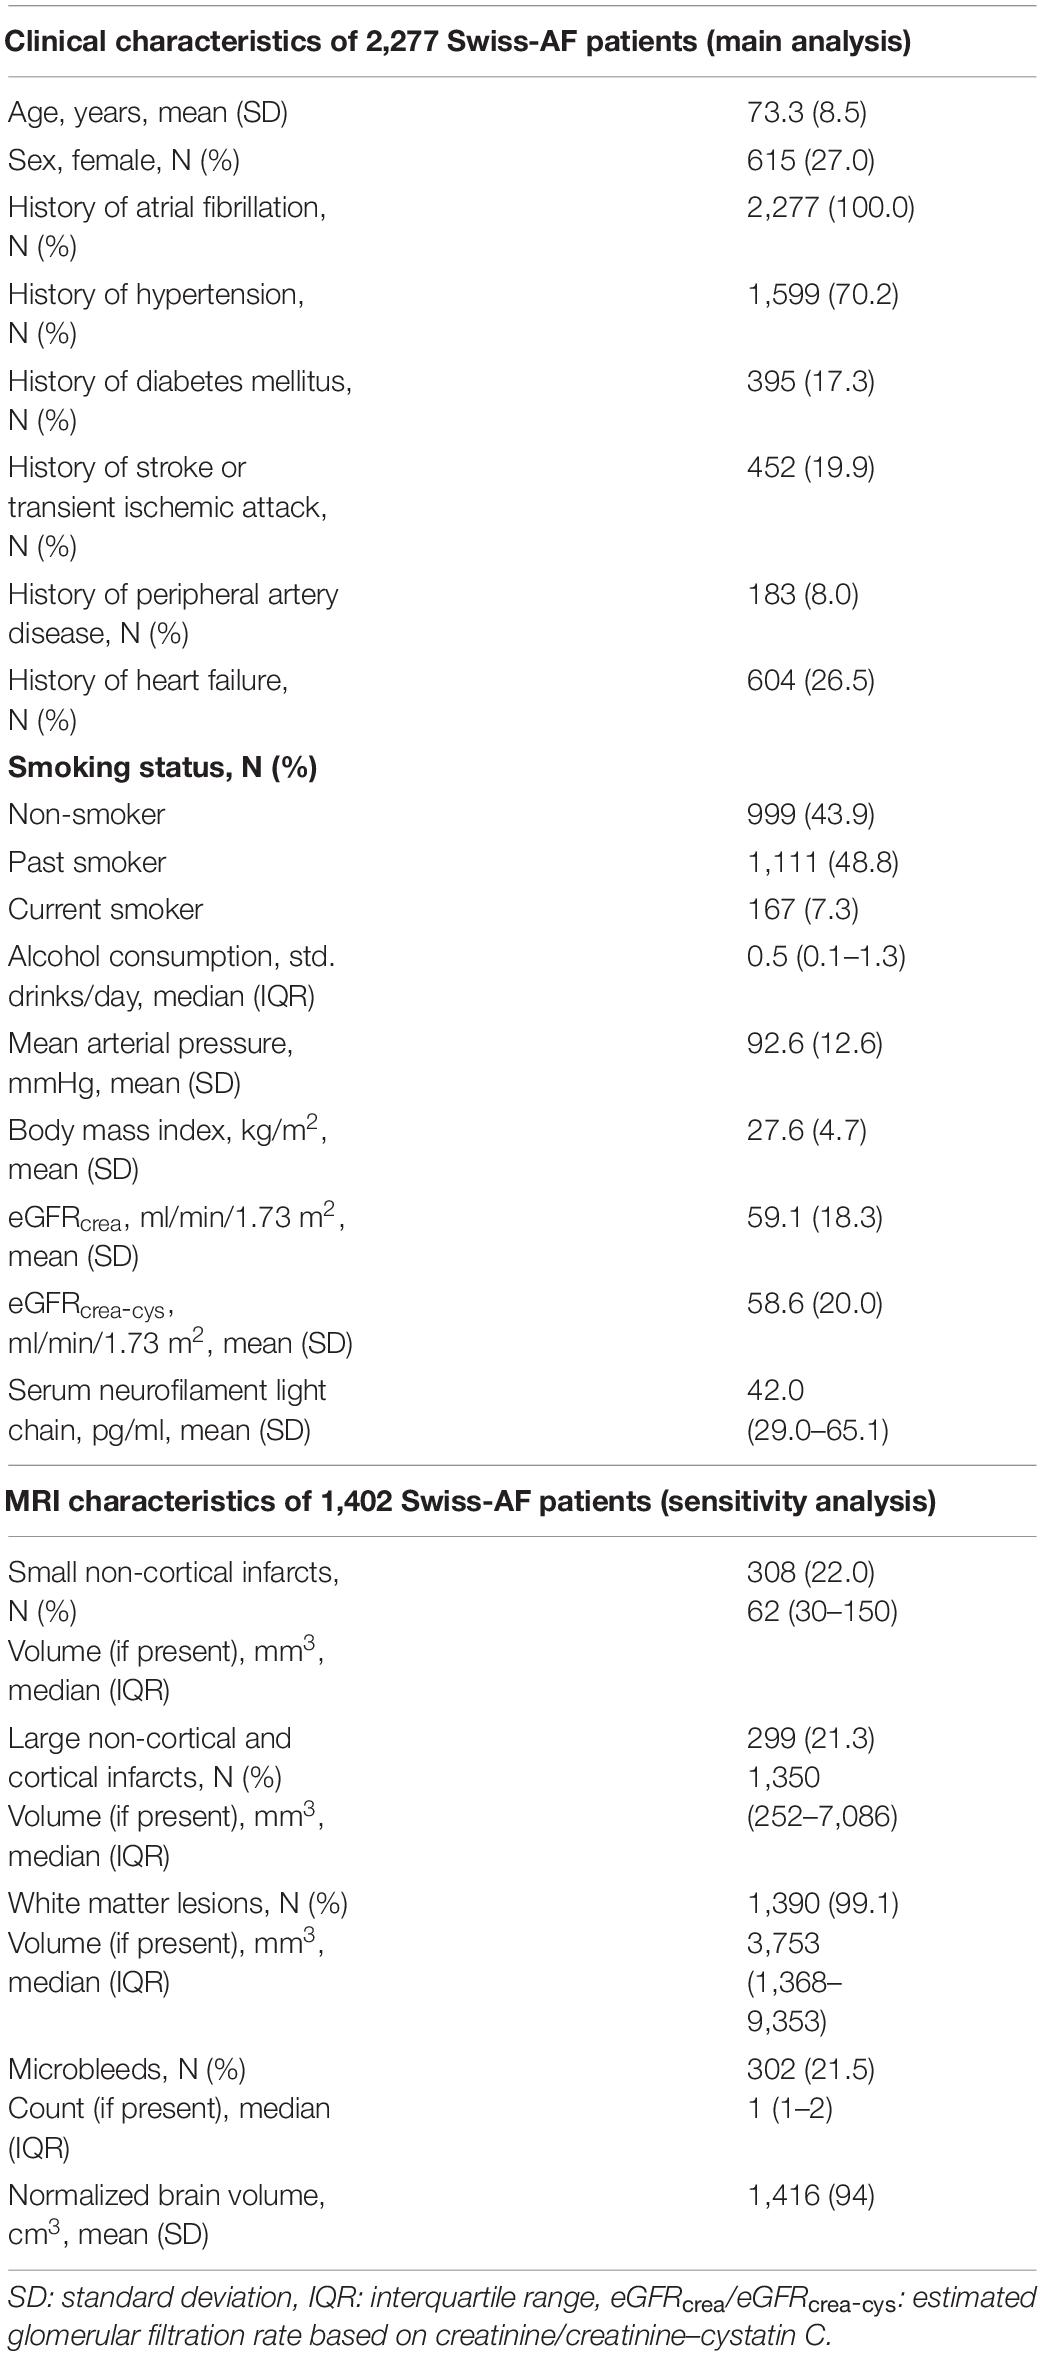
Table 1. Patient characteristics.
In the multivariable model adjusted for all clinical variables (Table 2), eGFRcrea showed a strong inverse curvilinear association with sNfL (Figure 1A). Modeling eGFRcrea with a linear, quadratic, and cubic component was chosen based on AIC (Supplementary Table 1). BMI also showed a strong, inverse linear association with sNfL in the multivariable model (Figure 2A).
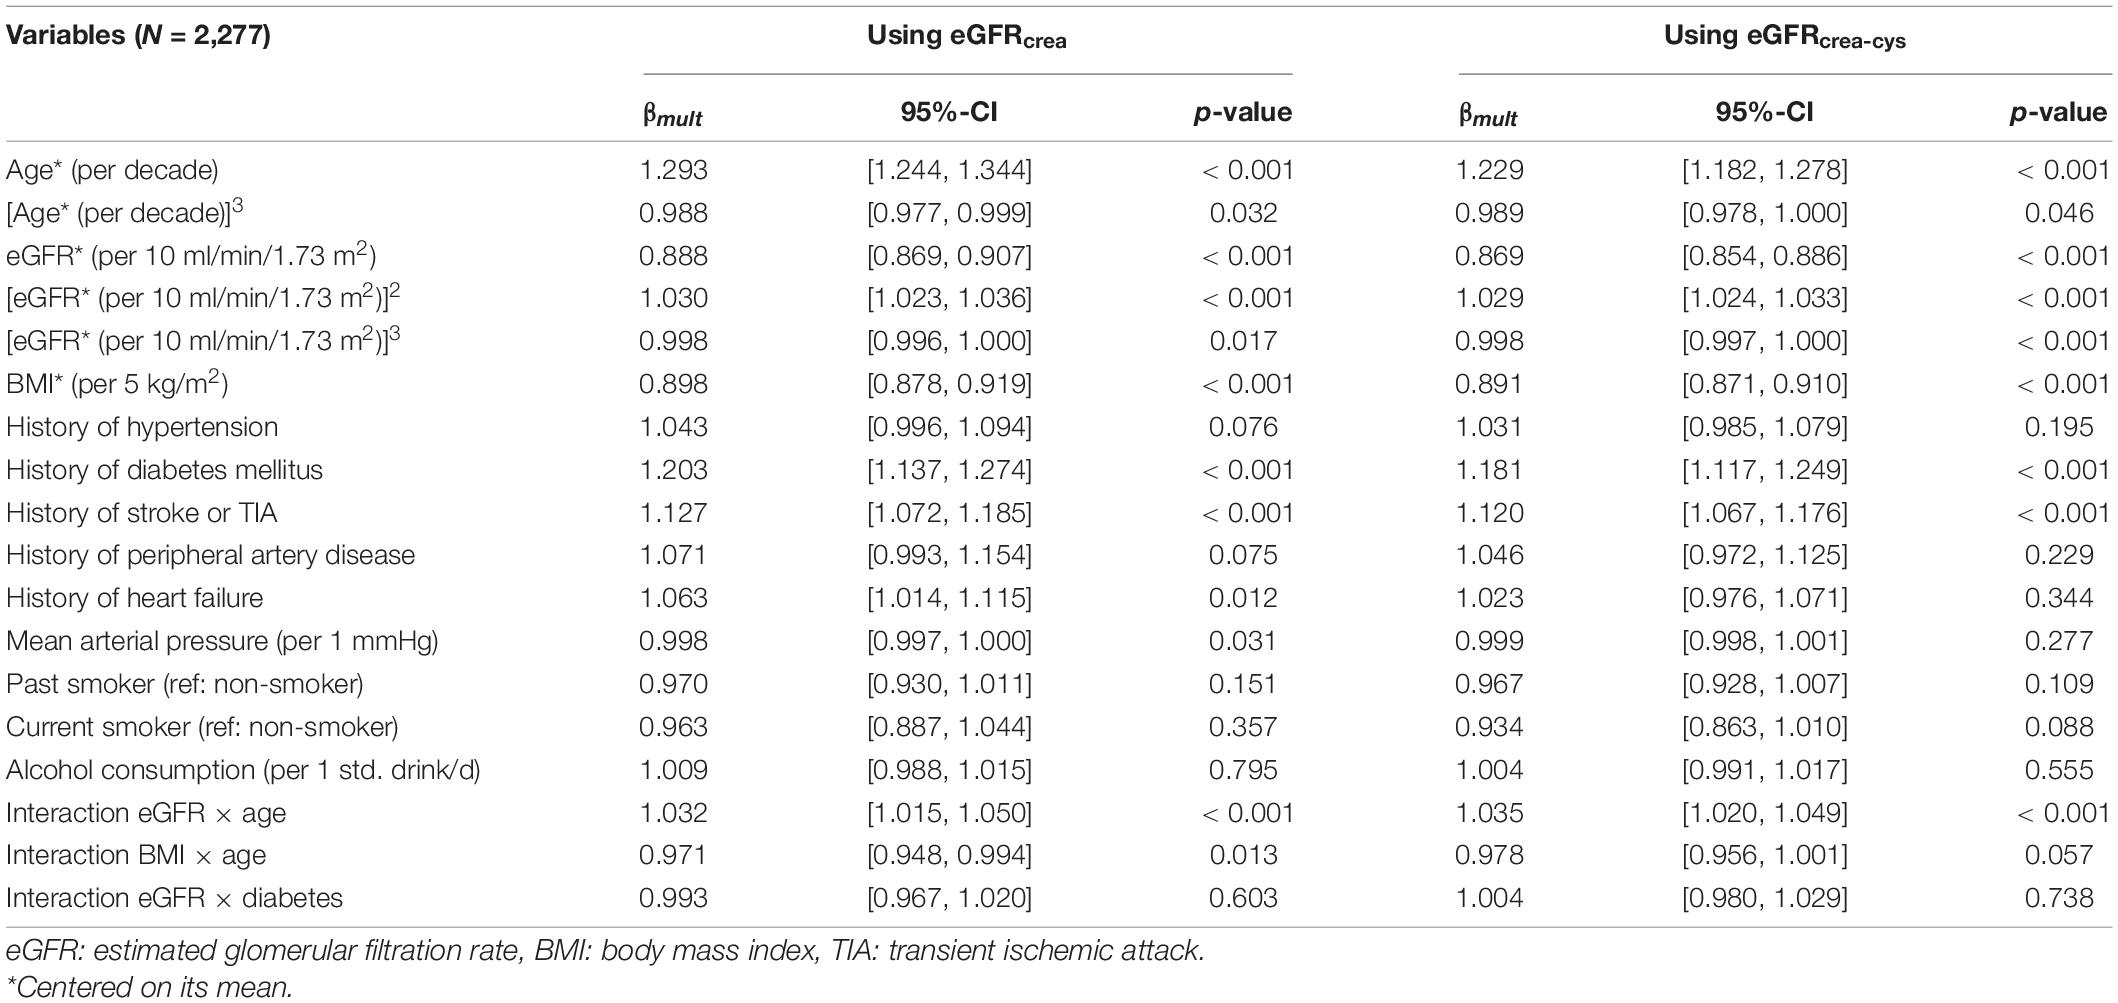
Table 2. Multivariable models for the association of eGFR and BMI with sNfL.
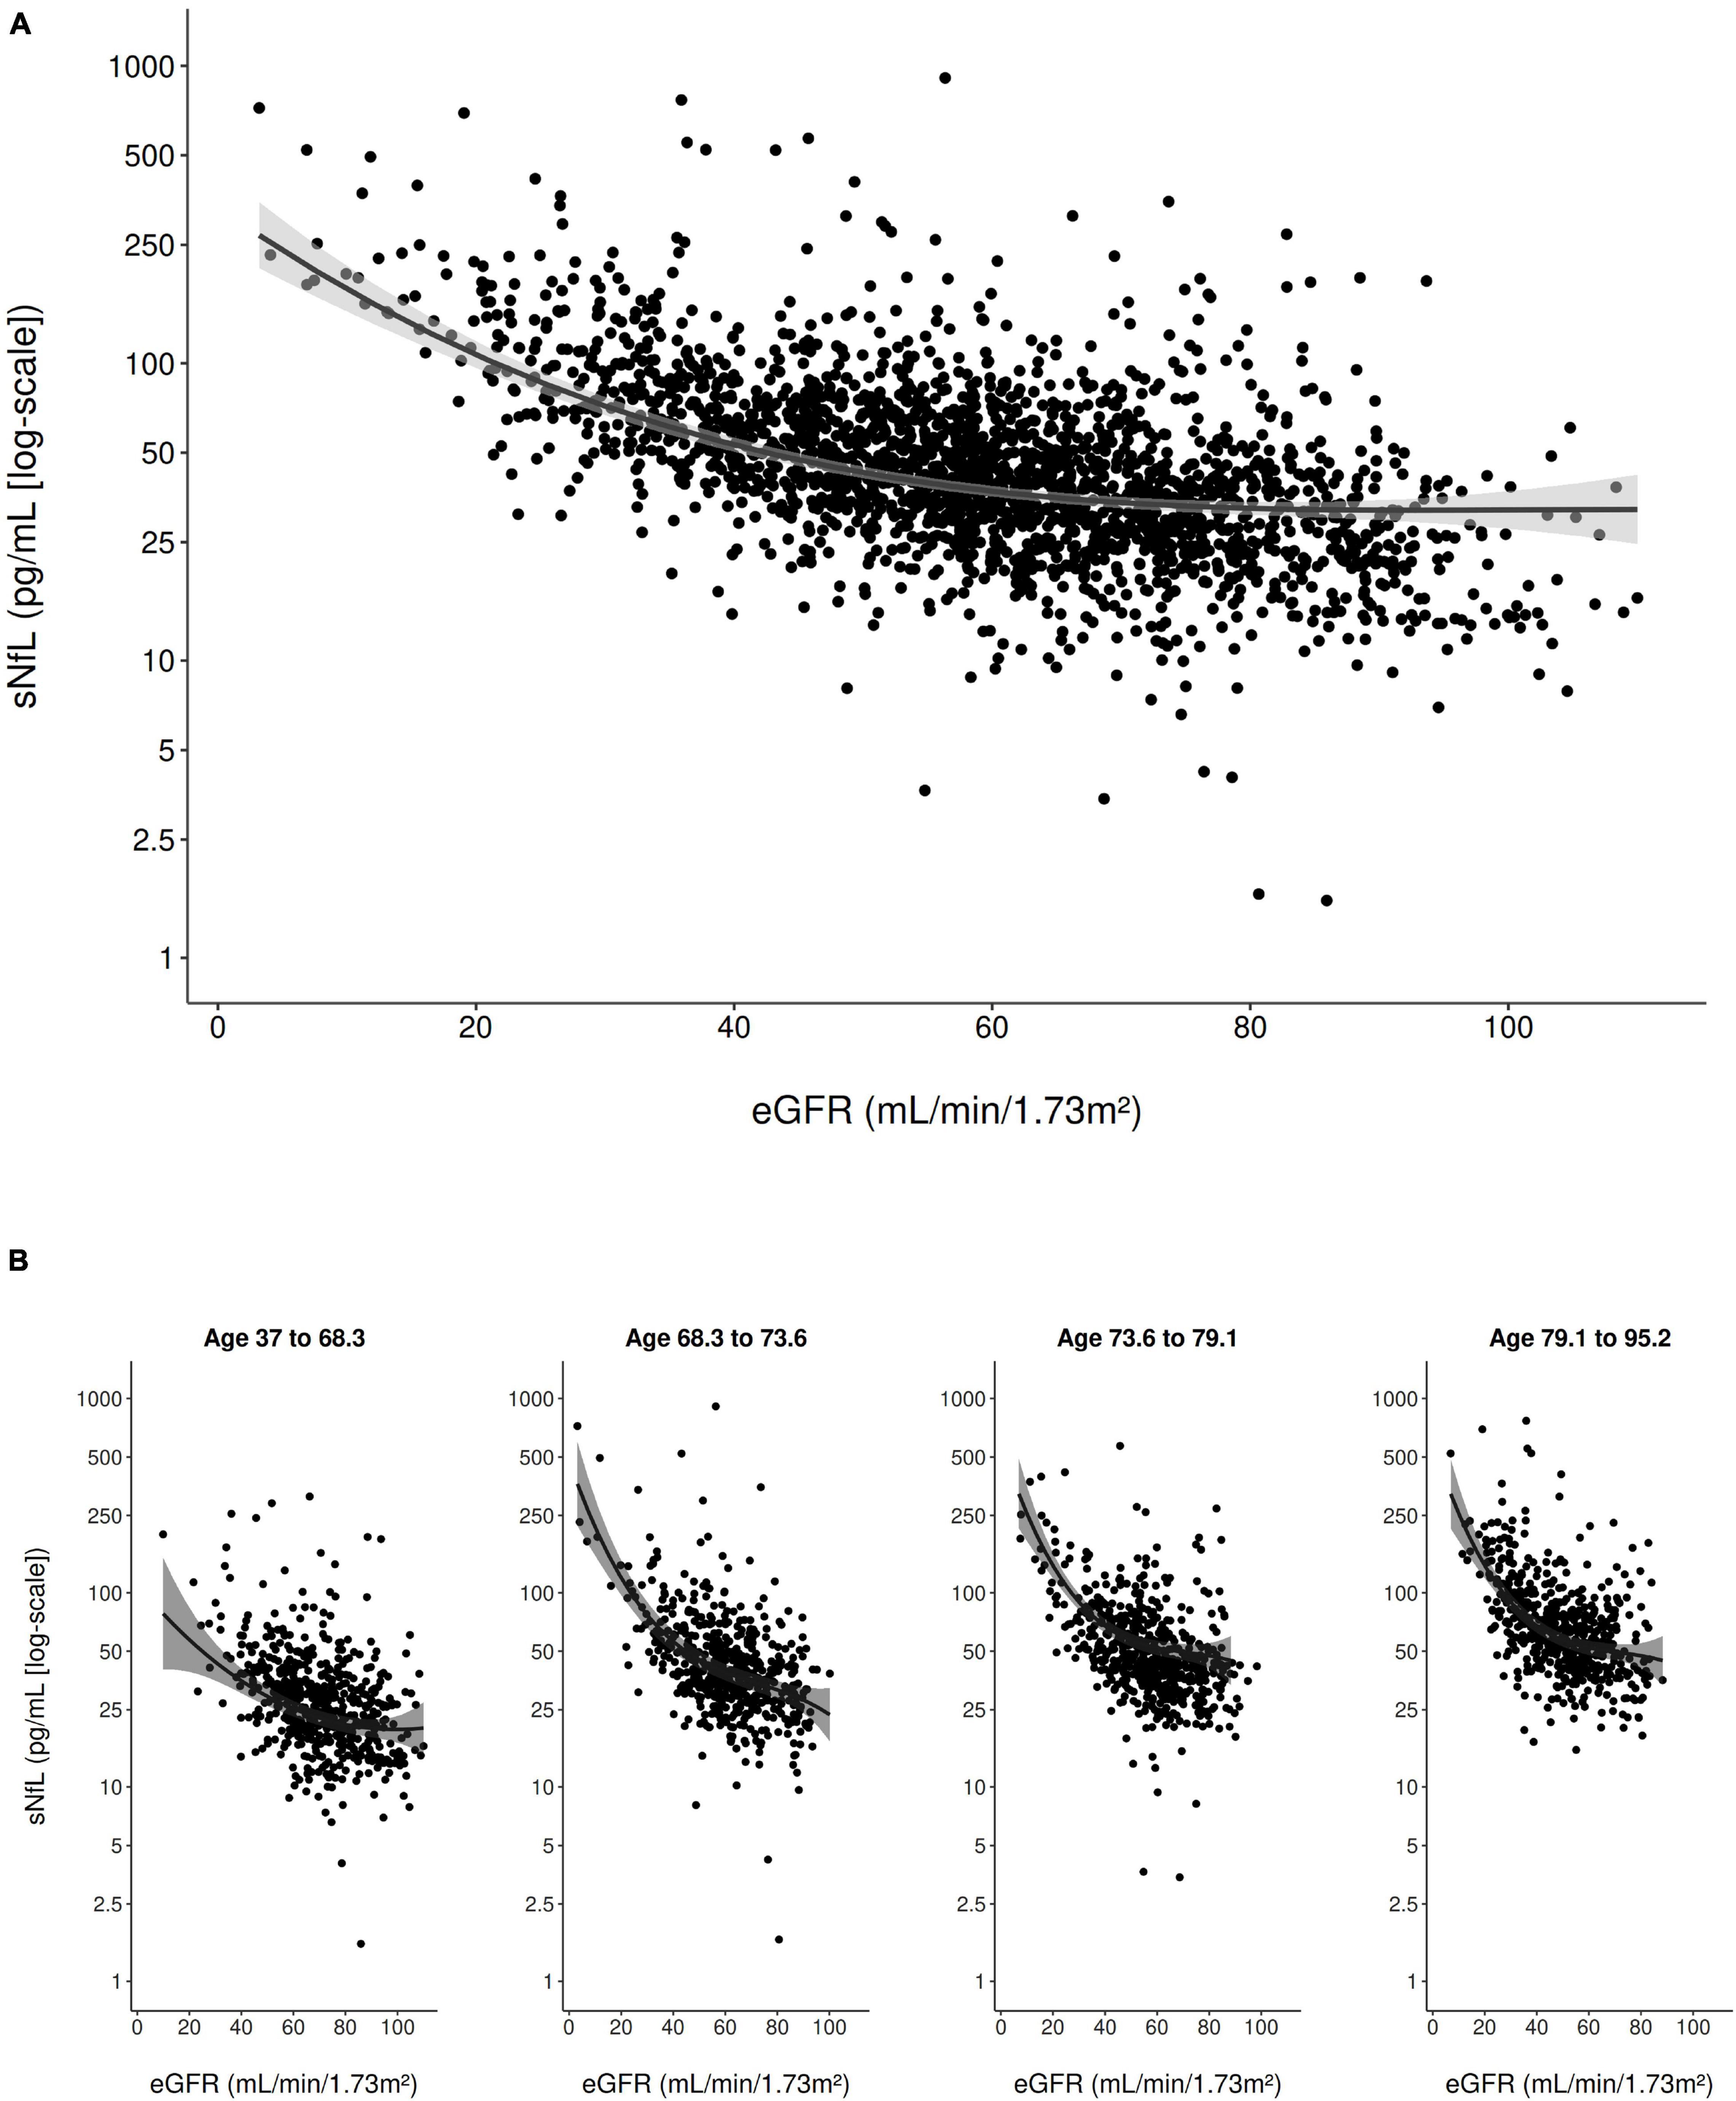
Figure 1. Scatter plot of the association of eGFRcrea with sNfL (using the log scale) in the entire study population (A) and stratified to age quartiles (B). The solid line represents the predicted values from the main multivariable model and the gray shading represents the 95% confidence interval.
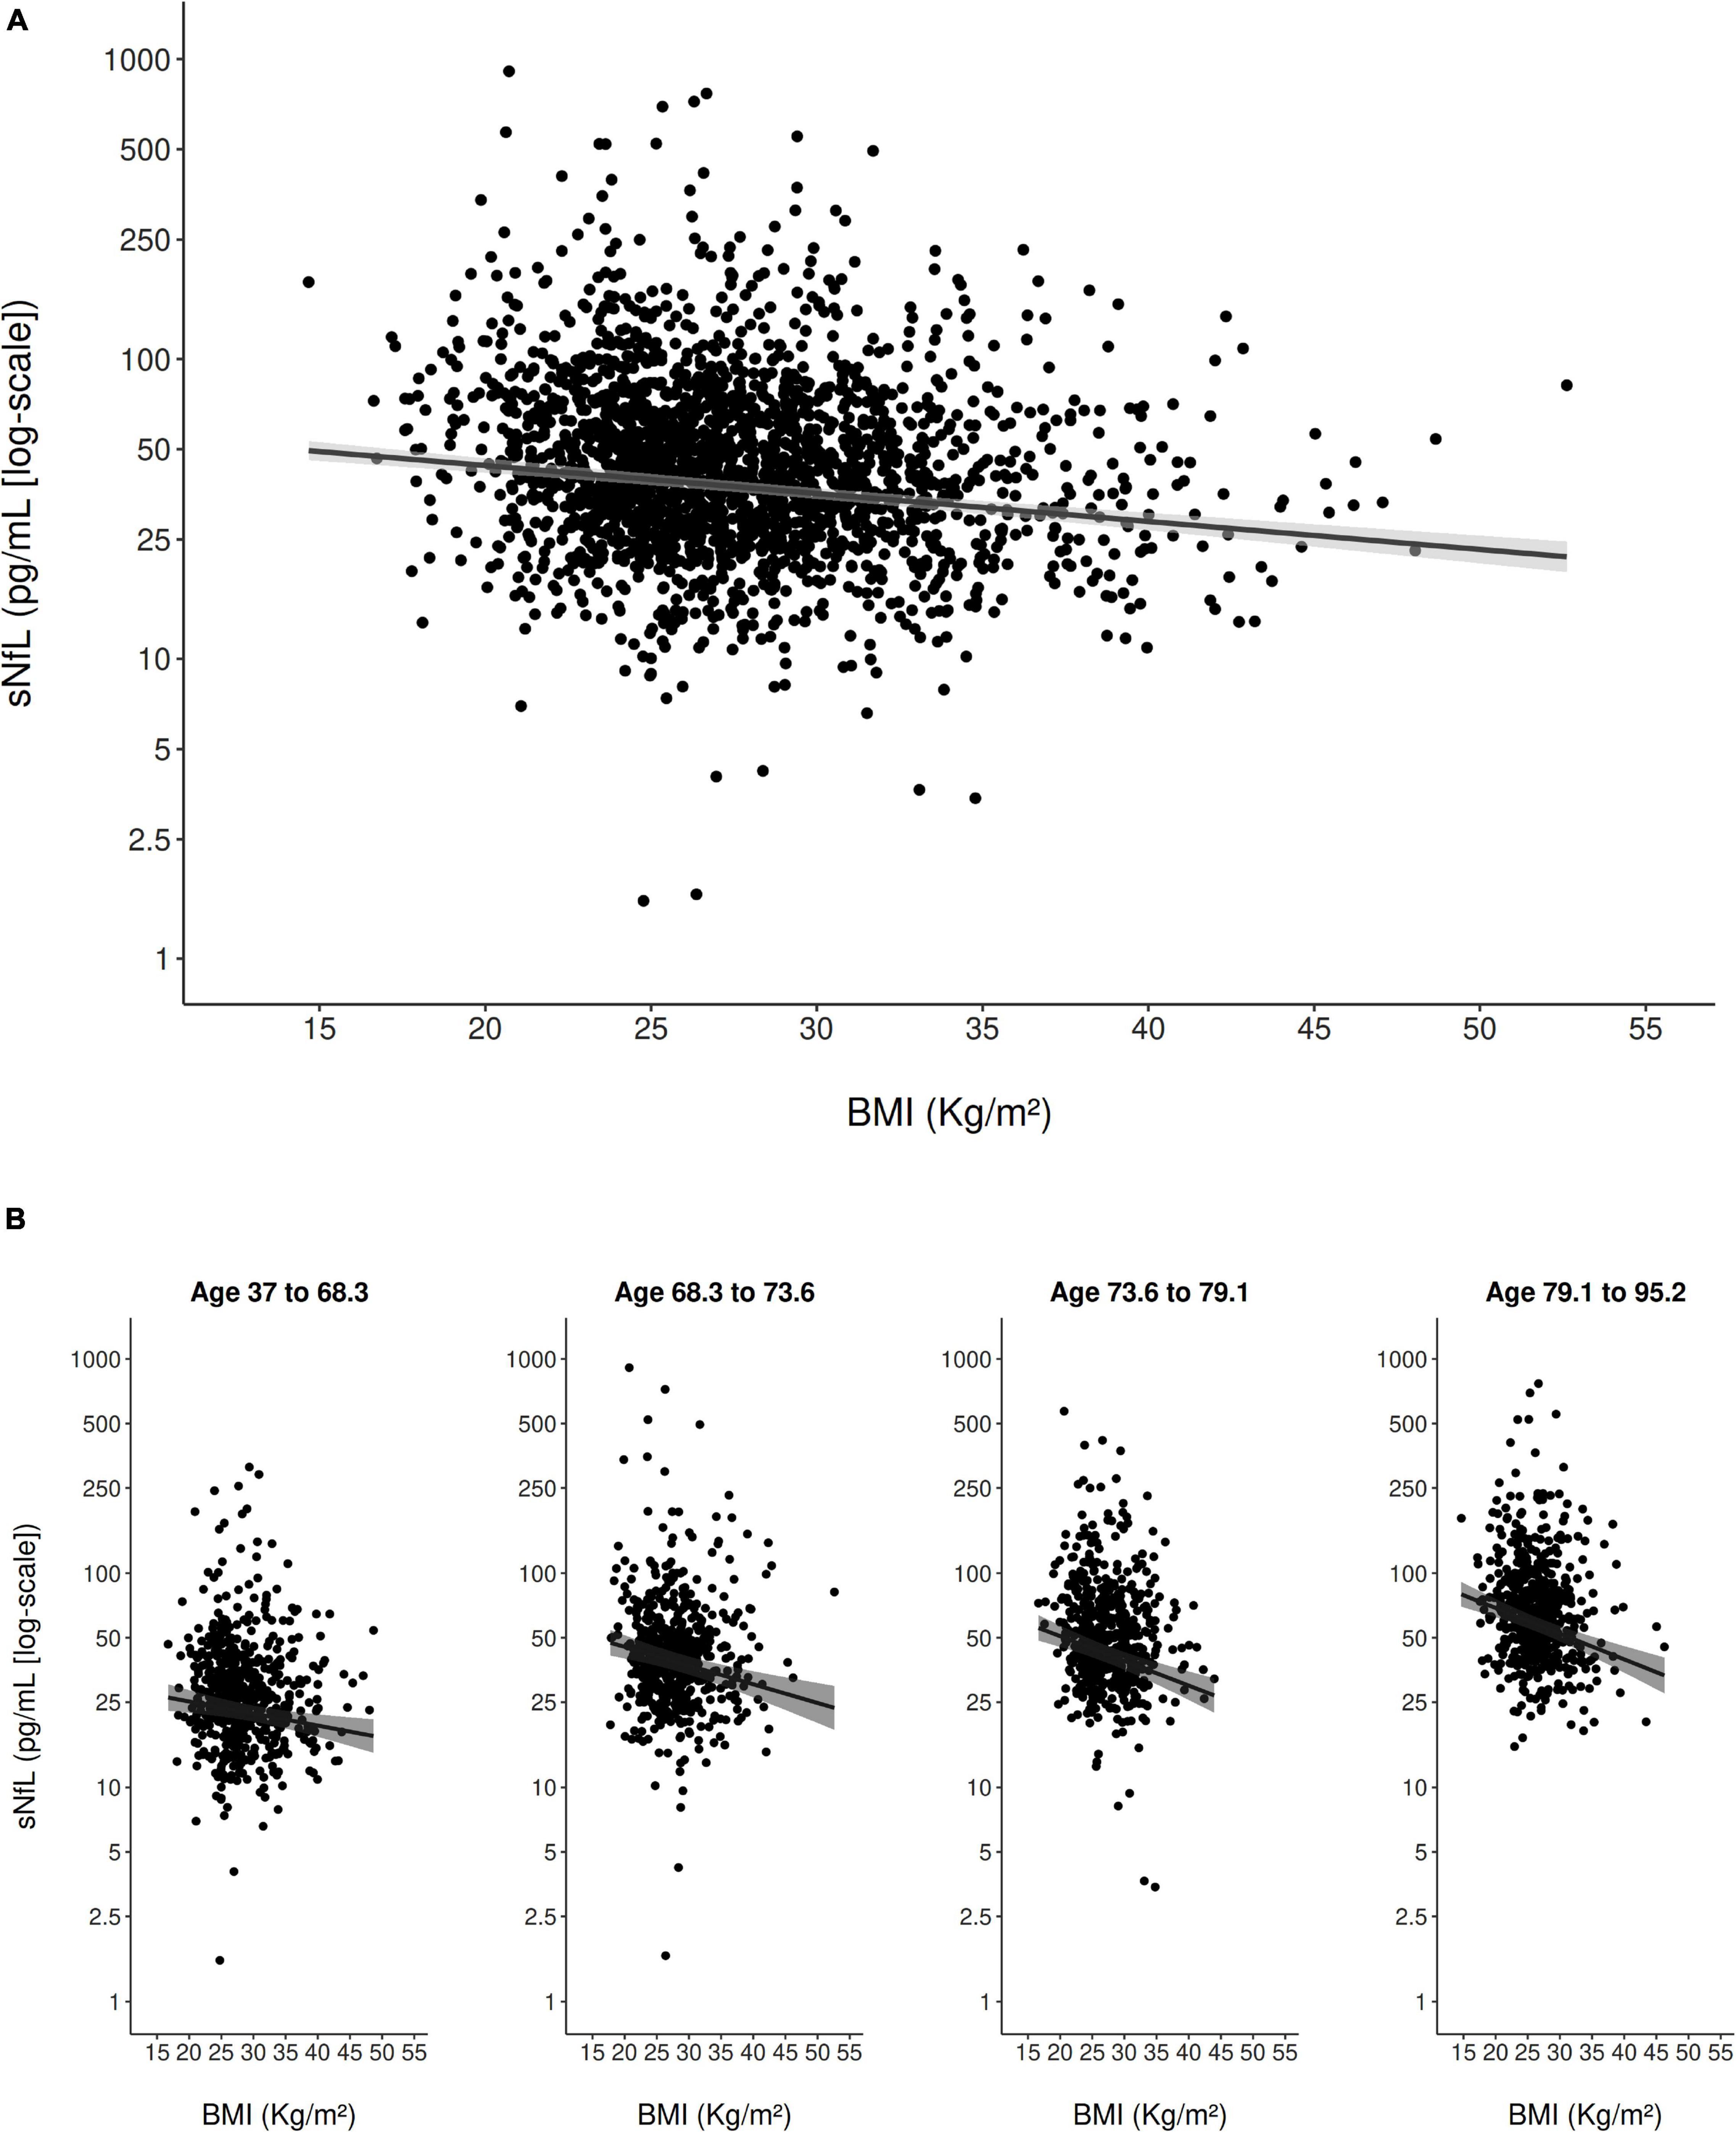
Figure 2. Scatter plot of the association of BMI with sNfL (using the log scale) in the entire study population (A) and stratified to age quartiles (B). The solid line represents the predicted values from the main multivariable model and the gray shading represents the 95% confidence interval.
Furthermore, age (modeled with a linear and cubic component based on AIC; Supplementary Table 1) was strongly, positively associated with sNfL in the multivariable model. There was evidence for an interaction between eGFRcrea and age on their association with sNfL (pinteraction < 0.001), indicating that, with older age, the negative association of eGFRcrea with sNfL was steeper for lower values of eGFRcrea (Figure 1B). There was also evidence for a weaker interaction between BMI and age on their association with sNfL (pinteraction = 0.013), indicating a slightly stronger negative association of BMI with sNfL with increasing age (Figure 2B). Supplementary Table 2 presents the model-based estimates for the association of eGFRcrea and BMI with sNfL in four age-quartile subgroups.
Further variables with a strong association with sNfL in the multivariable model were diabetes mellitus and history of stroke or TIA. There was no evidence for an interaction between eGFRcrea and diabetes mellitus on their association with sNfL.
Upon examination of the R2adj of different models fitted with sNfL as the dependent variable, models containing age, eGFRcrea, and BMI alone explained 26%, 35%, and 2% of the variance in sNfL concentrations, respectively. Adding eGFRcrea to the age model conferred a substantial increase in the sNfL variance explained by the model (R2adj 0.45 vs. 0.26), while adding BMI to age increased the model’s explanatory power only marginally (R2adj 0.27 vs. 0.26). The combined age, eGFRcrea, and BMI model explained 46% of the total sNfL variance. Adding the interaction terms eGFRcrea and BMI by age to the models conferred no substantial increase in R2adj (Table 3).
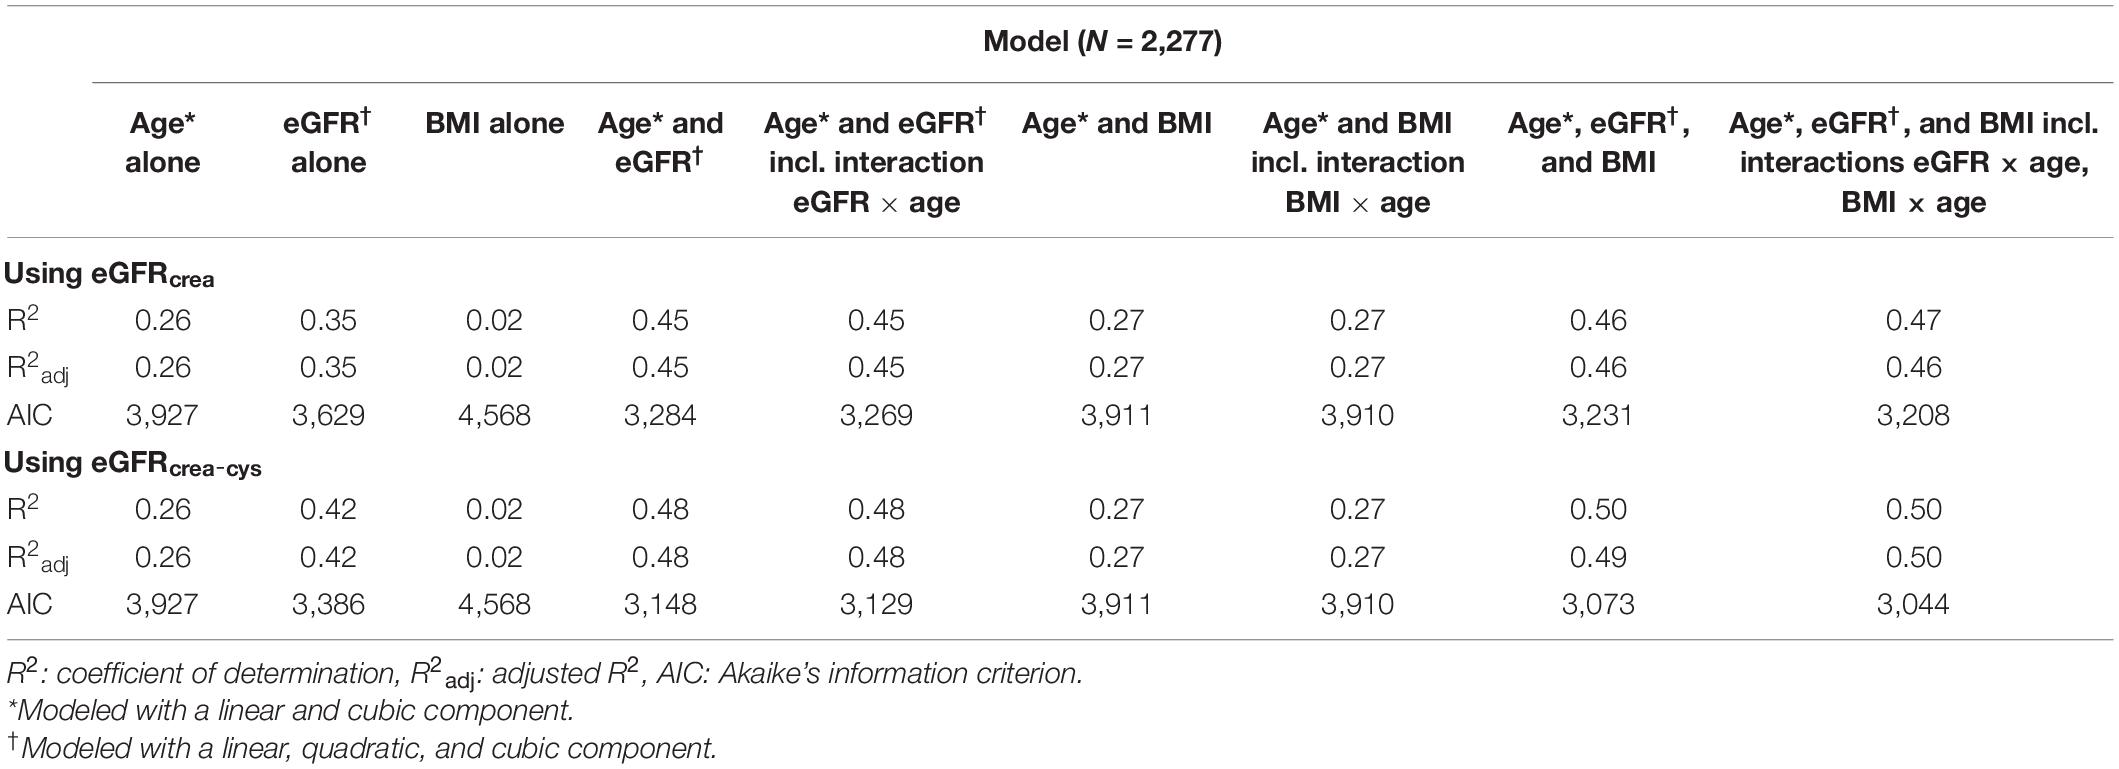
Table 3. Performance of different models including age, eGFR, and BMI to predict serum neurofilament light concentrations.
A total of 1,402 Swiss-AF patients were available for the MRI sensitivity analysis (Supplementary Figure 1). In the multivariable model including all variables from the main analysis, vascular brain lesions and nBV, both eGFRcrea and BMI remained in the model after stepwise backward elimination, as did age, its interaction with eGFRcrea, diabetes mellitus, and history of stroke or TIA (Supplementary Table 3). The R2adj of this model was 52%, and dropped to 36% after excluding eGFRcrea.
As for the main analysis using eGFRcrea, a total of 2,277 Swiss-AF participants were available for sensitivity analysis using eGFRcrea–cys. Consistent with the main analysis, in a multivariable model adjusting for all clinical variables (Table 2), eGFRcrea–cys was strongly associated with sNfL, with a curvilinear relationship including a linear, quadratic, and cubic component (modeled as such based on AIC, Supplementary Table 1). BMI was also strongly associated with sNfL, as was age, diabetes mellitus, and history of stroke or TIA. For all associations, the coefficients were of similar magnitude as in the main analysis. Consistent with the main analysis, there was evidence for an interaction between eGFRcrea–cys and age (pinteraction < 0.001). The interaction between BMI and age was even weaker than in the main analysis (pinteraction = 0.057). Examination of the R2adj of different models containing age, eGFRcrea–cys, and BMI either alone or in combination with one another revealed similar results with the main analysis, with eGFRcrea–cys explaining a substantial proportion of the sNfL variance beyond that explained by age (Table 3).
A total of 1,402 Swiss-AF patients were available for the sensitivity analysis including MRI data and using eGFRcrea–cys. As in the main analysis, in the multivariable model including all clinical variables, vascular brain lesions, and nBV, both eGFRcrea–cys and BMI remained in the model after backward variable elimination, as did age, its interaction with eGFRcrea–cys, diabetes mellitus, and history of stroke or TIA (Supplementary Table 3). The R2adj of this model was 52% with eGFRcrea–cys, dropping to 36% after excluding eGFRcrea–cys.
This cross-sectional study on the association of eGFR and BMI with sNfL concentrations in a large elderly cohort of AF patients showed that both eGFR (estimated using either creatinine or creatinine and cystatin C) and BMI were strongly associated with sNfL concentrations. This was true even after adjustment for other parameters known to contribute to sNfL concentrations, including age, clinical comorbidities, and MRI characteristics. Furthermore, eGFR, but not BMI, conferred a substantial increase in the explanatory power of models predicting sNfL concentrations, which was additional and independent to the contribution of age.
Our finding of a strong negative association of eGFR with sNfL concentrations confirms and refines previous observations (Korley et al., 2019; Akamine et al., 2020). An inverse association between eGFR and blood NfL concentrations was recently shown in smaller samples of elderly patients with diabetes and healthy controls, and the renal clearance of blood NfL was proposed as one potential explanation (Korley et al., 2019; Akamine et al., 2020). Here, we show that this association is independent of age, BMI, and pre-existing disease (diabetes, stroke history, and other cardiovascular comorbidities). The association between eGFR and sNfL was maintained independent of the method used for calculating eGFR, that is, based on creatinine alone or combined creatinine–cystatin C. Importantly, the association persisted even after adjustment for brain volume, as well as for the presence and burden of ischemic infarcts and small vessel disease markers on neuroimaging, which are known to be associated with sNfL concentrations (Gattringer et al., 2017; Duering et al., 2018; Tiedt et al., 2018; Polymeris et al., 2020), indicating that it is not mediated through structural brain pathology. These findings further support that, apart from NfL release from damaged neurons, renal clearance seems to be a predominant factor determining NfL levels. Combined investigations of NfL in cerebrospinal fluid (CSF), blood, and urine to confirm this are now under way in our laboratory. Additionally, we show here that the association of eGFR with sNfL is non-linear, with a steeper slope in lower eGFR values. Taken together with our finding that the association between sNfL and eGFR depends on age (which indicates that the impact of renal impairment on sNfL levels is even more pronounced in older than in younger patients), these data stress the importance of accounting for renal function when evaluating blood NfL concentrations in elderly populations, in whom chronic kidney disease is highly prevalent (Coresh et al., 2003).
We also found a strong inverse association between BMI and sNfL. This is in line with previous observations from large cohorts of young patients with multiple sclerosis and healthy controls, where a larger distribution volume and specifically a larger total blood volume was postulated to be a modifier of blood NfL levels (Manouchehrinia et al., 2020). Here, we expand on these findings by demonstrating that the association holds true also among elderly individuals, and is independent of age, eGFR, cardiovascular comorbidities, and the presence and burden of vascular brain lesions on neuroimaging. Furthermore, we confirmed the linearity of the association and found only a weak interaction with age. These findings strengthen the evidence for the validity of this relationship and for dilution as the underlying mechanism (Barro et al., 2020; Manouchehrinia et al., 2020). It seems therefore appropriate to account for BMI when examining blood NfL concentrations across the entire age spectrum.
Our study provides a comprehensive assessment of the relative contribution of eGFR and BMI in determining NfL serum levels as physiological factors important in its homeostasis in the elderly. After adjustment for age and comorbidities, and regardless of the GFR estimation formula, both eGFR and BMI showed an independent, strong inverse association with sNfL levels, with effect sizes in a similar order of magnitude as age. However, only age and eGFR explained relevant proportions of the sNfL variance. Age alone explained about one-fourth, GFR alone explained approximately one-third, and their combination almost half of the variance of sNfL concentrations in this elderly cardiovascular cohort. Adding BMI did not substantially increase the explanatory power of the model. Taken together, these findings suggest that diagnostic and prognostic applications of sNfL in elderly populations should account not only for age, but also for renal function to increase their clinical meaningfulness, while the contribution of BMI seems to be less important.
Consistent with our findings, two very recent studies also demonstrated the importance of renal function as a contributor to sNfL levels (Koini et al., 2021; Ladang et al., 2022). While these studies featured smaller samples from normal aging cohorts, they further support the key conclusions of our study which examined a significantly larger sample of elderly patients with cardiovascular disease. Consequently, a large reference database for sNfL levels developed recently from data of younger individuals to optimize the use of sNfL for individual application in patients with multiple sclerosis excluded control persons with eGFR < 60 ml/min/1.73 m2 (Benkert et al., 2022).
The strengths of this study include: (i) the large sample size of elderly patients with a detailed and standardized clinical and neuroimaging characterization, allowing for the exhaustive adjustment for multiple factors that are known to contribute to sNfL concentrations, indicating that the observed associations are not spurious but reflect true relationships; (ii) the estimation of GFR using two different approaches [the CKD-EPI formula using creatinine alone and the more accurate combined creatinine–cystatin C formula (Inker et al., 2012)] that yielded highly consistent results; and (iii) comprehensive statistical modeling investigating not only the association of eGFR and BMI with sNfL concentrations, but also their relative contribution to the variance of sNfL concentrations.
We acknowledge the following limitations: (i) The study’s cross-sectional design, which allows only for the assessment of association but not causality thereof. (ii) Although our results persisted after adjustment for brain MRI characteristics, we were not able to adjust our analyses for diseases of the peripheral nervous system, which were not systematically collected in Swiss-AF but might contribute to sNfL concentrations (Khalil et al., 2018). (iii) As Swiss-AF included exclusively AF patients, we did not have a comparison group of elderly individuals without this arrhythmia. However, in light of recent studies showing consistent results in other patient populations, this limitation is unlikely to have influenced our key findings. (iv) As the Swiss-AF biosampling protocol did not include the acquisition of CSF or urine, this study was not able to examine whether the observed associations are exclusive to blood concentrations of NfL, and we may only speculate on their underlying mechanisms.
In conclusion, this study represents a comprehensive appraisal of how physiological factors including renal function and BMI are associated with and contribute to blood NfL concentrations in the elderly, thereby providing important insights into the homeostasis of this increasingly used biomarker. The role of renal function and BMI in the prediction of neurological outcomes with sNfL needs to be evaluated in prospective studies.
The Swiss-AF consent forms, as approved by the ethics committee, do not allow for the data to be made publicly available. Researchers may contact the authors for the potential submission of research proposals for future analyses or independent verification of our results.
Swiss-AF including this study was approved by Ethics Committee of Northwest and Central Switzerland (PB_2016-00793). The patients provided their written informed consent to participate in this study.
AP, LB, and JK conceived the study and drafted the manuscript, with additional support from FH, PB, and MC. FH performed the statistical analyses. All authors contributed to study design, data acquisition and analysis, and critically revised the manuscript.
The Swiss-AF study was supported by the Swiss National Science Foundation (SNSF; Grant numbers 33CS30_148474, 33CS30_177520, and 32473B_176178), the Swiss Heart Foundation, the Foundation for Cardiovascular Research Basel and the University of Basel. The present study was supported by SNSF (Grant number 320030_189140/1).
GM: consultant fees from Astra Zeneca, Bayer, Boehringer-Ingelheim, Novartis, outside of the submitted work. GMDM: Support from SNSF, “Spezialprogramm Nachwuchsförderung Klinische Forschung,” University of Basel, Science Funds (Wissenschaftspool) University Hospital Basel, Swiss Heart Foundation, Bangerter-Rhyner-Stiftung, Swisslife Jubiläumsstiftung for Medical Research, Swiss Neurological Society, Fondazione Dr. Ettore Balli, De Quervain research grant, Thermo Fisher GmbH; Travel honoraria Bayer, BMS/Pfizer; Speaker honoraria Bayer, Medtronic; Steering committee PACIFIC Stroke, Industry payments to the research fund of the University Hospital Basel. SE: Travel or speaker honoraria from Bayer, Boehringer-Ingelheim, Daiichi-Sankyo; Scientific advisory boards Bayer, Boehringer-Ingelheim, BMS/Pfizer, MindMaze; Editorial board of Stroke; Research funding to his institutions from Pfizer, Stago, Daiichi-Sankyo, Science Funds [Wissenschaftsfonds] University Hospital Basel, University Basel, “Wissenschaftsfonds Rehabilitation” University Hospital for Geriatric Medicine Felix Platter, “Freiwillige Akademische Gesellschaft Basel,” Swiss Heart Foundation, SNSF. DC: consulting fees from Roche Diagnostics, outside of the current work. MK: fees from Bayer, Boehringer-Ingelheim, BMS/Pfizer, Daiichi-Sankyo, Medtronic, Biotronik, Boston Scientific, Johnson&Johnson, Roche; grants from Bayer, Pfizer, Boston Scientific, BMS, Biotronik, Daiichi-Sankyo. LB: fees and non-financial support from Amgen, Bayer; fees from BMS, Claret Medical and InnovHeart; grants from AstraZeneca, SNSF, University of Basel, Swiss Heart Foundation, outside the submitted work. JK: speaker fees, research support, travel support, and/or advisory boards Swiss Multiple Sclerosis Society, SNSF, University of Basel, Progressive Multiple Sclerosis Alliance, Bayer, Biogen, Celgene, Merck, Novartis, Octave Bioscience, Roche, Sanofi.
The remaining authors declare that the research was conducted in the absence of any commercial or financial relationships that could be construed as a potential conflict of interest.
All claims expressed in this article are solely those of the authors and do not necessarily represent those of their affiliated organizations, or those of the publisher, the editors and the reviewers. Any product that may be evaluated in this article, or claim that may be made by its manufacturer, is not guaranteed or endorsed by the publisher.
We would like to thank all Swiss-AF investigators for their contributions in data collection.
The Supplementary Material for this article can be found online at: https://www.frontiersin.org/articles/10.3389/fnins.2022.819010/full#supplementary-material
Akamine, S., Marutani, N., Kanayama, D., Gotoh, S., Maruyama, R., Yanagida, K., et al. (2020). Renal function is associated with blood neurofilament light chain level in older adults. Sci. Rep. 10:20350. doi: 10.1038/s41598-020-76990-7
Barro, C., Chitnis, T., and Weiner, H. L. (2020). Blood neurofilament light: a critical review of its application to neurologic disease. Ann. Clin. Transl. Neurol. 7, 2508–2523. doi: 10.1002/acn3.51234
Benkert, P., Meier, S., Schaedelin, S., Manouchehrinia, A., Yaldizli, Ö, Maceski, A., et al. (2022). Serum neurofilament light chain for individual prognostication of disease activity in people with multiple sclerosis: a retrospective modelling and validation study. Lancet Neurol. 21, 246–257. doi: 10.1016/S1474-4422(22)00009-6
Conen, D., Rodondi, N., Mueller, A., Beer, J., Auricchio, A., Ammann, P., et al. (2017). Design of the swiss atrial fibrillation cohort study (Swiss-AF): structural brain damage and cognitive decline among patients with atrial fibrillation. Swiss Med. Wkly. 147:w14467. doi: 10.4414/smw.2017.14467
Conen, D., Rodondi, N., Muller, A., Beer, J. H., Ammann, P., Moschovitis, G., et al. (2019). Relationships of overt and silent brain lesions with cognitive function in patients with atrial fibrillation. J. Am. Coll. Cardiol. 73, 989–999. doi: 10.1016/j.jacc.2018.12.039
Coresh, J., Astor, B. C., Greene, T., Eknoyan, G., and Levey, A. S. (2003). Prevalence of chronic kidney disease and decreased kidney function in the adult US population: third national health and nutrition examination survey. Am. J. Kidney Dis. 41, 1–12. doi: 10.1053/ajkd.2003.50007
Disanto, G., Barro, C., Benkert, P., Naegelin, Y., Schadelin, S., Giardiello, A., et al. (2017). Serum neurofilament light: a biomarker of neuronal damage in multiple sclerosis. Ann. Neurol. 81, 857–870. doi: 10.1002/ana.24954
Duering, M., Konieczny, M. J., Tiedt, S., Baykara, E., Tuladhar, A. M., Leijsen, E. V., et al. (2018). Serum neurofilament light chain levels are related to small vessel disease burden. J. Stroke 20, 228–238. doi: 10.5853/jos.2017.02565
Gafson, A. R., Barthelemy, N. R., Bomont, P., Carare, R. O., Durham, H. D., Julien, J. P., et al. (2020). Neurofilaments: neurobiological foundations for biomarker applications. Brain 143, 1975–1998. doi: 10.1093/brain/awaa098
Gattringer, T., Pinter, D., Enzinger, C., Seifert-Held, T., Kneihsl, M., Fandler, S., et al. (2017). Serum neurofilament light is sensitive to active cerebral small vessel disease. Neurology 89, 2108–2114. doi: 10.1212/wnl.0000000000004645
Inker, L. A., Schmid, C. H., Tighiouart, H., Eckfeldt, J. H., Feldman, H. I., Greene, T., et al. (2012). Estimating glomerular filtration rate from serum creatinine and cystatin C. N. Engl. J. Med. 367, 20–29.
Khalil, M., Pirpamer, L., Hofer, E., Voortman, M. M., Barro, C., Leppert, D., et al. (2020). Serum neurofilament light levels in normal aging and their association with morphologic brain changes. Nat. Commun. 11:812. doi: 10.1038/s41467-020-14612-6
Khalil, M., Teunissen, C. E., Otto, M., Piehl, F., Sormani, M. P., Gattringer, T., et al. (2018). Neurofilaments as biomarkers in neurological disorders. Nat. Rev. Neurol. 14, 577–589. doi: 10.1038/s41582-018-0058-z
Koini, M., Pirpamer, L., Hofer, E., Buchmann, A., Pinter, D., Ropele, S., et al. (2021). Factors influencing serum neurofilament light chain levels in normal aging. Aging (Albany NY) 13, 25729–25738. doi: 10.18632/aging.203790
Korley, F. K., Goldstick, J., Mastali, M., Van Eyk, J. E., Barsan, W., Meurer, W. J., et al. (2019). Serum NfL (neurofilament light chain) levels and incident stroke in adults with diabetes mellitus. Stroke 50, 1669–1675. doi: 10.1161/STROKEAHA.119.024941
Ladang, A., Kovacs, S., Lengelé, L., Locquet, M., Reginster, J. Y., Bruyère, O., et al. (2022). Neurofilament light chain concentration in an aging population. Aging Clin. Exp. Res. 34, 331–339. doi: 10.1007/s40520-021-02054-z
Manouchehrinia, A., Piehl, F., Hillert, J., Kuhle, J., Alfredsson, L., Olsson, T., et al. (2020). Confounding effect of blood volume and body mass index on blood neurofilament light chain levels. Ann. Clin. Transl. Neurol. 7, 139–143. doi: 10.1002/acn3.50972
Peters, N., Van Leijsen, E., Tuladhar, A. M., Barro, C., Konieczny, M. J., Ewers, M., et al. (2020). Serum neurofilament light chain is associated with incident lacunes in progressive cerebral small vessel disease. J. Stroke 22, 369–376. doi: 10.5853/jos.2019.02845
Polymeris, A. A., Coslovksy, M., Aeschbacher, S., Sinnecker, T., Benkert, P., Kobza, R., et al. (2020). Serum neurofilament light in atrial fibrillation: clinical, neuroimaging and cognitive correlates. Brain Commun. 2:fcaa166. doi: 10.1093/braincomms/fcaa166
Smith, S. M., Zhang, Y., Jenkinson, M., Chen, J., Matthews, P. M., Federico, A., et al. (2002). Accurate, robust, and automated longitudinal and cross-sectional brain change analysis. Neuroimage 17, 479–489. doi: 10.1006/nimg.2002.1040
Tiedt, S., Duering, M., Barro, C., Kaya, A. G., Boeck, J., Bode, F. J., et al. (2018). Serum neurofilament light: a biomarker of neuroaxonal injury after ischemic stroke. Neurology 91, e1338–e1347. doi: 10.1212/WNL.0000000000006282
Vermeer, S. E., Longstreth, W. T. Jr., and Koudstaal, P. J. (2007). Silent brain infarcts: a systematic review. Lancet Neurol. 6, 611–619. doi: 10.1016/s1474-4422(07)70170-9
von Elm, E., Altman, D. G., Egger, M., Pocock, S. J., Gotzsche, P. C., Vandenbroucke, J. P., et al. (2007). Strengthening the reporting of observational studies in epidemiology (STROBE) statement: guidelines for reporting observational studies. BMJ 335, 806–808.
Wardlaw, J. M., Smith, C., and Dichgans, M. (2013). Mechanisms of sporadic cerebral small vessel disease: insights from neuroimaging. Lancet Neurol. 12, 483–497. doi: 10.1016/S1474-4422(13)70060-7
Keywords: neurofilament light, renal function, glomerular filtration rate, body mass index, elderly, atrial fibrillation
Citation: Polymeris AA, Helfenstein F, Benkert P, Aeschbacher S, Leppert D, Coslovsky M, Willemse E, Schaedelin S, Blum MR, Rodondi N, Reichlin T, Moschovitis G, Wuerfel J, De Marchis GM, Engelter ST, Lyrer PA, Conen D, Kühne M, Osswald S, Bonati LH, Kuhle J and the Swiss-AF Investigators (2022) Renal Function and Body Mass Index Contribute to Serum Neurofilament Light Chain Levels in Elderly Patients With Atrial Fibrillation. Front. Neurosci. 16:819010. doi: 10.3389/fnins.2022.819010
Received: 20 November 2021; Accepted: 09 March 2022;
Published: 14 April 2022.
Edited by:
Helene Blasco, INSERM U1253 Imagerie et Cerveau (iBrain), FranceReviewed by:
Aurélie Ladang, University Hospital Center of Liège, BelgiumCopyright © 2022 Polymeris, Helfenstein, Benkert, Aeschbacher, Leppert, Coslovsky, Willemse, Schaedelin, Blum, Rodondi, Reichlin, Moschovitis, Wuerfel, De Marchis, Engelter, Lyrer, Conen, Kühne, Osswald, Bonati, Kuhle and the Swiss-AF Investigators. This is an open-access article distributed under the terms of the Creative Commons Attribution License (CC BY). The use, distribution or reproduction in other forums is permitted, provided the original author(s) and the copyright owner(s) are credited and that the original publication in this journal is cited, in accordance with accepted academic practice. No use, distribution or reproduction is permitted which does not comply with these terms.
*Correspondence: Jens Kuhle, SmVucy5LdWhsZUB1c2IuY2g=; Alexandros A. Polymeris, QWxleGFuZHJvcy5Qb2x5bWVyaXNAdXNiLmNo
†These authors share senior authorship
Disclaimer: All claims expressed in this article are solely those of the authors and do not necessarily represent those of their affiliated organizations, or those of the publisher, the editors and the reviewers. Any product that may be evaluated in this article or claim that may be made by its manufacturer is not guaranteed or endorsed by the publisher.
Research integrity at Frontiers
Learn more about the work of our research integrity team to safeguard the quality of each article we publish.