 Fabian Preisner1
 Rouven Behnisch2
 Véronique Schwehr1Tim Godel1
 Daniel Schwarz1Olivia Foesleitner1Philipp Bäumer3
 Sabine Heiland1
 Martin Bendszus1
 Moritz Kronlage1*
- 1Department of Neuroradiology, Heidelberg University Hospital, Heidelberg, Germany
- 2Institute of Medical Biometry and Informatics, Heidelberg University, Heidelberg, Germany
- 3Center for Radiology dia.log, Altötting, Germany
Background: Quantitative MR-neurography (MRN) is increasingly applied, however, the impact of the MR-scanner on the derived parameters is unknown. Here, we used different 3.0T MR scanners and applied comparable MR-sequences in order to quantify the inter-scanner reproducibility of various MRN parameters of the sciatic nerve.
Methods: Ten healthy volunteers were prospectively examined at three different 3.0T MR scanners and underwent MRN of their sciatic nerve using comparable imaging protocols including diffusion tensor imaging (DTI) and T2 relaxometry. Subsequently, inter-scanner agreement was assessed for seven different parameters by calculating the intraclass correlation coefficients (ICCs) and the standard error of measurement (SEM).
Results: Assessment of inter-scanner reliability revealed good to excellent agreement for T2 (ICC: 0.846) and the quantitative DTI parameters, such as fractional anisotropy (FA) (ICC: 0.876), whereas moderate agreement was observed for proton spin density (PD) (ICC: 0.51). Analysis of variance identified significant inter-scanner differences for several parameters, such as FA (p < 0.001; p = 0.02), T2 (p < 0.01) and PD (p = 0.02; p < 0.01; p = 0.02). Calculated SEM values were mostly within the range of one standard deviation of the absolute mean values, for example 0.033 for FA, 4.12 ms for T2 and 27.8 for PD.
Conclusion: This study quantifies the measurement imprecision for peripheral nerve DTI and T2 relaxometry, which is associated with the use of different MR scanners. The here presented values may serve as an orientation of the possible scanner-associated fluctuations of MRN biomarkers, which can occur under similar conditions.
Introduction
Magnetic resonance neurography (MRN) has become a valuable technique for evaluation of the peripheral nervous system (PNS) (Filler et al., 1996; Thawait et al., 2011; Chhabra et al., 2018). Morphological nerve imaging, which usually includes high-resolution, T2-weighted (T2w) sequences, has already been established in clinical routine and enables detection of tissue damage on a fascicular level (Pham et al., 2014; Baumer et al., 2016). The diagnostic value of morphological MRN, however, may seem limited since various neuropathies present with the common feature of an elevated T2w-signal, with or without an increase in fascicle caliber (Bäumer et al., 2011; Kronlage et al., 2017a). Quantitative imaging techniques, such as diffusion tensor imaging (DTI) (Baumer et al., 2014; Breckwoldt et al., 2015; Breitenseher et al., 2015) and T2 relaxometry (Kollmer et al., 2015; Vaeggemose et al., 2017a; Kronlage et al., 2019b) might improve the diagnostic performance of MRN by providing additional contrasts and thus potentially pave the way for a formulation of standardized diagnostic criteria.
Diffusion tensor imaging, which has been evaluated in peripheral neuropathies of various etiologies, allows to assess microstructural organization of anisotropic tissues, such as peripheral nerves, and offers four major biomarkers (Hagmann et al., 2006; Mori and Zhang, 2006). The fractional anisotropy (FA) serves as a marker of nervous tissue integrity and technically describes the degree of anisotropy of diffusion being a scalar value between zero (isotropic diffusion) and one (all diffusion in one direction) (Kronlage et al., 2017b; Godel et al., 2019; Kim et al., 2019). While mean diffusivity (MD) characterizes the overall diffusion independent of the direction, axial diffusivity (AD) provides a measure of water diffusion parallel to axonal fiber tracts. Radial diffusivity (RD), on the other hand, quantifies diffusion perpendicular to the principal nerve axis and is considered a biomarker of demyelination (Heckel et al., 2015; Kronlage et al., 2017b).
T2 relaxometry is a quantitative imaging technique that provides an estimate of the transverse relaxation time (T2), and also yields the parameter proton spin density (PD). In contrast to T2, PD is regarded as a semi-quantitative parameter since it is directly dependent on the MR signal and related parameters. T2 relaxometry is commonly based on a multi-echo spin echo (MSE) sequence and fitting of an exponential function (Tofts and du Boulay, 1990; Boulby, 2003). While T2 relaxometry has been extensively studied in the central nervous system, only a few studies have applied it to peripheral nerves with promising results (Kollmer et al., 2015, 2018; Vaeggemose et al., 2017b; Fortanier et al., 2020). In particular, it may allow for a better understanding of pathological mechanisms on a macromolecular level, since T2 reflects free-water protons and PD accounts for total water content including protons bound to macromolecules (Tofts and du Boulay, 1990; MacKay et al., 1994; Tofts, 2003).
Quantitative imaging techniques are increasingly studied in the PNS. While many of them have been proposed to produce valuable MR-biomarkers, they still have not been implemented in clinical routine yet, since it is essential to prove their reliability and reproducibility upon application. Preferably, the measurement error that is expected in different situations should be quantified in order to obtain orientation values regarding the precision of quantitative MRN techniques since the use of different hardware, software and/or readers are known to influence quantitative parameters (Guggenberger et al., 2012, 2013; Preisner et al., 2019, 2021). Furthermore, normative data is dependent on imaging parameters, demographic variables and post-processing algorithms (Chen et al., 2019; Hofstadler et al., 2019; Kronlage et al., 2019b). Recent studies have shown that DTI and T2 relaxometry of peripheral nerves provide reliable results when considering different readers or repetitive scans (Andreisek et al., 2010; Tagliafico et al., 2011; Ho et al., 2017; Preisner et al., 2019, 2021). However, those studies were conducted on identical MR scanners. In a real-world setting a change of the MR scanner is not unlikely, especially in a follow-up of a systemic neuropathy over several years. Moreover, a potential use of quantitative biomarkers as objective criteria for specific neuropathies is only conceivable if the influence of the scanner hardware is only minor. Also, when defining threshold values as diagnostic criteria for certain diseases, it is crucial to know the range of fluctuation, which must be considered, when different scanners are used. While one study reported promising first results for FA and MD measurements using different scanners (Guggenberger et al., 2013), a systematic assessment of inter-scanner reliability of peripheral nerve MRN biomarkers is still lacking.
The purpose of this study was therefore to assess the inter-scanner reliability of sciatic nerve DTI and T2 relaxometry by providing intraclass correlation coefficient (ICC-) and standard error of measurement (SEM-) values, respectively. We prospectively examined a cohort of ten healthy volunteers who each underwent MRN on three different MR scanners.
Materials and Methods
This study was approved by the institutional ethics committee. Written informed consent was obtained from all participants. The study design is summarized in Figure 1.
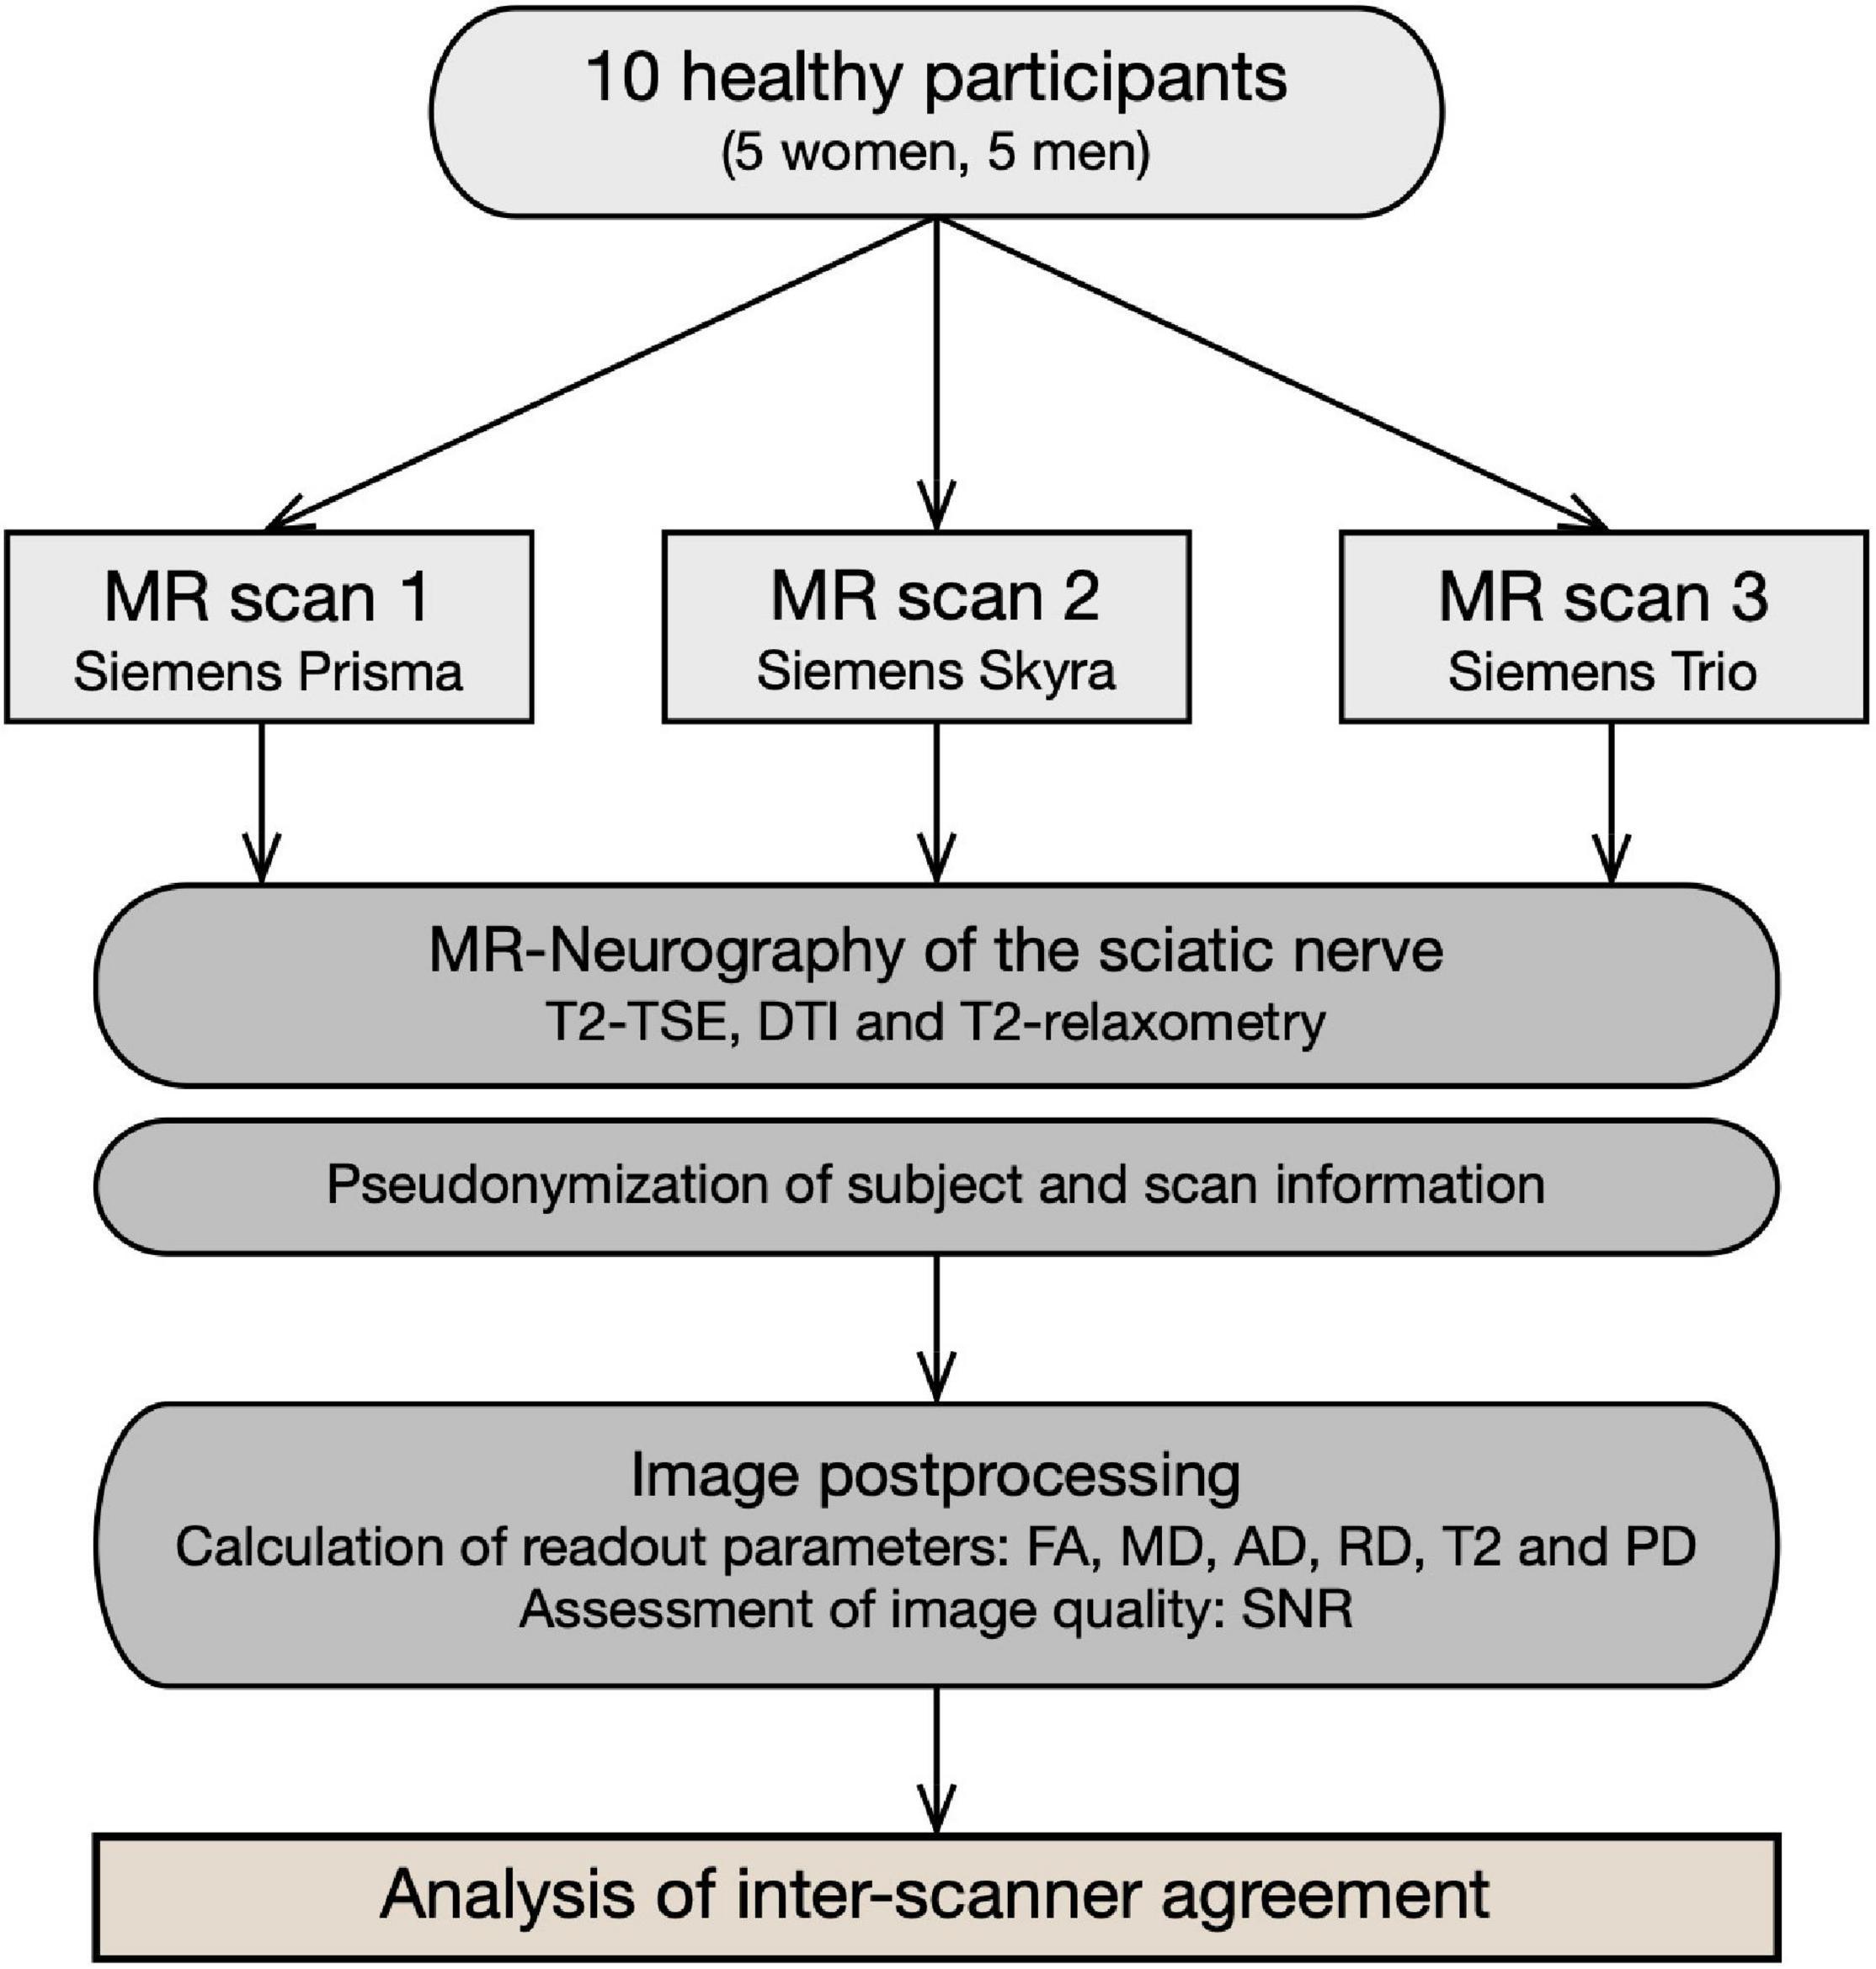
Figure 1. Flowchart of study design. Ten healthy participants underwent repeated multiparametric MR neurography of their sciatic nerve using three different MR scanners. Subsequent image analysis included standardized post-processing algorithms and quantitative assessment of DTI and T2 relaxometry parameters. Finally, inter-scanner agreement was analyzed, and results are expressed in the form of ICC and SEM.
Study Subjects
Ten healthy adults (>18 years, 5 men, 5 women) were prospectively enrolled for this study. Mean age was 25.4 ± 1.1 years (range: 24 – 28 years), mean height was 1.73 ± 0.11 m, mean weight was 69.6 ± 19.2 kg and mean BMI was 23 ± 3.9 (range: 18.4 – 29.9). Exclusion criteria were any known or history of peripheral nerve disease as well as general contradictions for MRI.
MR Imaging
All participants received three different MR scans of their sciatic nerve using three different MR scanners: (1) Magnetom Prisma-FIT (bore size 60 cm) (Siemens Healthineers, Erlangen, Germany), (2) Magnetom Skyra (bore size 70 cm) (Siemens Healthineers), and (3) Magnetom TIM-TRIO (bore size 60 cm) (Siemens Healthineers). Every scan was performed in supine position with legs extended using a 15-channel transmit-receive knee coil (Siemens Healthineers), which was placed at mid to distal thigh level. The coil was positioned such that its distal end aligned to the distal patella in order to ensure high reproducibility. Additional pads were used to immobilize the thigh and to avoid motion artifacts. Then, MRN protocols were carried out including high-resolution T2-weighted imaging, DTI and T2 relaxometry. Care was taken that parameters determining contrast and geometry were comparable with respect to the different hardware. Detailed sequence parameters are listed in Table 1. Representative MRN images are shown in Figure 2.
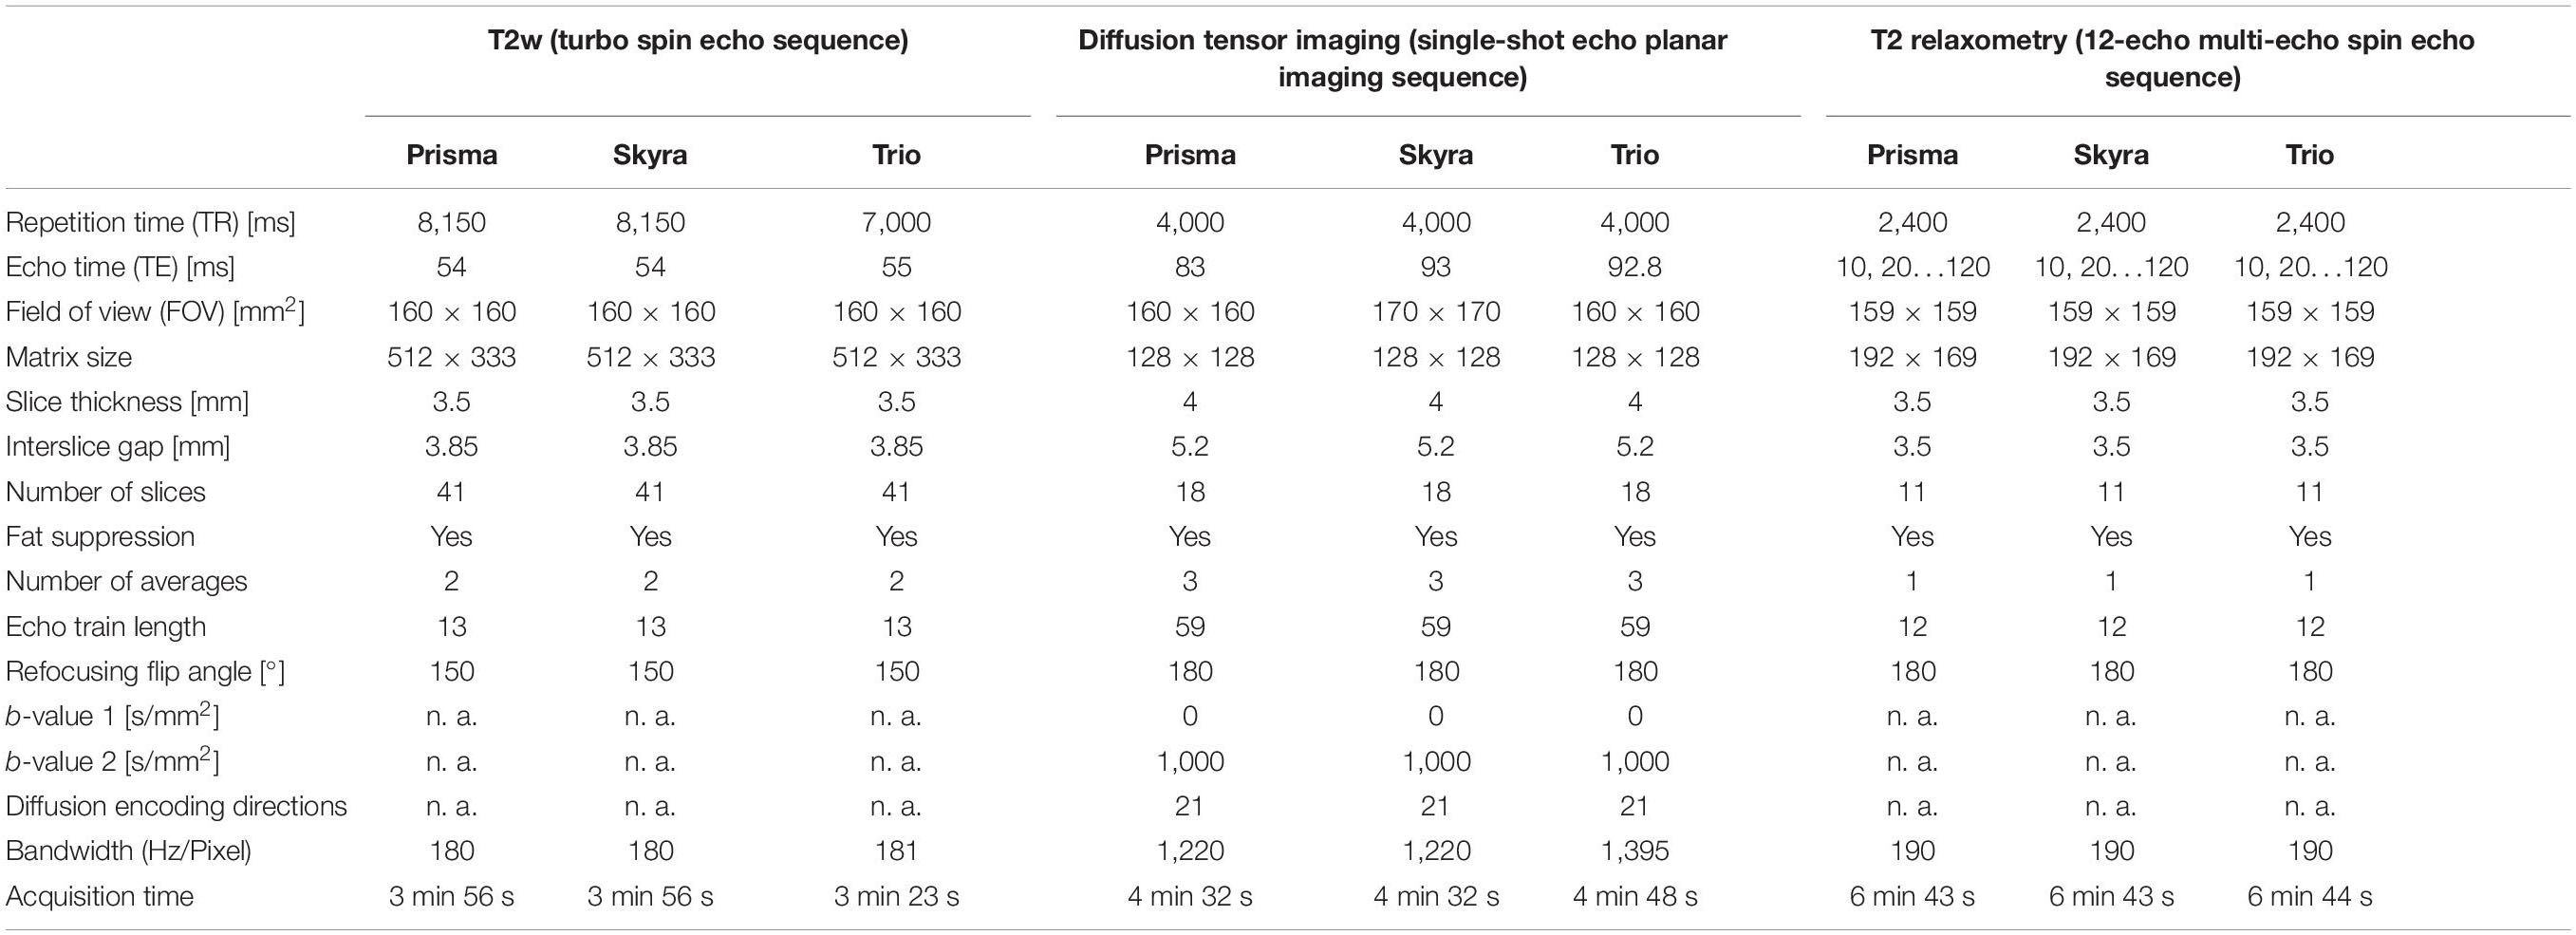
Table 1. MR imaging parameters.
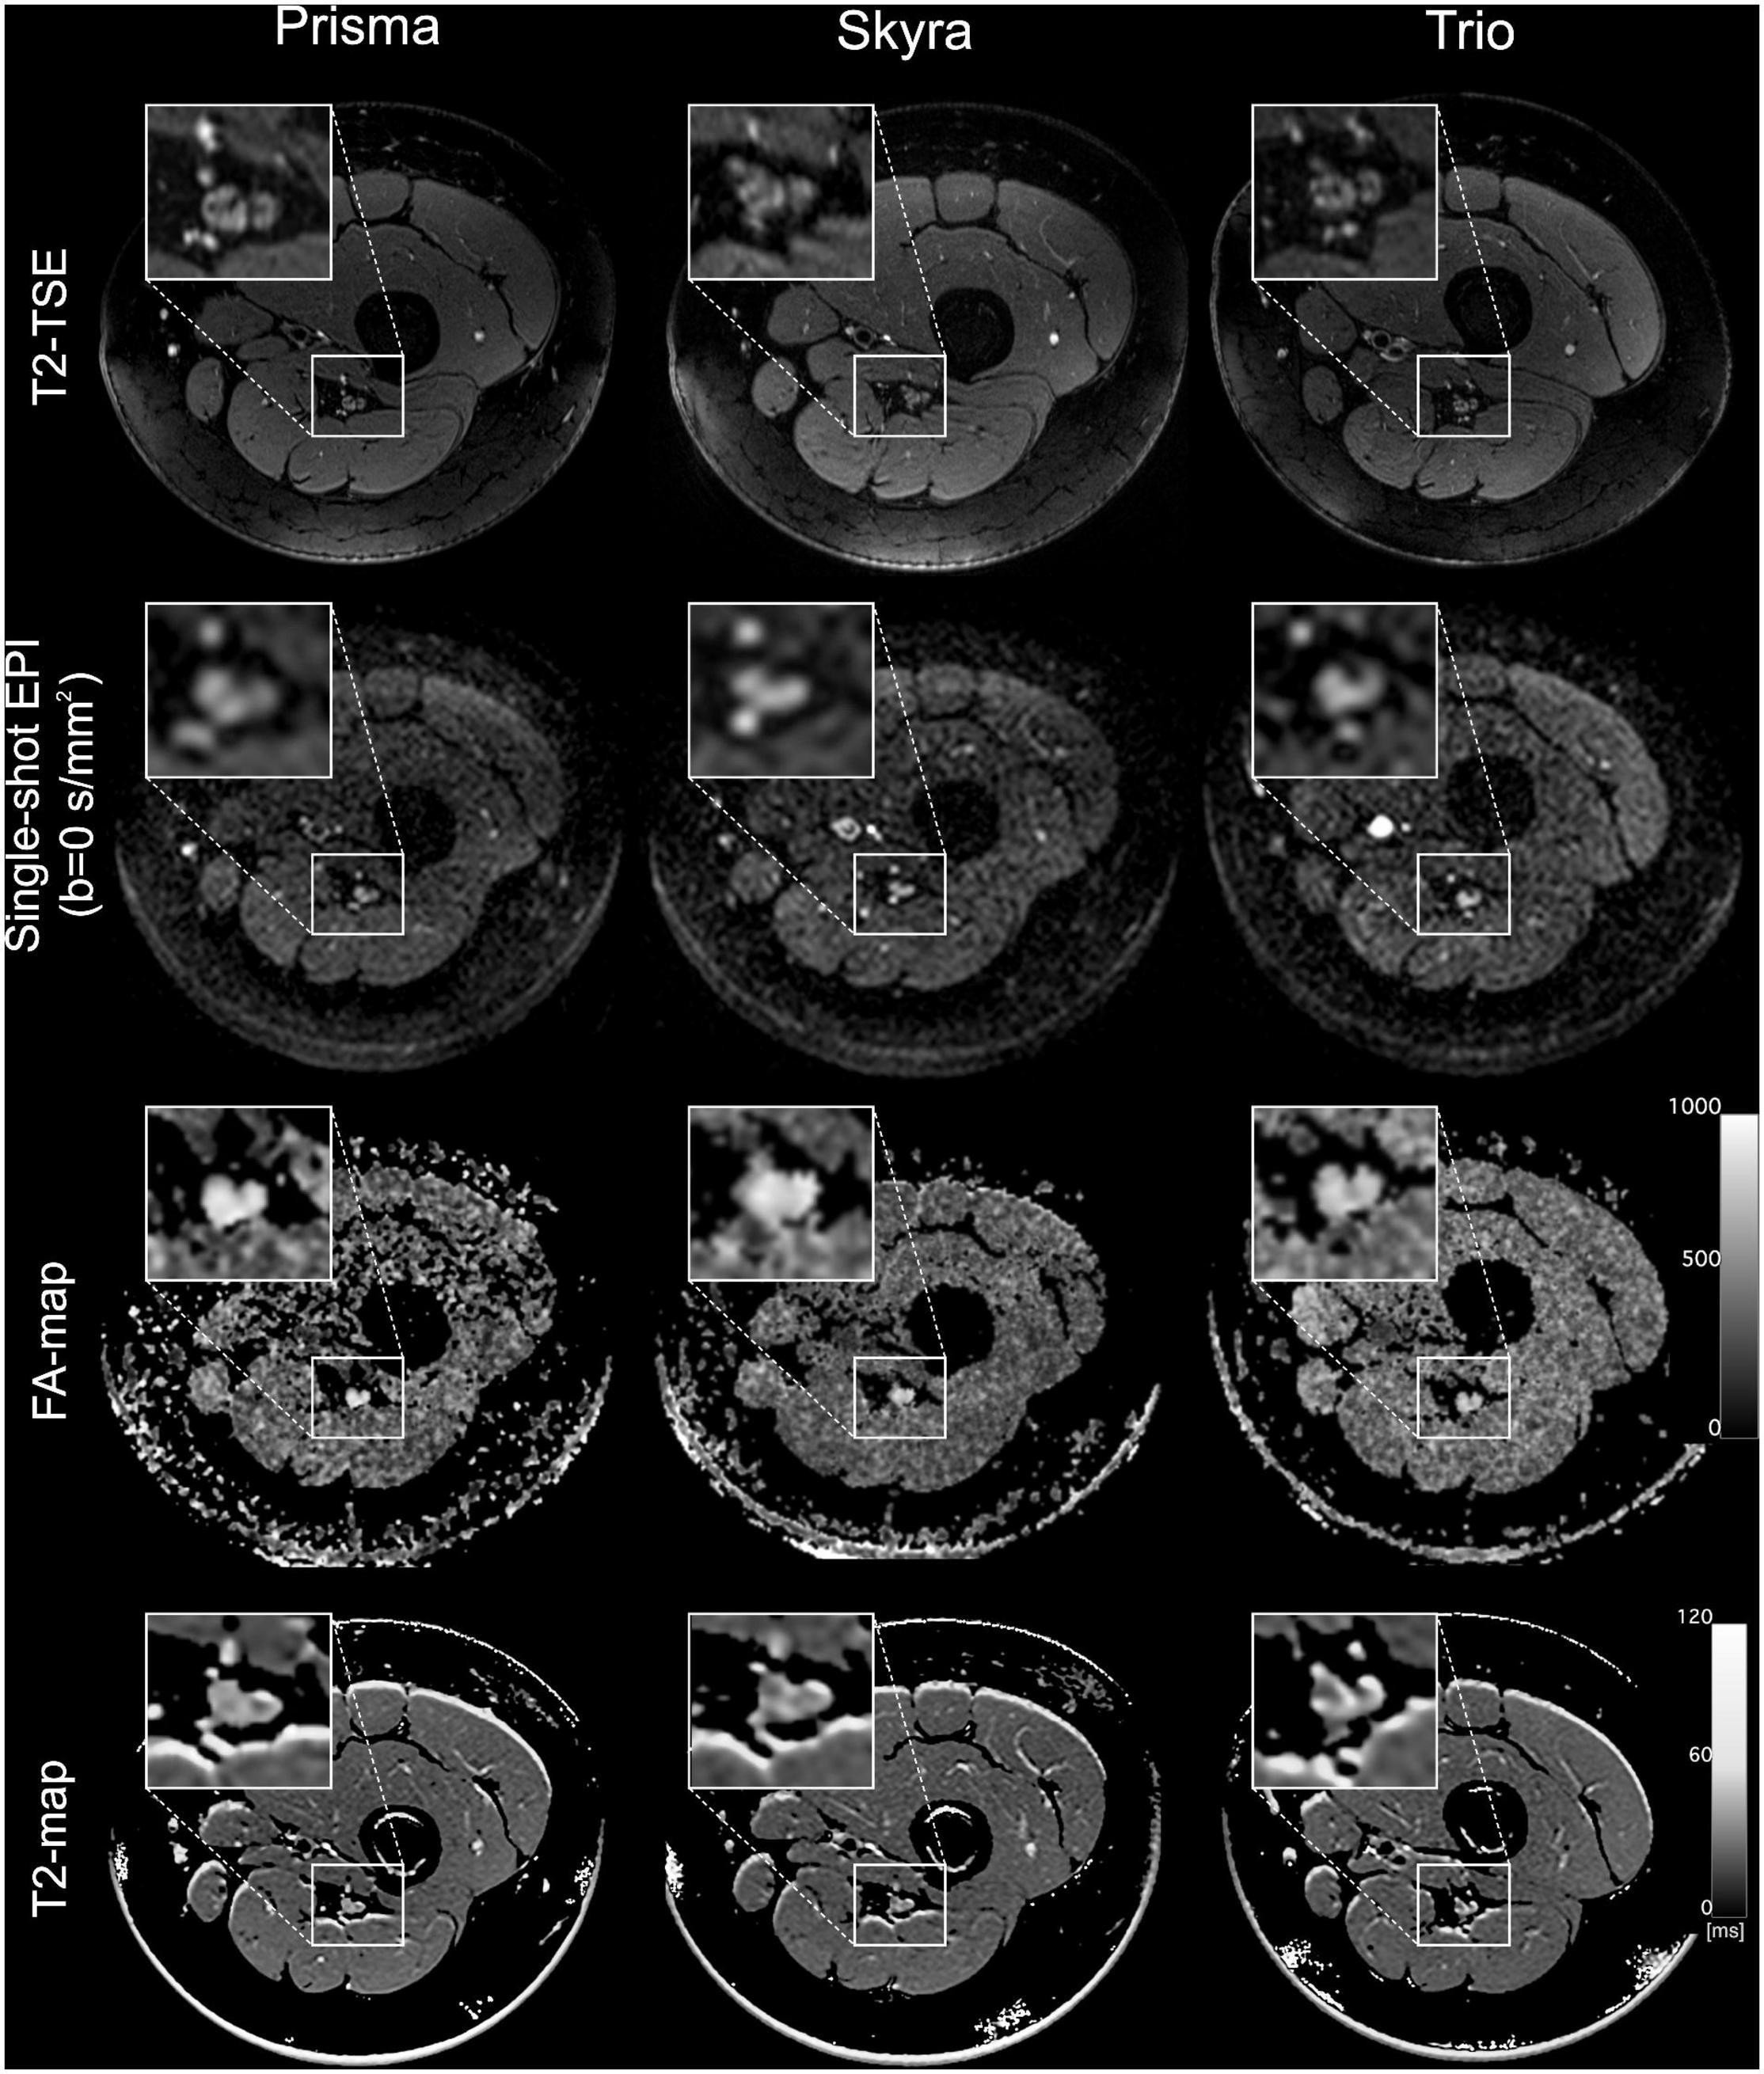
Figure 2. MR imaging of the left leg at mid-thigh level acquired in the same individual on three different MR scanners (Prisma, Skyra, and Trio). From top to bottom, the rows show representative images for a T2 turbo spin echo (TSE) sequence, a single-shot echo planar imaging sequence (b0-image), a calculated FA-map and an exemplary T2-map generated by the OsiriX plugin T2 map. Insets show a magnification of the sciatic nerve.
Analysis of Quantitative Magnetic Resonance Neurography
Images were analyzed using the DICOM-viewer OsiriX (Pixmeo Sarl, Switzerland). Initially, image quality was rated as sufficient or insufficient by F.P. (with more than 5 years of experience in neuromuscular imaging) for further analysis. Subsequently, region-of-interest (ROI) based manual nerve segmentation was performed for seven centrally located slices of the image slab using the high-resolution T2-weighted images in which the borders of the nerve were clearly identifiable. Similar approaches have been used in various studies of systemic neuropathies (Kronlage et al., 2017b; Simon et al., 2017; Lichtenstein et al., 2018) and healthy volunteers (Preisner et al., 2019, 2021). To avoid the inclusion of perineurial fat, nerve segmentation was restricted to the tibial portion of the sciatic nerve. All obtained ROIs were then copied to the corresponding b0-image (b = 0 s/mm2) for DTI analysis and to the corresponding multi-echo spin echo (MSE) slice (TE20ms) for assessment of T2 relaxometry using the software’s in-built image co-registration tool and, if necessary, manually corrected for distortion artifacts, as described previously (Preisner et al., 2021).
Subsequently, the DTI-derived parameters FA, MD, AD and RD were obtained for each slice separately using the OsiriX plug-in DTI map with a preset for noise threshold of 14 (referring to the voxel signal value in the b0-image [arbitrary units]). T2 relaxometry was conducted using a 12-echo MSE sequence (TE10–120 ms, Δ = 10 ms), of which only the six even echoes (TE20,40,60,80,120 ms) were used for further quantitative analysis. This included a slice-wise determination of the ROI signal intensity using the OsiriX plug-in ROI-enhancement and fitting to a mono-exponential function:
as described in previous works (Milford et al., 2015; Kronlage et al., 2017a), where S(TE) equals the signal intensity at a given echo time TE, T2 is the transverse relaxation time and PD is a value proportional to proton density per voxel. Moreover, a normalized PD was calculated (further referred to as PDRatio) by dividing the PD of the sciatic nerve by a PD of skeletal muscle, the latter of which was assessed by ROI-based measurements in the adjacent musculature (M. semimembranosus or M. adductor magnus). After slice-wise calculation of DTI parameters, T2 and PD, all parameters were averaged over all seven slices for further analysis.
Quantitative Assessment of Image Quality
The signal-to-noise ratio (SNR) is commonly reported to describe image quality. To determine SNRDTI, we used a “five-region approach” in the b0-image. Therefore, a total number of four ROIs with identical size (4 cm2) were positioned in the corners of the background and the standard deviations of the background signals were averaged over all four ROIs to calculate “noise.” Nerve signal intensity was subsequently divided by noise to calculate SNRDTI (Supplementary Figure 1). This was performed on all seven slices, which were used for further DTI-analysis, and SNR values then were averaged over all slices. SNR of T2 relaxometry was assessed similarly using the MSE sequence (TE10ms).
Statistical Analysis
Statistical testing was performed using SPSS (Version 24; SPSS Inc.) and R (Version 4.0.3; R Foundation for Statistical Computing). Graphs were created using GraphPad Prism (Version 9.0.2; GraphPad Software Inc.).
Descriptive statistics include mean values, standard deviation, interquartile range, and minimum to maximum values for every quantitative MRN parameter. One-way analysis of variance with pairwise comparisons was conducted to test for differences between scanners and Bonferroni correction was applied to correct for multiplicity. To assess inter-scanner agreement, a two-way mixed effects model, ICC (3,1) according to Shrout and Fleiss, was applied and ICCs with 95% confidence intervals (CIs) were calculated (Shrout and Fleiss, 1979). According to Koo and Li, ICC values between 0.5 and 0.75, between 0.75 and 0.9, and greater 0.9 were regarded as indicative for moderate, good and excellent agreement (Koo and Li, 2016). Additionally, mean absolute percentage errors between MR scanners were calculated for each parameter and participant and subsequently averaged over all participants, respectively. In this context, the mean value between the three scans served as the accepted true value for each parameter. Furthermore, Bland-Altman analyses for FA, T2, PD and PDRatio were calculated and measurement bias with 95% CIs as well as upper and lower limits of agreements are reported. Measurement distribution within the limits of agreement is visualized in Bland-Altman plots. P-values ≤ 0.05 were regarded as statistically significant.
Results
Descriptive Statistics
Detailed descriptive statistics for all parameters and MR scans are shown in Figure 3 and Supplementary Table 1. The overall mean value and standard deviation averaged over all MR scanners was 0.61 ± 0.05 for FA, 1152.8 ± 98.9 × 10⁻⁶ mm2/s for MD, 2076.2 ± 161.7 × 10⁻⁶ mm2/s for AD, 690.6 ± 96 × 10–6 mm2/s for RD, 66.8 ± 5.9 ms for T2, 213 ± 30.1 for PD and 0.66 ± 0.03 for PDRatio.
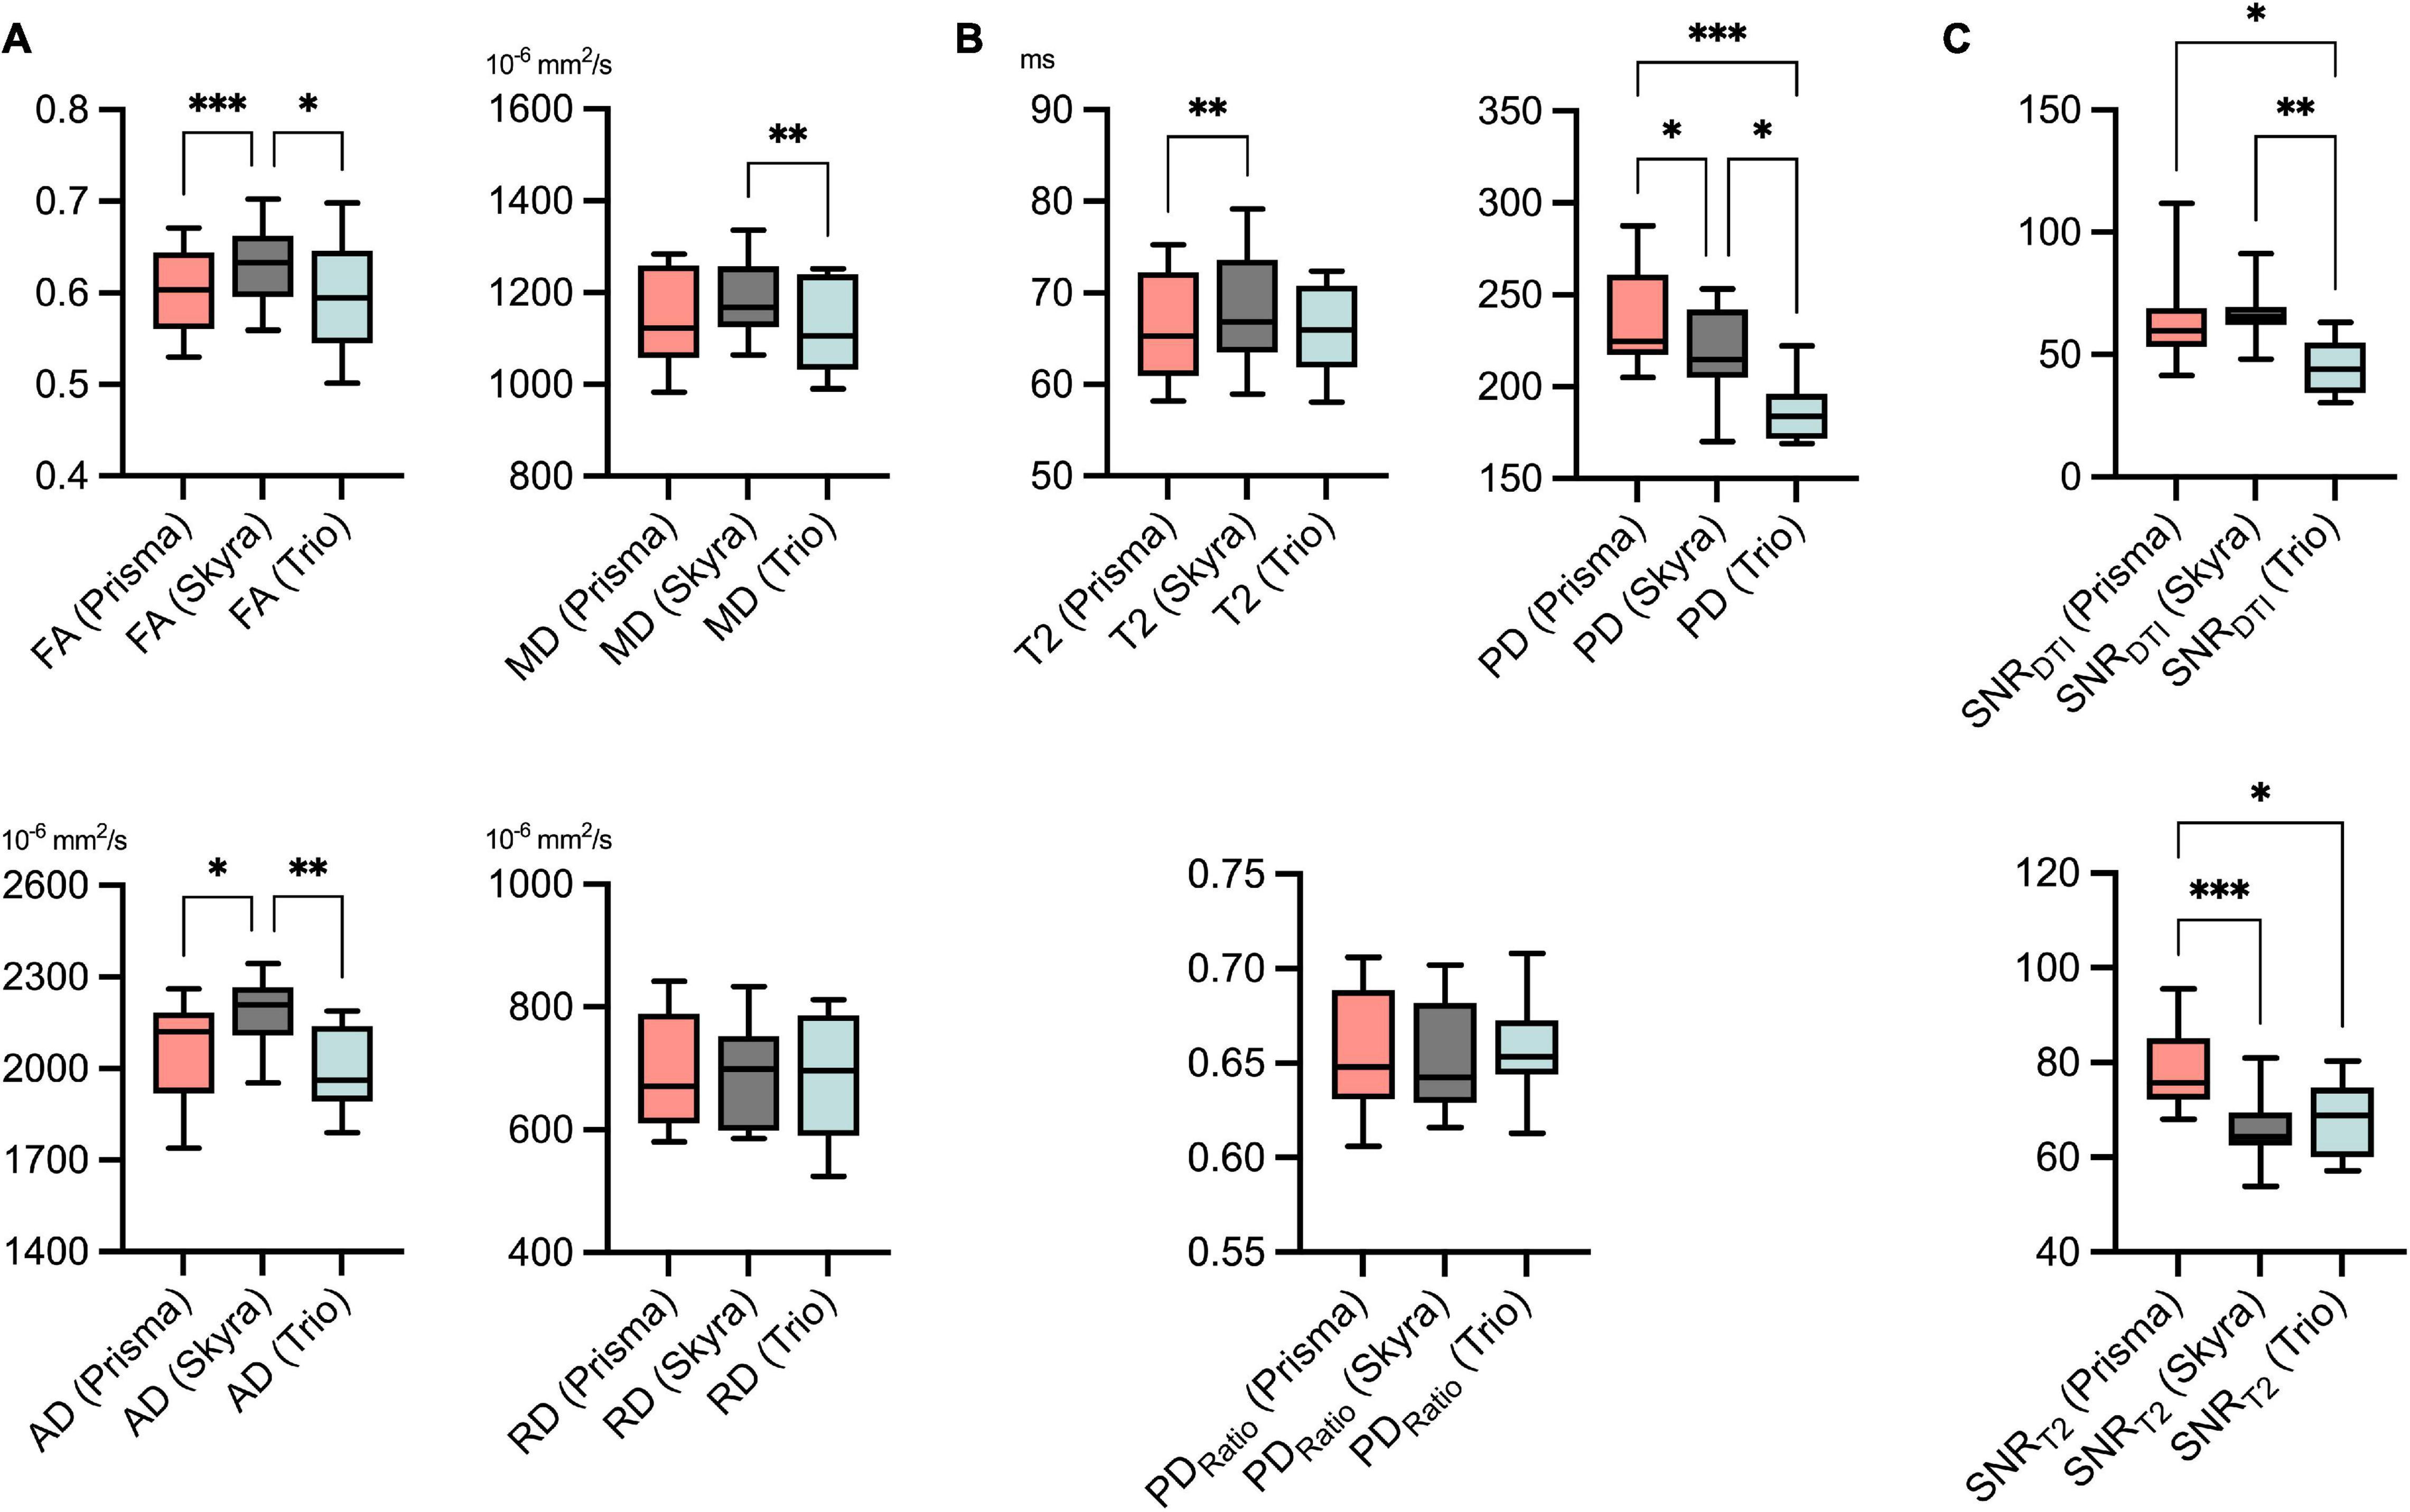
Figure 3. Descriptive statistics for all DTI (A) and T2 relaxometry (B) parameters, SNR (C) values and all three scans, respectively. SNR was assessed separately for diffusion tensor imaging (SNRDTI) and the T2-relaxometry sequence (SNRT2). Values are illustrated as boxplots to visualize measurement distribution. FA, fractional anisotropy; MD, mean diffusivity; AD, axial diffusivity; RD, radial diffusivity; T2, transverse relaxation time; PD, proton spin density [proportional to proton density per voxel]; SNR, signal-to-noise ratio. Statistical significance is indicated on a level of *p ≤ 0.05, **p ≤ 0.01, and ***p ≤ 0.001.
Comparison of mean values of the different MR scanners by ANOVA showed predominantly small but statistically significant differences for FA (Prisma vs. Skyra: 0.601 vs. 0.632, p < 0.001; Skyra vs. Trio: 0.632 vs. 0.597, p = 0.022), for MD (Skyra vs. Trio: 1,189 vs. 1,121 × 10–6 mm2/s, p < 0.01), for AD (Prisma vs. Skyra: 2,054 vs. 2,182 × 10–6 mm2/s, p = 0.016; Skyra vs. Trio: 2,182 vs. 1,993 × 10–6 mm2/s, p < 0.01), for T2 (Prisma vs. Skyra: 66.2 vs. 68.3 ms, p < 0.01) and for PD (Prisma vs. Skyra: 235 vs. 217, p = 0.022; Prisma vs. Trio: 235 vs. 187, p < 0.001; Skyra vs. Trio: 217 vs. 187, p = 0.016). No significant differences could be detected for RD and PDRatio.
Inter-Scanner Agreement
Assessment of inter-scanner reliability showed good agreement for FA, MD and T2 with ICCs ranging from 0.83 for MD to 0.88 for FA (all ICC values in Table 2). Excellent agreement was observed for RD with an ICC of 0.92. Inter-scanner reliability was moderate regarding AD, PD and PDRatio with ICC values ranging from 0.51 for PD to 0.7 for AD.

Table 2. Intraclass correlation coefficients (ICCs) and the standard error of measurement (SEM).
Calculated SEM values were mostly within the observed standard deviation of the overall mean values, for example SEM was 0.033 for FA, 4.12 ms for T2 and 27.8 for PD. SEM values for all parameters as well as mean absolute percentage errors are listed in Table 2.
Bland-Altman analysis is shown in Table 3 and Supplementary Figure 2. Maximal measurement bias between two MR scanners was 0.035 for FA, 67.9 × 10⁻⁶ mm2/s for MD, 188.8 × 10⁻⁶ mm2/s for AD, 11.7 × 10⁻⁶ mm2/s for RD, 2.4 ms for T2, 48.44 for PD and 0.003 for PDRatio.
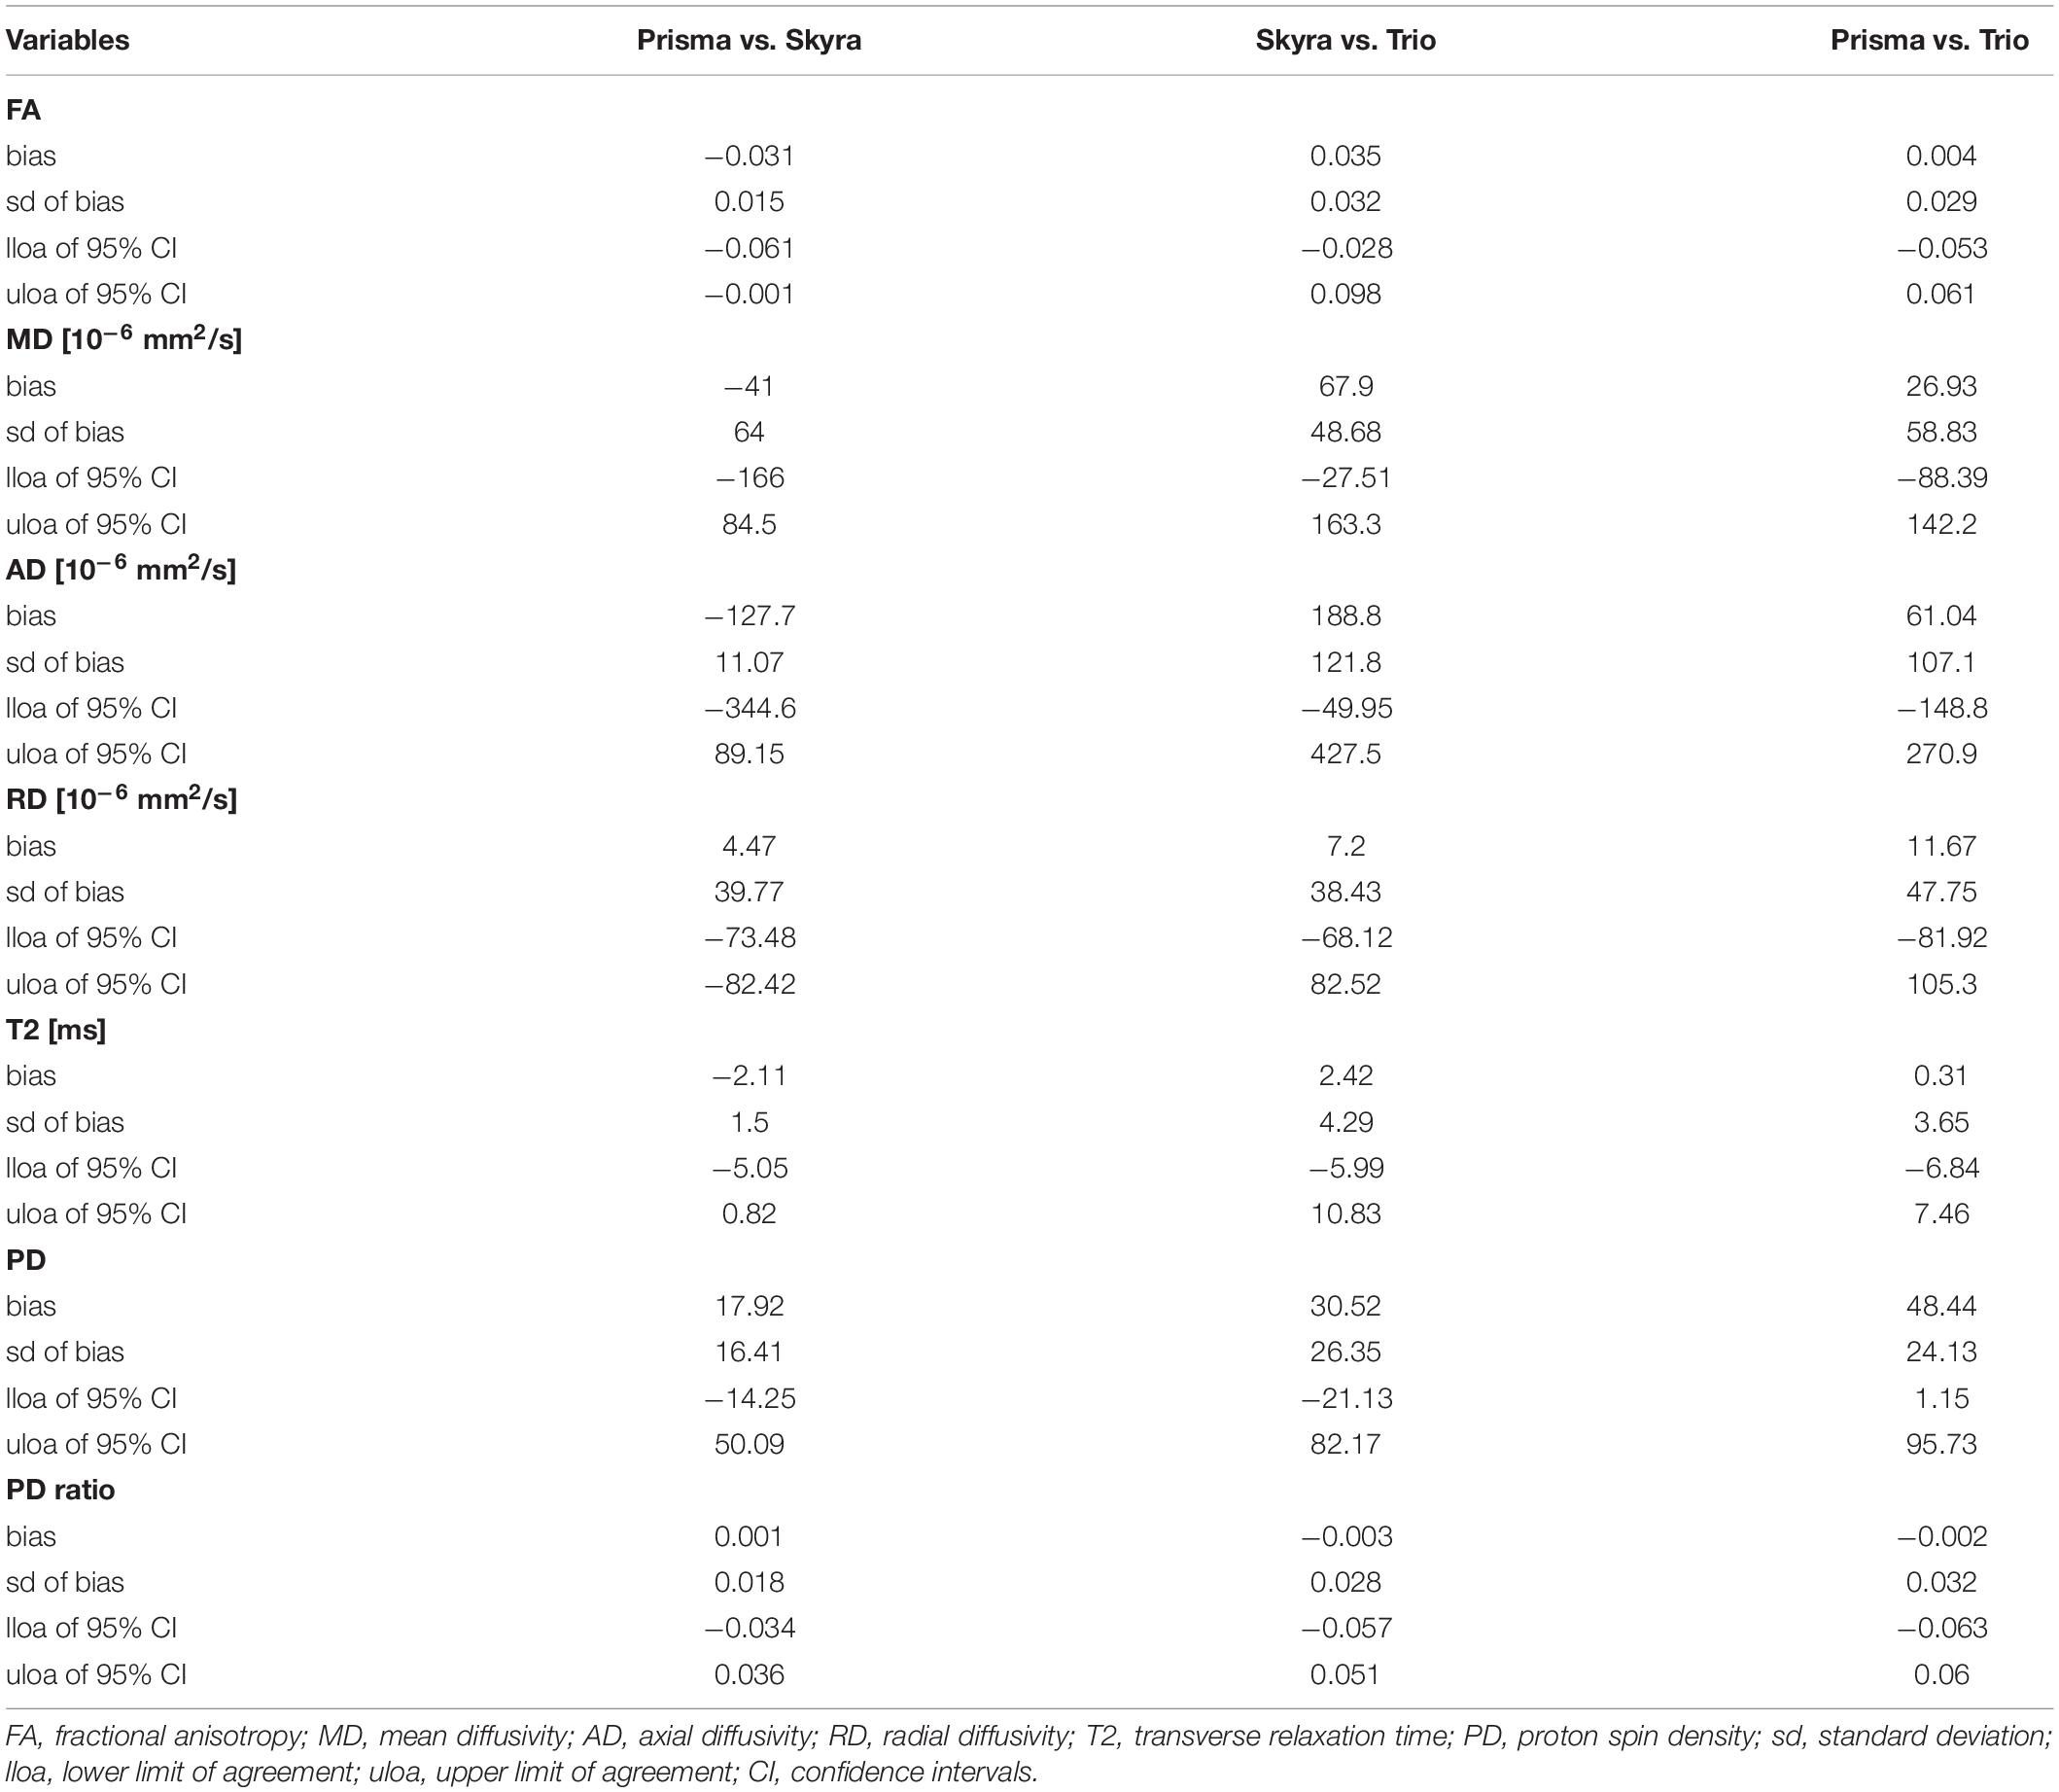
Table 3. Bland-Altman analyses for inter-scanner agreement.
Signal-to-Noise Ratio
Mean SNR values were calculated for DTI (SNRDTI) and the T2 relaxometry sequence (SNRT2) for all three MR scanners, respectively. Analyses of variance showed that SNRDTI was significantly higher for Prisma and Skyra compared to Trio (Prisma vs. Trio, p = 0.03; Skyra vs. Trio, p = 0.002). SNRT2 was significantly higher for Prisma compared to Skyra and Trio (Prisma vs. Skyra, p = 0.001; Prisma vs. Trio, p = 0.027) (Figure 3 and Table 4).
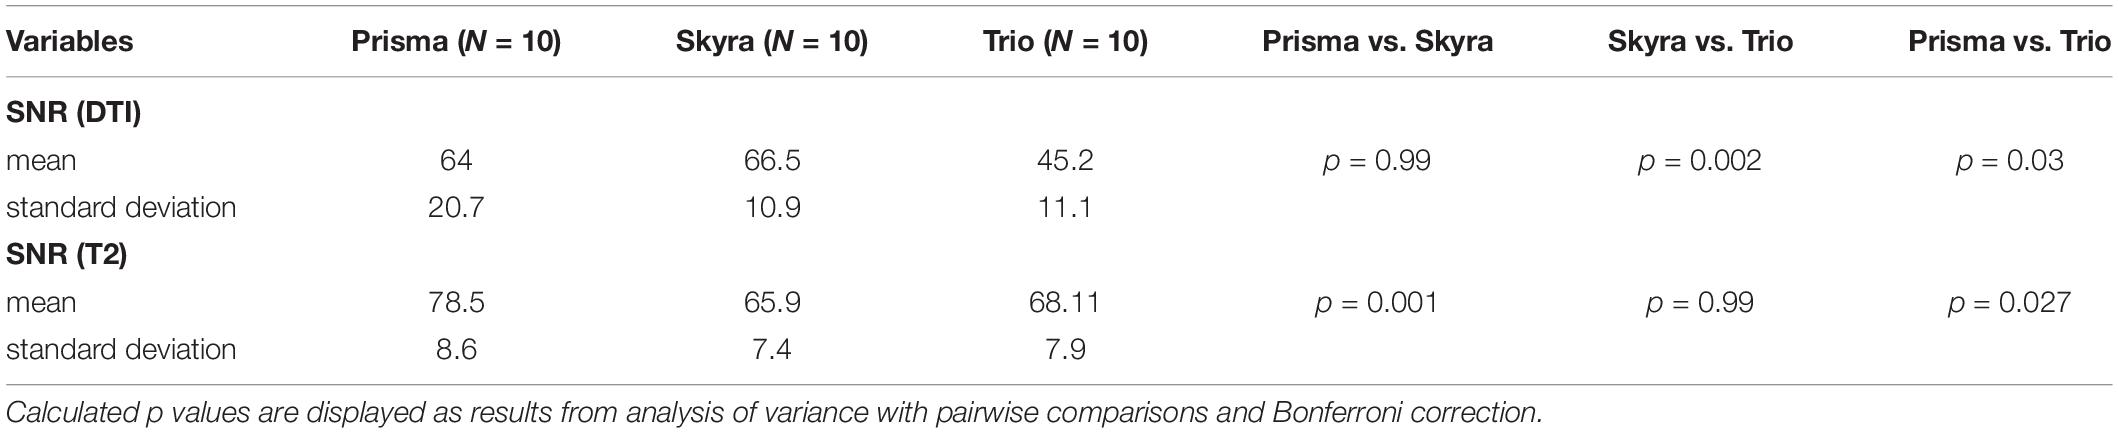
Table 4. Quantitative signal-to-noise ratio (SNR) analysis for the diffusion tensor imaging (DTI) and T2 relaxometry sequence.
Discussion
This study evaluated the reproducibility of peripheral nerve DTI and T2 relaxometry in different MR scanners at the same field strength. We examined a healthy cohort using three different MR scanners (all 3.0T) and quantified measurement accuracy by reporting ICC- and SEM values for seven different parameters. As a principal finding, differences of some DTI and T2 relaxometry parameters were statistically significant between scanners. In order to provide a measure that allows to estimate the inaccuracy attributed to a change of the MR scanner in an individual patient follow-up, we report the standard error of measurement (SEM) for each parameter.
The authors are aware of only one study by Guggenberger et al. (2013) that has systematically assessed the agreement of FA and apparent diffusion coefficient (ADC) values of the median nerve using three different MR scanners. Similar to that study, we observed that quantitative parameters, such as FA, can differ significantly between different MR scanners. This may in part result from differences in SNR (Figure 3) and the fact that noise plays a role as a systematic source of error when calculating quantitative parameters. Also, factors that are not transparent to the user, such as correction or interpolation processes during image acquisition, may lead to systematic differences in quantitative MRN values. PD was the parameter with the highest inter-scanner variation, as we expected due to the parameter’s dependency on technical properties, such as RF coil, and signal attenuation. Thus, absolute PD values should always be interpreted carefully. Normalizing PD to adjacent muscle tissue has shown to be a more robust parameter and can be used to improve comparability between different scanners, yet accompanying muscular changes should always be considered when observing systemic neuropathies (Kronlage et al., 2019a).
Like in many reliability studies, Guggenberger et al. expressed their results by reporting the ICC, which is a commonly used parameter to describe the reliability of measurements and ranges between 0 and 1. Although the ICC is a useful statistical measure, it should be interpreted with care since different forms of ICC exist and results may vary depending on the selected form, even if applied to the same data (Koo and Li, 2016). Additionally, ICC values can be affected by several factors, such as data range, which means that a higher ICC value does not necessarily indicate less variability (Stratford and Goldsmith, 1997; Lee et al., 2012). In light of these limitations, we here provide the standard error of measurement (SEM) for every parameter in addition to ICC values. The SEM estimates measurement precision independently of the sample variance and is expressed in the same physical unit as the measured quantity, thereby providing a more useful framework for decision making in clinical practice (Popovic and Thomas, 2017).
The expected measurement error, which is associated with different readers (interreader) and repeated scans (test-retest) without switching between different MR scanners, has been estimated in recent studies and corresponding SEM values have been calculated for various quantitative MRN parameters (Preisner et al., 2019, 2021). The SEM values observed in our study, which accounts for the use of different MR scanners, demonstrate a slightly higher measurement error compared to interreader and test-retest observations with one particular MR scanner. For example, we report an SEM for FA considering examinations on different MR scanners of 0.033. In contrast, a repeated MR examination on the same scanner or a change of the reader have been described by SEM values of 0.02, respectively (Preisner et al., 2019). Furthermore, we calculate a measurement error for T2 of SEM = 4.1 ms when using different MR scanners. This value may be compared to a previously reported SEM of 2.7 ms for repeated measurements on the exact same MR scanner (Preisner et al., 2021).
This observation becomes even more relevant when calculating the minimum detectable difference (MDD, equals 2.8 × SEM), which can help to decide whether an observed difference may likely be attributed measurement error, or whether it really indicates a change in the true value (Popovic and Thomas, 2017). If a measured difference is larger than the MDD, there is high certainty that it is due to a change in the true value, e.g., reflecting a substantial change in tissue physiology. As the MDD increases along with SEM and thus a change of the MR scanner, it becomes evident that a greater difference in values will be required to confidently distinguish healthy from diseased nerves when using different MR scanners.
For example, the MDD for FA associated with a change of MR scanner is 2.8 × 0.033 = 0.092. Differences in sciatic nerve FA values between patients and healthy participants have been previously reported and ranged between 0.06 and 0.25 (Mathys et al., 2013; Bernabeu et al., 2016; Markvardsen et al., 2016; Vaeggemose et al., 2017a; Kim et al., 2019). While these differences were statistically significant on a group level, some of these differences, in a theoretical setting and on an individual patient level, would be lower than the calculated MDD and thus not reliably distinguishable from variations due to measurement error.
On a group level, however, these differences may have a lesser impact. The systematic difference between two scanners is reflected by the measurement bias observed in our study. For example, maximal measurement bias for FA was 0.035, which is smaller compared to previously reported differences in patients and healthy participants (see above) and within the standard range of the overall mean values. Similar observations can be made for other DTI parameters as well as T2 relaxometry. However, this systematic bias should be considered, especially when participants of particular study groups are examined at different MR scanners, since this bias alone may lead to statistically significant results.
Taken together, our results concerning the use of different MR scanners produced a higher measurement error compared to recently published measurement errors for repeated scans on the same scanner or a change of reader (Preisner et al., 2019, 2021). This becomes relevant regarding the use of quantitative MRN techniques as biomarkers, since their potential would be limited for individual follow-up examinations, especially when expected differences are subtle, e.g., in cases of peripheral nerve trauma or longitudinal observation of diffusion parameters, where minor changes may reflect fiber organization or myelin sheath integrity (Mathys et al., 2013). Using different MR scanners for larger group studies, however, may in certain situations be justifiable since overall differences – despite in part statistically significant – are not expected to substantially impact the differentiation between healthy and diseased nerves. In this context, however, it is also important to note that statistical significance does not necessarily imply clinical relevance, since small and non-significant differences can be clinically relevant and vice versa. Also, statistical significance is dependent of the power of the test. Due to our study design, we chose an ANOVA with pairwise comparisons, which has a higher power compared to a non-paired test. Therefore, we would like to focus not only on statistical significance but would like to emphasize the absolute amount of this systematic bias, which we quantified in this study, and which may aid as an orientation in future situations when a change of scanner hardware occurs.
There are limitations to this study. First, ten healthy volunteers were included. A larger cohort as well as the inclusion of patients with peripheral nerve disease would allow for optimal variability assessment of quantitative MRN and improve interpretation of measurement fluctuations in relation to inter-scanner differences. The fact that we only used MR scanners from one vendor can be regarded as another limitation. MR scanners from different vendors might introduce a greater variability in hardware and sequence parameters are expected to vary more substantially between different vendors, e.g., regarding RF pulse shape and gradient ramping. Thus, using MR scanners from more than one vendor may have led to higher measurement variability. Minor differences in DTI sequence parameters regarding field of view, echo time and pixel bandwidth may also contribute to the here reported discrepancies in SNR and affect the determined measurement error of DTI parameters, which must be regarded as another relevant limitation of this study. Especially minor variations regarding the field of view with identical matrix size led to different voxel sizes between MR scanners. Taken this into account, we would expect an advantage in SNRDTI for Skyra of approximately 13%, but only a 4% higher SNRDTI was observed. This, in turn, may be a consequence of hardware differences between the two MR scanners, since Prisma has a smaller bore size and allowed for lower TE values due to a stronger gradient system. Furthermore, SNR calculations were conducted using ROI-based measurements in separate signal and noise regions, although it is known that the use of multi-channel coils and reconstruction filters can lead to over- or underestimation of SNR when using such methods (Dietrich et al., 2007). Like in many in vivo studies, an approach based on repeated acquisition to calculate the SNR was not considered feasible with respect to the acquisition time and potential motion artifacts. As a compromise, we used a “five-region approach,” calculated the standard deviation of background noise instead of mean values, and averaged over multiple slices to compensate for inhomogeneous spatial distribution of noise. However, a certain bias is to be expected with this method, which should be considered another limitation. Moreover, we used one vendor-independent post-processing method for analysis of all scans. This allowed to minimize systematic differences resulting during post-processing and helped to attribute the observed differences to the acquisition and processing stages. Furthermore, we focused on the sciatic nerve since it is still the most commonly examined nerve in MRN and most suitable due to its straight course and great caliber. An inclusion of small caliber nerves, for example at the upper extremity, may have led to a higher measurement variability. However, a recent study suggests that DTI- and in particular FA-values of the sciatic nerve can be considered as an objective parameter for the structural integrity of the entire PNS in diabetic neuropathy (Jende et al., 2021). Thus, quantitative MRN of the sciatic nerve seems conceivable in follow-up of systemic neuropathies, although this concept still must be evaluated for other forms of systemic neuropathies in future studies. Lastly, we chose a manual nerve segmentation approach, since it is regarded a well-established method in MRN and proven to result in reliable and reproducible values, both between different readers and scans (Preisner et al., 2019, 2021). In the future, automatic segmentation methods may also become implemented into clinical practice (Balsiger et al., 2018).
In summary, this study quantifies the measurement imprecision for peripheral nerve DTI and T2 relaxometry, which is associated with the use of different MR scanners. The here presented values may serve as an orientation of the possible scanner-associated fluctuations of MRN biomarkers, which can occur under similar conditions.
Data Availability Statement
The raw data supporting the conclusions of this article will be made available by the authors, without undue reservation.
Ethics Statement
The studies involving human participants were reviewed and approved by the Ethics Committee of the Medical Faculty of the University of Heidelberg. The patients/participants provided their written informed consent to participate in this study.
Author Contributions
MK, PB, FP, and MB designed and coordinated the study. VS organized the participants. VS and MK collected the MR data. FP, MK, TG, OF, DS, and SH performed image post-processing and analysed the data. RB performed the main statistical analysis. FP and MK wrote the manuscript with input from all co-authors.
Funding
SH (SFB 1118), DS (SFB 1118), and MB (SFB 1158) were supported by the German Research Foundation. FP and DS were supported by a Physician-Scientist Fellowship of the Medical Faculty of the University of Heidelberg. OF receives a research grant from the Rahel Goitein-Straus Support Program of the Medical Faculty of the University of Heidelberg. TG was supported by a Memorial Fellowship from the Else Kröner-Fresenius-Foundation and received research grants from Amicus Therapeutics.
Conflict of Interest
The authors declare that the research was conducted in the absence of any commercial or financial relationships that could be construed as a potential conflict of interest.
Publisher’s Note
All claims expressed in this article are solely those of the authors and do not necessarily represent those of their affiliated organizations, or those of the publisher, the editors and the reviewers. Any product that may be evaluated in this article, or claim that may be made by its manufacturer, is not guaranteed or endorsed by the publisher.
Supplementary Material
The Supplementary Material for this article can be found online at: https://www.frontiersin.org/articles/10.3389/fnins.2022.817316/full#supplementary-material
References
Andreisek, G., White, L. M., Kassner, A., and Sussman, M. S. (2010). Evaluation of diffusion tensor imaging and fiber tractography of the median nerve: preliminary results on intrasubject variability and precision of measurements. AJR Am. J. Roentgenol. 194, W65–W72. doi: 10.2214/ajr.09.2517
Balsiger, F., Steindel, C., Arn, M., Wagner, B., Grunder, L., El-Koussy, M., et al. (2018). Segmentation of peripheral nerves from magnetic resonance neurography: a fully-automatic, deep learning-based approach. Front. Neurol. 9:777. doi: 10.3389/fneur.2018.00777
Bäumer, P., Dombert, T., Staub, F., Kaestel, T., Bartsch, A. J., Heiland, S., et al. (2011). Ulnar neuropathy at the elbow: MR neurography–nerve T2 signal increase and caliber. Radiology 260, 199–206. doi: 10.1148/radiol.11102357
Baumer, P., Kele, H., Xia, A., Weiler, M., Schwarz, D., Bendszus, M., et al. (2016). Posterior interosseous neuropathy: supinator syndrome vs fascicular radial neuropathy. Neurology 87, 1884–1891. doi: 10.1212/wnl.0000000000003287
Baumer, P., Pham, M., Ruetters, M., Heiland, S., Heckel, A., Radbruch, A., et al. (2014). Peripheral neuropathy: detection with diffusion-tensor imaging. Radiology 273, 185–193. doi: 10.1148/radiol.14132837
Bernabeu, A., Lopez-Celada, S., Alfaro, A., Mas, J. J., and Sanchez-Gonzalez, J. (2016). Is diffusion tensor imaging useful in the assessment of the sciatic nerve and its pathologies? Our clinical experience. Br. J. Radiol. 89:20150728. doi: 10.1259/bjr.20150728
Boulby, P. A. (2003). “T2: the transverse relaxation time,” in Quantitative MRI of the Brain: Measuring Changes Caused by Disease, ed. P. S. Tofts (Hoboken, NJ: Wiley and Sons Ltd), 143–201.
Breckwoldt, M. O., Stock, C., Xia, A., Heckel, A., Bendszus, M., Pham, M., et al. (2015). Diffusion tensor imaging adds diagnostic accuracy in magnetic resonance neurography. Invest. Radiol. 50, 498–504. doi: 10.1097/rli.0000000000000156
Breitenseher, J. B., Kranz, G., Hold, A., Berzaczy, D., Nemec, S. F., Sycha, T., et al. (2015). MR neurography of ulnar nerve entrapment at the cubital tunnel: a diffusion tensor imaging study. Eur. Radiol. 25, 1911–1918. doi: 10.1007/s00330-015-3613-7
Chen, Y., Haacke, E. M., and Li, J. (2019). Peripheral nerve magnetic resonance imaging [version 1; peer review: 2 approved]. F1000Res. 8:1803. doi: 10.12688/f1000research.19695.1
Chhabra, A., Madhuranthakam, A. J., and Andreisek, G. (2018). Magnetic resonance neurography: current perspectives and literature review. Eur. Radiol. 28, 698–707. doi: 10.1007/s00330-017-4976-8
Dietrich, O., Raya, J. G., Reeder, S. B., Reiser, M. F., and Schoenberg, S. O. (2007). Measurement of signal-to-noise ratios in MR images: influence of multichannel coils, parallel imaging, and reconstruction filters. J. Magn. Reson. Imaging 26, 375–385. doi: 10.1002/jmri.20969
Filler, A. G., Kliot, M., Howe, F. A., Hayes, C. E., Saunders, D. E., Goodkin, R., et al. (1996). Application of magnetic resonance neurography in the evaluation of patients with peripheral nerve pathology. J. Neurosurg. 85, 299–309. doi: 10.3171/jns.1996.85.2.0299
Fortanier, E., Ogier, A. C., Delmont, E., Lefebvre, M. N., Viout, P., Guye, M., et al. (2020). Quantitative assessment of sciatic nerve changes in Charcot-Marie-Tooth type 1A patients using magnetic resonance neurography. Eur. J. Neurol. 27, 1382–1389. doi: 10.1111/ene.14303
Godel, T., Pham, M., Kele, H., Kronlage, M., Schwarz, D., Brunee, M., et al. (2019). Diffusion tensor imaging in anterior interosseous nerve syndrome – functional MR Neurography on a fascicular level. Neuroimage Clin. 21:101659. doi: 10.1016/j.nicl.2019.101659
Guggenberger, R., Nanz, D., Bussmann, L., Chhabra, A., Fischer, M. A., Hodler, J., et al. (2013). Diffusion tensor imaging of the median nerve at 3.0 T using different MR scanners: agreement of FA and ADC measurements. Eur. J. Radiol. 82, e590–e596. doi: 10.1016/j.ejrad.2013.05.011
Guggenberger, R., Nanz, D., Puippe, G., Rufibach, K., White, L. M., Sussman, M. S., et al. (2012). Diffusion tensor imaging of the median nerve: intra-, inter-reader agreement, and agreement between two software packages. Skeletal Radiol. 41, 971–980. doi: 10.1007/s00256-011-1310-4
Hagmann, P., Jonasson, L., Maeder, P., Thiran, J. P., Wedeen, V. J., and Meuli, R. (2006). Understanding diffusion MR imaging techniques: from scalar diffusion-weighted imaging to diffusion tensor imaging and beyond. Radiographics 26 (Suppl. 1), S205–S223. doi: 10.1148/rg.26si065510
Heckel, A., Weiler, M., Xia, A., Ruetters, M., Pham, M., Bendszus, M., et al. (2015). Peripheral nerve diffusion tensor imaging: assessment of axon and myelin sheath integrity. PLoS One 10:e0130833. doi: 10.1371/journal.pone.0130833
Ho, M. J., Manoliu, A., Kuhn, F. P., Stieltjes, B., Klarhofer, M., Feiweier, T., et al. (2017). Evaluation of reproducibility of diffusion tensor imaging in the brachial plexus at 3.0 T. Invest. Radiol. 52, 482–487. doi: 10.1097/rli.0000000000000363
Hofstadler, B., Bäumer, P., Schwarz, D., Kronlage, M., Heiland, S., Bendszus, M., et al. (2019). MR neurography: normative values in correlation to demographic determinants in children and adolescents. Clin. Neuroradiol. 30, 671–677. doi: 10.1007/s00062-019-00834-9
Jende, J. M. E., Kender, Z., Mooshage, C., Groener, J. B., Alvarez-Ramos, L., Kollmer, J., et al. (2021). Diffusion tensor imaging of the sciatic nerve as a surrogate marker for nerve functionality of the upper and lower limb in patients with diabetes and prediabetes. Front. Neurosci. 15:642589. doi: 10.3389/fnins.2021.642589
Kim, H. S., Yoon, Y. C., Choi, B. O., Jin, W., Cha, J. G., and Kim, J. H. (2019). Diffusion tensor imaging of the sciatic nerve in Charcot-Marie-Tooth disease type I patients: a prospective case-control study. Eur. Radiol. 29, 3241–3252. doi: 10.1007/s00330-018-5958-1
Kollmer, J., Hund, E., Hornung, B., Hegenbart, U., Schonland, S. O., Kimmich, C., et al. (2015). In vivo detection of nerve injury in familial amyloid polyneuropathy by magnetic resonance neurography. Brain 138(Pt 3), 549–562. doi: 10.1093/brain/awu344
Kollmer, J., Weiler, M., Purrucker, J., Heiland, S., Schonland, S. O., Hund, E., et al. (2018). MR neurography biomarkers to characterize peripheral neuropathy in AL amyloidosis. Neurology 91, e625–e634. doi: 10.1212/wnl.0000000000006002
Koo, T. K., and Li, M. Y. (2016). A guideline of selecting and reporting intraclass correlation coefficients for reliability research. J. Chiropr. Med. 15, 155–163. doi: 10.1016/j.jcm.2016.02.012
Kronlage, M., Baumer, P., Pitarokoili, K., Schwarz, D., Schwehr, V., Godel, T., et al. (2017a). Large coverage MR neurography in CIDP: diagnostic accuracy and electrophysiological correlation. J. Neurol. 264, 1434–1443. doi: 10.1007/s00415-017-8543-7
Kronlage, M., Pitarokoili, K., Schwarz, D., Godel, T., Heiland, S., Yoon, M. S., et al. (2017b). Diffusion tensor imaging in chronic inflammatory demyelinating polyneuropathy: diagnostic accuracy and correlation with electrophysiology. Invest. Radiol. 52, 701–707. doi: 10.1097/rli.0000000000000394
Kronlage, M., Schwehr, V., Schwarz, D., Godel, T., Heiland, S., Bendszus, M., et al. (2019b). Magnetic resonance neurography : normal values and demographic determinants of nerve caliber and T2 relaxometry in 60 healthy individuals. Clin. Neuroradiol. 29, 19–26. doi: 10.1007/s00062-017-0633-5
Kronlage, M., Knop, K. C., Schwarz, D., Godel, T., Heiland, S., Bendszus, M., et al. (2019a). Amyotrophic lateral sclerosis versus multifocal motor neuropathy: utility of mr neurography. Radiology 292, 149–156. doi: 10.1148/radiol.2019182538
Lee, K. M., Lee, J., Chung, C. Y., Ahn, S., Sung, K. H., Kim, T. W., et al. (2012). Pitfalls and important issues in testing reliability using intraclass correlation coefficients in orthopaedic research. Clin. Orthop. Surg. 4, 149–155. doi: 10.4055/cios.2012.4.2.149
Lichtenstein, T., Sprenger, A., Weiss, K., Slebocki, K., Cervantes, B., Karampinos, D., et al. (2018). MRI biomarkers of proximal nerve injury in CIDP. Ann. Clin. Transl. Neurol. 5, 19–28. doi: 10.1002/acn3.502
MacKay, A., Whittall, K., Adler, J., Li, D., Paty, D., and Graeb, D. (1994). In vivo visualization of myelin water in brain by magnetic resonance. Magn. Reson. Med. 31, 673–677. doi: 10.1002/mrm.1910310614
Markvardsen, L. H., Vaeggemose, M., Ringgaard, S., and Andersen, H. (2016). Diffusion tensor imaging can be used to detect lesions in peripheral nerves in patients with chronic inflammatory demyelinating polyneuropathy treated with subcutaneous immunoglobulin. Neuroradiology 58, 745–752. doi: 10.1007/s00234-016-1692-z
Mathys, C., Aissa, J., Meyer Zu Horste, G., Reichelt, D. C., Antoch, G., Turowski, B., et al. (2013). Peripheral neuropathy: assessment of proximal nerve integrity by diffusion tensor imaging. Muscle Nerve 48, 889–896. doi: 10.1002/mus.23855
Milford, D., Rosbach, N., Bendszus, M., and Heiland, S. (2015). Mono-exponential fitting in T2-relaxometry: relevance of offset and first echo. PLoS One 10:e0145255. doi: 10.1371/journal.pone.0145255
Mori, S., and Zhang, J. (2006). Principles of diffusion tensor imaging and its applications to basic neuroscience research. Neuron 51, 527–539. doi: 10.1016/j.neuron.2006.08.012
Pham, M., Bäumer, P., Meinck, H. M., Schiefer, J., Weiler, M., Bendszus, M., et al. (2014). Anterior interosseous nerve syndrome: fascicular motor lesions of median nerve trunk. Neurology 82, 598–606. doi: 10.1212/wnl.0000000000000128
Popovic, Z. B., and Thomas, J. D. (2017). Assessing observer variability: a user’s guide. Cardiovasc. Diagn. Ther. 7, 317–324. doi: 10.21037/cdt.2017.03.12
Preisner, F., Bäumer, P., Wehrstein, M., Friedmann-Bette, B., Hackbusch, M., Heiland, S., et al. (2019). Peripheral nerve diffusion tensor imaging : interreader and test-retest reliability as quantified by the standard error of measurement. Clin. Neuroradiol. 30, 679–689. doi: 10.1007/s00062-019-00859-0
Preisner, F., Behnisch, R., Foesleitner, O., Schwarz, D., Wehrstein, M., Meredig, H., et al. (2021). Reliability and reproducibility of sciatic nerve magnetization transfer imaging and T2 relaxometry. Eur. Radiol. 31, 9120–9130. doi: 10.1007/s00330-021-08072-9
Shrout, P. E., and Fleiss, J. L. (1979). Intraclass correlations: uses in assessing rater reliability. Psychol. Bull. 86, 420–428. doi: 10.1037//0033-2909.86.2.420
Simon, N. G., Lagopoulos, J., Paling, S., Pfluger, C., Park, S. B., Howells, J., et al. (2017). Peripheral nerve diffusion tensor imaging as a measure of disease progression in ALS. J. Neurol. 264, 882–890. doi: 10.1007/s00415-017-8443-x
Stratford, P. W., and Goldsmith, C. H. (1997). Use of the standard error as a reliability index of interest: an applied example using elbow flexor strength data. Phys. Ther. 77, 745–750. doi: 10.1093/ptj/77.7.745
Tagliafico, A., Calabrese, M., Puntoni, M., Pace, D., Baio, G., Neumaier, C. E., et al. (2011). Brachial plexus MR imaging: accuracy and reproducibility of DTI-derived measurements and fibre tractography at 3.0-T. Eur. Radiol. 21, 1764–1771. doi: 10.1007/s00330-011-2100-z
Thawait, S. K., Chaudhry, V., Thawait, G. K., Wang, K. C., Belzberg, A., Carrino, J. A., et al. (2011). High-resolution MR neurography of diffuse peripheral nerve lesions. AJNR Am. J. Neuroradiol. 32, 1365–1372. doi: 10.3174/ajnr.A2257
Tofts, P. S. (2003). “Proton density of tissue water,” in Quantitative MRI of the Brain: Measuring Changes Caused by Disease, ed. P. S. Tofts (Hoboken, NJ: Wiley and Sons Ltd), 83–108.
Tofts, P. S., and du Boulay, E. P. (1990). Towards quantitative measurements of relaxation times and other parameters in the brain. Neuroradiology 32, 407–415. doi: 10.1007/bf00588474
Vaeggemose, M., Pham, M., Ringgaard, S., Tankisi, H., Ejskjaer, N., Heiland, S., et al. (2017a). Magnetic resonance neurography visualizes abnormalities in sciatic and tibial nerves in patients with type 1 diabetes and neuropathy. Diabetes 66, 1779–1788. doi: 10.2337/db16-1049
Keywords: magnetic resonance imaging, peripheral nervous system, magnetic resonance neurography, biomarkers, reproducibility of results
Citation: Preisner F, Behnisch R, Schwehr V, Godel T, Schwarz D, Foesleitner O, Bäumer P, Heiland S, Bendszus M and Kronlage M (2022) Quantitative MR-Neurography at 3.0T: Inter-Scanner Reproducibility. Front. Neurosci. 16:817316. doi: 10.3389/fnins.2022.817316
Received: 17 November 2021; Accepted: 25 January 2022;
Published: 16 February 2022.
Edited by:
Matthew Craig Evans, Imperial College London, United KingdomReviewed by:
Jingyun Chen, NYU Grossman School of Medicine, United StatesArvin Arani, Mayo Clinic, United States
Copyright © 2022 Preisner, Behnisch, Schwehr, Godel, Schwarz, Foesleitner, Bäumer, Heiland, Bendszus and Kronlage. This is an open-access article distributed under the terms of the Creative Commons Attribution License (CC BY). The use, distribution or reproduction in other forums is permitted, provided the original author(s) and the copyright owner(s) are credited and that the original publication in this journal is cited, in accordance with accepted academic practice. No use, distribution or reproduction is permitted which does not comply with these terms.
*Correspondence: Moritz Kronlage, TW9yaXR6Lktyb25sYWdlQG1lZC51bmktaGVpZGVsYmVyZy5kZQ==