
95% of researchers rate our articles as excellent or good
Learn more about the work of our research integrity team to safeguard the quality of each article we publish.
Find out more
ORIGINAL RESEARCH article
Front. Neurosci. , 11 January 2023
Sec. Neural Technology
Volume 16 - 2022 | https://doi.org/10.3389/fnins.2022.1105376
This article is part of the Research Topic Imaging of Neurometabolism View all 8 articles
 Huiting Liao1†
 Zimeng Cai2,3†Haiqi Ye1,4
 QianLan Chen1,5
 Yan Zhang1
 Mehran Shaghaghi6
 Sarah E. Lutz7
 Weiwei Chen1*
 Kejia Cai6
Background: Conventional gadolinium (Gd)-enhanced MRI is currently used for stratifying the lesion activity of multiple sclerosis (MS) despite limited correlation with disability and disease activity. The stratification of MS lesion activity needs further improvement to better support clinics.
Purpose: To investigate if the novel proton exchange rate (kex) MRI combined with quantitative susceptibility mapping (QSM) may help to further stratify non-enhanced (Gd-negative) MS lesions.
Materials and methods: From December 2017 to December 2020, clinically diagnosed relapsing-remitting MS patients who underwent MRI were consecutively enrolled in this IRB-approved retrospective study. The customized MRI protocol covered conventional T2-weighted, T2-fluid-attenuated-inversion-recovery, pre- and post-contrast T1-weighted imaging, and quantitative sequences, including kex MRI based on direct-saturation removed omega plots and QSM. Each MS lesion was evaluated based on its Gd-enhancement as well as its susceptibility and kex elevation compared to the normal appearing white matter. The difference and correlation concerning lesion characteristics and imaging contrasts were analyzed using the Mann–Whitney U test or Kruskal–Wallis test, and Spearman rank analysis with p < 0.05 considered significant.
Results: A total of 322 MS lesions from 30 patients were identified with 153 Gd-enhanced and 169 non-enhanced lesions. We found that the kex elevation of all lesions significantly correlated with their susceptibility elevation (r = 0.30, p < 0.001). Within the 153 MS lesions with Gd-enhancement, ring-enhanced lesions showed higher kex elevation than the nodular-enhanced ones’ (p < 0.001). Similarly, lesions with ring-hyperintensity in QSM also had higher kex elevation than the lesions with nodular-QSM-hyperintensity (p < 0.001). Of the 169 Gd-negative lesions, three radiological patterns were recognized according to lesion manifestations on the kex map and QSM images: Pattern I (kex+ and QSM+, n = 114, 67.5%), Pattern II (only kex+ or QSM+, n = 47, 27.8%) and Pattern III (kex– and QSM–, n = 8, 4.7%). Compared to Pattern II and III, Pattern I had higher kex (p < 0.001) and susceptibility (p < 0.05) elevation. The percentage of Pattern I of each subject was negatively correlated with the disease duration (r = –0.45, p = 0.015).
Conclusion: As a potential imaging biomarker for inflammation due to oxidative stress, in vivo kex MRI combined with QSM is promising in extending the clinical classification of MS lesions beyond conventional Gd-enhanced MRI.
Multiple sclerosis (MS) is a chronic inflammatory demyelinating and neurodegenerative disorder of the central nervous system. Ongoing inflammation causes neuronal damage in MS patients (Kotelnikova et al., 2017). Clinical, radiological, and histological classification systems have been proposed (Pitt et al., 2022). Histological evidence of inflammation is incorporated to categorize lesions into early active, late active, smoldering, inactive, and shadow plaques (Frischer et al., 2015). Refinement of these classification systems to incorporate recently developed radiologic techniques for non-invasive evidence of inflammation may further guide clinical management and elucidation of disease pathogenesis.
To date, a commonly recognized classification in the clinic is to differentiate active (acute) from inactive lesions. Introducing gadolinium (Gd)-based contrast agents, Gd contrast-enhanced MRI can identify acute MS lesions (Tourdias et al., 2012), because the inflammatory infiltration led by lymphocytes and microglia can affect blood-brain-barrier (BBB) functions, allowing extravasation of gadolinium-based contrast agents (Lassmann et al., 2007). However, the gadolinium enhancement of acute lesions usually only lasts for weeks (Mahad et al., 2015). There is evidence suggesting that the gadolinium-enhanced lesions would turn into non-gadolinium-enhanced lesions even with inflammation continuously proceeding (Maggi et al., 2014). Moreover, the potential risk of Gd accumulation requires clinicians to make judicious use of this imaging method (Wattjes et al., 2021). Clinical practitioners may be able to make more personalized treatments and monitor the therapeutic efficacy of treatment by reconsidering the interpretation of lesion activity, especially for Gd non-enhanced (Gd-negative) lesions.
There has been a significant amount of research dedicated to the recognition of smoldering lesions or detecting inflammatory changes in MS lesions. Quantitative susceptibility mapping (QSM) could reflect iron deposition when the relative lesion susceptibility value is above zero (Wisnieff et al., 2015). The susceptibility of MS lesions increases significantly when gadolinium-enhanced lesions evolve into non-gadolinium-enhanced lesions (Zhang et al., 2016b). In addition to iron, reactive oxygen species (ROS) are also reported to be key elements of inflammation (Dunham et al., 2017). The proton exchange rate (kex) MRI approach (Shaghaghi et al., 2019), derived from chemical exchange saturation transfer (CEST) imaging, has recently been proposed as a non-invasive approach to assess tissue oxidative stress since endogenous ROS have been shown to promote in vivo kex in tissue (Tain et al., 2019; Shaghaghi and Cai, 2022). Our team has previously conducted a preliminary study on kex MRI showing its potential to further characterize Gd-negative MS lesions (Ye et al., 2020). However, the contrast mechanism of kex-enhanced MRI as a surrogate biomarker for ROS has not been fully validated. Given that iron deposition catalyzes Fenton reaction that produces hydroxyl ROS (Tain et al., 2019), the correlation between QSM and kex MRI may help to validate kex MRI as an emerging inflammatory imaging contrast for MS stratification.
In the present study, we will compare kex MRI with the relatively well-established QSM in all MS lesions and investigate if the combination of kex MRI and QSM helps to stratify Gd-negative MS lesions based on lesion inflammatory activity.
From December 2017 to December 2020, patients with relapsing-remitting MS in our institution who underwent MRI were consecutively included in the following institutional review board-approved retrospective study. All patients were clinically diagnosed according to the 2017 revision of the McDonald criteria (Thompson et al., 2018a). Cases with large motion artifacts were excluded. Relevant clinical information including major symptoms and Kurtzke Expanded Disability Status Scale (EDSS) scores was recorded. The onset date was also recorded according to the patients’ questionnaire. The disease duration of each patient was estimated from the onset date to the day of receiving the MRI.
All MRI exams were performed on a 3T GE MR750 unit (GE Healthcare, Milwaukee, WI) with a 32-channel head coil using a customized MRI protocol, including T2-weighted imaging, T2 fluid-attenuated inversion recovery (T2-FLAIR) imaging, T2*-weighted angiography for the QSM (Chen et al., 2014), CEST sequences for the kex MRI (Shaghaghi et al., 2019), and pre- and post-contrast T1-weighted imaging. All sequences within the protocols were performed with matched slice positioning to allow lesion comparison between different MRI sequences. Post-contrast T1-weighted imaging scans started 5 min after contrast agent administration (gadopentetate dimeglumine, Magnevist, Bayer, Berlin, Germany, 0.1 mmol/kg, IV).
The kex MRI protocol comprised three CEST Z-spectral data acquired with different saturation powers (B1) at 2, 3, and 4 μT and a saturation duration of 1.5 s, followed by a single-shot fast low angle shot readout. The total acquisition time of the three Z-spectra used for constructing omega plots was 9.9 min. At each saturation B1, a total of 33 frequency offsets were obtained, including +39.1 ppm, +15.6 ppm, ±6 ppm, ±5 ppm, ±4.5 ppm, and frequencies ranging from –4 to +4 ppm with an increment of 0.25 ppm. CEST Z-spectral data were all acquired from a single slice covering most MS lesions as delineated by the T2-FLAIR images. The target slice of each patient was decided by the same neuroradiologist (Q.C., 4 years of experience in neuroradiology). The detailed parameters of each sequence are summarized in Table 1.

Table 1. Detailed parameters of each sequence.
Quantitative susceptibility mapping was reconstructed based on the morphology enabled dipole inversion (MEDI) algorithm using in-house software implemented in C++ (Liu et al., 2012). The reconstruction was automatic without any user intervention. All acquired Z-spectral data were analyzed with the direct-saturation removed omega plot method (Shaghaghi et al., 2019) using MATLAB (MathWorks, Natick, MA, USA) with custom-written scripts. Equations were generated to reflect multiple exchange mechanisms, including NOE, MT, and CEST, that contribute to the saturation transfer signal (Shaghaghi et al., 2019). The reference image (39.1 ppm) from each CEST sequence was registered to that of B1 = 3 μT sequence and each image within each CEST sequence was registered to its previous adjacent image. Z-spectra were normalized, flipped and fitted to two Lorentzian functions corresponding to the bulk water (centered around 0 ppm) and to a sum of the remaining effects (centered around 1.5 ppm). The frequency offset relative to water resonance, the center frequency offset, the amplitude, and the line-width of each peak were considered in the fitting function. After the fitting, the bulk water peak-the dominant component-was subtracted from the raw Z-spectra and the B0-corrected residual signals at +3.5 ppm were used for further omega plot analysis. Tissue kex is a weighted average of multiple exchange mechanisms. With the kex quantified for every voxel, kex maps were reconstructed.
Lesions with T2 hyperintensities (at least 3 mm on the long axis) were considered MS lesions in this study (Filippi et al., 2016). White matter regions without an abnormal signal were regarded as normal-appearing white matter (NAWM). Three neuroradiologists (H.L., Q.C., W.C., with 2, 4, and 20 years of experience in neuroradiology, respectively) independently reviewed all MRI images. The three observers assessed all MS lesions according to the presence of Gd enhancement, QSM hyperintensity, and kex elevation, as well as the lesion shape (nodular or ring) of Gd enhancement and QSM hyperintensity.
On post-contrast images, MS lesions were identified as enhanced (Gd-positive, Gd+) or non-enhanced (Gd-negative, Gd–). The Gd+ lesions were further classified as nodular-enhanced or ring-enhanced based on their shape. Lesions without QSM hyperintensity were considered QSM negative (QSM–), while lesions with QSM hyperintensity (QSM+) were also further categorized as nodular-QSM-hyperintense or ring-QSM-hyperintense (hyperintensity at the edge of the lesion). On the kex maps, we classified lesions into two groups: one without kex elevation (kex–) and another with kex elevation (kex+) relative to its adjacent or contralateral NAWM area. No further classification was performed based on the shape of the kex+ lesion, as the kex elevation within each lesion was relatively uniform. Interobserver agreement for lesion classification was assessed and any difference was discussed, and a consensus was reached for further quantitative analyses.
The kex elevation (Δkex) or susceptibility elevation (ΔSusceptibility) of a lesion was defined as the difference of kex or susceptibility value between the lesion and its contralateral or adjacent NAWM area. The ROIs of kex and susceptibility were drawn using an in-house ROI tool of ITK-SNAP software (v4.0.0, Yushkevich et al., 2006) by two neuroradiologists (H.L. and Q.C.) independently. Taking T2-FLAIR and T2-weighted images as a reference, the lesion ROIs were drawn on the kex map and QSM images by hand, outlining the boundaries of each identified MS lesion. For inconspicuous lesions on the kex map or QSM images, the ROIs were first manually drawn on T2-FLAIR images (or T2-weighted images when they showed clear lesion boundaries) and then overlaid onto the kex map and QSM images. All veins or artifacts within lesions on QSM were also removed by hand. The ROIs of NAWM (rectangle, 4 mm2) were also placed on the mirror-symmetric area (or the adjacent NAWM of MS lesions if the mirror-symmetric area happened to be another lesion) as an internal reference. Interobserver agreement analysis was performed and the mean results of the two observers were used for further analyses.
Statistical analyses were performed by GraphPad Prism (v9.4.1) and SPSS (v26.0, IBM). Continuous variables were presented as mean ± standard deviation, while categorical results were presented as fractions or percentages. Interobserver agreement between radiologists was measured by Fleiss’ Kappa statistic (for the presence and shape of the lesion) or the intraclass correlation coefficient (for lesion measurement). The Kolmogorov–Smirnov test was used to determine the normality of the data. The comparison of lesion kex elevation or susceptibility elevation in subgroups was analyzed via the two-tailed Student’s t-test and one-way ANOVA (Gaussian distribution) or Mann–Whitney U test and Kruskal–Wallis test (non-Gaussian distribution). The Spearman rank analysis were used to explore differences and correlations concerning lesion characteristics in different images. The statistical significance level, p, was set at 0.05.
From December 2017 to December 2020, 34 patients with relapsing-remitting MS were identified and a total of 48 MRI exams were retrieved from the institutional database as 6 of the 34 patients had one or more follow-up scans. Seven MRI exams from four patients were excluded for the failure of image reconstruction caused by motion artifacts. Ultimately, 30 patients and a total of 41 MRI examinations were included in the analysis, including data from five patients who had one or more follow-up exams. There were 21 women and 9 men. Their age ranged from 18 to 54 (mean ± SD = 31.30 ± 9.73) years old. The mean disease duration was 3.86 ± 4.77 years (ranging from 0.05 to 20 years), with a median expanded disability status scale of 2.0 (ranging from 1.0 to 8.5). Demographic and clinical information with details are given in Supplementary Table 1.
There was high agreement among observers in the assessment of the lesion presence, the lesion shape (Fleiss’ Kappa coefficient > 0.800 for both), and the quantitative measurement (intraclass correlation coefficient > 0.800) (Supplementary Table 2). A total of 322 MS lesions were identified. The number of lesions with kex elevation (n = 261) or with QSM hyperintensity (n = 282) was larger than that with Gd-enhancement (n = 153). The kex elevation of MS lesions were positively and significantly correlated with the lesions’ susceptibilities elevation (r = 0.30, p < 0.001, Figure 1). Note that a few lesions that showed negative Δkex in Figure 1 were highly necrotic as confirmed with T2-weighted and T2-FLAIR imaging.
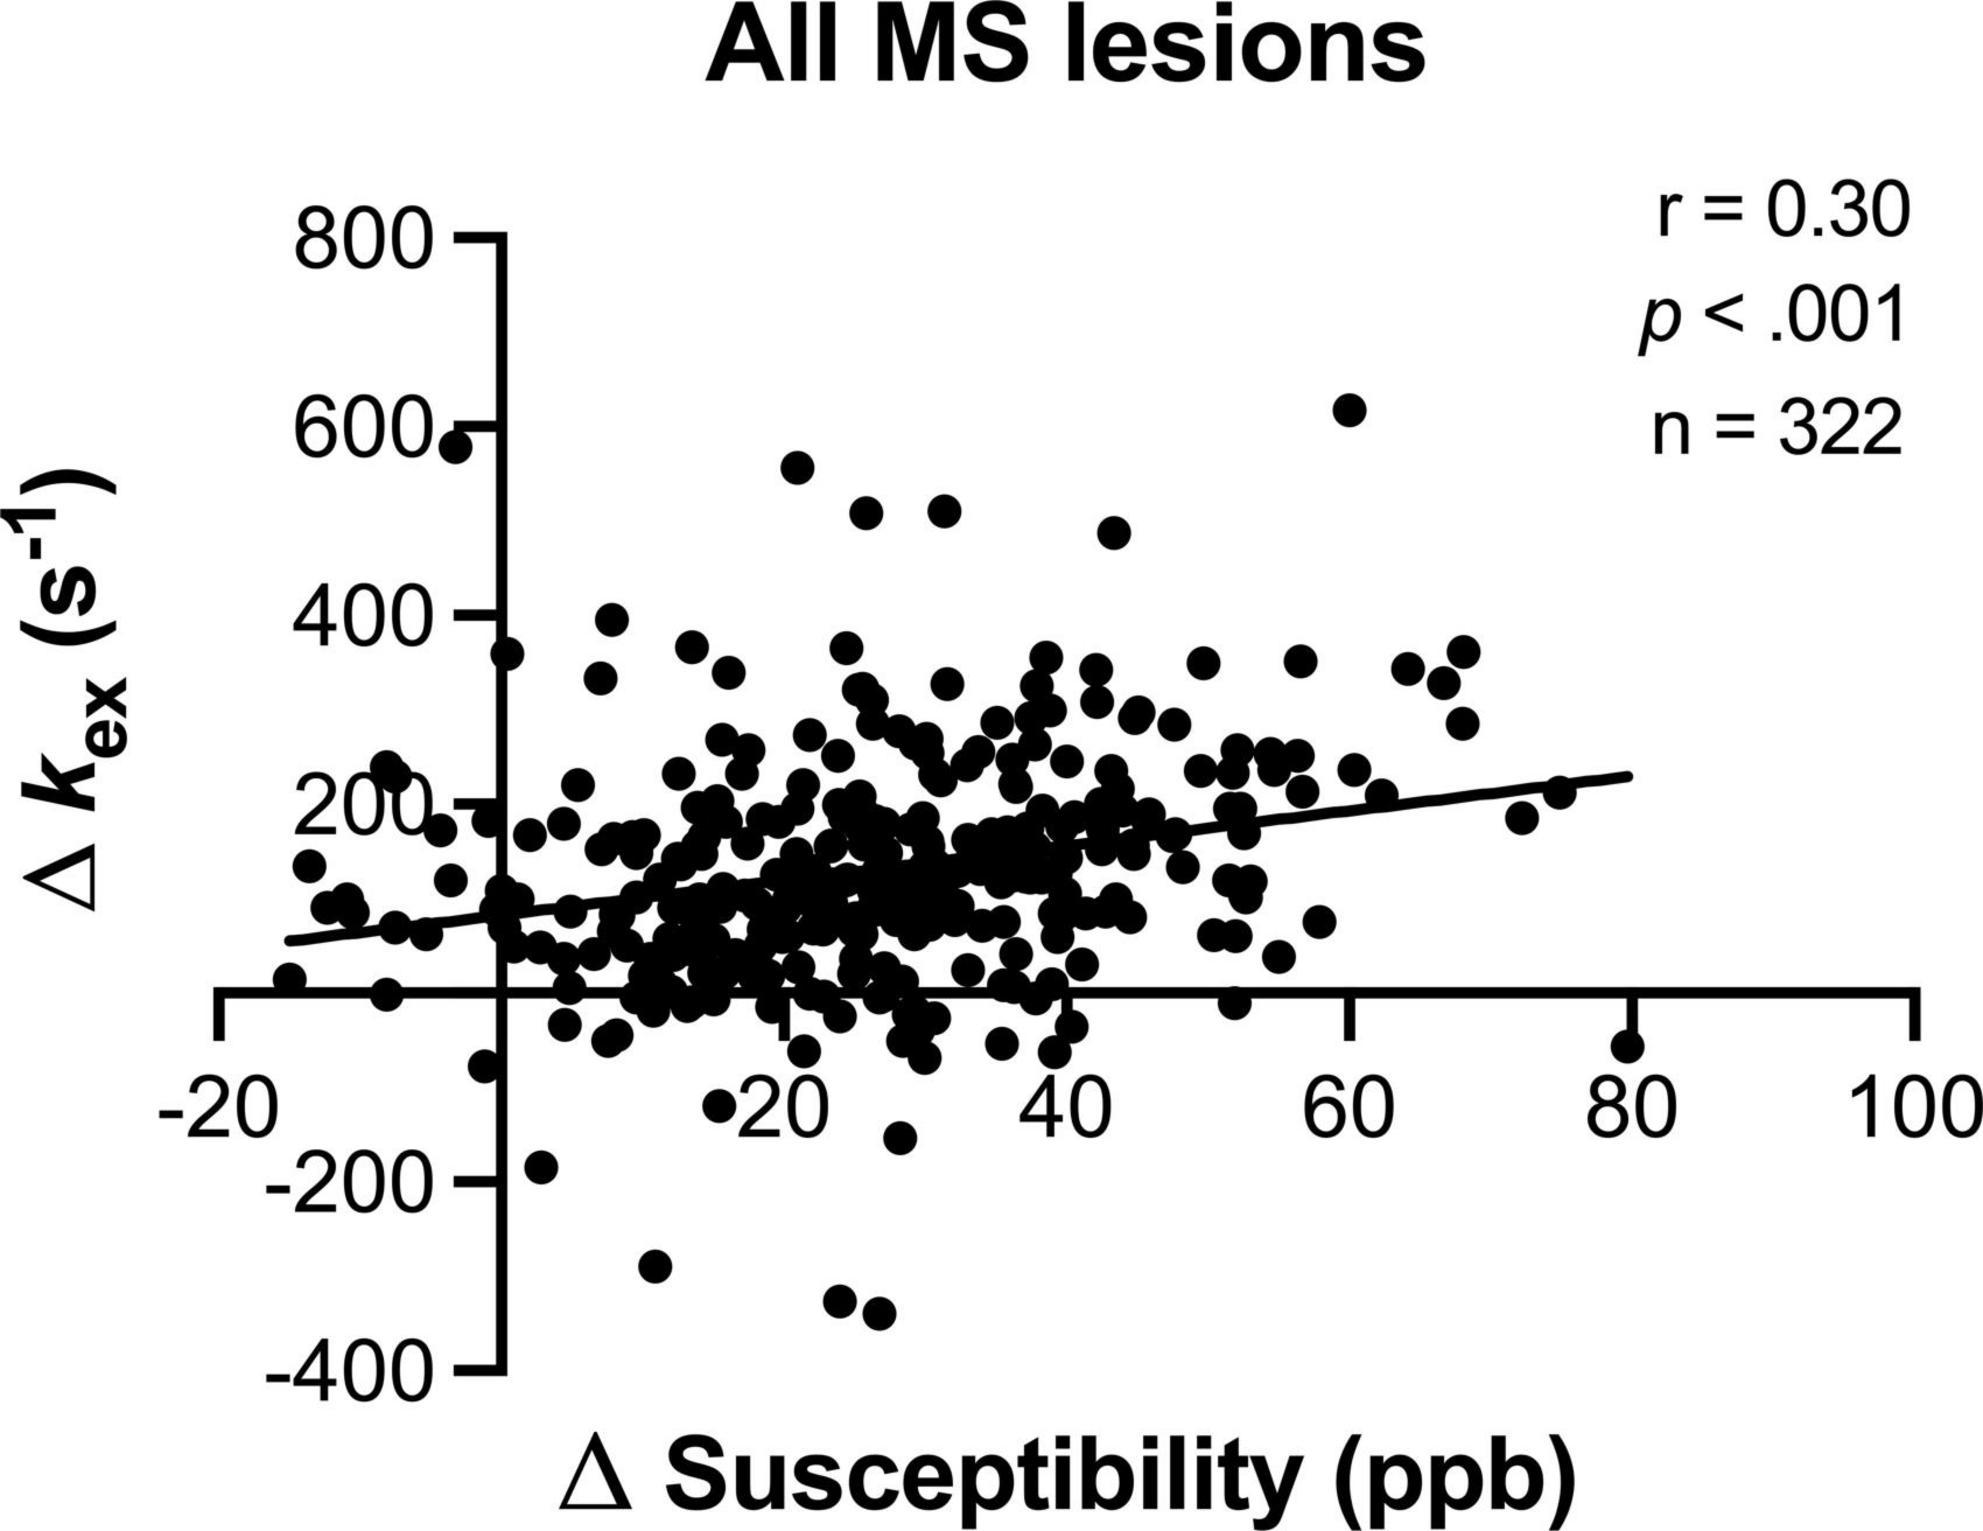
Figure 1. The lesion kex elevation increased with susceptibility elevation. Note that a few lesions that showed negative Δkex were highly necrotic as confirmed with T2-weighted and T2-FLAIR imaging.
In total, 153 MS lesions were Gd+. These Gd+ lesions showed two types of enhancement: ring-enhanced (61/153, 39.9%) and nodular-enhanced (92/153, 60.1%). The ring-enhanced ones presented higher kex elevation than the nodular-enhanced ones (225.0 ± 119.2 s–1 vs. 95.7 ± 104.8 s–1, p < 0.001, Figure 2A). On QSM, 89.5% (137/153) of the Gd+ lesions showed hyperintensity with two different shapes: nodular and ring-like. The lesions with ring-like QSM hyperintensity presented higher kex elevation than those with nodular QSM hyperintensity (209.7 ± 169.6 s–1 vs. 124.5 ± 105.6 s–1, p < 0.001, Figure 2B).
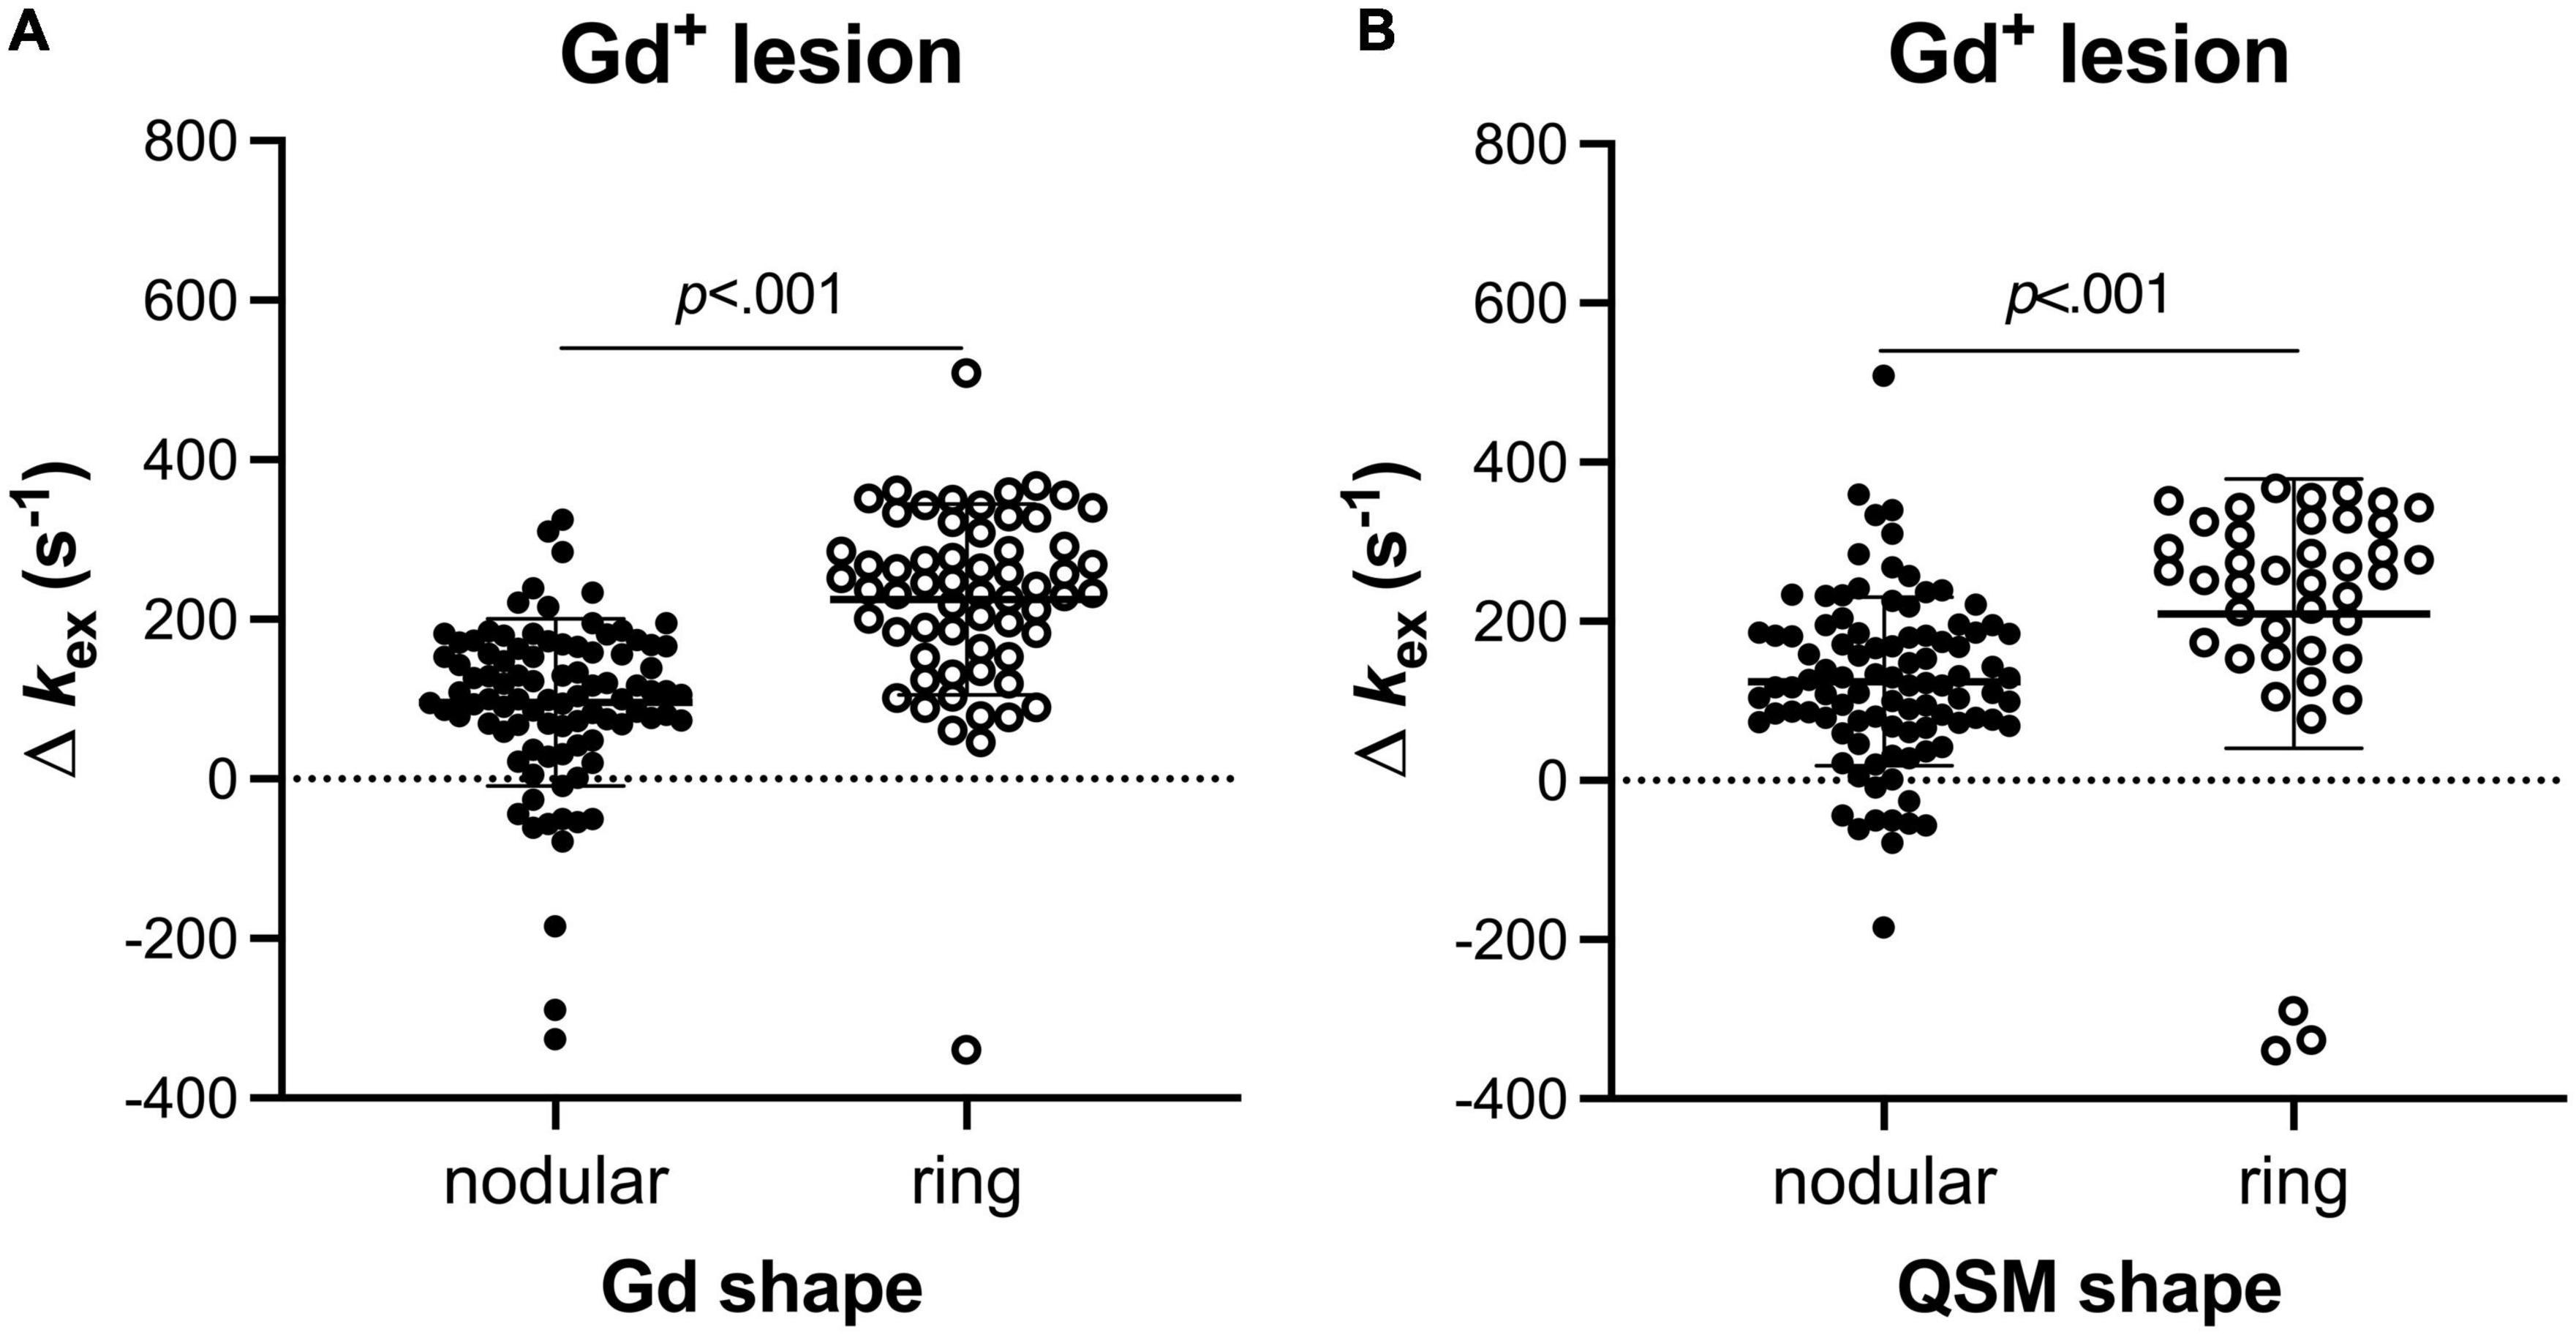
Figure 2. Different Gd+ MS lesions showed different levels of kex values (Mann–Whitney U test). Lesions with ring Gd-enhancement presented higher kex elevation than those with nodular Gd-enhancements (A). For the lesions being both positive on post-contrast T1 imaging and QSM, the ones with ring QSM hyperintensity presented higher kex elevation than those with nodular QSM hyperintensity (B).
52.5% (169/322) of MS lesions did not exhibit Gd enhancement. 76.9% (130/169) of Gd– lesions showed kex elevation on the kex map and 85.7% (145/169) of Gd– lesions showed hyperintensity on QSM. Of all Gd– lesions, three radiological patterns covering four subtypes of MS lesions were recognized according to the lesion manifestation on the kex map and QSM images (Figures 3, 4).
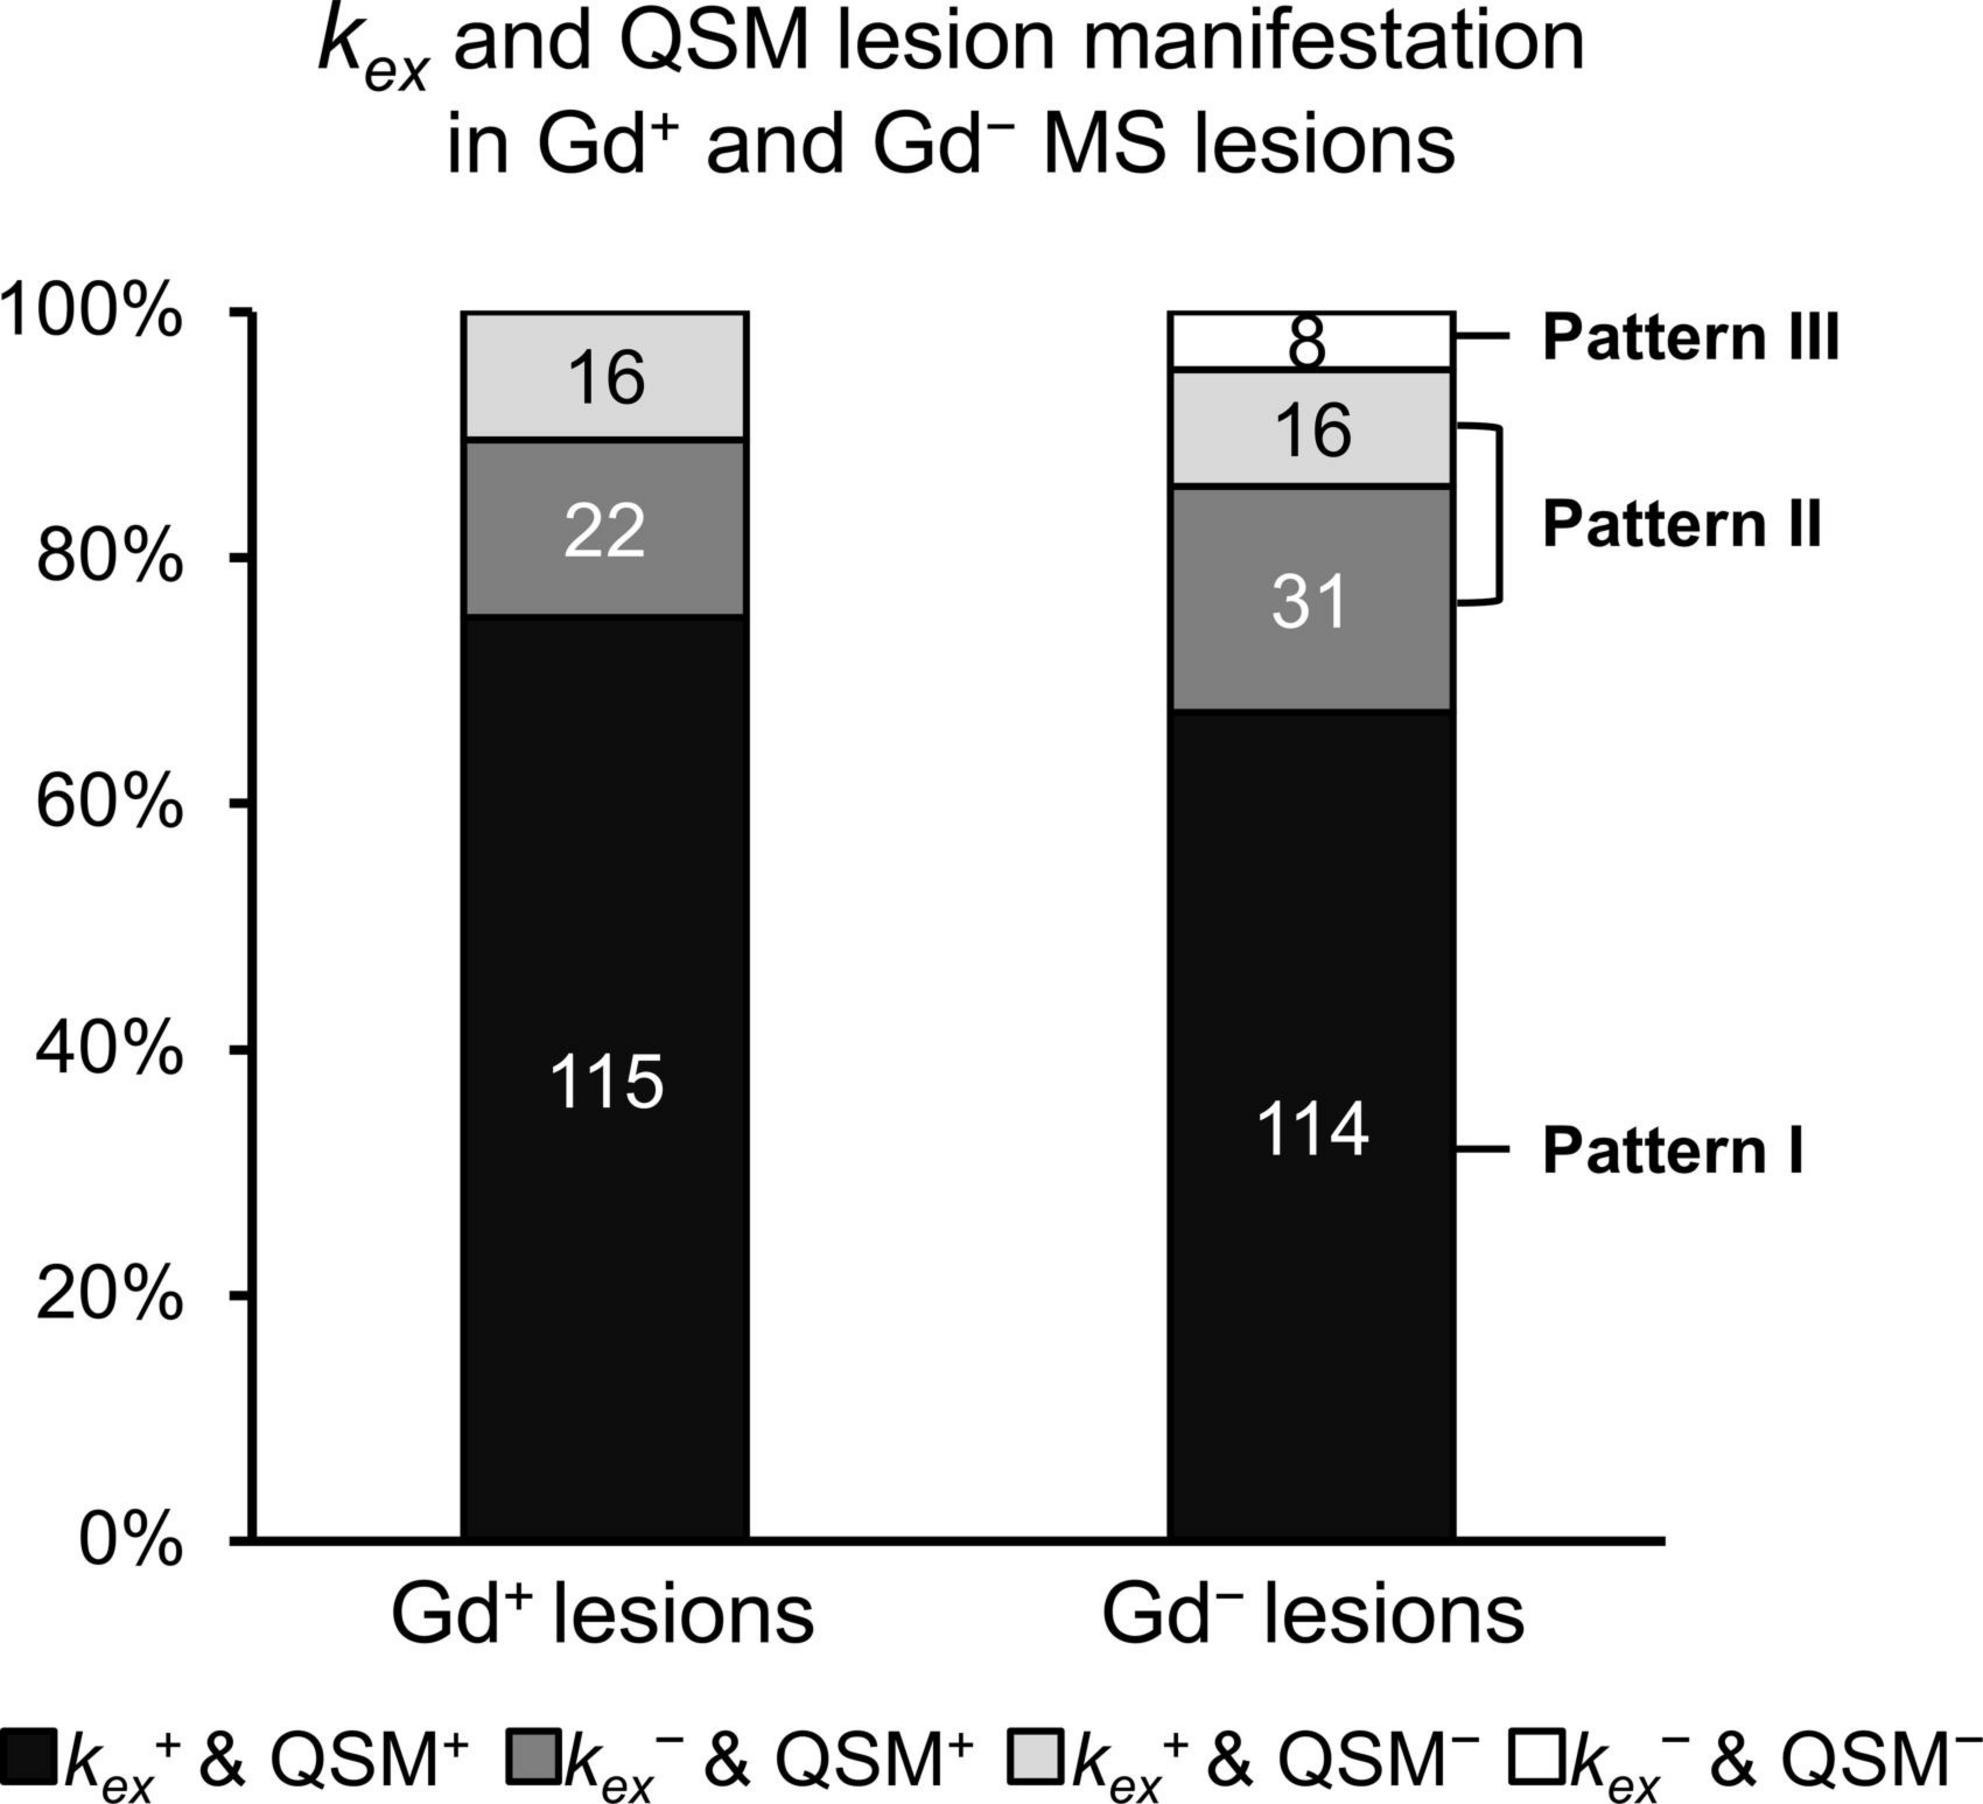
Figure 3. Extended classification of Gd– lesions. Gd– lesions were categorized into Pattern I (which are kex+ and QSM+); Pattern II (which are either kex+ and QSM–, or kex– and QSM+); and Pattern III (which are kex– and QSM–) according to lesion manifestation on the kex map and QSM images. All Gd+ lesions were considered as one category despite the inconsistent lesion manifestation on the kex map and QSM images.
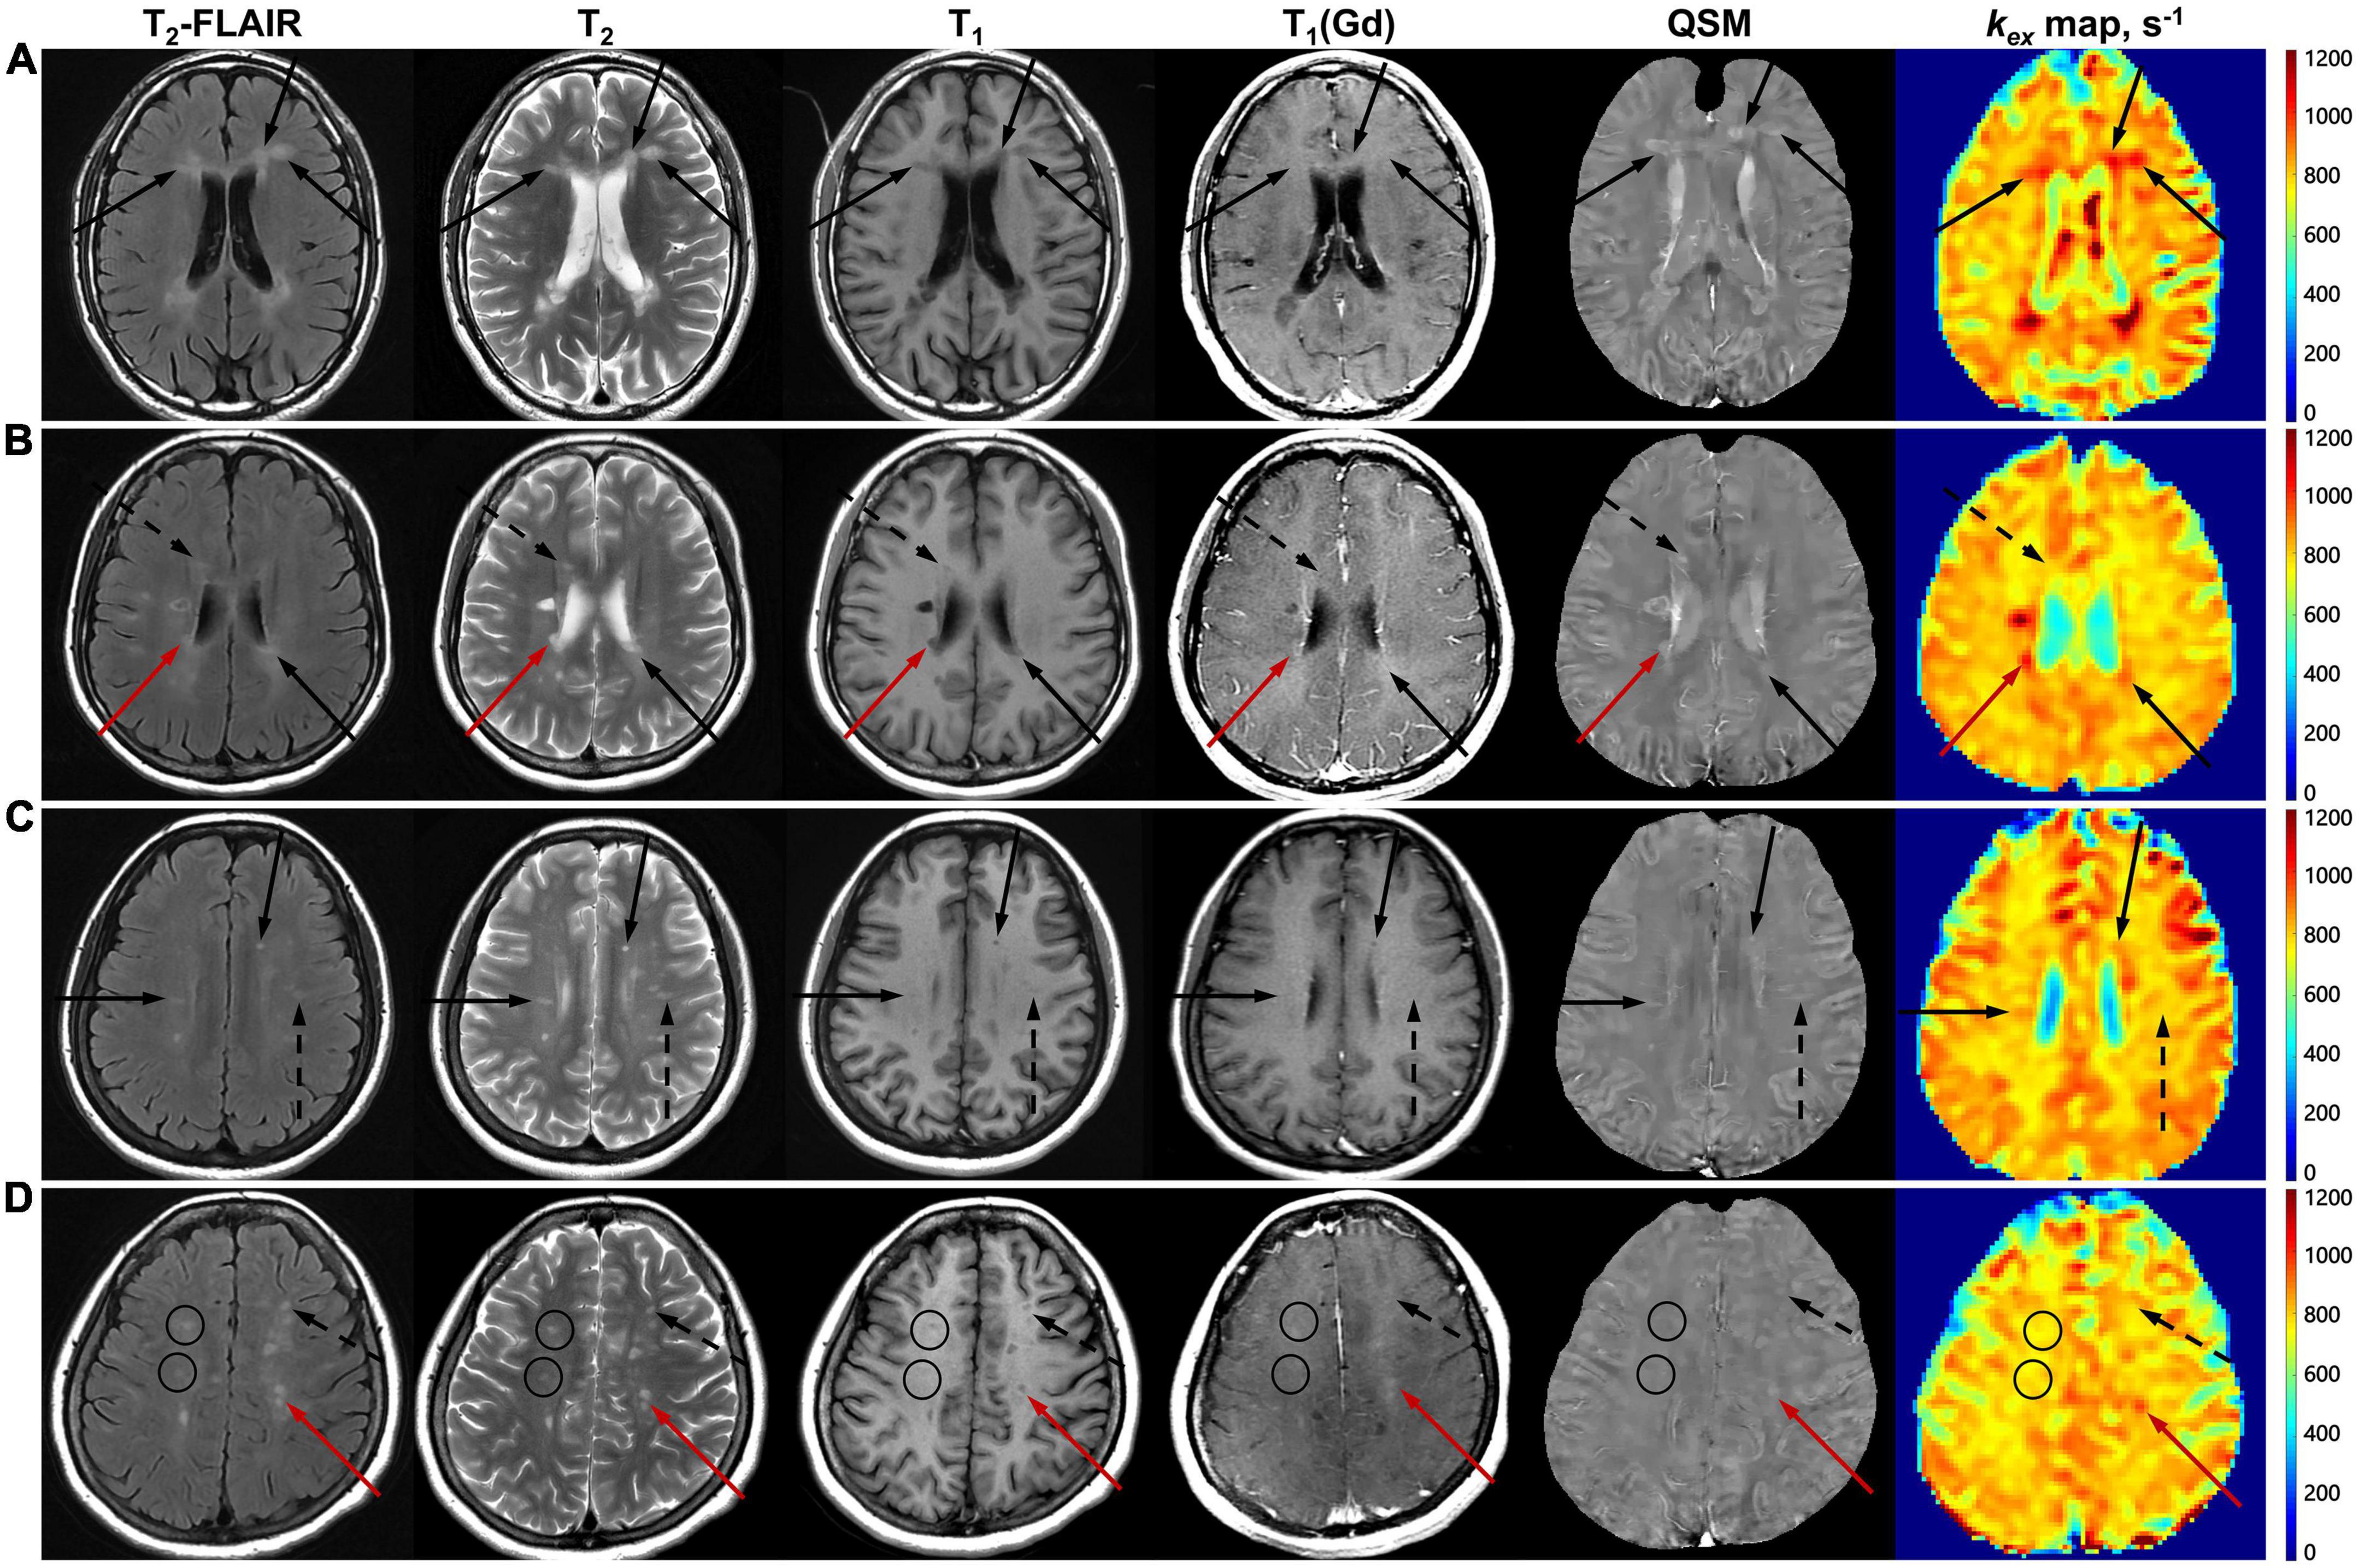
Figure 4. Gd+ lesions and the three patterns of Gd– lesions on multimodal MRI. Images are from Patient No. 20 (A), No. 13 (B), No. 11 (C), and No. 27 (D), whose disease duration was 0.5, 1, 2, and 8 years, respectively. Gd+ lesions are indicated with red arrows (B,D). Pattern I of Gd– lesions, which are kex+ and QSM+, are indicated with black arrows (A–C). Pattern II of Gd– lesions, which are either kex+ and QSM–, or kex– and QSM+, are indicated with black dashed arrows (B–D). Pattern III of Gd– lesions, which are kex– and QSM–, are indicated with black circles (D).
Pattern I (kex+ and QSM+, n = 114) took up the largest proportion of all Gd– lesions, while Pattern III (kex– and QSM–, n = 8) took up the smallest. Pattern II (only kex+ or QSM+, n = 47) was composed of two subtypes: Pattern IIa (kex+ and QSM–, n = 16) and Pattern IIb (kex– and QSM+, n = 31) (Figure 3). The percentage of lesions of each pattern varied among cases (Figure 5). The percentage of Pattern I lesions in each patient was negatively correlated with disease duration (r = –0.45, p = 0.015, Figure 5A), while the percentage of Pattern II lesions was positively correlated with disease duration (r = 0.38, p = 0.046, Figure 5B).
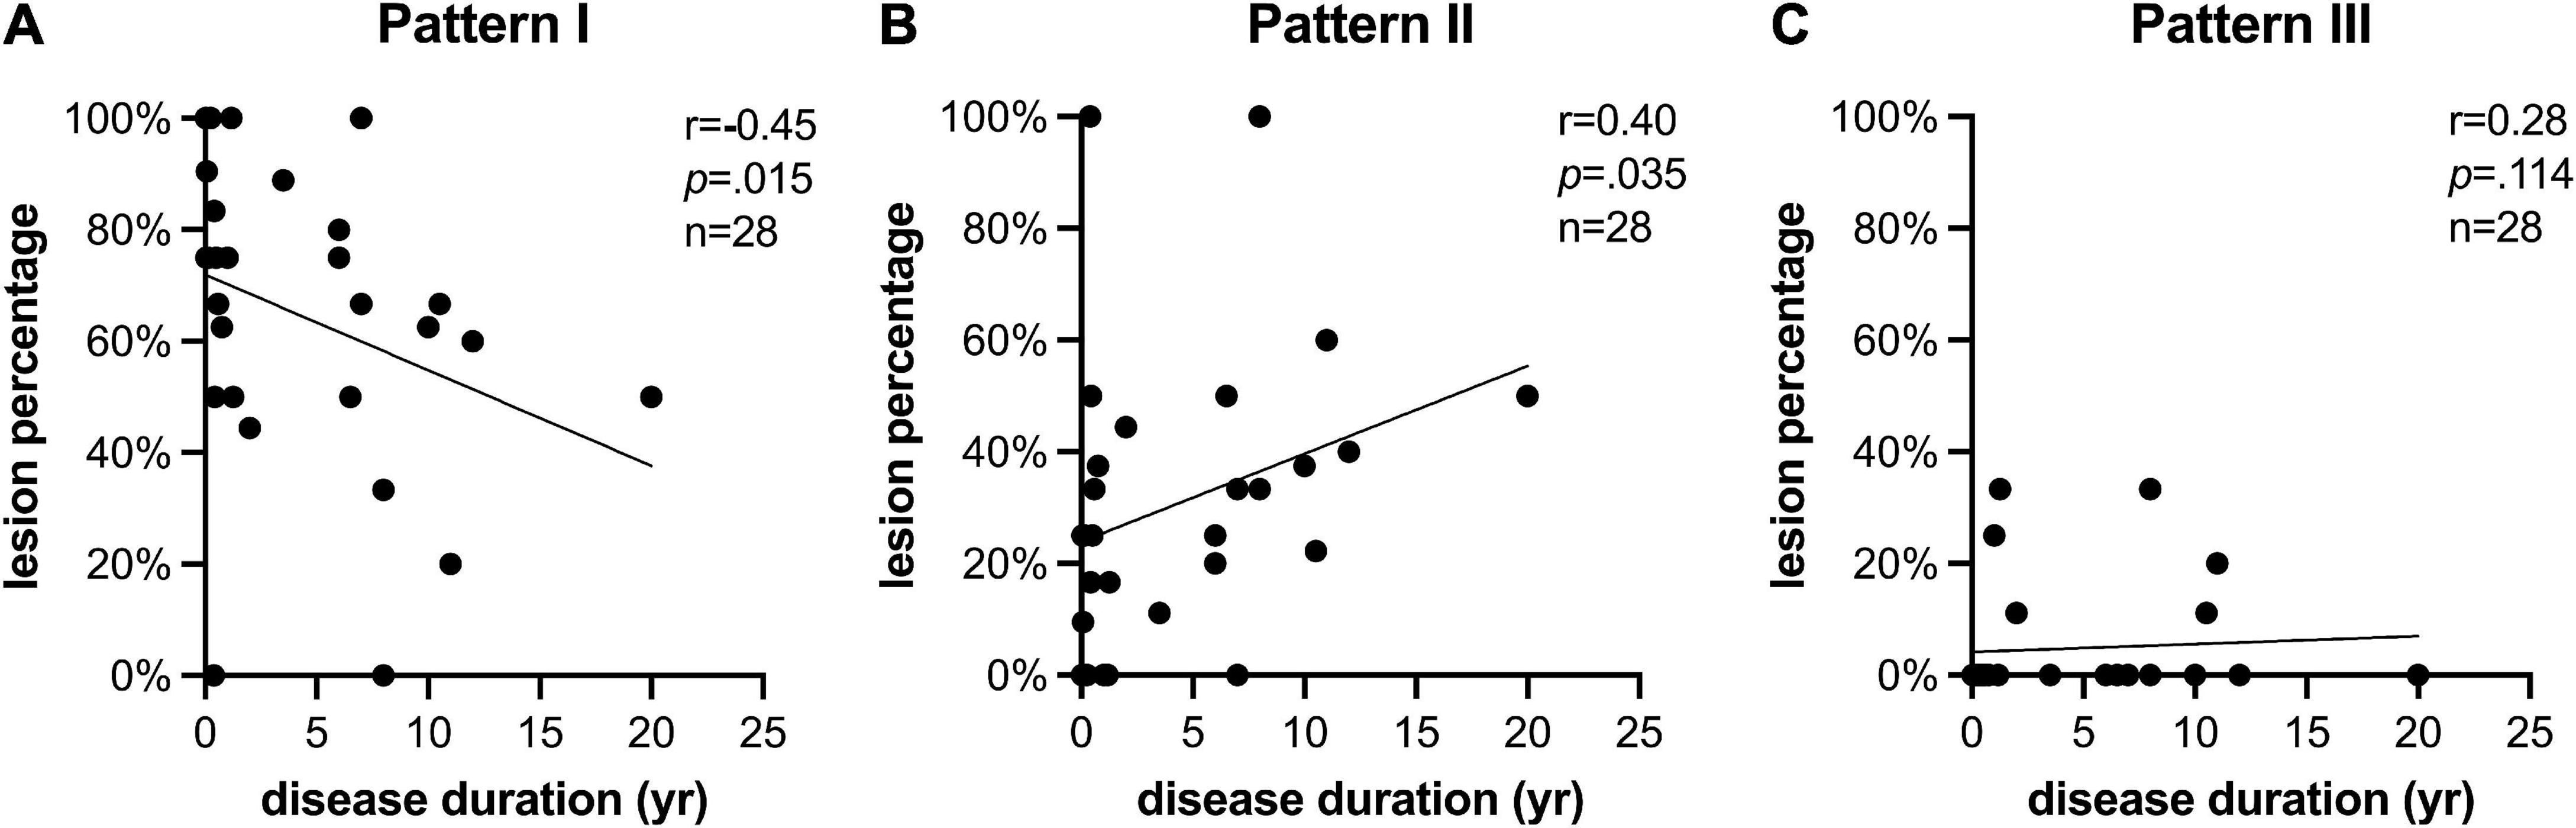
Figure 5. kex multimodal MRI pattern is related to disease duration. The percentage of lesions identified as (A) Pattern I (which are kex+ and QSM+); (B) Pattern II (which are either kex+ and QSM–, or kex– and QSM+); and (C) Pattern III (which are kex– and QSM–) changed with the disease duration of the case. Cases with long disease duration showed smaller percentage of Pattern I but larger percentage of Patten II in Gd– lesions than cases with short disease duration.
Different levels of kex and susceptibility elevation were also observed within the three patterns (Figure 6). The Pattern I lesions presented higher kex and susceptibility elevation (155.0 ± 103.7 s–1 and 28.19 ± 12.87 ppb) than both Pattern II (47.8 ± 105.5 s–1 and 20.16 ± 14.67 ppb, p < 0.001) and Pattern III (–19.61 ± 45.74 s–1 and 8.93 ± 14.59 ppb, p < 0.01) lesions.
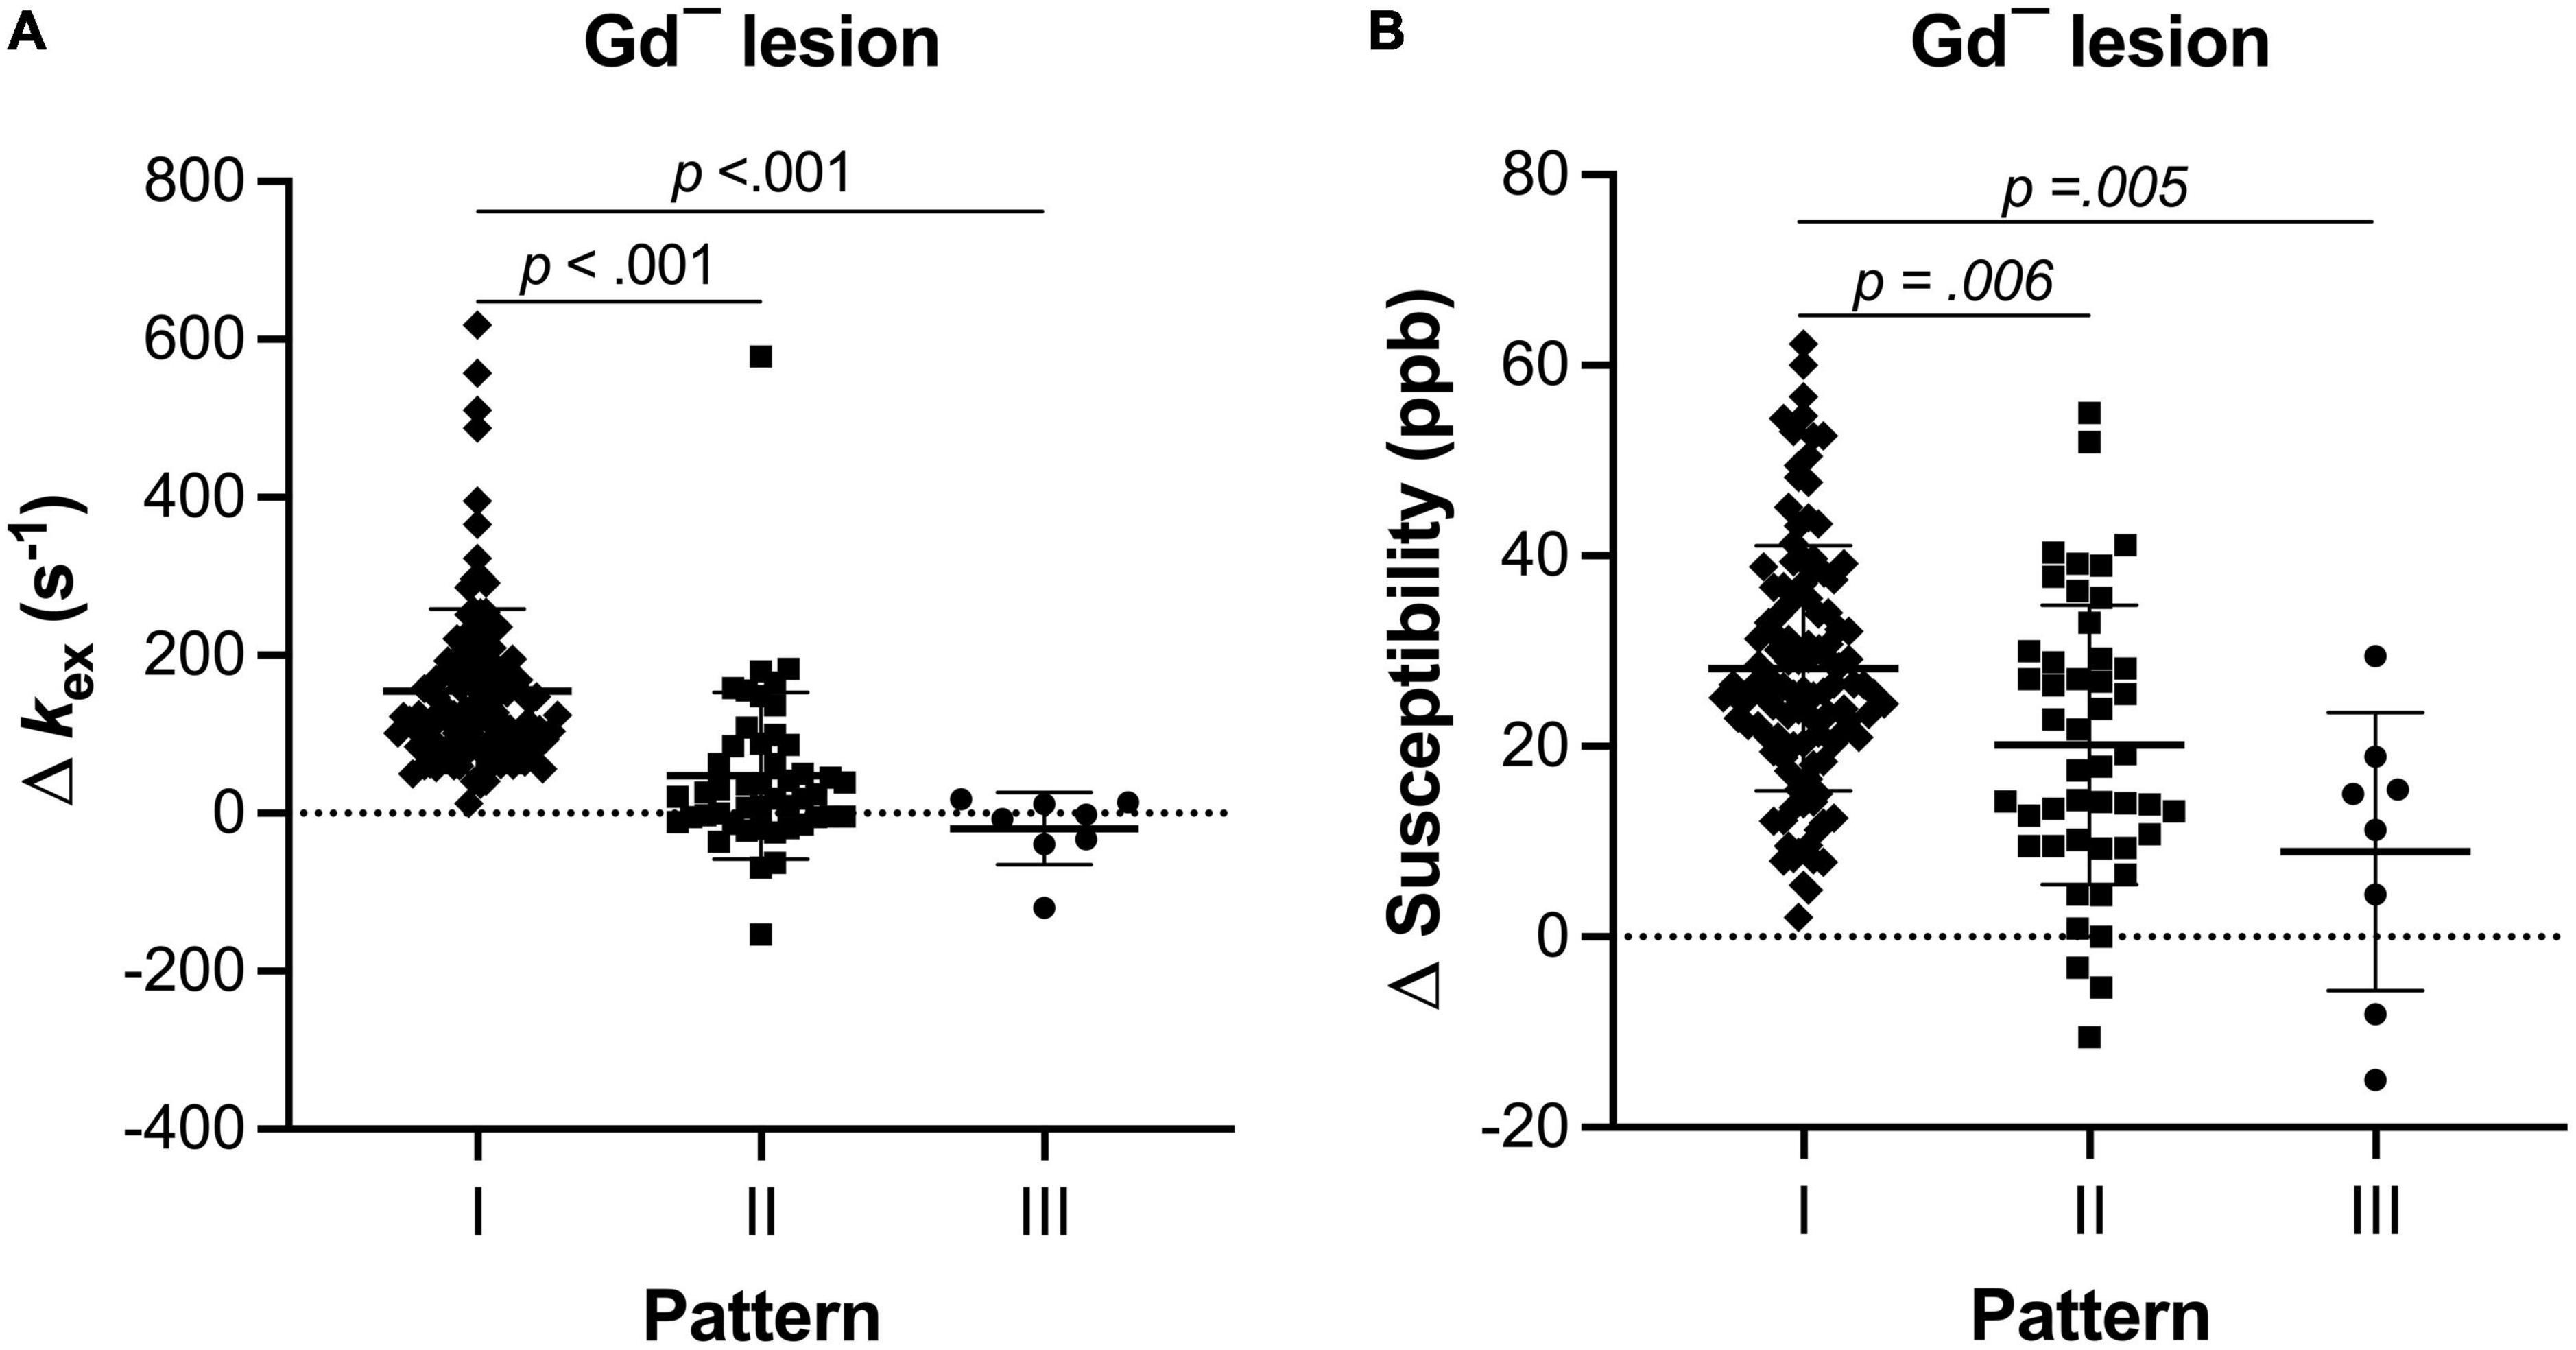
Figure 6. The level of inflammation indicator of each pattern of Gd– MS lesions was different (Kruskal–Wallis test with Dunn-Sidàk correction). Compared with Pattern II and Pattern III, Pattern I also showed higher kex elevation (A) and higher susceptibility elevation (B).
In the present study, we further classified Gd– lesions into three sub-patterns with different levels of kex and susceptibility elevation. Both kex and susceptibility elevation of Pattern I were higher than Pattern II. Furthermore, the patient with longer disease duration tended to have a lower percentage of lesions with Pattern I.
Multiple pathological processes occur during the course of MS, but the disruption of the BBB (Gaitan et al., 2011) the iron redistribution, and the oxidative damage (Dunham et al., 2017) are among the crucial inflammatory mechanisms. Assessing their correlation could be valuable for gaining a deeper understanding of lesion evolution. In the present study, three MR imaging sequences (Gd-enhanced, QSM, and kex MRI) were used to compare the structural damage or the molecular changes from these three mechanisms, respectively. Gd enhancement usually suggests acute inflammation and consequential BBB disruption. The degree of axon demyelination and iron deposition could be reflected by susceptibility, while kex has been demonstrated to be able to reflect the overproduction of ROS due to oxidative stress (Tain et al., 2019).
On such premises, Patterns I & II could be regarded as radiologically active for at least one sequence suggesting the existence of inflammation, while Pattern III (which are Gd–, kex–, and QSM–) might be considered radiologically inactive because inflammation was not detected by either QSM or kex MRI. Although the inconsistency of kex elevation and QSM hyperintensity did exist, over 70% of all MS lesions were consistently positive on both sequences, which is likely because iron can also serve as the catalyst for the Fenton reactions producing ROS (Tain et al., 2018). This finding suggests that the inflammation due to iron redistribution and oxygen burst can persist regardless of BBB repair. Therefore, interpreting all Gd– lesions as inactive is inaccurate.
Ring enhancement, compared with nodular enhancement, has been considered to result in longer and more severe tissue damage (Davis et al., 2010). Patients with ring-enhancing lesions were also reported to be to reach a EDSS of 4.0-6.0 in shorter time (Llufriu et al., 2010). Ring hyperintensity on QSM, as a sign of iron-containing cells surrounding the lesion edge, has also been related to more severe demyelination and chronic lesion activity/expansion (Absinta et al., 2013; Zhang et al., 2016a). Of the Gd-enhanced lesions (the acute lesions), lesion kex elevation was higher in either ring Gd+ lesions or ring QSM+ lesions than in nodular lesions, which implies that kex elevation is positively correlated with the severity of lesion inflammation though further pathologic evidence based on animal experiments are pending for verification. Endogenous ROS of MS is reported to come from the oxygen burst in microglia, inducing mitochondrial dysfunction and subsequent histotoxic hypoxia (Fischer et al., 2012). This further results in energy deficiency and ionic imbalance in oligodendrocytes, axons, and neurons (Mahad et al., 2015). When the respiratory burst leads to cellular degradation, the ferrous iron released from microglia and macrophages may in turn amplify inflammatory oxidative injury and neurodegeneration (Haider, 2015). The mild positive correlation between susceptibility and kex elevation we found may just reflect the interplay of iron content and ROS in MS lesions.
Based on the potential mutual reinforcement of iron deposition and oxygen damage, Pattern I is more likely to be inflammatory than Pattern II. For patients with relapsing-remitting courses, the inflammatory status of lesions might not always stay at the same level; instead, it could drop from a higher level to a lower one. The change in the percentage of Pattern I lesions with disease duration might reflect such evolution of chronic inflammation. As for the change in the percentage of Pattern II lesions, it may represent the combination of two different evolutionary trends, since Pattern II consists of two subtypes: IIa (which are kex+ and QSM–) and IIb (which are kex– and QSM+). Comparing to the other two patterns, a relatively larger standard deviation of kex elevation in Pattern II might also reflect the highly heterogenous nature of it. In the present study, the two subtypes were integrated into one pattern because of the possibly similar level of inflammation, which was lower than Pattern I but higher than Patter III. The difference between kex MRI and QSM reflects their differences in contrast mechanism. Nevertheless, attributing kex MRI contrast to oxidative stress and ROS production and comparing iron-induced inflammation requires further validation with biochemical analyses.
Lesion susceptibility elevation has generally been reported to remain relatively stable for months or years (Stuber et al., 2016), but lesion kex elevation may possess a more volatile trait since if the balance of pro- and antioxidants has not been achieved, ROS may not cease to fluctuate. Unlike the other two imaging sequences, the more susceptible ROS production seems to make the kex map a more sensitive method for inflammation indication and curative response monitoring. By enhancing the sensitivity and specificity, the combination of kex and QSM MRI could help to further stratify the lesion inflammatory status and detect smoldering lesions after the acute stage. In combination with QSM, kex MRI is promising for detection of lesion inflammation or activity.
Clinically, MS patients with a slow or moderate disease course typically receive a moderately effective and very safe medication, whereas patients who demonstrate highly active or rapidly evolving disease are candidates for highly effective but potentially less safe treatment (Thompson et al., 2018b). The time lost in the wait-and-see approach delays highly critical intervention for patients who are later identified as rapidly progressing. Therefore, an improved ability to risk-stratify MS lesion activity with kex MRI would help predict prognosis and guide treatment. The clinicians might also utilize non-invasive longitudinal kex MRI to monitor the therapeutic efficacy of treatment. For example, a drop of Pattern I percentage in all MS lesions might suggest good treatment response. With an extended lesion classification, a more personalized treatment is facilitated.
This study presents a preliminary exploration of the feasibility of QSM and kex MRI in MS lesion categorization based on retrospective, cross-sectional, single-center data. The sample size is relatively small, and the small lesion amount affected the statistical analysis of the two subtypes of Pattern II as well as Pattern III. To conform with kex MRI, the image analysis was limited to one slice of image for each case and was also restricted by the spatial resolution of Z-spectral MRI. The errors on lesion registration and kex measurement may exist because there are small lesions which are challenging to differentiate from potential ischemic lesions. Moreover, further validation with pathological studies on preclinical animal models is needed. Research with larger samples, prospective and longitudinal designs, and invasive biochemical validation should be carried out.
In conclusion, the study extended the classification of MS lesions by the combination of three MRI sequences (Gd-enhanced, QSM, and kex MRI). Underlying inflammation of Gd– lesions was further visualized by QSM and kex MRI, suggesting their utility in assessing the inflammation status of lesions previously considered inactive with Gd-enhanced MRI.
The raw data supporting the conclusions of this article will be made available by the authors, without undue reservation.
The studies involving human participants were reviewed and approved by the Institutional Review Board of Tongji Hospital, Tongji Medical College, Huazhong University of Science and Technology. Written informed consent for participation was not required for this study in accordance with the national legislation and the institutional requirements.
HL: analysis and interpretation of data, drafting and revision of the manuscript for content, including medical writing for content, and study concept or design. ZC: processing, analysis and interpretation of data, drafting of the manuscript for content, and including medical writing for content. HY and QC: major role in the acquisition of data and analysis of data. YZ: acquisition of data. MS and SL: revision of the manuscript for content and including medical writing for content. WC: study concept or design, acquisition and interpretation of data, and revision of the manuscript for content. KC: study concept or design, interpretation of data, and revision of the manuscript for content. All authors contributed to the article and approved the submitted version.
We wish to thank Dr. Bruce Ozgen Mocan for her advice on the manuscript and figure preparation.
The authors declare that the research was conducted in the absence of any commercial or financial relationships that could be construed as a potential conflict of interest.
All claims expressed in this article are solely those of the authors and do not necessarily represent those of their affiliated organizations, or those of the publisher, the editors and the reviewers. Any product that may be evaluated in this article, or claim that may be made by its manufacturer, is not guaranteed or endorsed by the publisher.
The Supplementary Material for this article can be found online at: https://www.frontiersin.org/articles/10.3389/fnins.2022.1105376/full#supplementary-material
Absinta, M., Sati, P., Gaitan, M. I., Maggi, P., Cortese, I. C., Filippi, M., et al. (2013). Seven-tesla phase imaging of acute multiple sclerosis lesions: A new window into the inflammatory process. Ann. Neurol. 74, 669–678. doi: 10.1002/ana.23959
Chen, W., Gauthier, S. A., Gupta, A., Comunale, J., Liu, T., Wang, S., et al. (2014). Quantitative susceptibility mapping of multiple sclerosis lesions at various ages. Radiology 271, 183–192. doi: 10.1148/radiol.13130353
Davis, M., Auh, S., Riva, M., Richert, N. D., Frank, J. A., McFarland, H. F., et al. (2010). Ring and nodular multiple sclerosis lesions: A retrospective natural history study. Neurology 74, 851–856. doi: 10.1212/WNL.0b013e3181d31df5
Dunham, J., Bauer, J., Campbell, G. R., Mahad, D. J., van Driel, N., van der Pol, S. M. A., et al. (2017). Oxidative injury and iron redistribution are pathological hallmarks of marmoset experimental autoimmune encephalomyelitis. J. Neuropathol. Exp. Neurol. 76, 467–478. doi: 10.1093/jnen/nlx034
Filippi, M., Rocca, M. A., Ciccarelli, O., De Stefano, N., Evangelou, N., Kappos, L., et al. (2016). MRI criteria for the diagnosis of multiple sclerosis: MAGNIMS consensus guidelines. Lancet Neurol. 15, 292–303. doi: 10.1016/s1474-4422(15)00393-2
Fischer, M. T., Sharma, R., Lim, J. L., Haider, L., Frischer, J. M., Drexhage, J., et al. (2012). NADPH oxidase expression in active multiple sclerosis lesions in relation to oxidative tissue damage and mitochondrial injury. Brain 135(Pt 3), 886–899. doi: 10.1093/brain/aws012
Frischer, J. M., Weigand, S. D., Guo, Y., Kale, N., Parisi, J. E., Pirko, I., et al. (2015). Clinical and pathological insights into the dynamic nature of the white matter multiple sclerosis plaque. Ann. Neurol. 78, 710–721. doi: 10.1002/ana.24497
Gaitan, M. I., Shea, C. D., Evangelou, I. E., Stone, R. D., Fenton, K. M., Bielekova, B., et al. (2011). Evolution of the blood-brain barrier in newly forming multiple sclerosis lesions. Ann. Neurol. 70, 22–29. doi: 10.1002/ana.22472
Haider, L. (2015). Inflammation, iron, energy failure, and oxidative stress in the pathogenesis of multiple sclerosis. Oxid. Med. Cell. Longev. 2015:725370. doi: 10.1155/2015/725370
Kotelnikova, E., Kiani, N. A., Abad, E., Martinez-Lapiscina, E. H., Andorra, M., Zubizarreta, I., et al. (2017). Dynamics and heterogeneity of brain damage in multiple sclerosis. PLoS Comput. Biol. 13:e1005757. doi: 10.1371/journal.pcbi.1005757
Lassmann, H., Bruck, W., and Lucchinetti, C. F. (2007). The immunopathology of multiple sclerosis: An overview. Brain Pathol. 17, 210–218. doi: 10.1111/j.1750-3639.2007.00064.x
Liu, T., Xu, W., Spincemaille, P., Avestimehr, A. S., and Wang, Y. (2012). Accuracy of the morphology enabled dipole inversion (MEDI) algorithm for quantitative susceptibility mapping in MRI. IEEE Trans. Med. Imaging 31, 816–824. doi: 10.1109/TMI.2011.2182523
Llufriu, S., Pujol, T., Blanco, Y., Hankiewicz, K., Squarcia, M., Berenguer, J., et al. (2010). T2 hypointense rims and ring-enhancing lesions in MS. Mult. Scler. 16, 1317–1325. doi: 10.1177/1352458510377905
Maggi, P., Macri, S. M., Gaitan, M. I., Leibovitch, E., Wholer, J. E., Knight, H. L., et al. (2014). The formation of inflammatory demyelinated lesions in cerebral white matter. Ann. Neurol. 76, 594–608. doi: 10.1002/ana.24242
Mahad, D. H., Trapp, B. D., and Lassmann, H. (2015). Pathological mechanisms in progressive multiple sclerosis. Lancet Neurol. 14, 183–193. doi: 10.1016/s1474-4422(14)70256-x
Pitt, D., Lo, C. H., Gauthier, S. A., Hickman, R. A., Longbrake, E., Airas, L. M., et al. (2022). Toward precision phenotyping of multiple sclerosis. Neurol. Neuroimmunol. Neuroinflamm. 9:e200025. doi: 10.1212/NXI.0000000000200025
Shaghaghi, M., and Cai, K. (2022). Toward in vivo MRI of the tissue proton exchange rate in humans. Biosensors (Basel) 12:815. doi: 10.3390/bios12100815
Shaghaghi, M., Chen, W., Scotti, A., Ye, H., Zhang, Y., Zhu, W., et al. (2019). In vivo quantification of proton exchange rate in healthy human brains with omega plot. Quant. Imaging Med. Surg. 9, 1686–1696. doi: 10.21037/qims.2019.08.06
Stuber, C., Pitt, D., and Wang, Y. (2016). Iron in multiple sclerosis and its noninvasive imaging with quantitative susceptibility mapping. Int. J. Mol. Sci. 17:100. doi: 10.3390/ijms17010100
Tain, R. W., Scotti, A. M., and Cai, K. (2019). Improving the detection specificity of endogenous MRI for reactive oxygen species (ROS). J. Magn. Reson. Imaging 50, 583–591. doi: 10.1002/jmri.26629
Tain, R. W., Scotti, A. M., Li, W., Zhou, X. J., and Cai, K. (2018). Imaging short-lived reactive oxygen species (ROS) with endogenous contrast MRI. J. Magn. Reson. Imaging 47, 222–229. doi: 10.1002/jmri.25763
Thompson, A. J., Banwell, B. L., Barkhof, F., Carroll, W. M., Coetzee, T., Comi, G., et al. (2018a). Diagnosis of multiple sclerosis: 2017 revisions of the McDonald criteria. Lancet Neurol. 17, 162–173. doi: 10.1016/s1474-4422(17)30470-2
Thompson, A. J., Baranzini, S. E., Geurts, J., Hemmer, B., and Ciccarelli, O. (2018b). Multiple sclerosis. Lancet 391, 1622–1636. doi: 10.1016/S0140-6736(18)30481-1
Tourdias, T., Roggerone, S., Filippi, M., Kanagaki, M., Rovaris, M., Miller, D. H., et al. (2012). Assessment of disease activity in multiple sclerosis phenotypes with combined gadolinium- and superparamagnetic iron oxide-enhanced MR imaging. Radiology 264, 225–233. doi: 10.1148/radiol.12111416
Wattjes, M. P., Ciccarelli, O., Reich, D. S., Banwell, B., de Stefano, N., Enzinger, C., et al. (2021). 2021 MAGNIMS–CMSC–NAIMS consensus recommendations on the use of MRI in patients with multiple sclerosis. Lancet Neurol. 20, 653–670. doi: 10.1016/s1474-4422(21)00095-8
Wisnieff, C., Ramanan, S., Olesik, J., Gauthier, S., Wang, Y., and Pitt, D. (2015). Quantitative susceptibility mapping (QSM) of white matter multiple sclerosis lesions: Interpreting positive susceptibility and the presence of iron. Magn. Reson. Med. 74, 564–570. doi: 10.1002/mrm.25420
Ye, H., Shaghaghi, M., Chen, Q., Zhang, Y., Lutz, S. E., Chen, W., et al. (2020). In vivo proton exchange rate (kex) MRI for the characterization of multiple sclerosis lesions in patients. J. Magn. Reson. Imaging 53, 408–415. doi: 10.1002/jmri.27363
Yushkevich, P. A., Piven, J., Hazlett, H. C., Smith, R. G., Ho, S., Gee, J. C., et al. (2006). User-guided 3D active contour segmentation of anatomical structures: Significantly improved efficiency and reliability. Neuroimage 1, 1116–1128. doi: 10.1016/j.neuroimage.2006.01.015
Zhang, Y., Gauthier, S. A., Gupta, A., Comunale, J., Chia-Yi Chiang, G., Zhou, D., et al. (2016b). Longitudinal change in magnetic susceptibility of new enhanced multiple sclerosis (MS) lesions measured on serial quantitative susceptibility mapping (QSM). J. Magn. Reson. Imaging 44, 426–432. doi: 10.1002/jmri.25144
Zhang, Y., Gauthier, S. A., Gupta, A., Chen, W., Comunale, J., Chiang, G. C., et al. (2016a). Quantitative susceptibility mapping and R2* measured changes during white matter lesion development in multiple sclerosis: Myelin breakdown, myelin debris degradation and removal, and iron accumulation. AJNR Am. J. Neuroradiol. 37, 1629–1635. doi: 10.3174/ajnr.A4825
Keywords: multiple sclerosis, magnetic resonance imaging, oxidative stress, iron, inflammation
Citation: Liao H, Cai Z, Ye H, Chen Q, Zhang Y, Shaghaghi M, Lutz SE, Chen W and Cai K (2023) Combining in vivo proton exchange rate (kex) MRI with quantitative susceptibility mapping to further stratify the gadolinium-negative multiple sclerosis lesions. Front. Neurosci. 16:1105376. doi: 10.3389/fnins.2022.1105376
Received: 22 November 2022; Accepted: 28 December 2022;
Published: 11 January 2023.
Edited by:
Wenbin Zheng, Second Affiliated Hospital of Shantou University Medical College, ChinaReviewed by:
Guanshu Liu, Johns Hopkins University, United StatesCopyright © 2023 Liao, Cai, Ye, Chen, Zhang, Shaghaghi, Lutz, Chen and Cai. This is an open-access article distributed under the terms of the Creative Commons Attribution License (CC BY). The use, distribution or reproduction in other forums is permitted, provided the original author(s) and the copyright owner(s) are credited and that the original publication in this journal is cited, in accordance with accepted academic practice. No use, distribution or reproduction is permitted which does not comply with these terms.
*Correspondence: Weiwei Chen,  Y2hlbndlaXdlaV90amhAdGpoLnRqbXUuZWR1LmNu
†These authors share first authorship
Disclaimer: All claims expressed in this article are solely those of the authors and do not necessarily represent those of their affiliated organizations, or those of the publisher, the editors and the reviewers. Any product that may be evaluated in this article or claim that may be made by its manufacturer is not guaranteed or endorsed by the publisher.
Research integrity at Frontiers
Learn more about the work of our research integrity team to safeguard the quality of each article we publish.