 Yu Zhang
 Wenhao Xiang2
 Ran Wei
 Xiangzhi Bai
94% of researchers rate our articles as excellent or good
Learn more about the work of our research integrity team to safeguard the quality of each article we publish.
Find out more
ORIGINAL RESEARCH article
Front. Neurosci., 28 October 2022
Sec. Brain Imaging Methods
Volume 16 - 2022 | https://doi.org/10.3389/fnins.2022.1055451
This article is part of the Research TopicMultimodal Brain Image Fusion: Methods, Evaluations, and ApplicationsView all 13 articles
Multi-modal brain image fusion targets on integrating the salient and complementary features of different modalities of brain images into a comprehensive image. The well-fused brain image will make it convenient for doctors to precisely examine the brain diseases and can be input to intelligent systems to automatically detect the possible diseases. In order to achieve the above purpose, we have proposed a local extreme map guided multi-modal brain image fusion method. First, each source image is iteratively smoothed by the local extreme map guided image filter. Specifically, in each iteration, the guidance image is alternatively set to the local minimum map of the input image and local maximum map of previously filtered image. With the iteratively smoothed images, multiple scales of bright and dark feature maps of each source image can be gradually extracted from the difference image of every two continuously smoothed images. Then, the multiple scales of bright feature maps and base images (i.e., final-scale smoothed images) of the source images are fused by the elementwise-maximum fusion rule, respectively, and the multiple scales of dark feature maps of the source images are fused by the elementwise-minimum fusion rule. Finally, the fused bright feature map, dark feature map, and base image are integrated together to generate a single informative brain image. Extensive experiments verify that the proposed method outperforms eight state-of-the-art (SOTA) image fusion methods from both qualitative and quantitative aspects and demonstrates great application potential to clinical scenarios.
With the development of the medical imaging techniques, patients are often required to take multiple modalities of images, such as computed tomography (CT), magnetic resonance (MR) image, positron emission tomography (PET), and single-photon emission computed tomography (SPECT). Specifically, CT image mainly captures dense structures, such as bones and implants. MR image can capture soft-tissue information clearly, such as muscle and tumor. PET image can help reveal the metabolic or biochemical function of tissues and organs and SPECT image can visualize the conditions of organs, tissues, and bones through delivering a gamma-emitting radioisotope into the patient. Then, through observing all these captured medical images, the doctors can precisely diagnose the possible diseases. However, accurately locating the lesions and diagnosing the corresponding diseases from multiple modalities of images are still complex and time-consuming for the doctors. Therefore, the image fusion technique can be applied to merge the salient and complementary information of the multi-modal images into a single image for better perception of both doctors and intelligent systems (Yin et al., 2018; Liu et al., 2019, 2022a,b,c,d; Xu and Ma, 2021; Wang et al., 2022).
In recent years, many methods have been proposed for the task of multi-modal image fusion. Generally, these methods can be divided in two categories, i.e., spatial-domain image fusion methods and transform-domain methods (Liu et al., 2015, 2018; Zhu et al., 2018, 2019; Yin et al., 2019; Xu et al., 2020a; Zhang et al., 2020). Specifically, the spatial-domain image fusion methods first decompose the source images into multiple regions, and then integrate the salient regions together to generate their fusion image (Bai et al., 2015; Liu et al., 2017, 2018, 2020; Zhang et al., 2017). The fusion images of these methods often yield unsatisfactory effect due to their inaccurate segmentation results. The transform-domain methods are more popular in the field of image fusion. These methods first convert the source images into a specific domain, then fuse the salient features in this domain, and finally generates the fusion image by converting the fused features back to the image domain (Liu et al., 2015; Xu et al., 2020a; Zhang et al., 2020). The fusion images of these methods are usually more suitable for human to perceive, but might suffer from the blurring effect (Ma et al., 2019a). Moreover, with the fast development of deep-learning techniques, many deep-learning (mainly convolutional neural network, CNN) based image fusion methods have been proposed (Liu et al., 2017; Li and Wu, 2018; Ma et al., 2019b; Wang et al., 2020; Zhang et al., 2020). These methods adopt CNN to extract the deep convolutional features, then fuse the features of the source images by a feature fusion module, and finally reconstruct the fused features as their fusion images. Even though these deep-learning based methods have achieved great success in the field of image fusion, many of these methods would generate fusion images of low contrast or having other kinds of defects.
Amongst the transform-domain methods, the guided image filter (He et al., 2012) demonstrates to be a state-of-the-art (SOTA) edge-preserving image filter, and has been widely used in the field of image fusion (Li et al., 2013; Gan et al., 2015). But in these methods, the guided image filter is often used to refine the decision map or weight map rather than used to extract salient features due to its relatively weak ability in feature extraction. Therefore, in this study, we aim to improve the feature extraction ability of the guided image filter, and based on our improved guided filter to further develop a multi-modal brain image fusion method.
To be specific, we have developed a local extreme map guided image filter, which consists of a local minimum map guided image filter and a local maximum map guided image filter. The developed local extreme map guided image filter is able to more effectively smooth the input image as compared to the original image filter guided by the input image itself, then the features extracted from the difference image of the smoothed image and input image by our filter will be naturally more salient than those extracted by the original image filter guided by the input image itself. Through extending the local extreme map guided filter to multiple scales, we propose a local extreme map guided image filter based multi-modal brain image fusion method. Specifically, we first apply the local extreme map guided image filter iteratively on each source image to extract their multi-scale bright and dark feature maps. Then, the multi-scale bright feature maps, multi-scale dark feature maps, and the base images of the multi-modal brain images are fused, respectively. Finally, the fused bright feature map, dark feature map, and base image are integrated together to generate our fused brain image.
The contributions of this study can be concluded in three parts:
• We propose a new scheme to improve the feature extraction ability of the guided image filter, i.e., using two guided image filters with a local minimum map and a local maximum map, respectively, as their guidance images. This scheme can be incorporated with various guided filters or other similar filters in pursuit of improving their feature extraction ability.
• Based on the local extreme map guided image filter, we further propose an effective image fusion method for fusing multi-modal brain images. Moreover, the proposed method can be easily adapted to fuse other modalities of images while achieving superior fusion performance.
• Extensive experiments verify that our method performs comparably to or even better than eight SOTA image fusion methods (including three conventional methods and five deep learning based methods) in terms of both qualitative and quantitative evaluations.
The rest of this paper is organized as follows. In Section 2, the constructed local extreme map guided image filter and the proposed multi-modal brain image fusion method are elaborated, respectively. Then, the experimental results and discussions are made in Section 3. Finally, this study is concluded in Section 4.
The overall structure of the proposed method is illustrated in Figure 1. The major procedures of the proposed method include: First, the two multi-modal brain image are iteratively smoothed by the local extreme map guided filter, respectively. Then, different scales of bright and dark feature maps are extracted, respectively, from the two multi-modal brain images, and the two smoothed brain images in the last iteration are taken as their base images, respectively. Afterwards, each scale of bright feature maps of the two brain images and each scale of dark feature maps of the two brain images are fused by selecting their elementwise maximum values and their elementwise minimum values, respectively. Further, the fused multi-scale bright feature maps and dark feature maps are integrated as a single bright feature map and a single dark feature map, respectively, and the two base image are fused as their elementwise maximum values as well. Finally, the fusion image is generated by integrating the fused bright feature map, dark feature map, and base image together. In the following subsections, the local extreme map guided image filter and our proposed image fusion are elaborated, respectively.
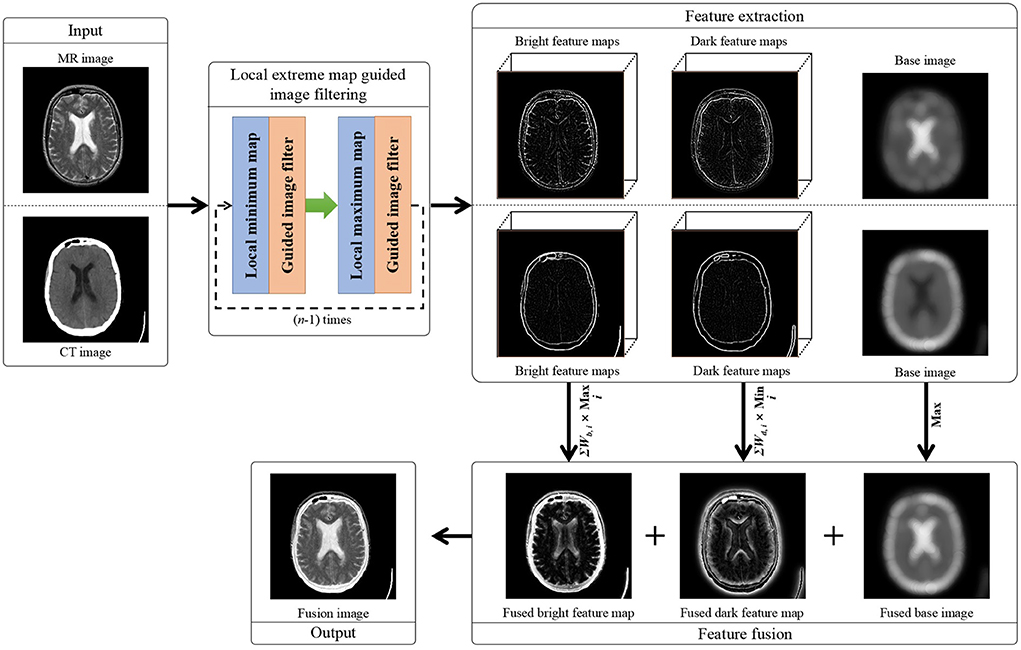
Figure 1. Flowchart of our proposed local extreme map guided multi-modal brain image fusion method. (Note that the dark feature maps in this figure have been illustrated as their absolute feature maps in order to properly visualize the dark features).
In the guided image filter based image fusion methods (Li et al., 2013; Gan et al., 2015), the guided image filter was often used to adjust the decision maps or weight maps for fusing the feature maps of input images rather than directly extracting the salient feature maps from the input images, due to its limited feature extraction ability. Therefore, in this study, we focus on improving the feature extraction ability of the guided image filter by designing appropriate guidance images.
In the official demonstration of guided image filter (He et al., 2012), the input image is smoothed under the guidance of the input image itself to approach the edge preserving effect. However, in this way, the feature map generated by subtracting the filtered image from the input image is usually not salient enough for the task of image fusion. In order to enhance the feature map, we have modified the guidance image from the input image to its local extreme maps, so that the salient features of the input image can be largely suppressed and accordingly these salient features can be effectively extracted from the difference image of the input image and filtered image. The detailed construction method of our local extreme map guided image filter is described as follows.
First, the input image is filtered under the guidance of the local minimum map of the input image as:
where guidedfilter denotes the guided filter (He et al., 2012). I and Imin are the input image and guidance image, respectively. r denotes the size of the local window for constructing the linear model between input image and guidance image. Moreover, Imin denotes the local minimum image of I. Under the guidance of the local minimum map, the salient bright features could be sufficiently removed from the input image. Specifically, Imin can be solved by the morphological erosion operation as:
where imerode(·) denotes the morphological erosion operator. se denotes the structuring element of flat-disk shape, radius of which is denoted by k.
Then, is further filtered under the guidance of its local maximum map as:
where and Imax are the input image and guidance image, respectively, and Imax denotes the local maximum image of . Under the guidance of the local maximum map, the salient dark features could be further removed from the finally filtered image. Similar to the solution of Imin, Imax can be efficiently solved by the morphological dilation operation as:
where imdilate(·) denotes the morphological dilation operator.
In order to conveniently introduce the following image fusion method, we denote by leguidedfilter(·) the function of our constructed local extreme map guided image filter [composed by Equations (1) and (2)], then smoothing an image with the local extreme map guided image filter can be expressed as:
where r and se correspond to the parameters in Equations (1) and (2).
As is known, there exist both bright features and dark features in an image, such as the bright person and the dark roof in Figure 2A. Through sequentially smoothing the input image guided by the local minimum map and local maximum map, respectively, both the salient bright and dark features will be removed from the input image and a well-smoothed image will be obtained. Then, the salient features of the input image can be obtained by subtracting the filtered image If from the input image I according to Equation (4), and the positive part of (I−If) corresponds to the bright features, and the negative part corresponds to the dark features.
where Fb and Fd denote the bright feature map and dark feature map of I, respectively.
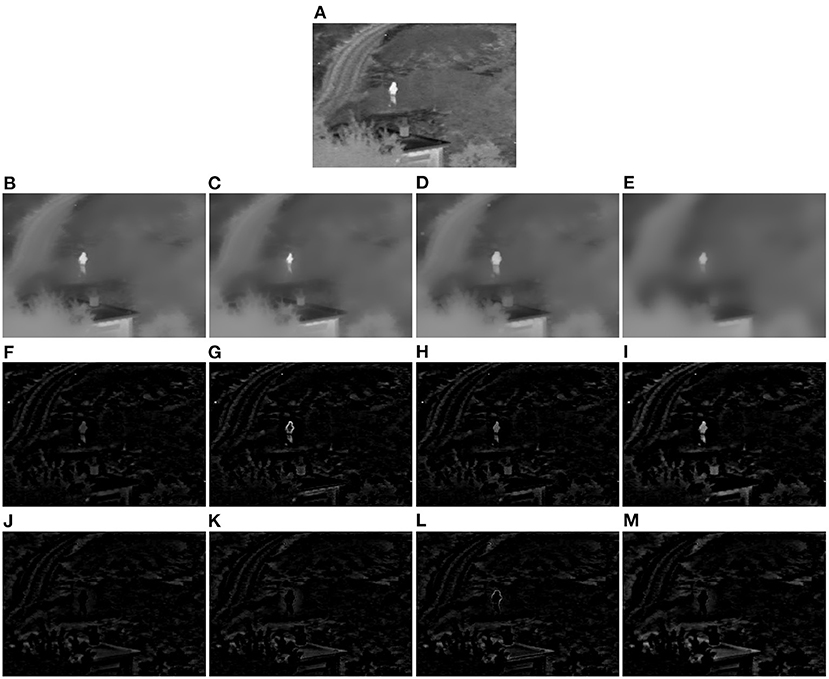
Figure 2. Demonstration example of the local extreme map guided image filter (Toet, 2017). (A) Original infrared image. (B) Image smoothed by the image filter guided by the input image itself. (C) Image smoothed by single local minimum map guided image filter. (D) Image smoothed by single local maximum map guided image filter. (E) Image smoothed by our local extreme map guided image filter. (F–I) Bright feature maps extracted from the difference images of (B–E) and (A), respectively. (J–M) Dark feature maps extracted from the difference images of (B–E) and (A), respectively (Note that the dark feature maps in this figure have been illustrated as their absolute feature maps in order to properly visualize the dark features).
A demonstration example of the proposed local extreme map guided image filter performed on an infrared image is illustrated in Figure 2. In this figure, we have compared the smoothed images (see Figures 2B–E), respectively, by the original guided image filter, single local minimum map guided filter, single local maximum map guided filter, and our complete extreme map guided filter, and also compared the feature maps extracted from their difference images with respect to the original infrared image in Figure 2A. It can be seen from Figures 2B–E that the smoothed image by our extreme map guided filter has suppressed more salient features (textural details) compared to those of the original guided filter, single local minimum map guided filter, and single local maximum map guided filter. Accordingly, the salient features (see Figures 2I,M) extracted by our extreme map guided filter are far more than those extracted by the original guided filter, single local minimum map guided filter, and single local maximum map guided filter. Moreover, intensities of our extracted feature maps are much higher than those of feature maps extracted by the other three filters. Overall, the results in this figure suggest that our constructed local extreme map guided filter is able to extract the input image's bright and dark features well and significantly outperforms the original guided filter, single local minimum map guided filter, and single local maximum map guided filter.
Naturally, the local extreme map guided image filter can be extended to multiple scales by iteratively applying the image filter guided with local minimum map and that guided with local maximum map on the input image I according to Equation (5).
where i denotes the current scale of the guided filter, and i is increased from 1 to n one by one. denotes the ith-scale filtered image and especially is the original input image I. sei and ri denote the structuring element and size of the local window at the ith scale, respectively.
Accordingly, different scales of bright and dark features can be simultaneously extracted from the difference image of every two continuously filtered images according to Equation (6).
Finally, the last scale of filtered image is taken as the base image of I, as expressed in Equation (7).
In this study, we aim to fuse two multi-modal brain images (denoted by I1 and I2). According to the feature extraction method introduced in the previous subsection, we can well extract the multi-scale bright feature maps (denoted by ) and dark feature maps (denoted by ) of each input image Ij, and simultaneously obtain their base images (denoted by ). j denotes index of the input image, and is ranged from 1 to 2. Then, the detailed procedures for fusing two multi-modal brain images are introduced as follows.
As the high-frequency features of high intensities are usually corresponding to the salient sharp features in the image, thus we fuse each scale of bright feature maps of the two multi-modal brain images by selecting their elementwise-maximum values and fuse each scale of dark feature maps of the two multi-modal images as their elementwise-minimum values as:
Like other feature extractors, the proposed local extreme map guided image filter cannot extract the entire bright and dark features from the source images either, thus we have enhanced the fused bright and dark features by multiplying each scale of fused bright feature map and dark feature map by an information-amount related weight. Further, the enhanced bright feature maps and dark feature maps are integrated, respectively. The above two procedures can be mathematically expressed as:
where wb, i denotes the weight of the ith scale of bright feature map and wd, i denotes the weight of the ith scale of dark feature map. Generally, the feature map with more information should be assigned to a large weight, thus wb, i and wd, i are set according to the entropy of and , respectively, as:
where eb, i denotes the entropy of and ed, i denotes the entropy of . In this way, the minimum weight, i.e., weight of feature map with the lowest entropy, will be 1, and weights of other scales of feature maps will all be higher than 1. Accordingly, most scales of bright and dark feature maps will be enhanced to some degree according to their information amount.
As for the low-frequency base images, we directly fuse them by computing their elementwise-maximum values according to Equation (11). In this manner, most basic information of the multi-modal medical images will preserved into the final fusion image.
Finally, the fusion image can be generated by combining the fused bright feature map, dark feature map, and base image together as expressed in Equation (12). In this way, our fused image can not only preserve as much as basic information of the multi-modal source images, but also well enhance the salient sharp features of the multi-modal source images.
In our method, there are mainly three parameters, including the scale number n, the size of the local window ri in the guided image filter, and the radius of the structuring element ki in the morphological erosion and dilation operations. In order to balance the time cost and fusion effect of the multi-modal brain images, n is set to five in this study, i.e., n = 5. As for ri and ki, we keep them same with each other, i.e., ki = ri, in in each iteration i of local extreme map guided image filtering. Moreover, in order to effectively extract the salient image features, we set ri = 2×i+1 where i is gradually increased from 1 to n in this study. The extensive experimental results verify the above settings are effective for fusing the multi-modal brain images.
In order to verify the effectiveness of the proposed image fusion method, we have compared it with eight representative image fusion methods on three commonly used multi-modal brain image datasets (Xu and Ma, 2021). The detailed experimental settings, implementation details, results, and discussions are introduced in the following five subsections.
At first, we take 30 pairs of commonly used multi-modal brain images from http://www.med.harvard.edu/aanlib as our testing sets, including 10 pairs of CT and MR brain images, 10 pairs of PET and MR images, and 10 pairs of SPECT and MR images. The three used datasets have been shown in Figures 3–5, respectively. In particular, the spatial resolution of the images in the three datasets are all 256 × 256.
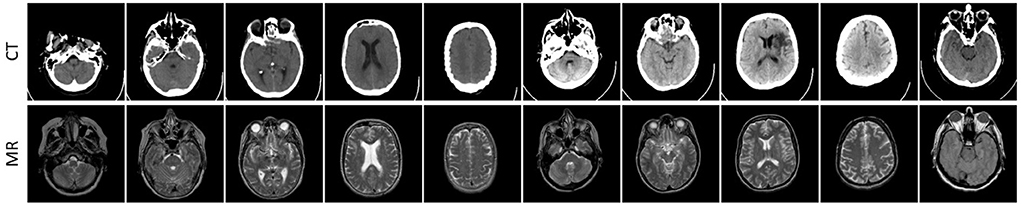
Figure 3. Ten pairs of images in the CT-MR image dataset.
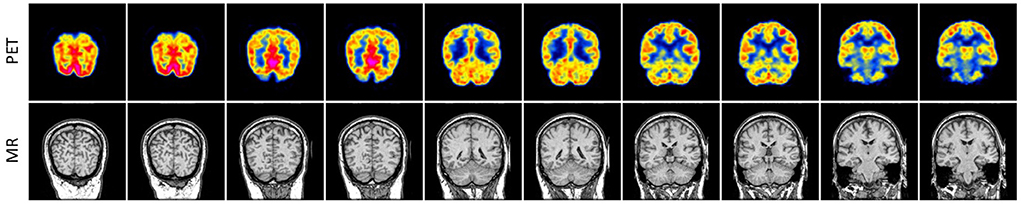
Figure 4. Ten pairs of images in the PET-MR image dataset.
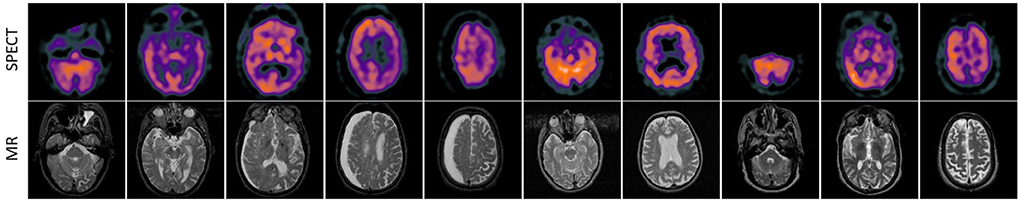
Figure 5. Ten pairs of images in the SPECT-MR image dataset.
Second, we have compared our method with eight SOTA image fusion methods, including the discrete wavelet transform based method (DWT) (Li et al., 1995), the guided-filter based method (GFF) (Li et al., 2013), the Laplacian pyramid and sparse representation base method (LPSR) (Liu et al., 2015), the unified image fusion network (U2Fusion) (Xu et al., 2020a), the GAN based method (DDcGAN) (Ma et al., 2020), the general CNN based image fusion network (IFCNN) (Zhang et al., 2020), the enhanced medical image fusion network (EMFusion) (Xu and Ma, 2021), and the disentangled representation based brain image fusion network (DRBIF) (Wang et al., 2022). Moreover, in order to verify the efficacy of the guidance of local extreme maps, we have also added our method without the guidance of local extreme maps (denoted by LEGFF0) for comparison.
At last, qualitative evaluation heavily depends on the subjective observation which is inaccurate and laborious, thus 11 commonly-used quantitative metrics are further used to objectively compare the 10 methods' performance. The 11 quantitative metrics are spatial frequency (SF) (Li and Yang, 2008), average absolute gradient (AbG), perceptual saliency (PS) (Zhou et al., 2016), standard deviation (STD), entropy (E), Chen-Blum Metric (QCB) (Chen and Blum, 2009), visual information fidelity (VIFF) (Han et al., 2013), edge preservation metric (Qabf) (Xydeas and Petrovic, 2000), gradient similarity metric (QGS) (Liu et al., 2011), weighted structural similarity metric (WSSIM) (Piella and Heijmans, 2003), and multi-scale structural similarity (NSSIM) (Ma et al., 2015). Among these metrics, SF, AG, PS, and STD quantify the amount of details reserved in the fusion image, E measures the intensity distribution of the fusion image, QCB measures the amount of the preserved contrast information of the fusion image compared to the source images, VIFF measures the information fidelity of the fusion image with respect to the source images, Qabf measures the amount of the preserved edge information of the fusion image compared to the source images, QGS measures the gradient similarity of the fusion image and the corresponding source images, and WSSIM and NSSIM both measure the structural information of the fusion image preserved from the source images. Overall, the 11 selected metrics can quantitatively evaluate the fusion images of different image fusion methods from various aspects, and the larger values of all the 11 metrics indicate the better performance of the corresponding image fusion method.
Among the 10 comparison methods, IFCNN and DRBIF can be directly used to fuse color images, and the other eight fusion methods can only fuse gray-scale images directly. Thus, DWT, GFF, LPSR, U2Fusion, DDcGAN, EMFusion, LEGFF0, and our method can be directly applied to fuse the pair of gray-scale CT and MR images in the CT-MR image dataset. As for fusing images in the PET-MR and SPECT-MR image datasets, the color image (PET or SPECT image) is first transformed from the RGB color space to the YCbCr color space. Then, these eight methods fuse the Y channel of the color image and the gray-scale MR image together. Finally, the fused color image is generated by concatenating the fused gray-scale image and Cb and Cr channels of the original color image, and transforming the fused image in the YCbCr color space back to the RGB color space. Moreover, most quantitative metrics are designed to quantify the quality of gray-scale fusion images. Thus, during computing the quantitative metric values on the PET-MR and SPECT-MR image datasets, we covert the color source image and the corresponding color fusion image to the YCbCr color space and take their Y channels to compute the metric value of this color fusion image. Finally, code of our proposed method will be released on https://github.com/uzeful/LEGFF.
In this subsection, the 10 image fusion methods are evaluated by the qualitative method, i.e., comparing their fusion results through visual observation. Specifically, we have shown three comparison examples of the 10 image fusion methods in Figures 6–8, respectively.
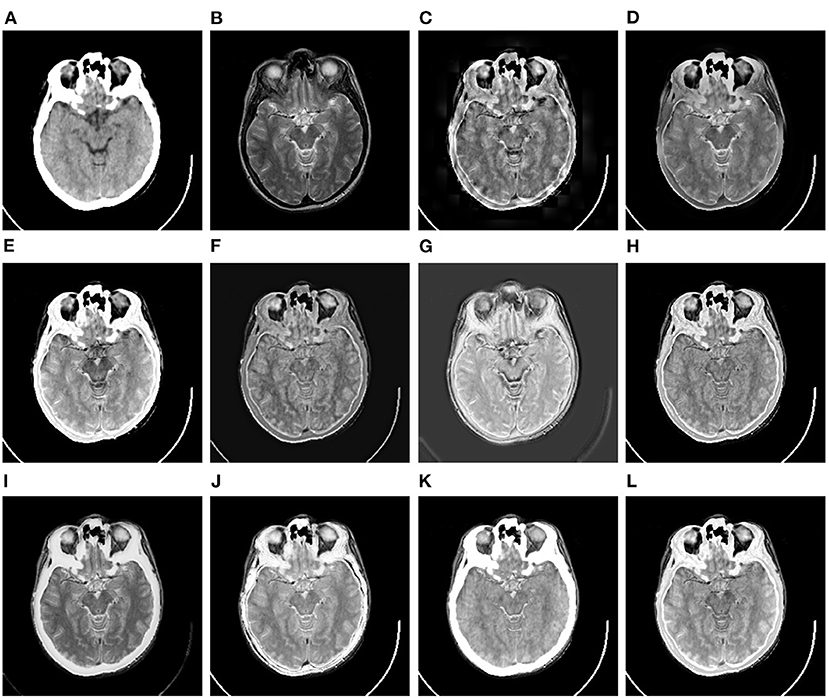
Figure 6. Comparison example on the CT-MR image dataset. (A,B) are the original CT image and MR image, respectively. (C–L) are the fusion results of DWT, GFF, LPSR, U2Fusion, DDcGAN, IFCNN, EMFusion, DRBIF, LEGFF0, and our method, respectively.
Figure 6 shows a set of fusion results of the 10 image fusion methods on the CT-MR image dataset. It can be seen from Figure 6C that the fusion image of DWT demonstrates severe blocking effect around the head. Figures 6D,F reflect that the fusion images of GFF and U2Fusion are of relatively low contrast. Figure 6G shows that the background of the DDcGAN's fusion image becomes gray and leads to low-contrast effect. It can be seen from Figures 6I,K that EMFusion and LEGFF0 fail to integrate the textures of soft tissues in the skull region of the original MR image into their fusion images. Figure 6J shows that DRBIF fails to integrate several parts of skull region of the original CT image into its fusion image. Finally, the fusion images of LPSR, IFCNN, and our method in Figures 6E,H,J achieve the best visual effect among all the fusion images, i.e., having better contrast and integrating the salient textures of the original MR image and CT image into their fusion images.
Figure 7 shows a set of fusion results of the 10 image fusion methods on the PET-MR image dataset. It can be seen from Figure 7C that the intensities of the bottom part of DWT's fusion image are significantly lower than that of the original MR image in Figure 7B. Figure 7E shows that the intensities of the bottom right of LPSR's fusion image are slightly lower than that of the original MR image in Figure 7B. The fusion results of U2Fusion and DDcGAN in Figures 7F,G have much lower contrast than those of other methods. Figure 7H shows that the color style of IFCNN's fusion image is significantly changed as compared to that of the original PET image in Figure 7A. Figures 7J,K show that DRBIF and LEGFF0 fail to integrate some dark features of the MR image into their fusion images. Overall, the fusion images of GFF, EMFusion, and our method in Figures 7D,I,L integrate most salient features of the original PET and MR images into their fusion images, but contrast of EMFusion's fusion image is a little lower than that of GFF's fusion image and ours.
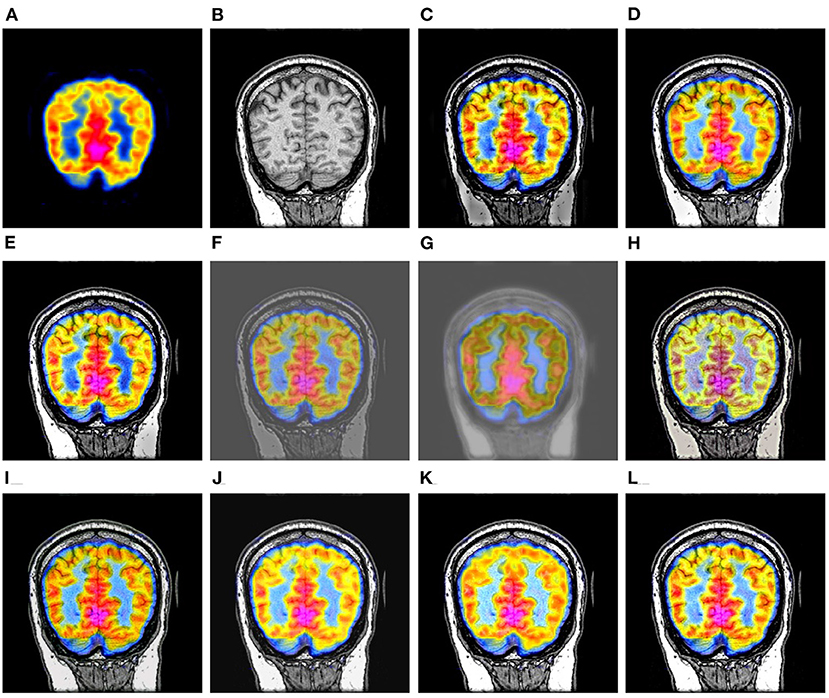
Figure 7. Comparison example on the PET-MR image dataset. (A,B) are the original PET image and MR image, respectively. (C–L) are the fusion results of DWT, GFF, LPSR, U2Fusion, DDcGAN, IFCNN, EMFusion, DRBIF, LEGFF0, and our method, respectively.
Figure 8 shows a set of fusion results of the 10 image fusion methods on the SPECT-MR image dataset. We can see from Figure 8C that the fusion image of DWT loses a few textures around the center regions of the two eyes. It can be seen from Figures 8D,E that GFF and LPSR only integrate a few details of the bottom skull region of the original MR image into their fusion images. The fusion image of U2Fusion and DDcGAN in Figures 8F,G still have the defect of lower contrast and gray background. The fusion image of IFCNN in Figure 8H is of low contrast compared to the original SPECT and MR images in Figures 8A,B. Figure 8J shows that the color style of DRBIF's fusion image is significantly different from that of the original SPECT image in Figure 8A and DRBIF fails to integrate a few bright features of the original MR image into its fusion image due to its relatively high intensity. Figure 8K shows that LEGFF0 fails to integrate many bright features of the original MR image into its fusion image. Overall, the fusion images of DWT, EMFusion, and our method in Figures 8C,I,L exhibit the best visual effects among all the fusion images, but the salient features integrated in our fusion image are more complete than those integrated in the fusion images of DWT and EMFusion.
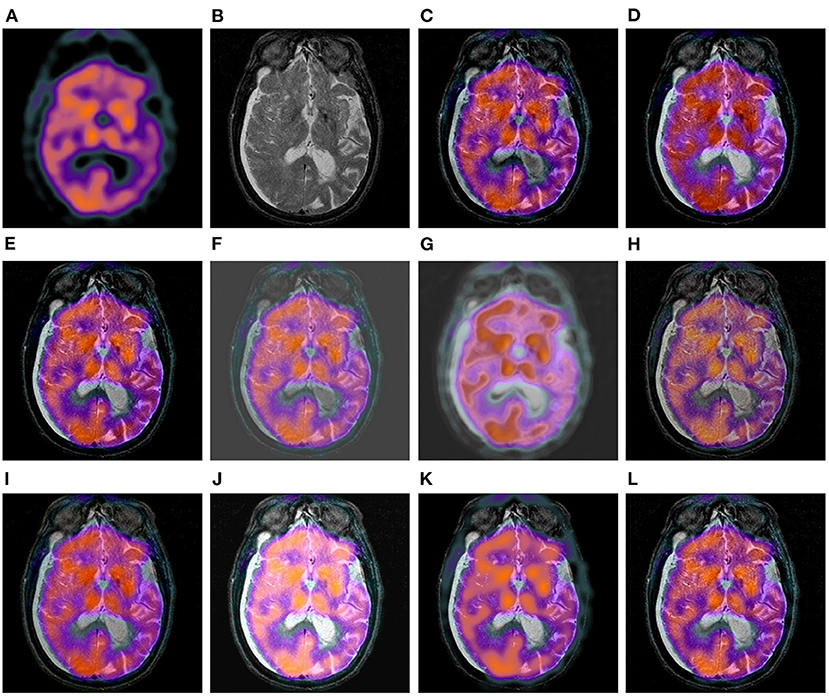
Figure 8. Comparison example on the SPECT-MR image dataset. (A,B) are the original SPECT image and MR image, respectively. (C–L) are the fusion results of DWT, GFF, LPSR, U2Fusion, DDcGAN, IFCNN, EMFusion, DRBIF, LEGFF0, and our method, respectively.
The three comparison examples could verify that the proposed method can effectively fuse the salient bright and dark features of the multi-modal brain images into a comprehensive fusion image, and outperforms the eight SOTA image fusion methods according to the visual comparison results. Moreover, through visually comparing the fusion results of LEGFF0 and our method, it could be verified that the incorporation of the local extreme map guidance is critical for improving the feature extraction ability and feature fusion ability of the guided image filter.
The quantitative metric values of the eight image fusion methods are first calculated according to their fusion results on each dataset, then the average metric values of the eight methods on each dataset are listed in Tables 1–3, respectively. In each table, the values in the bold, underline, and italic fonts indicate the best, second-best and third-best results, respectively.
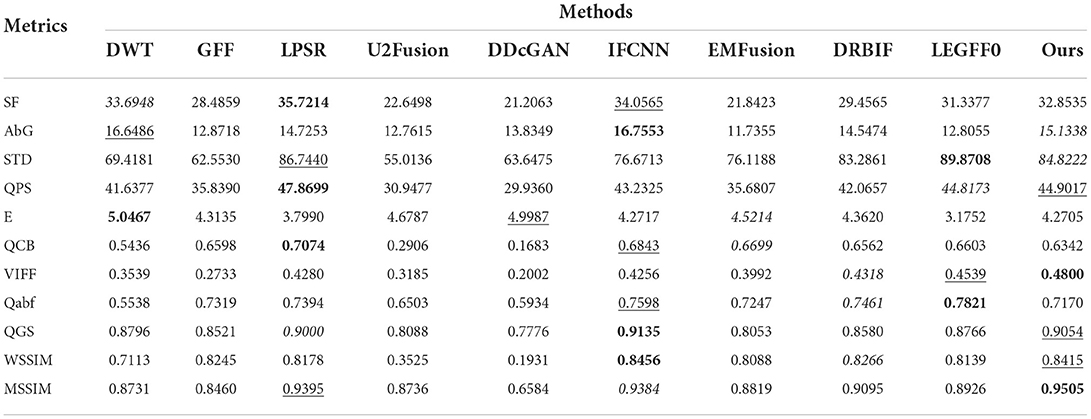
Table 1. Quantitative evaluation results on the CT-MRI dataset.
It can be seen from Table 1 that the proposed method has achieved the best performance on two metrics (i.e., VIFF and NSSIM), obtained second-best performance on three metrics (i.e., PS, QGS, and WSSIM), ranked the third place on the STD metric on the CT-MR image dataset. To be specific, the largest VIFF and NSSIM values and second-largest QGS and WSSIM values of our method suggest that our fusion images have preserved relatively more edge and structural information from the original CT and MR images than the fusion images of other methods. The second-largest PS value and the third-largest STD value of our method indicate that the fusion images of our method have slightly more textural details than those generated by the other eight comparison methods. Since in our method the base images of the source images are fused as their elementwise-maximum values, thus intensity distribution of our fusion images might be not that uniform along the gray-scale space leading to relatively lower E and QCB values. Besides our method, LPSR has achieved the best performance on three metrics (i.e., SF, PS, and QCB) and the second performance on two metrics (i.e., STD and MSSIM) and IFCNN has achieved the best performance on three metrics (i.e., AbG, QGS, and WSSIM) and the second performance on three metrics (i.e., SF, QCB, and Qabf). Overall, consistent to the qualitative comparison results, the quantitative evaluation results in Table 1 shows LPSR, IFCNN, and our method perform slightly better than the other seven methods on fusing the CT and MR images.
Table 2 shows that our method has achieved the best performance on eight metrics (i.e., SF, AbG, PS, QCB, VIFF, Qabf, QGS, and WSSIM) and the second-best performance on two metrics (i.e., STD and MSSIM). As addressed previously, the E metric value of our method is relatively lower than those of other methods, due to our usage of the elementwise-maximum strategy for fusing the base images. Overall, the quantitative evaluation results on the PET-MR image dataset suggest our method significantly outperforms the other nine methods by a large margin in particular on fusing the PET and MR images. This conclusion is also consistent to the visual comparison results from Figure 7.
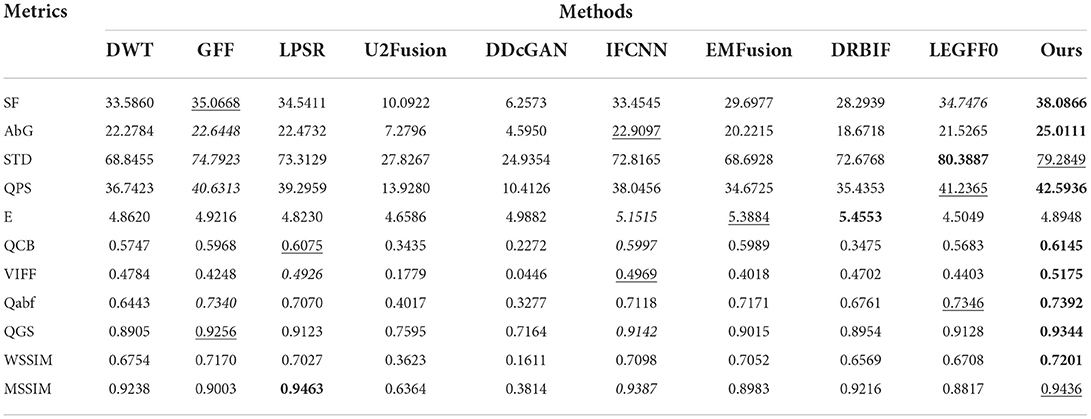
Table 2. Quantitative evaluation results on the PET-MRI dataset.
Finally, it can be seen from Table 3 that our method has ranked the first place on six metrics (i.e., SF, AbG, QCB, Qabf, WSSIM, and MSSIM), ranked the second place on the QPS, VIFF, and QGS metrics, and ranked the third place on the STD metric. Besides, DRBIF have obtained the best performance on five metrics (i.e., STD, QPS, E, VIFF, and QGS) and the second place on three metrics (i.e., SF, AbG, and MSSIM). These results suggest the fusion images of our method and DRBIF have more textural details and persevered more structural information from the original SPECT and MR images compared to those of the other eight methods. Moreover, the quantitative results in Tables 1–3 indicate that our method with the local extreme map guidance significantly outperforms that without the local extreme map guidance. Thus, the incorporation of the local extreme map guidance is effective for fusing the multi-modal medical images.
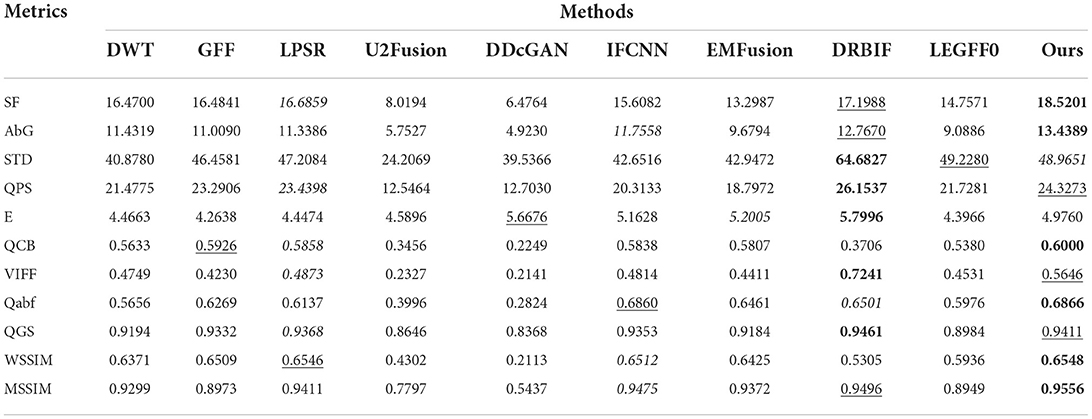
Table 3. Quantitative evaluation results on the SPECT-MRI dataset.
Besides, in order to test the efficiency of our proposed method, we have compared the average time cost of each method on the SPECT-MRI image dataset. All methods were evaluated on the same computation platform with Intel Core i7-11700K CPU and NVIDIA GeForce RTX 3090 GPU. The evaluation results have been listed in Table 4. It can be seen from Table 4 that LPSR and DWT run much faster than the other methods. As for our method, it costs about 0.1230 s to fuse a pair of multi-modal brain images, and it is slightly faster than three deep learning based methods including U2Fusion, DDcGAN, and EMFusion. Therefore, in term of time cost evaluation, the proposed method is relatively time-efficient as compared to the other nine comparison methods. Moreover, in order to verify the generalization ability of our method, we have apply it to fuse other modalities of images, including the multi-focus images, infrared and visual images, multi-exposure images, and green-fluorescent and phase-contrast protein images. Figure 9 shows that our method can well integrate the salient features of each pair of source images into the corresponding fusion images. Thus, the good fusion results in Figure 9 can verify the good generalization ability of our method for fusing other modalities of images. Overall, both qualitative and quantitative evaluation results indicate that our method performs comparably to or even better than eight SOTA image fusion methods and owns good generalization ability.

Table 4. Time cost comparison.
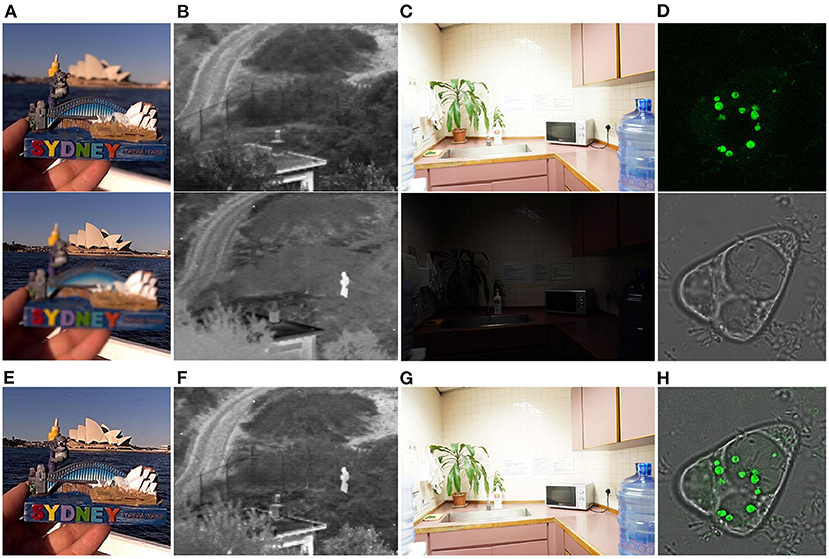
Figure 9. Our fusion results on other modalities of images. (A) Shows a pair of multi-focus images (Nejati et al., 2015). (B) Shows a pair of visual and infrared images (Toet, 2017). (C) Shows a pair of over- and under-exposed images (Xu et al., 2020b). (D) Shows a pair of green-fluorescent and phase-contrast protein images (Tang et al., 2021). (E–H) are the fusion results of (A–D), respectively.
Even though the experimental results validate the advantages of our image fusion method, there still exist several limitations in our method. At first, our local extreme map guided image filter is constructed on the basis of the guided image filter, thus the feature extraction ability of our filter will be inevitably impacted by that of the original guided image filter. Second, compared to LEGFF0 (which uses the original guided filter solely for feature extraction and image fusion), the time cost of our image fusion method increases by a large margin due to iterative calculation of local extreme maps. In future, with the development of guided image filter, performance of our image fusion method can be further boosted by incorporating more advanced guided image filter. Moreover, integrating the local extreme map guidance and the deep-learning frameworks is another way to simultaneously improve the performance and efficiency of the local extreme map guided image fusion methods. Finally, the proposed image fusion method does not contain the image denoising and registration procedures, thus before applying our method in the clinical scenarios the pair of multi-modal source images should be denoised and aligned first.
In this study, we propose an effective multi-modal brain image fusion method based on a local extreme map guided image filter. The local extreme map guided image filter can well smooth the image, thus it can further be used to extract the salient bright and dark features of the image. By iteratively applying this local extreme map guided image filter, our method is able to extract multiple scales of bright and dark features from the multi-modal brain images, and integrate these salient features into one informative fusion image. Extensive experimental results suggest that the proposed method outperforms eight SOTA image fusion methods from both qualitative and quantitative aspects and it demonstrates very good generalization ability to fuse other modalities of images. Therefore, the proposed method exhibits great possibility to apply in the real clinical scenarios.
Publicly available datasets were analyzed in this study. This data can be found here: http://www.med.harvard.edu/aanlib. Code and used images are available at https://github.com/uzeful/LEGFF.
YZ and QZ designed the study. YZ, WX, SZ, and JS performed data analysis. YZ wrote the manuscript. QZ, LZ, XB, and RW revised the manuscript. All authors contributed to the article and approved the final submitted version.
This study was supported in part by the National Key Research and Development Program of China under Grant No. 2019YFB1311301, in part by the National Natural Science Foundation of China under Grant Nos. 62171017, 61871248, 62132002, 62173005, and 61976017, in part by the Beijing Natural Science Foundation under Grant No. 4202056, and in part by China Postdoctoral Science Foundation under Grant No. 2021M690297.
The authors declare that the research was conducted in the absence of any commercial or financial relationships that could be construed as a potential conflict of interest.
All claims expressed in this article are solely those of the authors and do not necessarily represent those of their affiliated organizations, or those of the publisher, the editors and the reviewers. Any product that may be evaluated in this article, or claim that may be made by its manufacturer, is not guaranteed or endorsed by the publisher.
Bai, X., Zhang, Y., Zhou, F., and Xue, B. (2015). Quadtree-based multi-focus image fusion using a weighted focus-measure. Inform. Fus. 22, 105–118. doi: 10.1016/j.inffus.2014.05.003
Chen, Y., and Blum, R. S. (2009). A new automated quality assessment algorithm for image fusion. Image Vis. Comput. 27, 1421–1432. doi: 10.1016/j.imavis.2007.12.002
Gan, W., Wu, X., Wu, W., Yang, X., Ren, C., He, X., et al. (2015). Infrared and visible image fusion with the use of multi-scale edge-preserving decomposition and guided image filter. Infrared Phys. Technol. 72, 37–51. doi: 10.1016/j.infrared.2015.07.003
Han, Y., Cai, Y., Cao, Y., and Xu, X. (2013). A new image fusion performance metric based on visual information fidelity. Inform. Fus. 14, 127–135. doi: 10.1016/j.inffus.2011.08.002
He, K., Sun, J., and Tang, X. (2012). Guided image filtering. IEEE Trans. Pattern Anal. Mach. Intell. 35, 1397–1409. doi: 10.1109/TPAMI.2012.213
Li, H., Manjunath, B., and Mitra, S. K. (1995). Multisensor image fusion using the wavelet transform. Graph. Models Image Process. 57, 235–245. doi: 10.1006/gmip.1995.1022
Li, H., and Wu, X.-J. (2018). DenseFuse: a fusion approach to infrared and visible images. IEEE Trans. Image Process. 28, 2614–2623. doi: 10.1109/TIP.2018.2887342
Li, S., Kang, X., and Hu, J. (2013). Image fusion with guided filtering. IEEE Trans. Image Process. 22, 2864–2875. doi: 10.1109/TIP.2013.2244222
Li, S., and Yang, B. (2008). Multifocus image fusion using region segmentation and spatial frequency. Image Vis. Comput. 26, 971–979. doi: 10.1016/j.imavis.2007.10.012
Liu, Y., Chen, X., Peng, H., and Wang, Z. (2017). Multi-focus image fusion with a deep convolutional neural network. Inform. Fus. 36, 191–207. doi: 10.1007/978-3-319-42999-1
Liu, Y., Chen, X., Wang, Z., Wang, Z. J., Ward, R. K., and Wang, X. (2018). Deep learning for pixel-level image fusion: recent advances and future prospects. Inform. Fus. 42, 158–173. doi: 10.1016/j.inffus.2017.10.007
Liu, Y., Chen, X., Ward, R. K., and Wang, Z. J. (2019). Medical image fusion via convolutional sparsity based morphological component analysis. IEEE Signal Process. Lett. 26, 485–489. doi: 10.1109/LSP.2019.2895749
Liu, Y., Liu, S., and Wang, Z. (2015). A general framework for image fusion based on multi-scale transform and sparse representation. Inform. Fus. 24, 147–164. doi: 10.1016/j.inffus.2014.09.004
Liu, Y., Mu, F., Shi, Y., and Chen, X. (2022a). SF-Net: a multi-task model for brain tumor segmentation in multimodal MRI via image fusion. IEEE Signal Process. Lett. 29, 1799–1803. doi: 10.1109/LSP.2022.3198594
Liu, Y., Mu, F., Shi, Y., Cheng, J., Li, C., and Chen, X. (2022b). Brain tumor segmentation in multimodal MRI via pixel-level and feature-level image fusion. Front. Neurosci. 16:1000587. doi: 10.3389/fnins.2022.1000587
Liu, Y., Shi, Y., Mu, F., Cheng, J., and Chen, X. (2022c). Glioma segmentation-oriented multi-modal mr image fusion with adversarial learning. IEEE/CAA J. Autom. Sin. 9, 1528–1531. doi: 10.1109/JAS.2022.105770
Liu, Y., Shi, Y., Mu, F., Cheng, J., Li, C., and Chen, X. (2022d). Multimodal MRI volumetric data fusion with convolutional neural networks. IEEE Trans. Instrum. Meas. 71, 1–15. doi: 10.1109/TIM.2022.3184360
Liu, Y., Wang, L., Cheng, J., Li, C., and Chen, X. (2020). Multi-focus image fusion: a survey of the state of the art. Inform. Fus. 64, 71–91. doi: 10.1016/j.inffus.2020.06.013
Liu, Z., Blasch, E., Xue, Z., Zhao, J., Laganiere, R., and Wu, W. (2011). Objective assessment of multiresolution image fusion algorithms for context enhancement in night vision: a comparative study. IEEE Trans. Pattern Anal. Mach. Intell. 34, 94–109. doi: 10.1109/TPAMI.2011.109
Ma, J., Ma, Y., and Li, C. (2019a). Infrared and visible image fusion methods and applications: a survey. Inform. Fus. 45, 153–178. doi: 10.1016/j.inffus.2018.02.004
Ma, J., Xu, H., Jiang, J., Mei, X., and Zhang, X.-P. (2020). DDcGAN: a dual-discriminator conditional generative adversarial network for multi-resolution image fusion. IEEE Trans. Image Process. 29, 4980–4995. doi: 10.1109/TIP.2020.2977573
Ma, J., Yu, W., Liang, P., Li, C., and Jiang, J. (2019b). FusionGAN: a generative adversarial network for infrared and visible image fusion. Inform. Fus. 48, 11–26. doi: 10.1016/j.inffus.2018.09.004
Ma, K., Zeng, K., and Wang, Z. (2015). Perceptual quality assessment for multi-exposure image fusion. IEEE Trans. Image Process. 24, 3345–3356. doi: 10.1109/TIP.2015.2442920
Nejati, M., Samavi, S., and Shirani, S. (2015). Multi-focus image fusion using dictionary-based sparse representation. Infm. Fusion. 25, 72–84. doi: 10.1016/j.inffus.2014.10.004
Piella, G., and Heijmans, H. (2003). “A new quality metric for image fusion,” in Proceedings 2003 International Conference on Image Processing (Cat. No. 03CH37429), Vol. 3. IEEE (Barcelona), 111–173. doi: 10.1109/ICIP.2003.1247209
Tang, W., Liu, Y., Cheng, J., Li, C., and Chen, X. (2021). Green fluorescent protein and phase contrast image fusion via detail preserving cross network. IEEE Trans. Comput. Imag. 7, 584–597. doi: 10.1109/TCI.2021.3083965
Toet, A. (2017). The TNO multiband image data collection. Data Breif. 15, 249–251. doi: 10.1016/j.dib.2017.09.038
Wang, A., Luo, X., Zhang, Z., and Wu, X.-J. (2022). A disentangled representation based brain image fusion via group lasso penalty. Front. Neurosci. 16:937861. doi: 10.3389/fnins.2022.937861
Wang, K., Zheng, M., Wei, H., Qi, G., and Li, Y. (2020). Multi-modality medical image fusion using convolutional neural network and contrast pyramid. Sensors 20, 2169. doi: 10.3390/s20082169
Xu, H., and Ma, J. (2021). EMFusion: an unsupervised enhanced medical image fusion network. Inform. Fus. 76, 177–186. doi: 10.1016/j.inffus.2021.06.001
Xu, H., Ma, J., Jiang, J., Guo, X., and Ling, H. (2020a). U2Fusion: a unified unsupervised image fusion network. IEEE Trans. Pattern Anal. Mach. Intell. 44, 502–518. doi: 10.1109/TPAMI.2020.3012548
Xu, H., Ma, J., and Zhang, X. -P. (2020b). MEF-GAN: Multi-exposure image fusion via generative adversarial networks. IEEE Trans. Imag. Process. 29, 7203–7316. doi: 10.1109/TIP.2020.2999855
Xydeas, C. S., and Petrovic, V. S. (2000). “Objective pixel-level image fusion performance measure,” in Proceedings SPIE 4051, Sensor Fusion: Architectures, Algorithms, and Applications IV, (Orlando, FL), 89–98.
Yin, L., Zheng, M., Qi, G., Zhu, Z., Jin, F., and Sim, J. (2019). A novel image fusion framework based on sparse representation and pulse coupled neural network. IEEE Access 7, 98290–98305. doi: 10.1109/ACCESS.2019.2929303
Yin, M., Liu, X., Liu, Y., and Chen, X. (2018). Medical image fusion with parameter-adaptive pulse coupled neural network in nonsubsampled shearlet transform domain. IEEE Trans. Instrum. Meas. 68, 49–64. doi: 10.1109/TIM.2018.2838778
Zhang, Y., Bai, X., and Wang, T. (2017). Boundary finding based multi-focus image fusion through multi-scale morphological focus-measure. Inform. Fus. 35, 81–101. doi: 10.1016/j.inffus.2016.09.006
Zhang, Y., Liu, Y., Sun, P., Yan, H., Zhao, X., and Zhang, L. (2020). IFCNN: a general image fusion framework based on convolutional neural network. Inform. Fus. 54, 99–118. doi: 10.1016/j.inffus.2019.07.011
Zhou, Z., Dong, M., Xie, X., and Gao, Z. (2016). Fusion of infrared and visible images for night-vision context enhancement. Appl. Opt. 55, 6480–6490. doi: 10.1364/AO.55.006480
Zhu, Z., Yin, H., Chai, Y., Li, Y., and Qi, G. (2018). A novel multi-modality image fusion method based on image decomposition and sparse representation. Inform. Sci. 432, 516–529. doi: 10.1016/j.ins.2017.09.010
Keywords: multi-modal brain images, image fusion, image guided filter, local extreme map, bright and dark feature map
Citation: Zhang Y, Xiang W, Zhang S, Shen J, Wei R, Bai X, Zhang L and Zhang Q (2022) Local extreme map guided multi-modal brain image fusion. Front. Neurosci. 16:1055451. doi: 10.3389/fnins.2022.1055451
Received: 27 September 2022; Accepted: 11 October 2022;
Published: 28 October 2022.
Edited by:
Wei Wei, The First Affiliated Hospital of University of Science and Technology of China Anhui Provincial Hospital, ChinaReviewed by:
Huafeng Li, Kunming University of Science and Technology, ChinaCopyright © 2022 Zhang, Xiang, Zhang, Shen, Wei, Bai, Zhang and Zhang. This is an open-access article distributed under the terms of the Creative Commons Attribution License (CC BY). The use, distribution or reproduction in other forums is permitted, provided the original author(s) and the copyright owner(s) are credited and that the original publication in this journal is cited, in accordance with accepted academic practice. No use, distribution or reproduction is permitted which does not comply with these terms.
*Correspondence: Xiangzhi Bai, amFja3lieHpAYnVhYS5lZHUuY24=; Li Zhang, Y2hpbmF6aGFuZ2xpQG1haWwudHNpbmdodWEuZWR1LmNu; Qing Zhang, anN0emhhbmdxaW5nQHZpcC5zaW5hLmNvbQ==
Disclaimer: All claims expressed in this article are solely those of the authors and do not necessarily represent those of their affiliated organizations, or those of the publisher, the editors and the reviewers. Any product that may be evaluated in this article or claim that may be made by its manufacturer is not guaranteed or endorsed by the publisher.
Research integrity at Frontiers
Learn more about the work of our research integrity team to safeguard the quality of each article we publish.