
95% of researchers rate our articles as excellent or good
Learn more about the work of our research integrity team to safeguard the quality of each article we publish.
Find out more
ORIGINAL RESEARCH article
Front. Neurosci. , 12 January 2022
Sec. Autonomic Neuroscience
Volume 15 - 2021 | https://doi.org/10.3389/fnins.2021.791510
This article is part of the Research Topic Methods on the Assessment of Human Baroreflex Function View all 10 articles
 Anatoly S. Karavaev1,2,3*
 Viktoriia V. Skazkina2,4
 Ekaterina I. Borovkova1,2,3
 Mikhail D. Prokhorov2,3
 Aleksey N. Hramkov2
 Vladimir I. Ponomarenko3
 Anastasiya E. Runnova1,2
 Vladimir I. Gridnev1
 Anton R. Kiselev1,2,5Nikolay V. Kuznetsov4,6,7Leonid S. Chechurin4,6
 Thomas Penzel2,8
The influence of higher nervous activity on the processes of autonomic control of the cardiovascular system and baroreflex regulation is of considerable interest, both for understanding the fundamental laws of the functioning of the human body and for developing methods for diagnostics and treatment of pathologies. The complexity of the analyzed systems limits the possibilities of research in this area and requires the development of new tools. Earlier we propose a method for studying the collective dynamics of the processes of autonomic control of blood circulation in the awake state and in different stages of sleep. The method is based on estimating a quantitative measure representing the total percentage of phase synchronization between the low-frequency oscillations in heart rate and blood pressure. Analysis of electrocardiogram and invasive blood pressure signals in apnea patients in the awake state and in different sleep stages showed a high sensitivity of the proposed measure. It is shown that in slow-wave sleep the degree of synchronization of the studied rhythms is higher than in the awake state and lower than in sleep with rapid eye movement. The results reflect the modulation of the processes of autonomic control of blood circulation by higher nervous activity and can be used for the quantitative assessment of this modulation.
Arterial baroreflex plays an important role in the functioning of the autonomic nervous system (Subramanian et al., 2019). It is involved in the regulation of blood pressure (BP) (Osborn et al., 2005; Albaghdadi, 2007), heart rate (HR) (Lanfranchi and Somers, 2002), and respiration (Guyenet, 2014). According to a number of studies, the baroreflex and the processes of autonomic control determine the complex dynamics of blood circulation, in particular, the non-linear dynamics of heart rhythm (Tan, 2013; Ernst, 2017; Karavaev et al., 2019). It is known that autonomic control loops are sensitive to changes in the physiological state of healthy subjects (Ivanov et al., 1999; Valente et al., 2018; Ishbulatov et al., 2020). There is a significant change in baroreflex functions with aging (Sharma and Goodwin, 2006; Schumann et al., 2010; Shiogai et al., 2010; Elliott et al., 2016; Parashar et al., 2016; Natarajan et al., 2020; Pietri and Stefanadis, 2021). Impaired baroreflex regulation and impaired heart rate variability often accompany cardiovascular diseases (Kiselev et al., 2012a,b; Ponomarenko et al., 2013; Swenne, 2013; Karavaev et al., 2016). Therefore, the baroreflex sensitivity and the activity of autonomic control processes are often used to assess the physiological state of subjects and act as the markers of the development of pathologies of various systems of the body (Lázaro et al., 2019; Hadaya and Ardell, 2020; Wessel et al., 2020).
The regulation of the cardiovascular system and respiration is influenced by cortical structures that influence the baroreflex regulation under normal conditions (Furness, 2006; Duschek et al., 2013; Jerath and Beveridge, 2020) and during the development of pathologies (Lewis et al., 2006; Molkov et al., 2014). Considerable attention of researchers is paid to the peculiarities of baroreflex regulation and autonomic control of cardiovascular system during sleep (Brandenberger et al., 2003). The analysis of experimental signals in such studies involves the use of different methods for the assessment of baroreflex function and autonomic control (Shaffer and Ginsberg, 2017). Historically, the first are methods of statistical, correlation, and spectral analysis of RR-intervals (Task Force of the European Society of Cardiology [TFESC], 1996), which reflect the processes of frequency modulation of the HR by the autonomic control loops (Prokhorov et al., 2021). The analysis of RR-intervals traditionally includes the study of the so-called Low-Frequency (LF) band (0.04–0.14 Hz), which is mainly associated with the processes of sympathetic control of heart rate (Wagner and Persson, 1998), and the High-Frequency (HF) band (0.14–0.40 Hz), which is associated with the processes of parasympathetic control (Task Force of the European Society of Cardiology [TFESC], 1996; Lewis et al., 2006). Information about sympathetic regulation of blood pressure can be obtained by analyzing blood pressure signals in the LF-band (O’Leary and Woodbury, 1996; Elstad et al., 2011; Orini et al., 2012). At the same time, the frequency components of the blood pressure signal in the HF-band are mainly associated with the mechanical conduct of the respiration process into the vessels (Bernardi et al., 1996; Dash et al., 2010; Javed et al., 2010).
Despite considerable interest in the problem, the existing number of works describing the activity of autonomic control loops in the awake state and in different sleep stages: rapid eye movement (REM) and non-REM (NREM) demonstrates some contradictory results. In particular, in a seminal study (Somers et al., 1993) it is noted that the activity of the sympathetic branch of the autonomic control system increases in the REM sleep and decreases in the stages of NREM sleep relative to the awake state. Other studies show a decrease (Berlad et al., 1993; Parmeggiani, 1994), increase (Hornyak et al., 1991; Somers et al., 1993; Van de Borne et al., 1994) or the absence of changes (Vanoli et al., 1995) in the activity of sympathetic regulation of blood circulation in REM sleep compared with NREM sleep (Elsenbruch et al., 1999) showed a statistical difference between spectral assessments of the signals of systolic blood pressure (SBP), diastolic blood pressure and RR-intervals in the awake state, NREM and REM sleep; and (Legramante et al., 2003) shows their significant fluctuation depending on the sequence of the REM and NREM stages during the night.
The study (Zemaityte et al., 1984) revealed increases in the activity of the parasympathetic branch of the autonomic nervous system during REM sleep and decreases in NREM sleep state relative to the waking state. Such observations are explained by the modulation of the activity of the centers of autonomic control by the processes of higher nervous activity (Van Roon et al., 2004; Cheng et al., 2010).
In addition to the use of typical spectral assessments, baroreflex sensitivity assessments are often used (Laude et al., 2004; La Rovere et al., 2008; Maestri et al., 2009). However, the effectiveness of its use for the diagnosis of different sleep stages remains an open question. Thus, an increase in the sensitivity of the arterial baroreflex in sleep was noted in Smyth et al. (1969), Conway et al. (1983), Pagani et al. (1988), Parati et al. (1988), and Van de Borne et al. (1994). Moreover, special experiments have shown that an increase in baroreflex sensitivity is not a simple consequence of decreasing in mean arterial pressure during sleep (Smyth et al., 1969). The authors of Bristow et al. (1969) and Nakazato et al. (1998) show no significant changes in different sleep stages.
Furthermore, it is worth noting, that although several methods have been developed to study baroreflex sensitivity in humans, most of these techniques are of limited value for daily practice and require specialized pharmacological or mechanical manipulations (Smyth et al., 1969; Eckberg et al., 1975; Palmero et al., 1981; Airaksinen et al., 1993; Bernardi et al., 1995; Mortara et al., 1997; Pinna et al., 2000).
Nevertheless, the study of baroreflex function and autonomic control during sleep is of great importance in patients and healthy subjects, and research interest in this issue does not decrease (Guilleminault et al., 1981; Lombardi et al., 2019).
Thus, although the analysis of heart rate variability properties seems to correlate with the psychophysical state of the patient and the baroreflex function is associated with sleep stages, the sensitivity of linear analysis methods is limited (Billman, 2013).
Therefore, more sensitive non-linear methods of analysis are used in recent years. Such methods aim at assessing different measures of complexity in RR-intervals and blood pressure signals (Pichot et al., 2016; Ishaque et al., 2021). Earlier in the work (Karavaev et al., 2009) we proposed a quantitative measure representing the total percentage S of phase synchronization between the LF oscillations in RR-intervals and BP (Karavaev et al., 2021). In the works (Kiselev et al., 2012a,b, 2016b), we showed that the previously proposed method (Karavaev et al., 2009) is promising for solving problems of medical diagnostics. This measure allows us to predict the development of complications of myocardial infarction (Kiselev et al., 2012a), to select the drug therapy for arterial hypertension (Kiselev et al., 2012b), and to obtain important information about the structure of interactions between the elements of autonomic control of the cardiovascular system (Kiselev et al., 2020). In work (Ponomarenko et al., 2021), we showed a change in the coherence of respiration processes and parasympathetic regulation of the heart rate in the HF-band in the awake state and different stages of sleep. However, studies of the synchronization of the processes of autonomic control of blood circulation in the LF-band with changes in the physiological state of the subjects during sleep and awake state remain unknown.
Therefore, the purpose of this work is to identify changes in the synchronization of processes of autonomic control of the HR and BP when analyzing the LF-components of RR-intervals and blood pressure signals in the awake state, REM and NREM stages of sleep, as well as to study the possibility of classifying such states during the analysis of synchronization and other assessments characterizing the properties of heart rate variability (Task Force of the European Society of Cardiology [TFESC], 1996) and baroreflex sensitivity (Pagani et al., 1988).
Figure 1 shows a simplified schematic illustration of the object of study. The autonomic nervous system is actively involved in the control of HR and BP, using baroreflex functions (Task Force of the European Society of Cardiology [TFESC], 1996; Ringwood and Malpas, 2001). The work (Kiselev et al., 2020) shows, this control is provided by relatively independent processes that interact with each other. Information about the processes of autonomic control of HR and BP can be extracted from the LF-components of RR-intervals and BP signals (Task Force of the European Society of Cardiology [TFESC], 1996; Ringwood and Malpas, 2001; Prokhorov et al., 2003). It shows that these LF-components can be synchronized, and the degree of their synchronization correlates with the state of the cardiovascular system (Karavaev et al., 2009). It is known that the wake-sleep state control network of the central nervous system modulates the activity of the elements of the autonomic nervous system, and this influence changes during the transition from the awake state to sleep stages (Van Roon et al., 2004; Cheng et al., 2010). Thus, the degree of synchronization between the processes of autonomic control of HR and BP should reflect the effect of the wake-sleep state control network of the central nervous system on the autonomic nervous system.
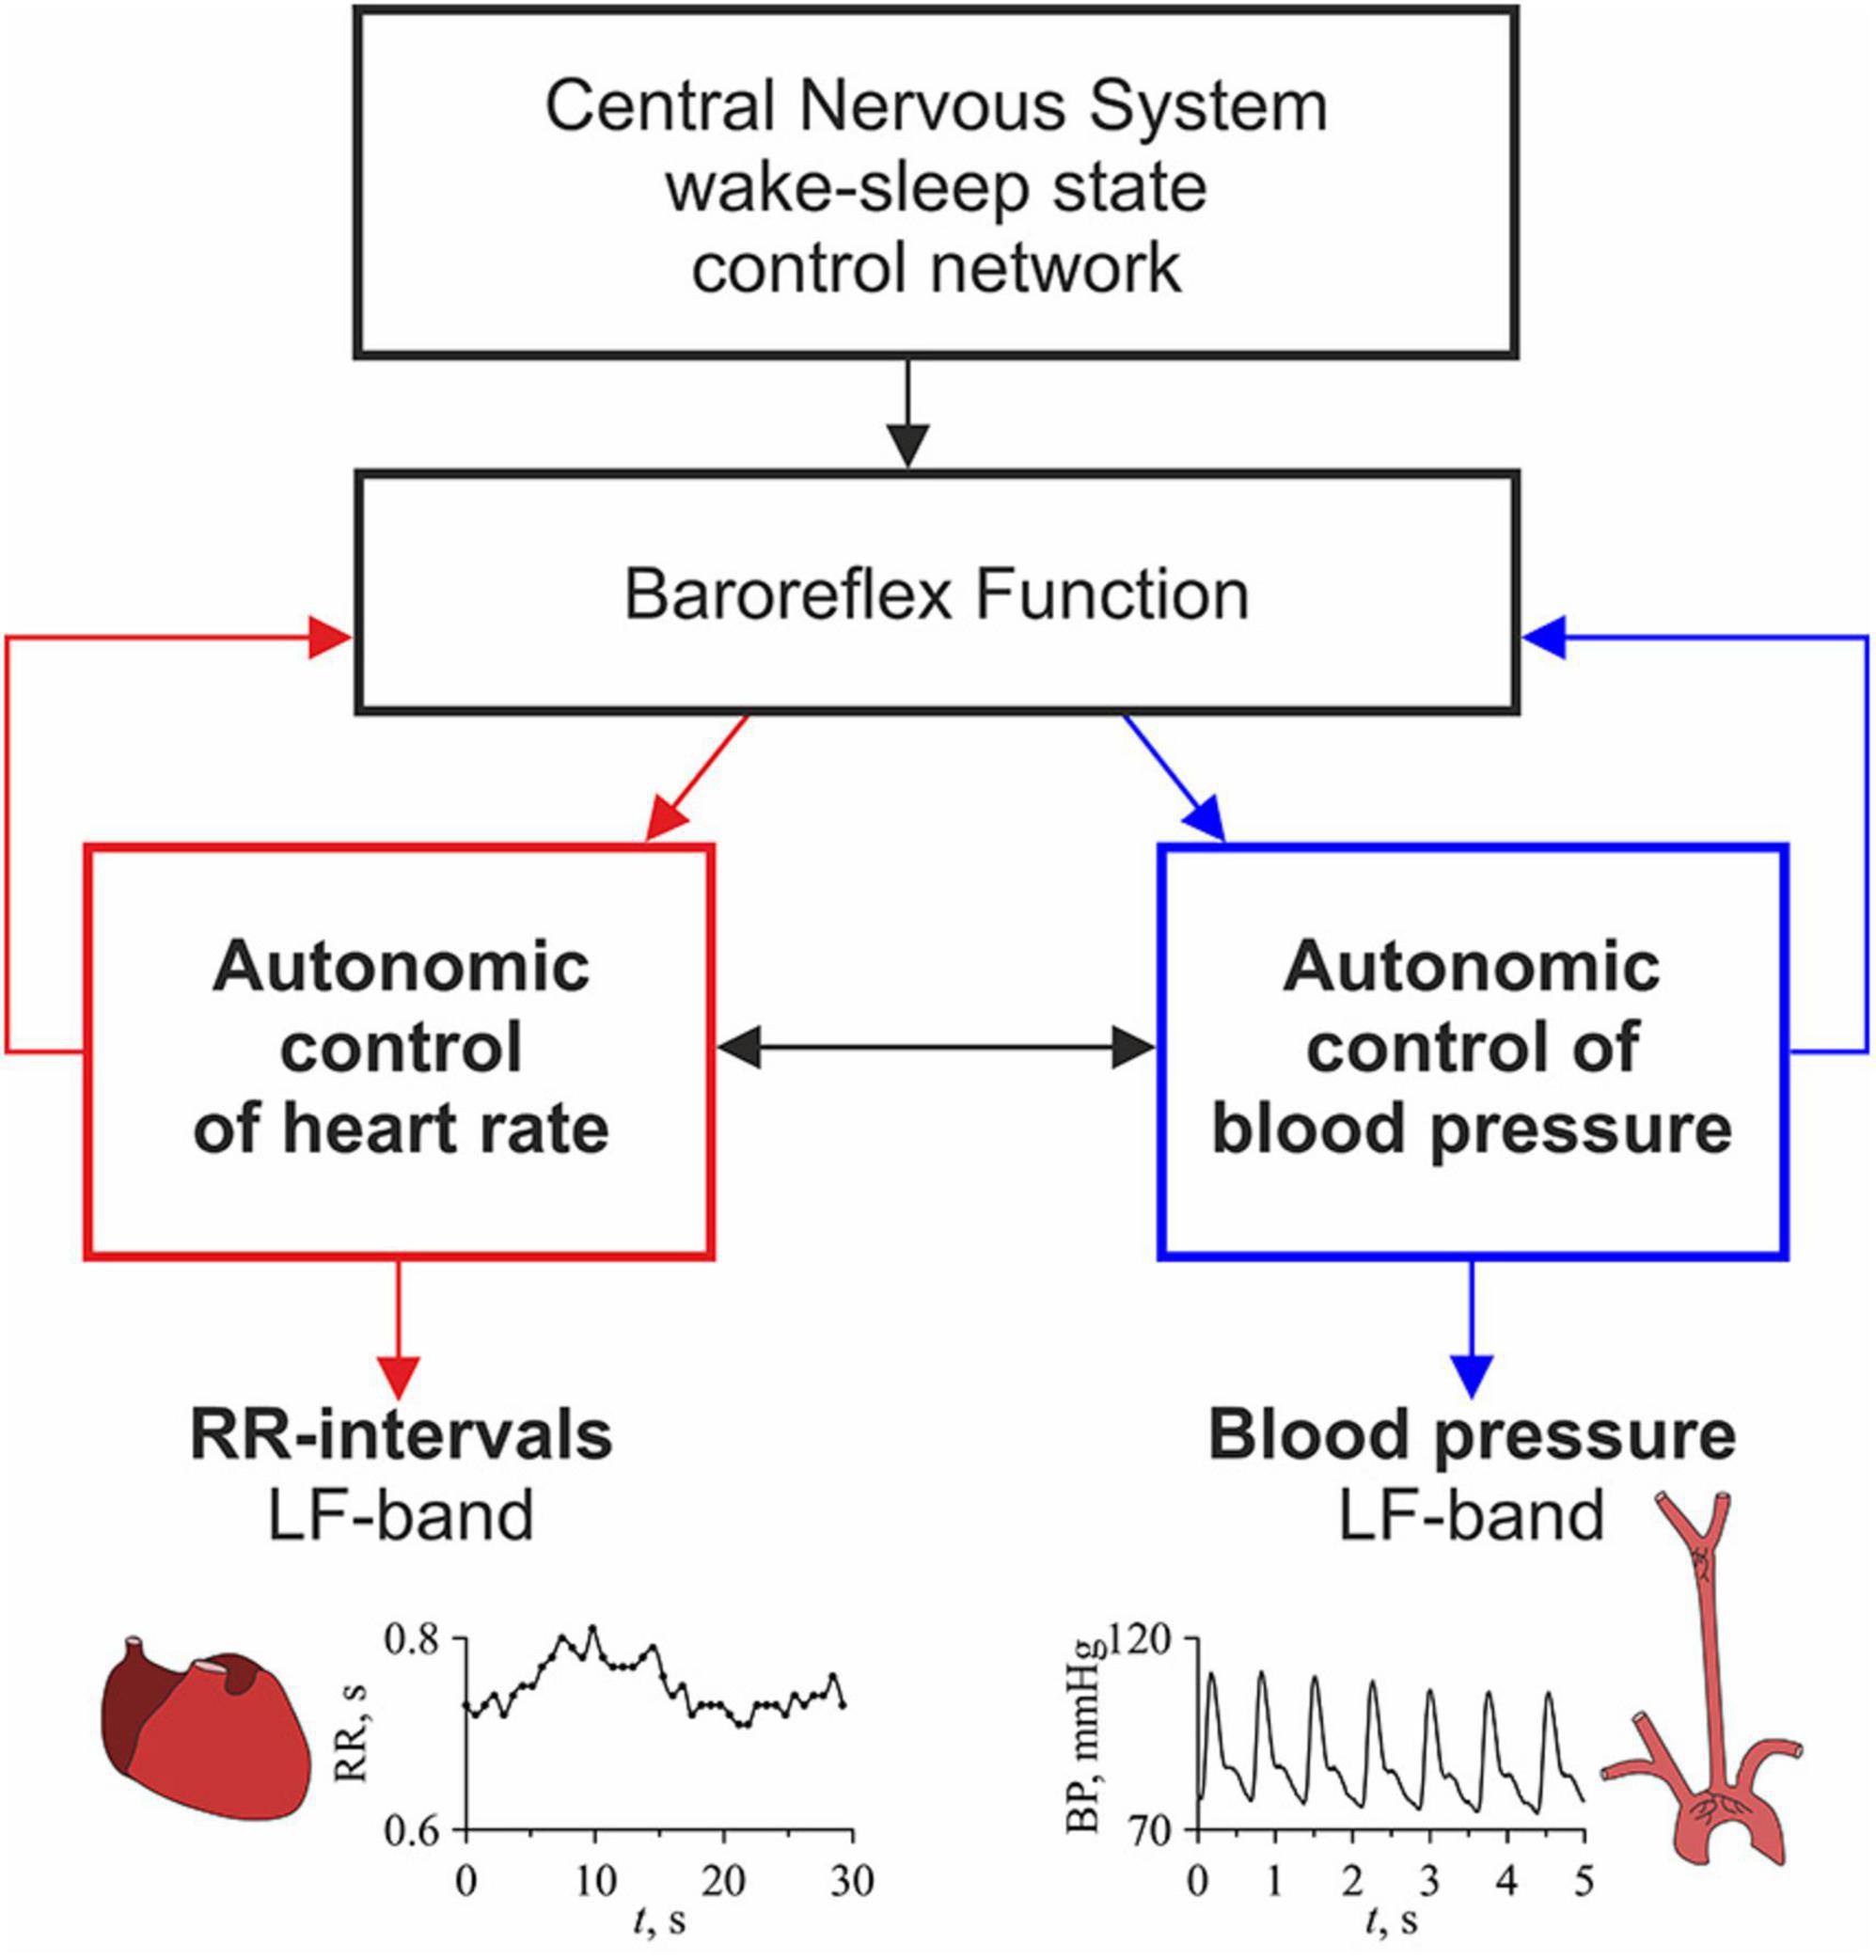
Figure 1. A simplified schematic illustration of the study.
We analyzed the electrocardiogram (ECG), BP, and respiration signals of 22 male patients (mean age 52 ± 10 years, body mass index 32.4 ± 6.0 kg/m2) obtained in a clinical study (Peter et al., 1989; Grote et al., 1995). All patients were hospitalized due to obstructive breathing disorders during sleep (mean respiratory disturbance index 47.2 ± 27.3 n/h), and arterial hypertension was also revealed in the patients. Recordings were made before the therapy.
The ECG signal was recorded in standard lead I according (Kligfield et al., 2007). The BP signal (time dependence of blood pressure during invasive arterial pressure monitoring) was recorded with an invasive monitoring system from the radial is artery. The respiration signal was recorded with a flowing oronasal airflow. All signals were filtered with the bandpass of 0.03–45 Hz and sampled at 100 Hz. For each subject, we extracted three 20-min fragments from the night record, one corresponding to the awake state, one to the stage S3 of NREM sleep, and one to REM sleep. The awake state and sleep stages were scored in accordance with the recommendations of Rechtschaffen and Kales (1968) by means of electro-oculogram, electroencephalogram, and electromyogram. The analyzed fragments did not contain artifacts or long periods of apnea.
To analyze the degree of synchronization between the LF oscillations in HR and BP, we use a quantitative measure representing the total percentage S of phase synchronization of the studied processes. The method is based on the approach for detecting synchronization of complex systems from the analysis of their non-stationary time series (Karavaev et al., 2009; Kiselev et al., 2016a). Comparison of the proposed method with other known methods for detecting synchronization showed its higher sensitivity (Borovkova et al., 2020, 2021).
Figure 2 illustrates the main stages of the method. From the experimental ECG signal we extract a sequence of RR-intervals, i.e., a series of time intervals between the two successive R peaks. To obtain equidistant time series from not equidistant sequence of RR-intervals, we approximate it with cubic b-splines and resampled with a frequency of 5 Hz. Then, we filter the sequence of RR-intervals and the signal of BP using a filter with the bandpass of 0.06–0.14 Hz. After that, we resample the filtered BP signal with a sampling frequency of 5 Hz. The filtered signals are normalized so that their maximum amplitude is equal to unity.
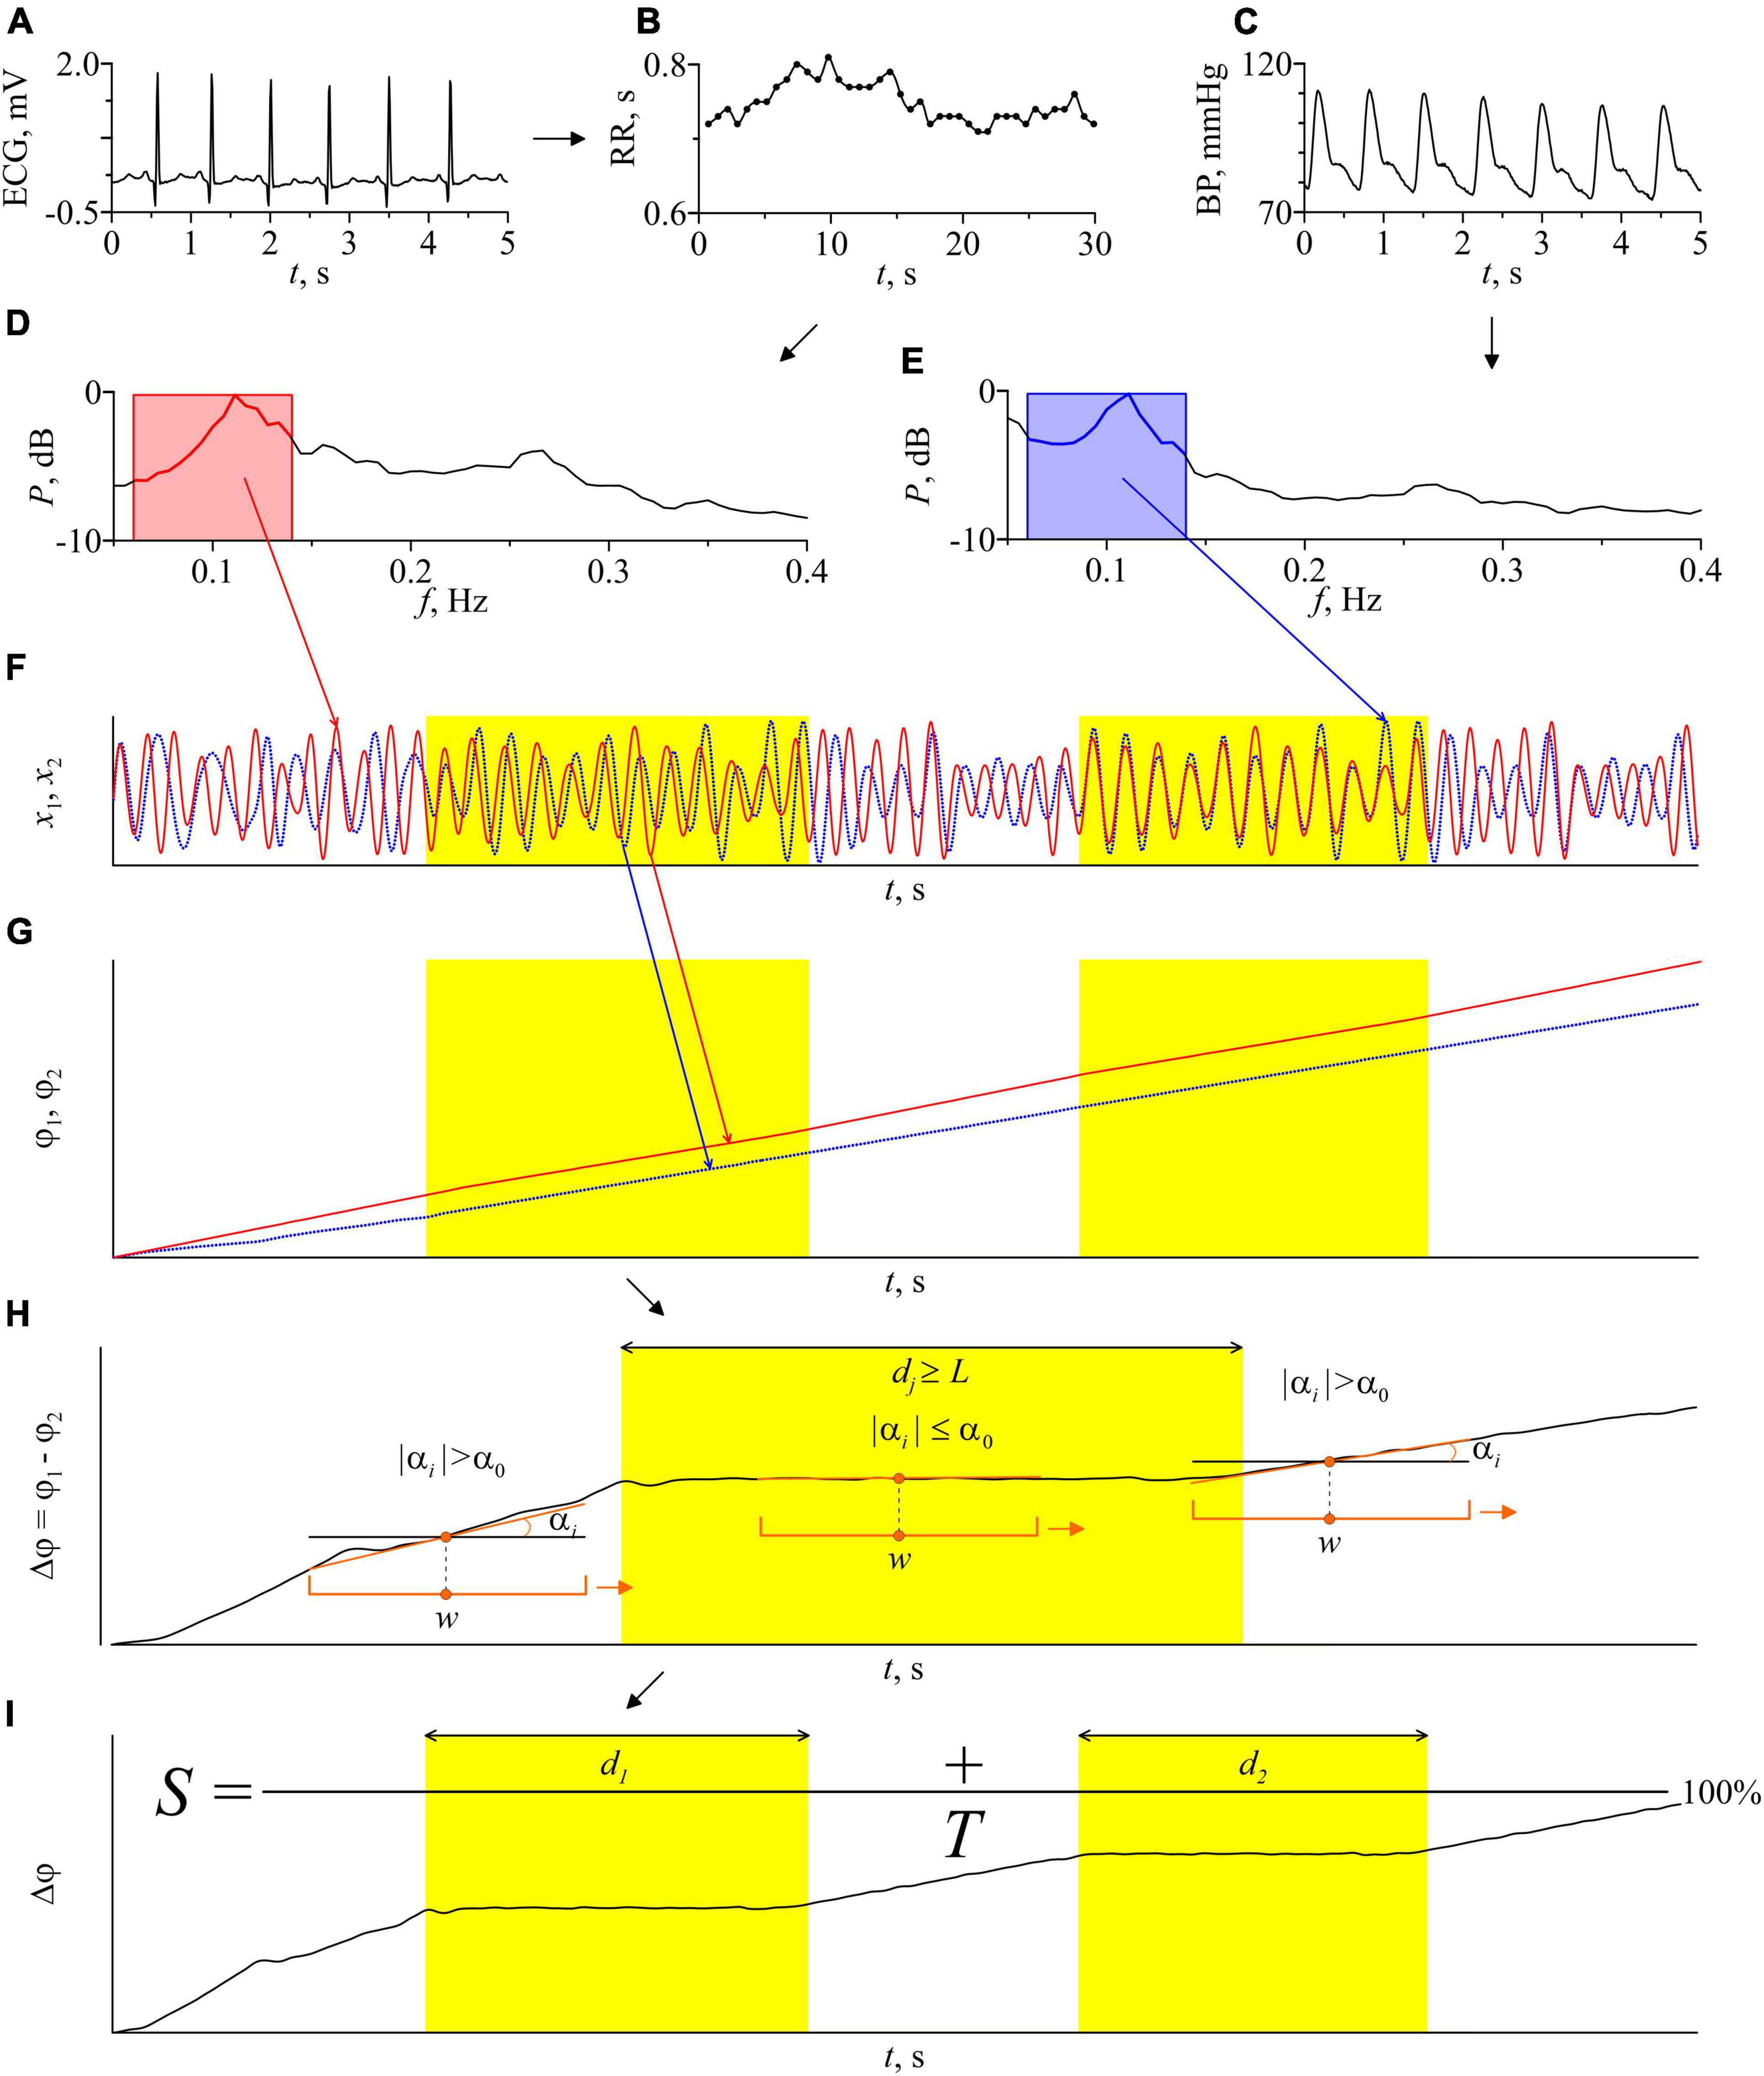
Figure 2. Schematic illustration of the method for estimating the total percentage S of phase synchronization. (A) ECG signal; (B) RR-intervals. Dots show experimental values of RR-intervals, interpolation by cubic β-splines is shown by a line; (C) the BP signal; (D) the power spectrum of the RR-interval signal; (E) power spectrum of the blood pressure signal. The bandwidth of the bandpass filters is marked in pink and blue on the power spectra graphs; (F) signals of RR-intervals and blood pressure filtered in the LF-band and normalized to unity amplitude; (G) instantaneous phases of the filtered signals of RR-intervals and blood pressure; (H) the instantaneous phases difference of the signals and an illustration of the automatic procedure for finding the epochs of synchronization. Orange bracket marks a window sliding along the time series Δϕ(t) with a shift of 1 discrete sample. w is the sliding window width. The orange line is a linear approximation of the time series Δϕ(t) in every sliding window. αi is the slope of the approximating line in ith sliding window. α0 is the method parameter, maximum slope angle, dj is the length of jth epoch of synchronization. Parameter L has the meaning of the minimum length of the synchronization epoch; (I) illustration of the procedure for calculating the index of the total percentage of phase synchronization S. T is the time series length, d1 and d2 are the length of the identified epochs of synchronization. The epochs of synchronization are shown in yellow.
Next, we define the instantaneous phases ϕ1(t) and ϕ2(t) of the filtered RR-intervals and BP signal, respectively, as the angle of rotation of the radius vector on the plane , where x(t) is the analyzed signal and is the Hilbert transform of x(t),
where P.V. means that the integral is taken in the sense of the Cauchy principal value on a time series (Rosenblum and Kurths, 1998). Then, we calculate the difference of instantaneous phases ϕ1(t) and ϕ2(t):
The presence of 1:1 phase synchronization of two processes is defined by the condition:
where C is a constant (Pikovsky et al., 2001). Thus, in the epochs of synchronization, Δϕ(t) demonstrates horizontal plateaus, the oscillations on which are determined only by the measurement noise.
For automatic detection of phase synchronization epochs, we use the following algorithm. A window with a width w moves along the time series of Δϕ(t) with a shift of one sample (0.2 s). Using the method of least squares, we linearly approximate Δϕ(t) in each ith moving window by calculating a slope αi. The presence of synchronization is defined by the condition |αi|≤α0, where α0 is the method parameter. To reduce the influence of random fluctuations of instantaneous phases, we use an additional condition dj≥L for the detection of phase synchronization, where dj is the length of the jth epoch of synchronization and L is the method parameter. Specialized statistical tests carried out in the study (Borovkova et al., 2020, 2021) allow us to choose the following parameters of the method: w = 22 s, α0 0.004 rad, L = 10 s. These values are used throughout the paper.
A sufficiently wide w window (more than 2 characteristic periods of oscillations) allows one to reduce the influence of phase noise. The method’s algorithm assumes that the epoch is identified as an epoch of synchronization if the slope of the approximating straight line remains below the threshold value for a continuous-time interval with a length of at least L (about 1 characteristic period). In this case, the window w is shifted each time by one sample of discrete-time. Such conditions make it possible to increase the accuracy of diagnostics of the boundaries of the epoch of synchronization when moving the window w between synchronous and asynchronous epochs. Then we calculate the total length of the identified epochs of phase synchronization and express it as a percentage relative to the time series length of the entire record. The total percentage of phase synchronization is calculated as follows:
where T is the time series length of the entire record and N is the number of epochs of synchronization. The calculation of the phase synchronization index S uses the LF-filtered time series of RR-intervals and BP as a whole: 20-min time series (6000 samples at a sampling rate of 5 Hz).
The method for calculating measure S is implemented using the Python programming language. The program is available for free use at1.
Signals of complex systems of biological nature are usually non-linear, non-stationary, and susceptible to noise and artifacts of different nature. Therefore, each values of index S obtained from experimental data was accompanied by the estimate the statistical significance. For each 20-min pair of ECG and BP signals, we generate a statistical ensemble of 100 pairs of surrogate time series by randomizing the phases of the Fourier-harmonics of analyzed signals in accordance with the method proposed in Theiler et al. (1992) and Schreiber and Schmitz (1996). This method for surrogate data preparation preserves periodogram of the experimental signals, but destroys couplings between them. Then, we calculate a total percentage of phase synchronization Sk, k = 1,…,100 for each kth pair of surrogates and sorted Sk values in ascending order. The measure S calculated from the experimental signals is considered statistically significant (p < 0.05) if it is greater than the 95th Sk value calculated from surrogate data.
Some well-known works (Smyth et al., 1969; Pagani et al., 1988; Vanoli et al., 1995; Nakazato et al., 1998; Elsenbruch et al., 1999; Legramante et al., 2003) show a change in the baroreflex function and, as a consequence, the values of common assessments characterizing the properties of heart rate and blood pressure change during the transition from the awake state to different stages of sleep. Linear methods of spectral and statistical analysis of signals are often used for these investigations (Task Force of the European Society of Cardiology [TFESC], 1996). The following assessments are widely used to separate the awake state and different stages of sleep: Xmean (ms) - mean length of RR-intervals, SDNN - the standard deviation of length of the RR-intervals, HFRR (ms2) - the power of the spectrum of the HF components of the RR-intervals and BP, LFRR (ms2) - the power of the spectrum of the LF components of the RR-intervals. We calculate these assessments in this work. We used the first 5 min of the RR-interval signal. The calculation of the assessments of heart rate variability was carried out by the well-known methodological recommendations (Task Force of the European Society of Cardiology [TFESC], 1996).
Baroreflex sensitivity (BRS) is also a recognized tool for assessing the autonomic control of the cardiovascular system.
In this work, the assessment of the baroreflex sensitivity was carried out based on spectral analysis of the signal of RR-intervals and systolic blood pressure and was used along with other typical tools for diagnosing the stages of sleep and the awake state (Smyth et al., 1969; Pagani et al., 1988; Legramante et al., 2003). BRS assessments are often based on calculating the power spectral density of the RR-intervals and SBP signals in the LF and/or HF frequency bands (Pagani et al., 1988; Legramante et al., 2003; Dietrich et al., 2010). In Dietrich et al. (2010), results showed similar values of BRS assessments carried out by different methods. Therefore in this paper, BRS was assessed by calculating the alpha index in accordance with the recommendations (Pagani et al., 1988).
In this work the BRS was assessed based on the signals of the RR-intervals and the signal of SBP. To calculate the assessment of BRS, we isolated a non-equidistant sequence of peaks from invasive BP signal (one peak per cardiocycle - at the moment of systole). Subsequently, this non-equidistant series of the SBP signal and the RR-intervals signal was interpolated with a cubic β-spline up to a sampling frequency of 5 Hz. The power spectra were calculated from them, and the integrated power in the LF-band (0.04–0.15 Hz) was estimated.
where f1 0.04 Hz, f2 0.15 Hz, is the integrated power of the spectrum of the LF-component of the RR-intervals, is the integrated power of the spectrum of the LF-component of the SBP.
This assessment of BRS estimate is based on the assumption of a high degree of linear correlation between RR-intervals and SBP variability in the LF-band. This method is simple enough to quickly estimate BRS based on standard spectral characteristics.
We used receiver operating characteristic (ROC) to assess the quality of the binary classification of calculated indices for different pairs of states (REM vs awake, REM vs. NREM, and NREM vs. awake).
Let us illustrate the procedure for constructing ROC-curves by analyzing the S index as an example. To construct the ROC curve for each pair, we went through the threshold value of the parameter of total percentage of phase synchronization S0 from 0 to 100% with step 1%. Each threshold value S0 we compared with grades Si, i = 1,..,22 for all subjects in the first (in each matched pair) state and Sj, j = 1,..,22 – in the second state. To estimate TPR, we calculated the split of results Si> S0. To estimate FPR we calculated the split of results Sj > S0. Each point on the ROC curve shows the relationship between TPR and FPR for each threshold value S0. Comparison of the ROC curves was carried out in the course of calculating the characteristic - Area Under the Curve (AUC).
Similarly, we constructed ROC curves for the other comparable assessments. At the same time, for the Xmean and HFRR indices, for classifying states in accordance with the results a priori known from Oh et al. (2019), it was assumed that during the transition from the awake and REM sleep to the deep sleep, the assessments should increase, and for other cases-decrease.
For each ROC-curve, we found the threshold value of the index corresponding to the put off point (the point closest to the point TPR = 1.0, FPR = 0.0). For put off points, we calculated the odds ratio and p-value.
To check the reliability of differences in the estimates of the mean values of assessments for different stages, we used the Kruskal-Wallis test (Kruskal, 1952), which takes into account multiple testing, and the Mann-Whitney U-test (Mann and Whitney, 1947), which does not take into account the correction for multiple testing but allowing for pairwise comparison.
Figure 3 shows the experimental signals and the results of their analysis for one of the subjects in the awake state, NREM sleep, and REM sleep. Figures 3A–C present the ECG signals in the awake state, NREM sleep, and REM sleep, respectively.
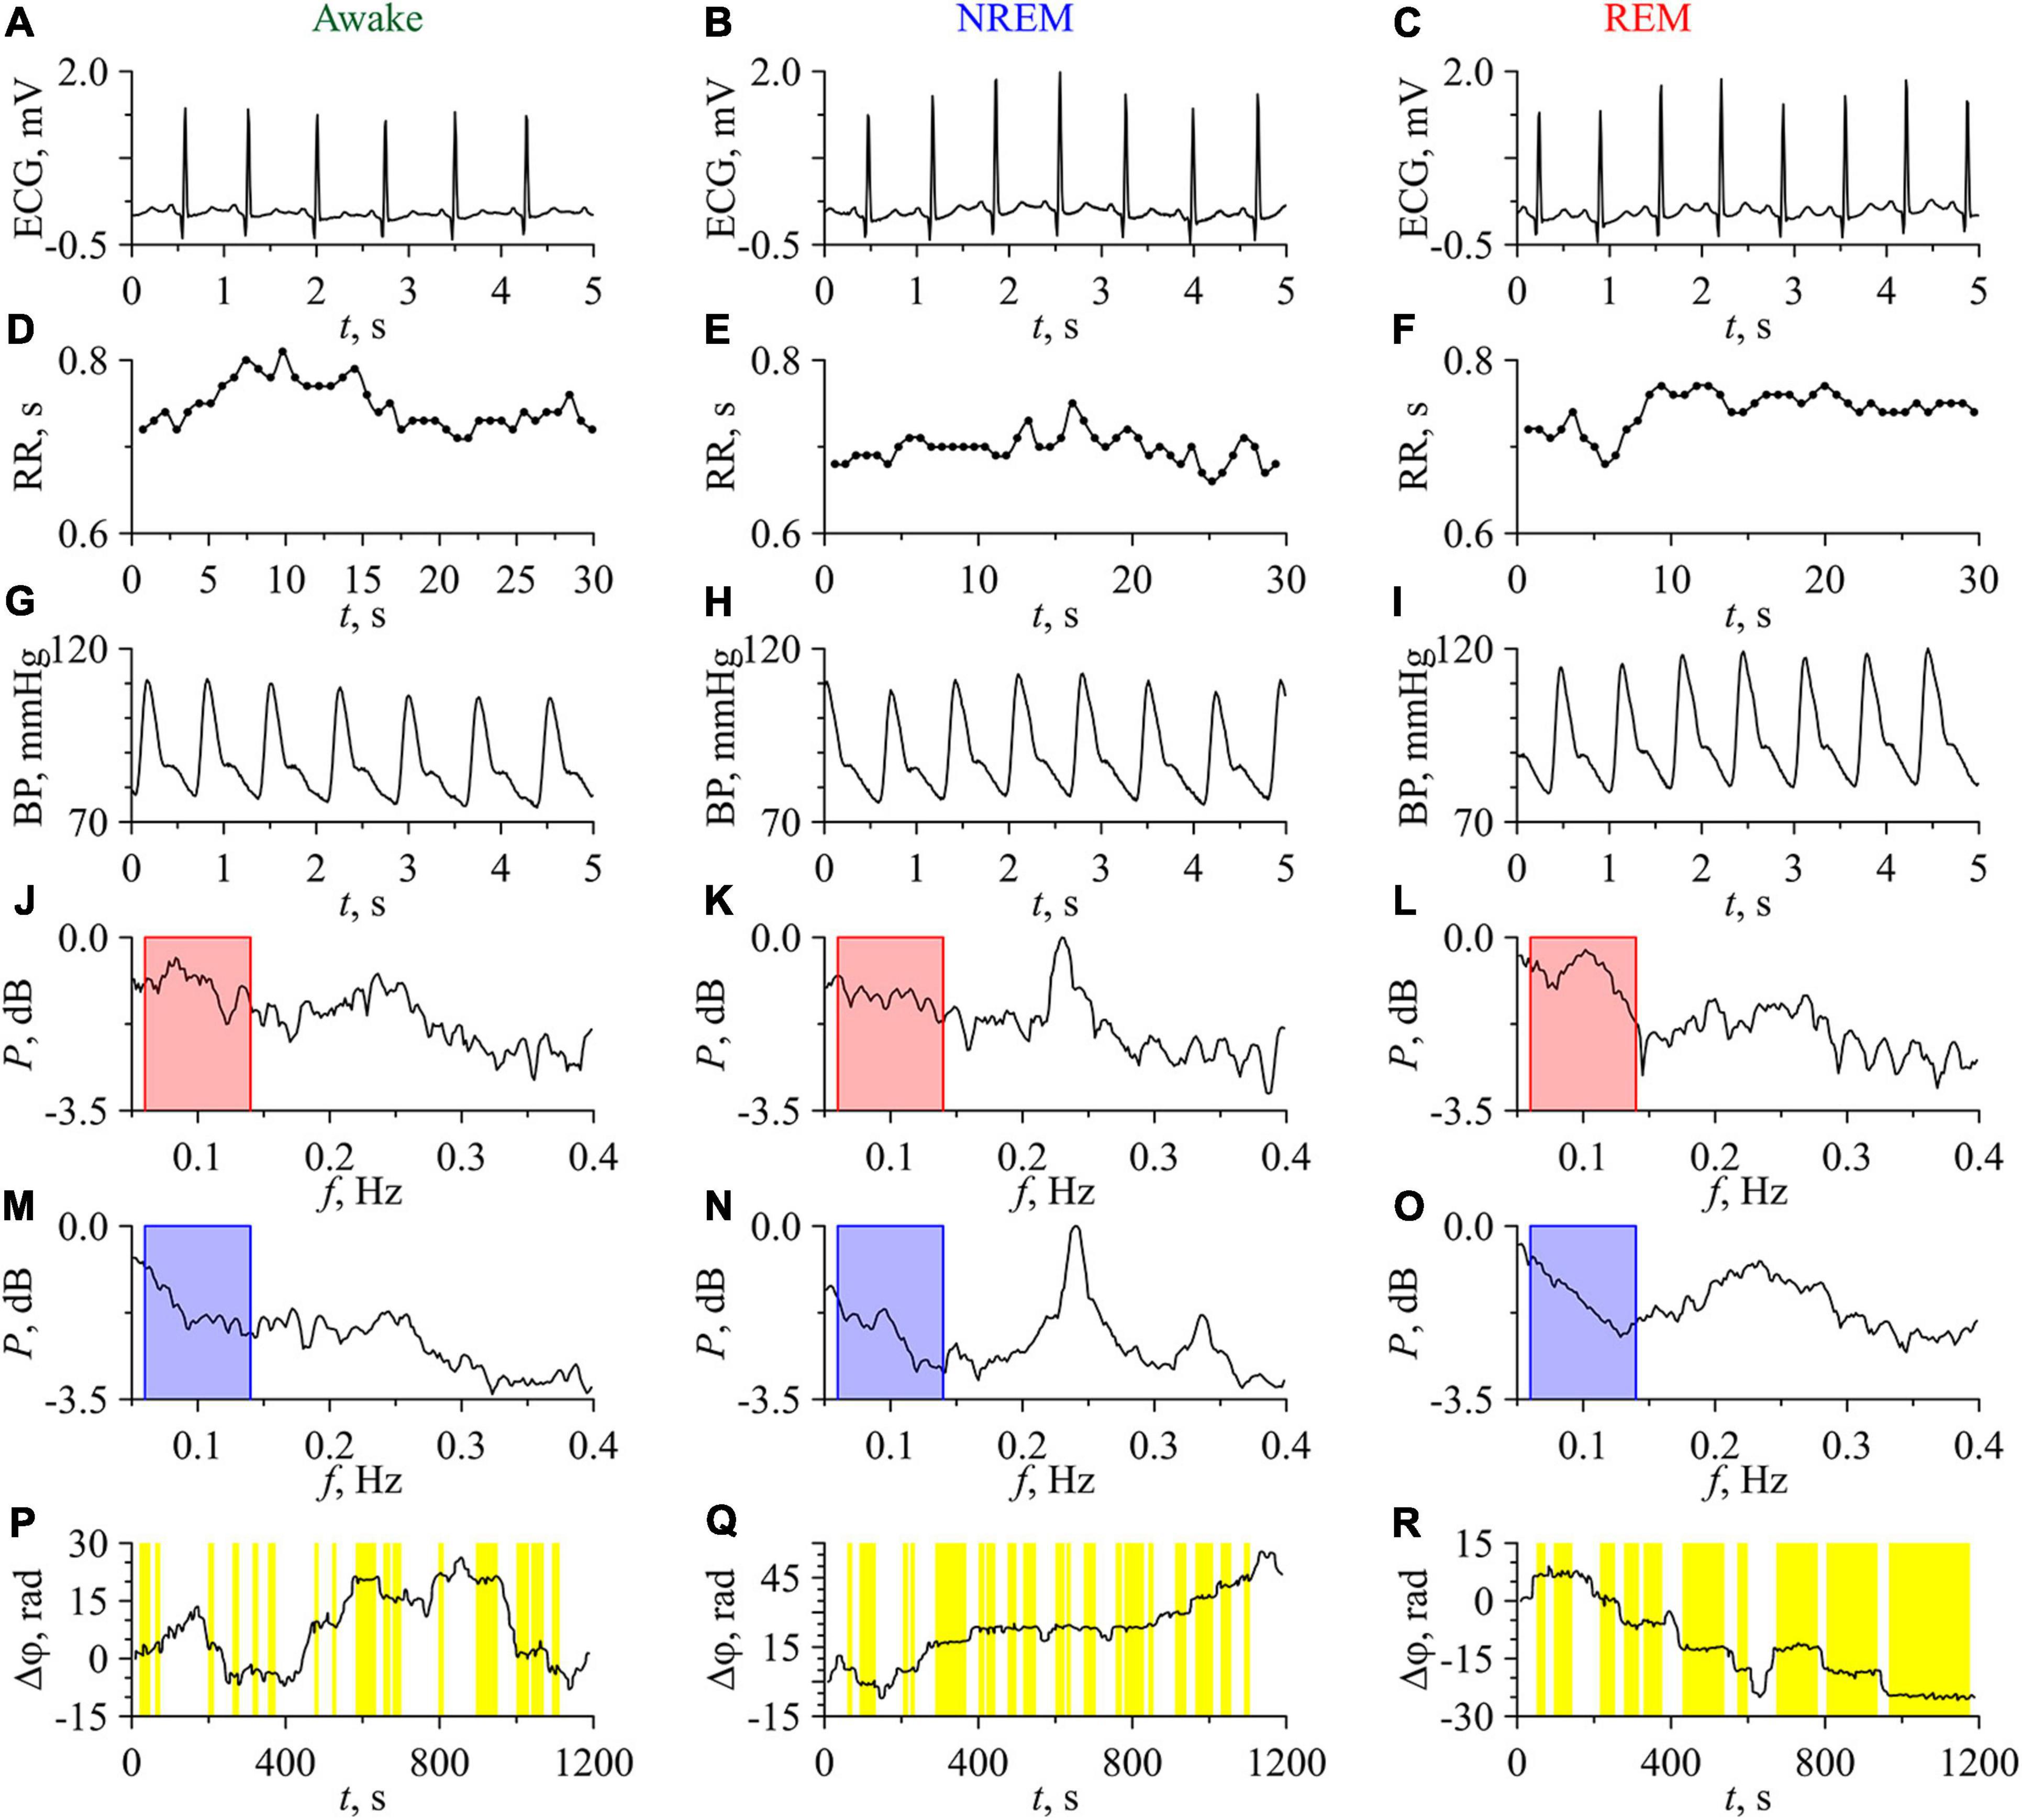
Figure 3. Experimental signals, their Fourier power spectra and the difference of instantaneous phases for the subject No. 1 (No. C04Z1N2) in the awake state (first column), NREM sleep (second column), and REM sleep (third column). (A–C) ECG signals; (D–F) RR-intervals. Experimental values are shown with dots and interpolation by cubic β-splines is shown with line; (G–I) BP signals; (J–L) Fourier power spectra of RR-intervals; (M–O) Fourier power spectra of BP signals. The bandpass of filtering is shown in the power spectra plots in pink and blue; (P–R) Phase differences. Epochs of phase synchronization are shown in yellow.
RR-intervals show low variability, that typical in subjects at rest (Figures 3D–F). BP signals in the awake state, NREM sleep, and REM sleep are presented in Figures 3G–I, respectively. The values of BP correspond to those observed in healthy subjects (Young et al., 2020). The power spectra of the RR-intervals are shown in Figures 3J–L, while the power spectra of the BP signals are shown in Figures 3M–O. These power spectra are normalized to the maximum value in the three considered states, which takes place for NREM sleep. The characteristic peaks in the LF-band of power spectra are associated with the processes of autonomic control and baroreflex activity, while the peaks in the HF-band are associated with the respiration.
In the spectra of RR-intervals, the power in the LF-band in the awake state is higher than in NREM sleep and lower than in REM sleep. This is consistent with the known results (Somers et al., 1993; Kantelhardt et al., 2002). On the contrary, the power in the HF-band in the awake state is lower than in NREM sleep and higher than in REM sleep. This result agrees well with other studies (Zemaityte et al., 1984; Bartsch et al., 2012).
In the power spectra of BP signals, the HF-component is most pronounced in NREM sleep. Oscillatory activity in the HF-band of BP signal is usually related to the respiratory driven BP oscillations through changes in the intra-thoracic pressure if the respiratory frequency remains within the normal limits (Dornhorst et al., 1954; De Boer et al., 1987; Sleight et al., 1995; Conci et al., 2001). The study of such effects was beyond the scope of this paper.
Figures 3P–R depict the dependences Δϕ(t) for the awake state, NREM sleep, and REM sleep, respectively. The length of phase synchronization epochs in REM sleep is noticeably greater than in other two states. In the awake state, Δϕ(t) slowly fluctuates around 0. In NREM sleep, a slow positive trend of Δϕ(t) is observed, which indicates that the instantaneous phase of LF-component in RR-intervals grows faster than the phase of LF-component in BP signal. In REM sleep, a negative trend of Δϕ(t) takes place that indicates the faster increase of the phase of BP signal LF-component with respect to the phase of LF-component in RR-intervals. However, the sign of trend in Δϕ(t) differs in different subjects. In Figure 3, the total percentage S of phase synchronization is 29.6% in the awake state, 43.3% in NREM sleep, and 65.8% in REM sleep. All these values are statistically significant.
Figure 4 presents the results of the analysis of synchronization between the studied processes of autonomic control of blood circulation. In Figure 4A, the S values in the awake state, NREM sleep, and REM sleep are shown for each of 22 subjects. In all subjects, the S values in REM sleep are higher than in the awake state. In 18 subjects, the S values in REM sleep are higher than in NREM sleep. The difference between the S values in the awake state and in NREM sleep is less pronounced. From all S values in Figure 4A, only five values (two values in the awake state and three values in NREM sleep) are not significant. Figure 4B shows the distribution function F calculated for significant S values. In Figure 4C, box-and-whisker diagrams for S values are presented. From these figures it follows that, on average, S takes the highest values in REM sleep and the lowest values in the awake state. The most pronounced difference is observed between S values in the awake state and in REM sleep stage. In NREM sleep, the S values have high variance and are on average higher than in the awake state and lower than in REM sleep, Figure 4C.
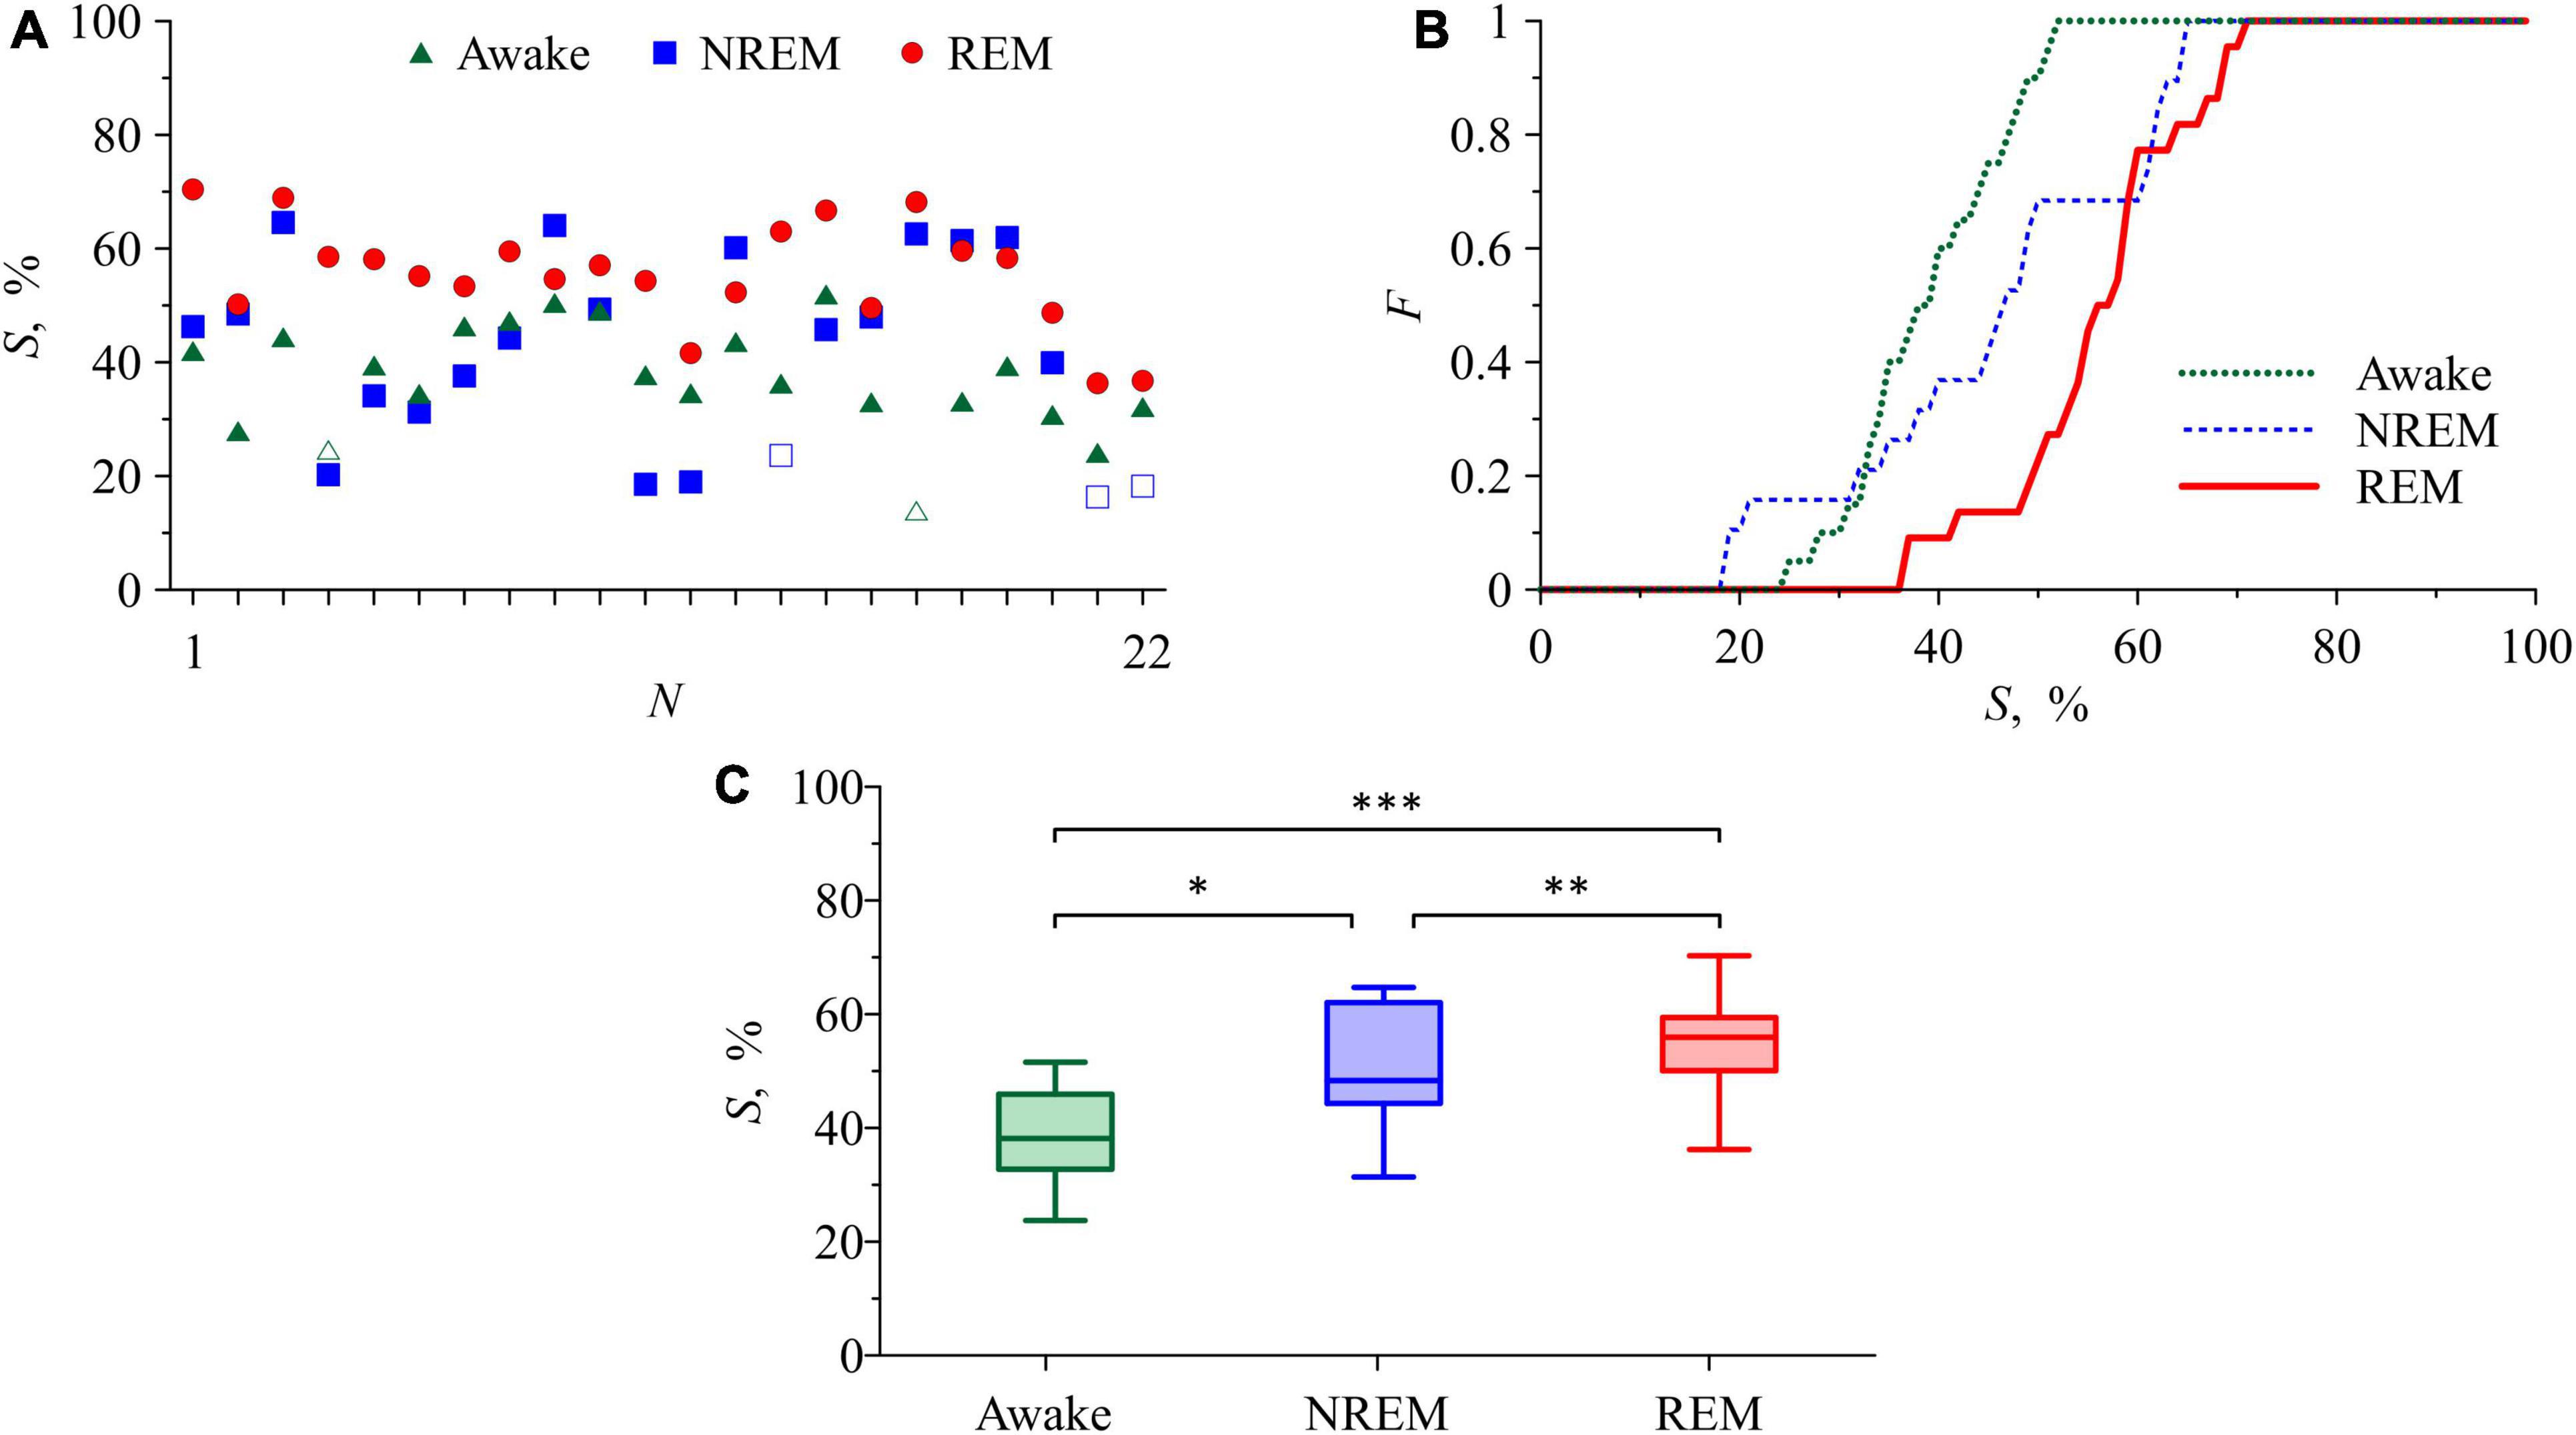
Figure 4. (A) S values in the awake state, NREM sleep, and REM sleep for each of the subjects. Statistically insignificant S values are shown with white squares and white triangles. (B) Distribution function for S. (C) Box-and-whisker diagrams for S values in the awake state, NREM sleep, and REM sleep. The box boundaries are the first and third quartiles, the horizontal line is the median, the whiskers are the minimum and maximum values. Figures (B,C) include only statistically significant S values (p < 0.05). The asterisks in panel (C) correspond to the p-level of intergroup differences, assessed using the Mann-Whitney U-test: p= 0.01 for “*” and “**” and p< 0.01 for “***”.
The quantitative results of comparing the changes in the total percentage of phase synchronization S with known assessments in the awake state and different stages of sleep are presented in Table 1.
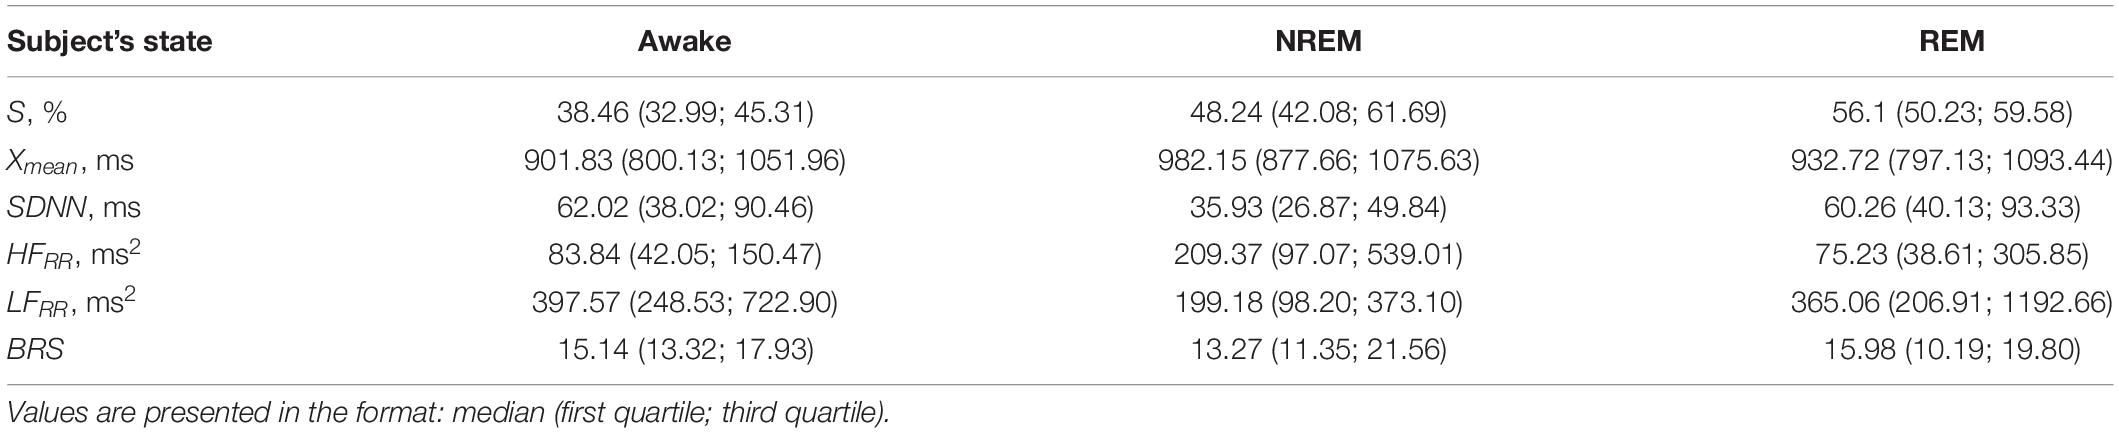
Table 1. The values of the calculated assessments in the awake state and in sleep stages.
Table 1 shows that the index S demonstrates the best divergence of the distributions of values between awake state and REM sleep compared to other indices.
Table 2 gives the results of a pairwise test of the statistical significance of intergroup differences using the Mann-Whitney U-test and the Kruskal-Wallis test, which takes into account multiple testing.
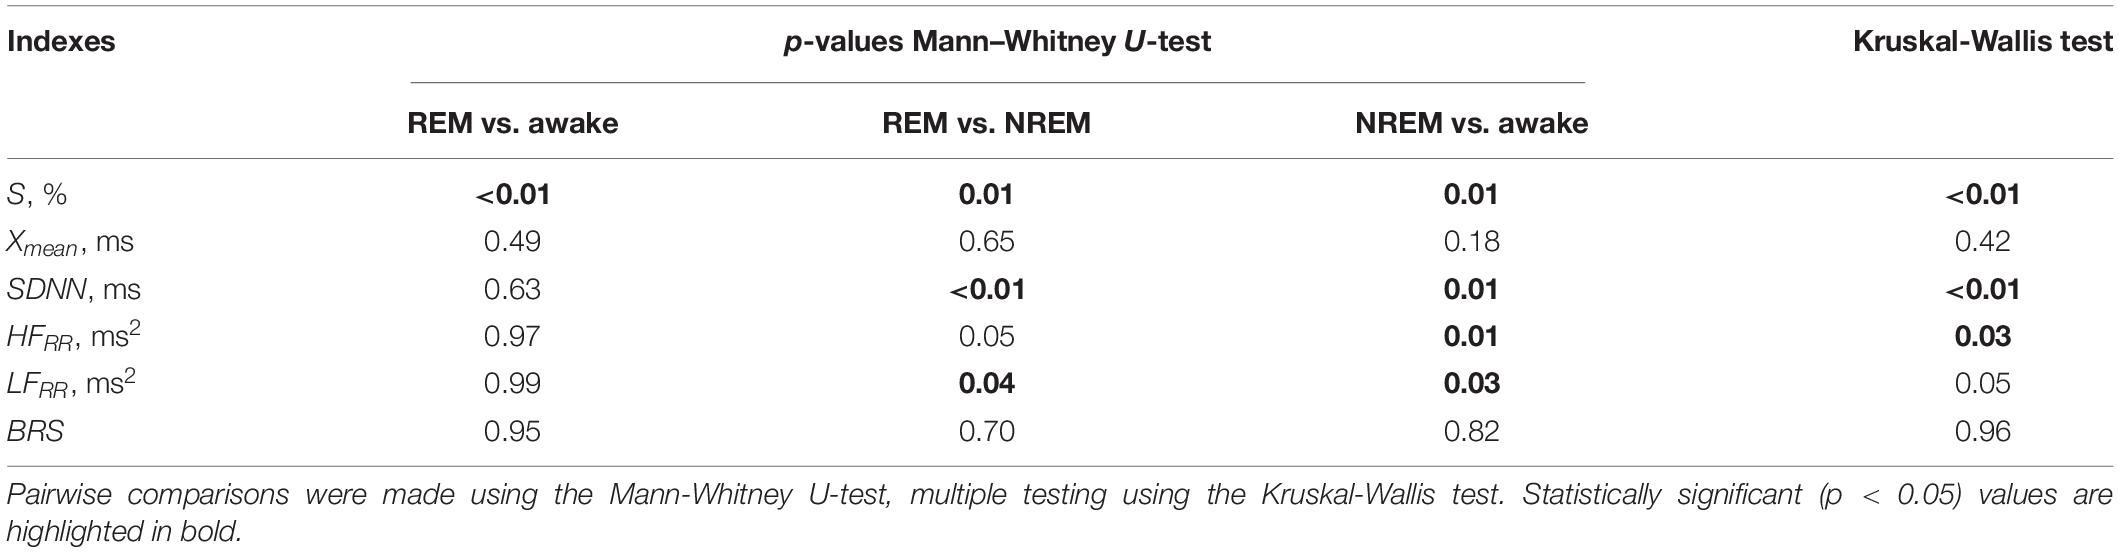
Table 2. Statistical significance of intergroup differences in the awake state and in sleep stages using different assessments.
Tables 1, 2 show that pairwise testing with the Mann–Whitney U-test shows that the index S separates REM sleep and awake state, as well as REM sleep and NREM sleep. SDNN and LFRR separate groups REM sleep and NREM sleep, as well as NREM sleep and the awake state. HFRR separates group NREM sleep and the awake state. This is confirmed by the results of multiple testing using the Kruskal-Wallis test (Table 2), which confirms significant group differences for all of the listed indices, except for the LFRR.
Thus, only 4 out of 6 assessments demonstrated significant intergroup differences between the compared states for the experimental sample used. At the same time, only the S index made it possible to separate the REM sleep and the awake state groups significantly.
ROC analysis was carried out to assess the capabilities of the compared assessments when solving the problem of classifying of the awake state and sleep stages.
Figure 5 shows the ROC-curves for the S index. The ROC analysis results for the index S are consistent with the results of the analysis of intergroup differences. S demonstrates a noticeably better ability among the compared indices to classify REM sleep and the awake state (red line in Figure 5A), slightly worse results for REM and NREM sleep (red line in Figure 5B), worst of all these assessments allows classifying NREM sleep and awake states (Figure 5C). Among other assessments, the SDNN and HFRR, LFRR indexes can be noted, for classifying the REM sleep and NREM sleep (black, orange and purple lines, respectively, in Figure 5B) and NREM sleep and awake states (black, orange and purple lines, respectively, in Figure 5C). The BRS assessment shows the ability to classify NREM sleep and awake state (green line in Figure 5C).
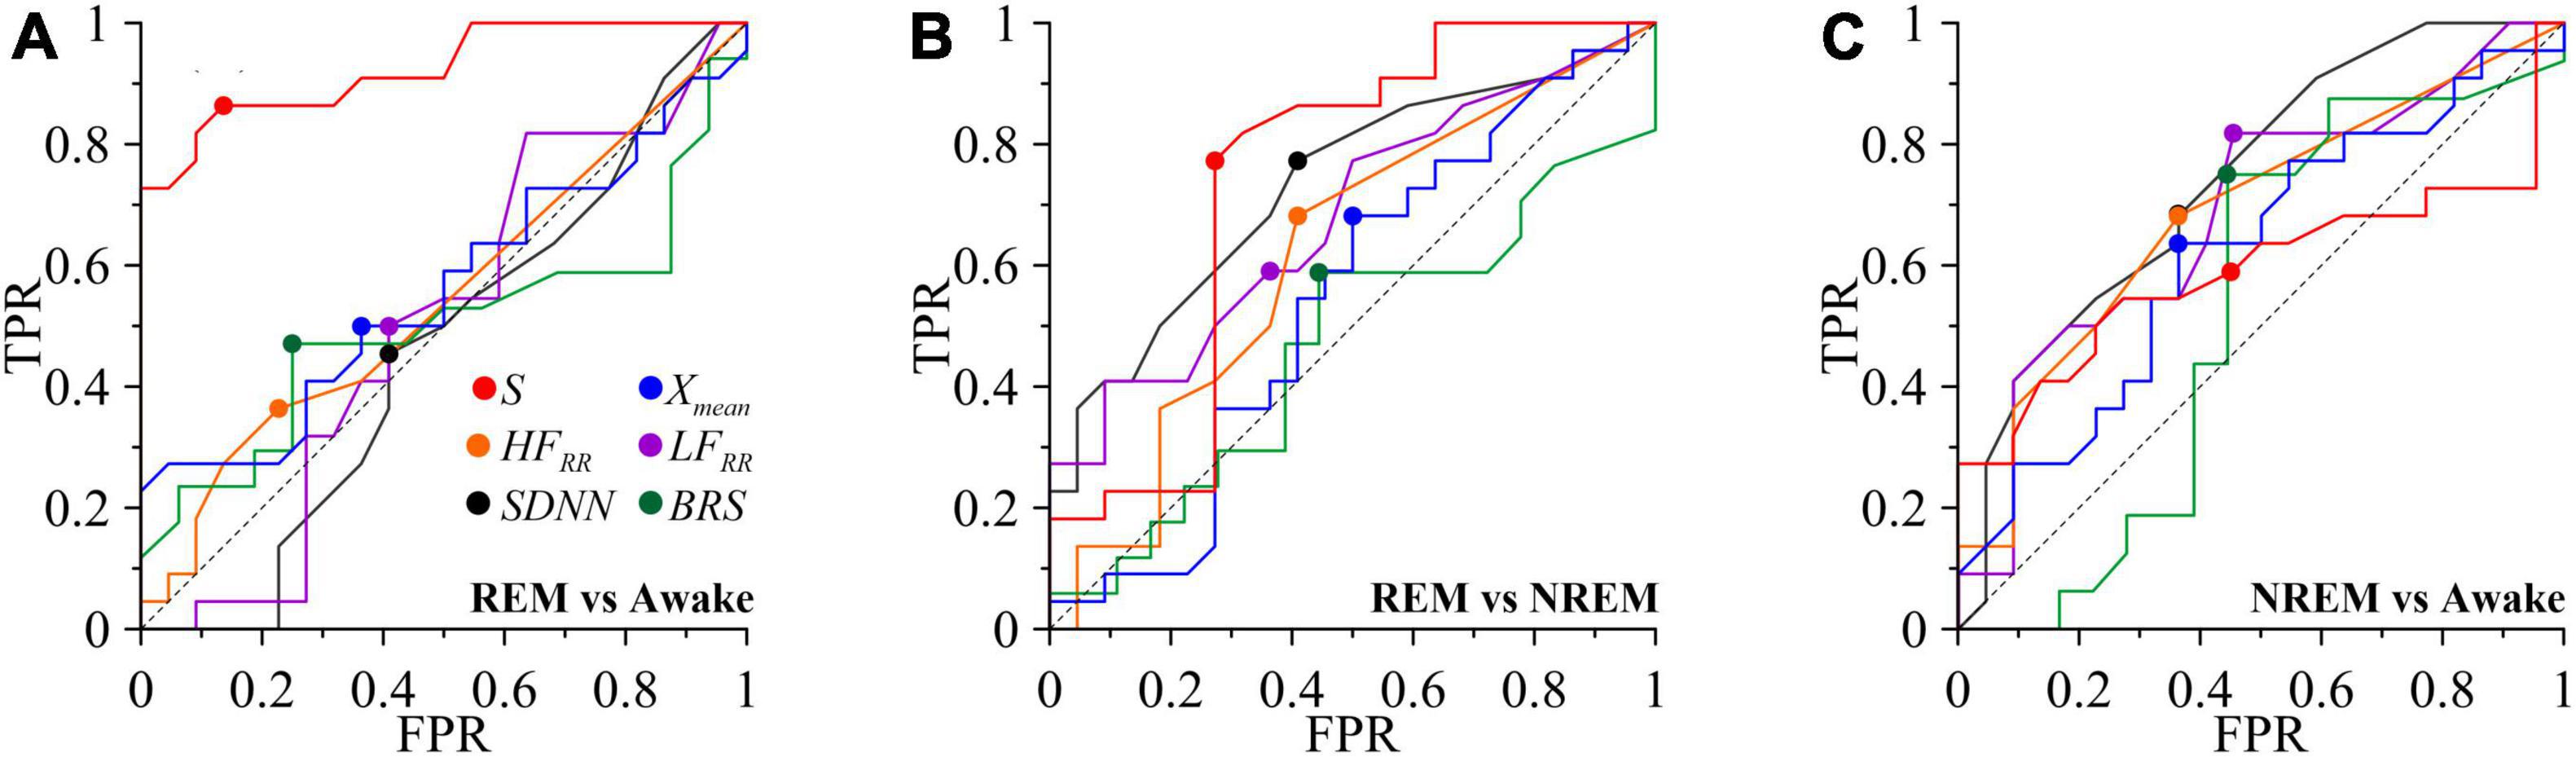
Figure 5. ROC curves for classifying the awake state and sleep stages. TPR is true positive rate and FPR is false positive rate. (A) REM and awake state. (B) REM and NREM. (C) NREM and awake state. The diagonal line is shown with black dashed line. Put off point is marked with colored dots.
The quantitative results of comparing the possibilities of classifying states using these assessments are shown in Table 3.
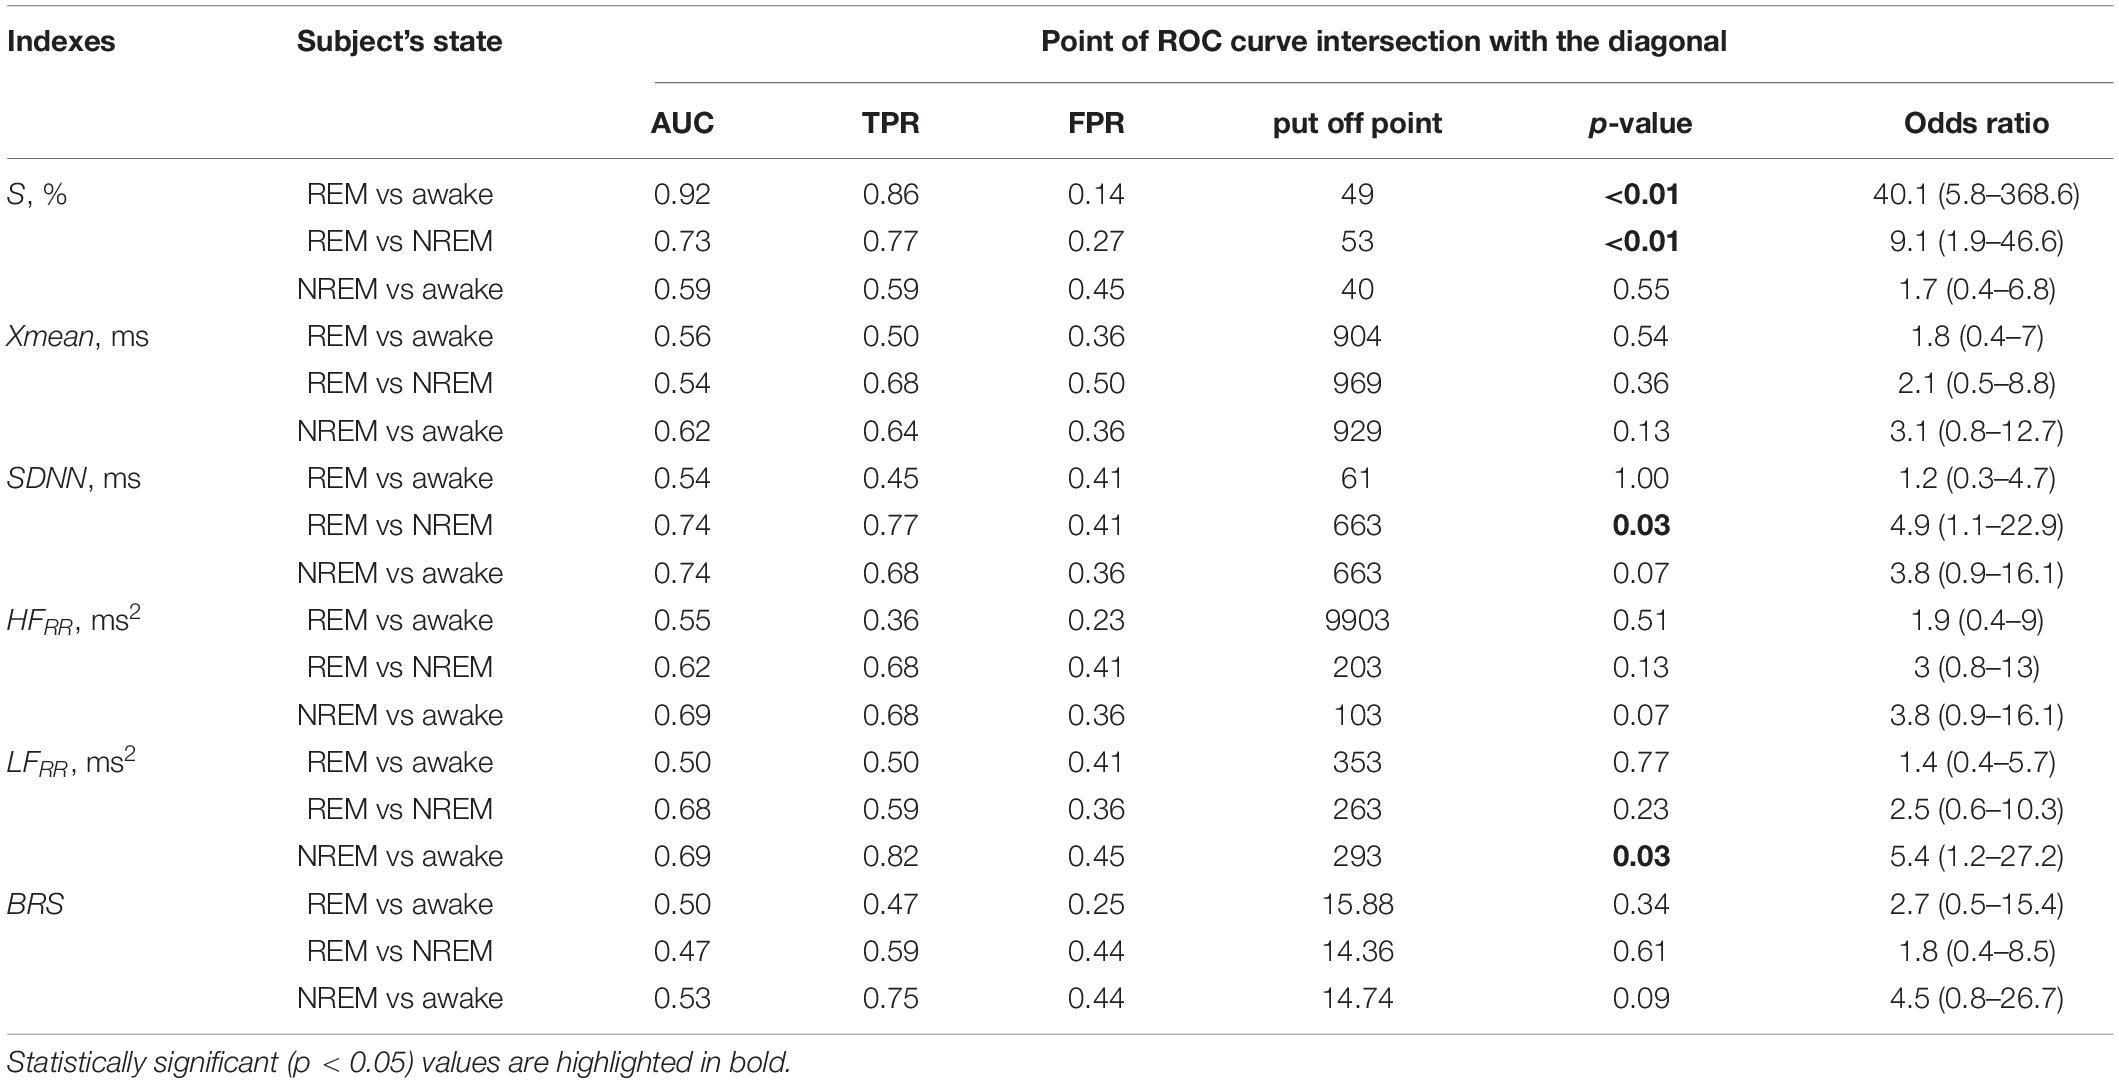
Table 3. Results of the ROC analysis for classifying the awake state and sleep stages for the compared assessments, as well as the p-value and odds ratio for the put off points of the ROC curves.
Thus, Table 3 shows that the degree of synchronization of the processes of autonomic control of blood circulation with the calculation of the S index, in contrast to other assessments, makes it possible to classifying the state of REM sleep and the awake state. In Figure 5, the ROC-curve for this pair of states is higher than the other two ROC-curves. It gives good results TPR = 0.86 and specificity FPR = 0.14 for put off point (Table 3). The S and SDNN indexes differentiate between REM sleep and NREM sleep. The SDNN and HFRR indices differentiate between REM sleep and NREM sleep. The LFRR indice differentiate between NREM sleep and the awake state. Significant results (p < 0.05) are highlighted in bold.
The baroreflex function ensures the operation of the loops of autonomic control of blood circulation, which sensitively react to changes in the physiological state of the body. The studies (Mrowka et al., 2000, 2003; Shiogai et al., 2010; Bartsch et al., 2012) shows a statistically significant change in the cardiorespiratory synchronization and direction of coupling with aging. It is shown that the degree of cardiorespiratory synchronization in healthy subjects, on average, correlates well with the depth of sleep, being minimal in REM sleep and higher in deep sleep than in the awake state (Bartsch et al., 2012). Thus, the study of synchronization between the rhythms of the cardiovascular system gives important information about the state of the subjects and reflects physiological changes in the dynamics of the loops of baroreflex regulation in different stages of sleep.
In this paper, in different sleep stages, we study the phase synchronization of oscillations in the autonomic control loops of HR and BP, the activity of which is manifested mainly in the LF-band. The signals of these loops demonstrate complex chaotic non-stationary dynamics (Karavaev et al., 2019). To detect and quantify the synchronization between these signals, we used the previously proposed the method of synchronization analysis (Karavaev et al., 2009) and applied it to experimental signals of BP and RR-intervals. The method is implemented as freely distributed software.
The analysis of subjects in the awake state and different sleep stages allows us to reveal a number of interesting features. Despite the well-known effect of a decrease in the power of LF-oscillations in RR-intervals in NREM sleep (Somers et al., 1993), synchronization of the processes of autonomic control of blood circulation in NREM sleep increases with respect to the awake state (Figure 4). At the same time, we reveals the maximal synchronization during REM sleep, for which (Bartsch et al., 2012) reported the minimal values of cardiorespiratory synchronization. Our results confirm the conclusions obtained with the use of mathematical models in Van Roon et al. (2004) and Cheng et al. (2010) that the baroreflex function modulation by cortical structures has a complex independent nature. The change in the synchronization of the studied processes at different sleep stages can be explained by the change of the degree of effective interaction of these processes caused by such modulation. Presumably, the mechanisms of these interactions are realized through the brain stem structures (nucleus tract us solitarius, dorsal motor nucleus, nucleus ambiguous, and others), which interact with each other and with the structures of the cerebral cortex (Van Roon et al., 2004; Guyenet, 2014).
The potential of using the analysis of autonomic processes instead of the analysis of electroencephalograms is noted in Mayer et al. (2020) in the study of cardiorespiratory interaction. Currently, the classification of stages 1–3 of deep NREM sleep is successfully carried out by analyzing the instantaneous powers of various frequency components in electroencephalograms (Hassan and Subasi, 2017; Nakamura et al., 2017; Gupta and Pachori, 2021). At the same time, respiration, cardiac activity, and muscle tone also change significantly with the onset of NREM sleep (Flores et al., 2007; Noble and Hochman, 2019; Vanneau et al., 2021). However, the state of REM sleep is still reliably diagnosed only by assessing the eye dynamics and accompanying muscle activity (Liu et al., 2020). Some studies demonstrate certain changes in muscle activity and electrical activity of the brain, but these changes are not specific and very individual. In practice, the classification of REM sleep by automatic systems is very difficult (Cesari et al., 2018; Tripathy and Acharya, 2018). Nevertheless, it seems that this state may be described by analyzing the dynamics of various physiological signals, and not just based on the assessment of the appearance of eye movements.
The importance of this problem is emphasized by the fact that changes in the quality and quantity of REM sleep stages correlate with statistical assessments of mortality and the development of pathological conditions (Galbiati et al., 2019; Leary et al., 2020). At the same time, the known approaches based on estimates of linear spectral and statistical characteristics demonstrate a low sensitivity of the classification of REM sleep. The measure S used in our paper is based on the assessment of non-linear interactions of autonomic control loops of blood circulation and is promising for developing sensitive algorithms for the automatic classification of the REM sleep stage and the awake state. However, our analysis fails to discriminate between NREM and awake states, although such task is also important for the clinical and research practice. The indices BRS and S compared in our study showed different properties in distinguishing between the awake state and different stages of sleep. This is due to the different nature of these measures. Baroreflex sensitivity characterizes the changes in the response of baroreceptors caused by the changes in blood pressure. The result can be manifested in a change in the intensity of oscillations of the BP signal and RR-intervals in the LF-band. The index S characterizes a fundamentally non-linear effect of the phase coupling of oscillations in the loops of autonomic control of blood circulation. When calculating S, information on the dynamics of amplitudes of oscillations is not taken into account. For example, phase synchronization (and, accordingly, the index S) can increase with a decrease in the LFRR oscillation power (and, accordingly, BRS), which can be seen from Table 1. Thus, the index S is not as a pure index of baroreflex sensitivity, but it provides important additional information on a non-linear interaction of the autonomic control loops. Therefore, in the studies of the dynamics of the autonomic control of blood circulation, the S and BRS indices do not replace, but complement each other, characterizing the features of the phase and amplitude dynamics, respectively, of analyzed systems. In the future, it looks promising to combine the advantages of the index S for detecting REM sleep with the capabilities of known approaches for classifying stages of NREM sleep, for example, using machine learning methods.
In this study, we analyze BP signals recorded by arterial catheterization in apnea patients. It is known that this pathology affects the processes of autonomic control (Guilleminault et al., 2005). Unfortunately, we are not able to compare the results of the analysis of patients and healthy subjects, since we do not have invasive BP records of healthy subjects. We expect that healthy subjects may have quantitative differences in S values compared to patients with apnea, but we assume that the conclusion about the differences in S values in different sleep stages and in awake state will remain valid. This assumption is based on the fact that we excluded from the analysis the signal epochs with apnea attacks. To clarify this important issue, we plan to compare the synchronization between the LF-components of RR-intervals and photoplethysmogram signals in apnea patients and in healthy subjects.
The first methods for the assessment of human baroreflex function are based on statistical and spectral analysis of HR. However, such simple linear methods often lack the sensitivity to identify important features of this function in different physiological states. In these states, various systems of the body often change their properties simultaneously, demonstrating coherent and synchronous behavior. When studying such complex collective dynamics, non-linear methods of analysis have certain advantages. An example of such a non-linear method is the method based on the assessment of the degree of synchronization between the processes of autonomic control of HR rate and BP. This method exploits such a sensitive characteristic of the signal as its instantaneous phase. This approach allows us to identify the changes in the degree of coordinated behavior of the studied processes upon modulation of the baroreflex function by the processes of higher nervous activity.
We have found that in NREM sleep, the degree of synchronization of the LF-components of RR-intervals and BP signals is higher than in the awake state and lower than in REM sleep. The measure S may be promising for the development of algorithms for the automatic classification of sleep stages, especially for detecting REM sleep. The results of our study confirm the influence of the processes of higher nervous activity on the baroreflex function. Such influence can be considered in terms of modulation of the effective strength of coupling between the investigated loops of autonomic control.
The data analyzed in this study are subject to the following licenses/restrictions: These are data that belong to medical faculties and are not publicly available. Requests to access these datasets should be directed to TP, dGhvbWFzLnBlbnplbEBjaGFyaXRlLmRl. The software that implements the method for diagnostics of synchronization developed by the authors is available at http://nonlinmod.sgu.ru/comprog_en.htm. It can be freely used in scientific research with reference to this work.
The studies involving human participants were reviewed and approved by the Ethics Committee of Klinikum der Philipps-Universität Marburg, Germany. The patients/participants provided their written informed consent to participate in this study.
All authors contributed to writing and discussion of the manuscript.
This work was supported by the Russian Science Foundation, Grant No. 19-12-00201 (data analysis using the method of phase synchronization detection) and the Project of RF Government, Grant No. 075-15-2019-1885 (sleep studies and physiological interpretation of the results).
The authors declare that the research was conducted in the absence of any commercial or financial relationships that could be construed as a potential conflict of interest.
All claims expressed in this article are solely those of the authors and do not necessarily represent those of their affiliated organizations, or those of the publisher, the editors and the reviewers. Any product that may be evaluated in this article, or claim that may be made by its manufacturer, is not guaranteed or endorsed by the publisher.
Airaksinen, K. E., Hartikainen, J. E., Niemelä, M. J., Huikuri, H. V., Mussalo, H. M., and Tahvanainen, K. U. (1993). Valsalva manoeuvre in the assessment of baroreflex sensitivity in patients with coronary artery disease. Eur. Heart. J. 14, 1519–1523. doi: 10.1093/eurheartj/14.11.1519
Albaghdadi, M. (2007). Baroreflex control of long-term arterial pressure. Rev. Bras. Hipertens. 14, 212–225.
Bartsch, R. P., Schumann, A. Y., Kantelhardt, J. W., Penzel, T., and Ivanov, P. C. (2012). Phase transitions in physiologic coupling. Proc. Natl. Acad. Sci. U. S. A. 109, 10181–10186. doi: 10.1073/pnas.1204568109
Berlad, I., Shlitner, S., Ben-Haim, S., and Lavie, P. (1993). Power spectrum analysis and heart rate variability in stage 4 and REM sleep: evidence for state-specific changes in autonomic dominance. J. Sleep Res. 2, 88–90. doi: 10.1111/j.1365-2869.1993.tb00067.x
Bernardi, L., Bianchini, B., Spadacini, G., Leuzzi, S., Valle, F., Marchesi, E., et al. (1995). Demonstrable cardiac reinnervation after human heart transplantation by carotid baroreflex modulation of RR interval. Circulation 92, 2895–2903. doi: 10.1161/01.CIR.92.10.2895
Bernardi, L., Radaell, A., Solda, P. L., Coats, A. J. S., Reeder, M., Calciati, A., et al. (1996). Autonomic control of skin microvessels: assessment by power spectrum of photoplethysmographic waves. Clin. Sci. 90, 345–355. doi: 10.1042/cs0900345
Billman, G. E. (2013). The LF/HF ratio does not accurately measure cardiac sympatho-vagal balance. Front. Physiol. 4:26. doi: 10.3389/fphys.2013.00026
Borovkova, E. I., Ishbulatov, Y. M., Hramkov, A. H., and Karavaev, A. S. (2021). Using a mathematical model of cardiovascular system for preparing surrogate data for testing methods of phase synchronization analysis. Izvestiya Vysshikh Uchebnykh Zavedeniy. Prikladnaya Nelineynaya Dinamika 29, 356–364. doi: 10.18500/0869-6632-2021-29-3-356-364
Borovkova, E. I., Karavaev, A. S., Kiselev, A. R., Gridnev, V. I., Hramkov, A. N., Chernets, E. P., et al. (2020). “Comparison of methods of quantitative analysis of phase synchronization according to test data modeling non-stationary signals of biological nature,” in IEEE 2020 4th Scientific School on Dynamics of Complex Networks and Their Application in Intellectual Robotics (DCNAIR), Piscataway: IEEE, 59–61. doi: 10.1109/DCNAIR50402.2020.9216742
Brandenberger, G., Viola, A. U., Ehrhart, J., Charloux, A., Geny, B., Piquard, F., et al. (2003). Age-related changes in cardiac autonomic control during sleep. J. Sleep Res. 12, 173–180. doi: 10.1046/j.1365-2869.2003.00353.x
Bristow, J. D., Honour, A. J., Pickering, T. G., and Sleight, P. (1969). Cardiovascular and respiratory changes during sleep in normal and hypertensive subjects. Cardiovasc. Res. 3, 476–485. doi: 10.1093/cvr/3.4.476
Cesari, M., Christensen, J. A. E., Kempfner, L., Olesen, A. N., Mayer, G., Kesper, K., et al. (2018). Comparison of computerized methods for rapid eye movement sleep without atonia detection. Sleep 41:zsy133. doi: 10.1093/sleep/zsy133
Cheng, L., Ivanova, O., Fan, H. H., and Khoo, M. C. (2010). An integrative model of respiratory and cardiovascular control in sleep-disordered breathing. Respir. Physiol. Neurobiol. 174, 4–28. doi: 10.1016/j.resp.2010.06.001
Conci, F., Di Rienzo, M., and Castiglioni, P. (2001). Blood pressure and heart rate variability and baroreflex sensitivity before and after brain death. J. Neurol. Neurosurg. Psychiatry. 71, 621–631. doi: 10.1136/jnnp.71.5.621
Conway, J., Boon, N., Jones, J. V., and Sleight, P. (1983). Involvement of the baroreceptor reflexes in the changes in blood pressure with sleep and mental arousal. Hypertension 5, 746–748. doi: 10.1161/01.hyp.5.5.746
Dash, S., Shelley, K. H., Silverman, D. G., and Chon, K. H. (2010). Estimation of respiratory rate from ECG, photoplethysmogram, and piezoelectric pulse transducer signals: a comparative study of time frequency methods. IEEE Trans. Biomed. Eng. 57, 1099–1107. doi: 10.1109/TBME.2009.2038226
De Boer, R. W., Karemaker, J. M., and Strackee, J. (1987). Hemodynamic fluctuations and baroreflex sensitivity in humans: a beat-to-beat model. Am. J. Physiol. 253, H680–H689. doi: 10.1152/ajpheart.1987.253.3.H680
Dietrich, A., Rosmalen, J. G. M., Althaus, M., van Roon, A. M., Mulder, L. J. M., Minderaa, R. B., et al. (2010). Reproducibility of heart rate variability and baroreflex sensitivity measurements in children. Biol. Psychol. 85, 71–78. doi: 10.1016/j.biopsycho.2010.05.0
Dornhorst, A. C., Howard, P., and Leathard, G. L. (1954). Respiratory variations in blood pressure. Circulation. 6, 553–558. doi: 10.1161/01.cir.6.4.553
Duschek, S., Werner, N. S., and Reyes Del Paso, G. A. (2013). The behavioral impact of baroreflex function: a review. Psychophysiology 50, 1183–1193. doi: 10.1111/psyp.12136
Eckberg, D. L., Cavanaugh, M. S., Mark, A. L., and Abboud, F. M. (1975). A simplified neck suction device for activation of carotid baroreceptors. J. Lab. Clin. Med. 85, 167–173. doi: 10.5555/uri:pii:0022214375904631
Elliott, J. E., Mantilla, C. B., Pabelick, C. M., Roden, A. C., and Sieck, G. C. (2016). Aging-related changes in respiratory system mechanics and morphometry in mice. Am. J. Physiol. Lung. Cell. Mol. Physiol. 311, L167–L176. doi: 10.1152/ajplung.00232.2016
Elsenbruch, S., Harnish, M. J., and Orr, W. C. (1999). Heart rate variability during waking and sleep in healthy males and females. Sleep 22, 1067–1071. doi: 10.1093/sleep/22.8.1067
Elstad, M., Walløe, L., Chon, K. H., and Toska, K. (2011). Low-frequency fluctuations in heart rate, cardiac output and mean arterial pressure in humans: what are the physiological relationships? J. Hypertens. 29, 1327–1336. doi: 10.1097/HJH.0b013e328347a17a
Ernst, G. (2017). Heart-rate variability-more than heart beats? Front. Public. Health. 5:240. doi: 10.3389/fpubh.2017.00240
Flores, A. E., Flores, J. E., Deshpande, H., Picazo, J. A., Xie, X. S., Franken, P., et al. (2007). Pattern recognition of sleep in rodents using piezoelectric signals generated by gross body movements. IEEE Trans. Biomed. Eng. 54, 225–233. doi: 10.1109/TBME.2006.886938
Furness, J. B. (2006). The organisation of the autonomic nervous system: peripheral connections. Auton. Neurosci. 130, 1–5. doi: 10.1016/j.autneu.2006.05.003
Galbiati, A., Verga, L., Giora, E., Zucconi, M., and Ferini-Strambi, L. (2019). The risk of neurodegeneration in REM sleep behavior disorder: a systematic review and meta-analysis of longitudinal studies. Sleep Med. Rev. 43, 37–46. doi: 10.1016/j.smrv.2018.09.008
Grote, L., Heitmann, J., Penzel, T., Cassel, W., Ploch, T., Hermann, J. P., et al. (1995). Arterial hypertension and sleep apnoea: effect of the angiotensin-converting enzyme (ACE) inhibitor cilazapril on continuously measured blood pressure during sleep and wakefulness. J. Sleep Res. 4, 112–116.
Guilleminault, C., Briskin, J. G., Greenfield, M. S., and Silvestri, R. (1981). The impact of autonomic nervous system dysfunction on breathing during sleep. Sleep 4, 263–278. doi: 10.1093/sleep/4.3.263
Guilleminault, C., Poyares, D., Rosa, A., and Huang, Y. S. (2005). Heart rate variability, sympathetic and vagal balance and EEG arousals in upper airway resistance and mild obstructive sleep apnea syndromes. Sleep Med. 6, 451–457. doi: 10.1016/j.sleep.2005.03.014
Gupta, V., and Pachori, R. B. (2021). FBDM based time-frequency representation for sleep stages classification using EEG signals. Biomed. Signal Process. Control. 64:102265. doi: 10.1016/j.bspc.2020.102265
Guyenet, P. G. (2014). Regulation of breathing and autonomic outflows by chemoreceptors. Compr. Physiol. 4, 1511–1562. doi: 10.1002/cphy.c140004
Hadaya, J., and Ardell, J. L. (2020). Autonomic modulation for cardiovascular disease. Front. Physiol. 11:617459. doi: 10.3389/fphys.2020.617459
Hassan, A., and Subasi, A. (2017). A decision support system for automated identification of sleep stages from single-channel EEG signals. Knowl. Based Syst. 128, 115–124. doi: 10.1016/j.knosys.2017.05.005
Hornyak, M., Cejnar, M., Elam, M., Matousek, M., and Wallin, B. G. (1991). Sympathetic muscle nerve activity during sleep in man. Brain 114, 1281–1295. doi: 10.1093/brain/114.3.1281
Ishaque, S., Khan, N., and Krishnan, S. (2021). Trends in heart-rate variability signal analysis. Front. Digit. Health 3:13. doi: 10.3389/fdgth.2021.639444
Ishbulatov, Y. M., Karavaev, A. S., Kiselev, A. R., Simonyan, M. A., Prokhorov, M. D., and Ponomarenko, V. I (2020). Mathematical modeling of the cardiovascular autonomic control in healthy subjects during a passive head-up tilt test. Sci. Rep. 10:16525. doi: 10.1038/s41598-020-71532-7
Ivanov, P. C., Bunde, A., Amaral, L. A. N., Havlin, S., Fritsch-Yelle, J., Baevsky, R. M., et al. (1999). Sleep-wake differences in scaling behavior of the human heartbeat: analysis of terrestrial and long-term space flight data. Europhys. Lett. 48, 594–600. doi: 10.1209/epl/i1999-00525-0
Javed, F., Middleton, P. M., Malouf, P., Chan, G. S. H., Savkin, A. V., Lovell, N. H., et al. (2010). Frequency spectrum analysis of finger photoplethysmographic waveform variability during haemodialysis. Physiol. Meas. 31, 1203–1216. doi: 10.1088/0967-3334/31/9/010
Jerath, R., and Beveridge, C. (2020). Respiratory rhythm, autonomic modulation, and the spectrum of emotions: the future of emotion recognition and modulation. Front. Psychol. 11:1980. doi: 10.3389/fpsyg.2020.01980
Kantelhardt, J. W., Ashkenazy, Y., Ivanov, P. C., Bunde, A., Havlin, S., Penzel, T., et al. (2002). Characterization of sleep stages by correlations in the magnitude and sign of heartbeat increments. Phys. Rev. E. Stat. Nonlin. Soft. Matter. Phys. 65:051908. doi: 10.1103/PhysRevE.65.051908
Karavaev, A. S., Borovik, A. S., Borovkova, E. I., Orlova, E. A., Simonyan, M. A., Ponomarenko, V. I., et al. (2021). Low-frequency component of photoplethysmogram reflects the autonomic control of blood pressure. Biophysics 120, 2657–2664. doi: 10.1016/j.bpj.2021.05.020
Karavaev, A. S., Ishbulatov, Y. M., Ponomarenko, V. I, Bezruchko, B. P., Kiselev, A. R., and Prokhorov, M. D. (2019). Autonomic control is a source of dynamical chaos in the cardiovascular system. Chaos 29:121101. doi: 10.1063/1.5134833
Karavaev, A. S., Ishbulatov, Y. M., Ponomarenko, V. I., Prokhorov, M. D., Gridnev, V. I., Bezruchko, B. P., et al. (2016). Model of human cardiovascular system with a loop of autonomic regulation of the mean arterial pressure. J. Am. Soc. Hypertens. 10, 235–243. doi: 10.1016/j.jash.2015.12.014
Karavaev, A. S., Prokhorov, M. D., Ponomarenko, V. I., Kiselev, A. R., Gridnev, V. I., Ruban, E. I., et al. (2009). Synchronization of low-frequency oscillations in the human cardiovascular system. Chaos 19:033112. doi: 10.1063/1.3187794
Kiselev, A. R., Borovkova, E. I., Shvartz, V. A., Skazkina, V. V., Karavaev, A. S., Prokhorov, M. D., et al. (2020). Low-frequency variability in photoplethysmographic waveform and heart rate during on-pump cardiac surgery with or without cardioplegia. Sci. Rep. 10:2118. doi: 10.1038/s41598-020-58196-z
Kiselev, A. R., Gridnev, V. I., Prokhorov, M. D., Karavaev, A. S., Posnenkova, O. M., Ponomarenko, V. I., et al. (2012a). Evaluation of 5-year risk of cardiovascular events in patients after acute myocardial infarction using synchronization of 0.1-Hz rhythms in cardiovascular system. Ann. Noninvasive. Electrocardiol. 17, 204–213. doi: 10.1111/j.1542-474X.2012.00514.x
Kiselev, A. R., Gridnev, V. I., Prokhorov, M. D., Karavaev, A. S., Posnenkova, O. M., Ponomarenko, V. I., et al. (2012b). Selection of optimal dose of β-blocker treatment in myocardial infarction patients basing on changes in synchronization between 0.1 Hz oscillations in heart rate and peripheral microcirculation. J. Cardiovasc. Med. 13, 491–498. doi: 10.2459/JCM.0b013e3283512199
Kiselev, A. R., Mironov, S. A., Karavaev, A. S., Kulminskiy, D. D., Skazkina, V. V., Borovkova, E. I., et al. (2016b). A comprehensive assessment of cardiovascular autonomic control using photoplethysmograms recorded from the earlobe and fingers. Physiol. Meas. 37, 580–595. doi: 10.1088/0967-3334/37/4/580
Kiselev, A. R., Karavaev, A. S., Gridnev, V. I., Prokhorov, M. D., Ponomarenko, V. I., Borovkova, E. I., et al. (2016a). Method of estimation of synchronization strength between low-frequency oscillations in heart rate variability and photoplethysmographic waveform variability. Russ. Open Med. J. 5:e0101. doi: 10.15275/rusomj.2016.0101
Kligfield, P., Gettes, L. S., Bailey, J. J., Childers, R., Deal, B. J., Hancock, E. W., et al. (2007). Recommendations for the Standardization and Interpretation of the Electrocardiogram. J. Am. Coll. Cardiol. 49, 1109–1127. doi: 10.1016/j.jacc.2007.01.024
Kruskal, W. H. (1952). A nonparametric test for the several sample problem. Ann. Math. Stat. 23, 525–540. doi: 10.1214/AOMS/1177729332
La Rovere, M. T., Pinna, G. D., and Raczak, G. (2008). Baroreflex sensitivity: measurement and clinical implications. Ann. Noninvas. Electrocardiol. 13, 191–207. doi: 10.1111/j.1542-474X.2008.00219.x
Lanfranchi, P. A., and Somers, V. K. (2002). Arterial baroreflex function and cardiovascular variability: interactions and implications. Am. J. Physiol. Regul. Integr. Comp. Physiol. 283, R815–R826. doi: 10.1152/ajpregu.00051.2002
Laude, D., Elghozi, J. L., Girard, A., Bellard, E., Bouhaddi, M., Castiglioni, P., et al. (2004). Comparison of various techniques used to estimate spontaneous baroreflex sensitivity (the EuroBaVar study). Am. J. Physiol. Regul. Integr. Comp. Physiol. 286, R226–R231. doi: 10.1152/ajpregu.00709.2002
Lázaro, J., Gil, E., Orini, M., Laguna, P., and Bailón, R. (2019). Baroreflex sensitivity measured by pulse photoplethysmography. Front. Neurosci. 13:339. doi: 10.3389/fnins.2019.00339
Leary, E. B., Watson, K. T., Ancoli-Israel, S., Redline, S., Yaffe, K., Ravelo, L. A., et al. (2020). Association of rapid eye movement sleep with mortality in middle-aged and older adults. JAMA Neurol. 77, 1241–1251. doi: 10.1001/jamaneurol.2020.2108
Legramante, J. M., Marciani, M. G., Placidi, F., Aquilani, S., Romigi, A., Tombini, M., et al. (2003). Sleep-related changes in baroreflex sensitivity and cardiovascular autonomic modulation. J. Hypertens. 21, 1555–1561. doi: 10.1097/01.hjh.0000084700.87421.fb
Lewis, M. J., Short, A. L., and Lewis, K. E. (2006). Autonomic nervous system control of the cardiovascular and respiratory systems in asthma. Respir. Med. 100, 1688–1705. doi: 10.1016/j.rmed.2006.01.019
Liu, G. R., Lustenberger, C., Lo, Y. L., Liu, W. T., Sheu, Y. C., and Wu, H. T. (2020). Save muscle information-unfiltered EEG signal helps distinguish sleep stages. Sensors 20:2024. doi: 10.3390/s20072024
Lombardi, C., Pengo, M. F., and Parati, G. (2019). Obstructive sleep apnea syndrome and autonomic dysfunction. Autonom. Neurosci. 221:102563. doi: 10.1016/j.autneu.2019.102563
Maestri, R., Raczak, G., Torunski, A., Sukiennik, A., Kozlowski, D., La Rovere, M. T., et al. (2009). Day-by-day variability of spontaneous baroreflex sensitivity measurements: implications for their reliability in clinical and research applications. J. Hypertens. 27, 806–812. doi: 10.1097/HJH.0b013e328322fe4b
Mann, H. B., and Whitney, D. R. (1947). On a test of whether one of two random variables is stochastically larger than the other. Ann. Math. Stat. 18, 50–60. doi: 10.1214/aoms/1177730491
Mayer, P., Herrero Babiloni, A., Beetz, G., Marshansky, S., Kaddaha, Z., Rompré, P. H., et al. (2020). The evaluation of autonomic arousals in scoring sleep respiratory disturbances with polysomnography and portable monitor devices: a proof of concept study. Nat. Sci. Sleep 12, 443–451. doi: 10.2147/NSS.S258276
Molkov, Y. I., Zoccal, D. B., Baekey, D. M., Abdala, A. P., Machado, B. H., Dick, T. E., et al. (2014). Physiological and pathophysiological interactions between the respiratory central pattern generator and the sympathetic nervous system. Prog. Brain. Res. 212, 1–23. doi: 10.1016/B978-0-444-63488-7.00001-X
Mortara, A., La Rovere, M. T., Pinna, G. D., Prpa, A., Maestri, R., Febo, O., et al. (1997). Arterial baroreflex modulation of heart rate in chronic heart failure. Clinical and hemodynamic correlates and prognostic implications. Circulation 96, 3450–3458. doi: 10.1161/01.cir.96.10.3450
Mrowka, R., Cimponeriu, L., Patzak, A., and Rosenblum, M. G. (2003). Directionality of coupling of physiological subsystems: age-related changes of cardiorespiratory interaction during different sleep stages in babies. Am. J. Physiol. Regul. Integr. Comp. Physiol. 285, R1395–R1401. doi: 10.1152/ajpregu.00373.2003
Mrowka, R., Patzak, A., and Rosenblum, M. G. (2000). Quantitative analysis of cardiorespiratory synchronization in infants. Int. J. Bifurcation Chaos 10, 2479–2488. doi: 10.1142/S0218127400001754
Nakamura, T., Adjei, T., Alqurashi, Y., Looney, D., Morrell, M. J., and Mandic, D. P. (2017). “Complexity science for sleep stage classification from EEG,” in 2017 International Joint Conference on Neural Networks (IJCNN) (Piscataway: IEEE), 4387–4394. doi: 10.1109/IJCNN.2017.7966411
Nakazato, T., Shikama, T., Toma, S., Nakajima, Y., and Masuda, Y. (1998). Nocturnal variation in human sympathetic baroreflex sensitivity. J. Auton. Nerv. Syst. 70, 32–37. doi: 10.1016/s0165-1838(98)00024-1
Natarajan, A., Pantelopoulos, A., Emir-Farinas, H., and Natarajan, P. (2020). Heart rate variability with photoplethysmography in 8 million individuals: a cross-sectional study. Lancet Digit. Health 2, E650–E657. doi: 10.1016/S2589-7500(20)30246-6
Noble, D. J., and Hochman, S. (2019). Hypothesis: pulmonary afferent activity patterns during slow, deep breathing contribute to the neural induction of physiological relaxation. Front. Physiol. 10:1176. doi: 10.3389/fphys.2019.01176
Oh, S. M., Choi, S. H., Kim, H. J., Park, K. S., and Lee, Y. J. (2019). The association between obstructive sleep apnea during REM sleep and autonomic dysfunction as measured by heart rate variability. Sleep Breath. 23, 865–871. doi: 10.1007/s11325-018-01779-y
O’Leary, D. S., and Woodbury, D. J. (1996). Role of cardiac output in mediating arterial blood pressure oscillations. Am. J. Physiol. 271, R641–R646. doi: 10.1152/ajpregu.1996.271.3.R641
Orini, M., Laguna, P., Mainardi, L., and Bailón, R. (2012). Assessment of the dynamic interactions between heart rate and arterial pressure by the cross time–frequency analysis. Physiol. Meas. 33, 315–331. doi: 10.1088/0967-3334/33/3/315
Osborn, J. W., Jacob, F., and Guzman, P. (2005). A neural set point for the long-term control of arterial pressure: beyond the arterial baroreceptor reflex. Am. J. Physiol. Regul. Integr. Comp. Physiol. 288, R846–R855. doi: 10.1152/ajpregu.00474.2004
Pagani, M., Somers, V., Furlan, R., Dell’Orto, S., Conway, J., Baselli, G., et al. (1988). Changes in autonomic regulation induced by physical training in mild hypertension. Hypertension 12, 600–610. doi: 10.1161/01.hyp.12.6.600
Palmero, H. A., Caeiro, T. F., Iosa, D. J., and Bas, J. (1981). Baroreceptor reflex sensitivity index derived from phase 4 of the Valsalva manoeuvre. Hypertension 3, II134–II137. doi: 10.1161/01.hyp.3.6_pt_2.ii-134
Parashar, R., Amir, M., Pakhare, A., Rathi, P., and Chaudhary, L. (2016). Age related changes in autonomic functions. J. Clin. Diagn. Res. 10, CC11–CC15. doi: 10.7860/JCDR/2016/16889.7497
Parati, G., Di Rienzo, M., Bertinieri, G., Pomidossi, G., Casadei, R., Groppelli, A., et al. (1988). Evaluation of the baroreceptor-heart rate reflex by 24-hour intraarterial blood pressure monitoring in humans. Hypertension 12, 214–222. doi: 10.1161/01.hyp.12.2.214
Parmeggiani, P. (1994). The Autonomic Nervous System in Sleep. Principles and Practice of Sleep Medicine, 2nd Edn. Philadelphia, PA: Saunders, doi: 10.1002/ppul.1065
Peter, J. H., Gassel, W., Mayer, J., Herres-Mayer, B., Penzel, T., Schneider, H., et al. (1989). Effects of cilazapril on hypertension, sleep, and apnea. Am. J. Med. 87, 72S–78S. doi: 10.1016/s0002-9343(89)80935-0
Pichot, V., Roche, F., Celle, S., Barthélémy, J. C., and Chouchou, F. (2016). HRV analysis: a free software for analyzing cardiac autonomic activity. Front. Physiol. 7:557. doi: 10.3389/fphys.2016.00557
Pietri, P., and Stefanadis, C. (2021). Cardiovascular aging and longevity: JACC State-of-the-Art review. J. Am. Coll. Cardiol. 77, 189–204. doi: 10.1016/j.jacc.2020.11.023
Pikovsky, A., Rosenblum, M., and Kurths, J. (2001). Synchronization: À Universal Concept in Nonlinear Sciences. New York, NY: Cambridge University Press.
Pinna, G. D., La Rovere, M. T., Maestri, R., Mortara, A., Bigger, J. T., and Schwartz, P. J. (2000). Comparison between invasive and noninvasive measurements of baroreflex sensitivity: implications from studies on risk stratification after a myocardial infarction. Eur. Heart. J. 18, 1522–1529. doi: 10.1053/euhj.1999.1948
Ponomarenko, V. I., Karavaev, A. S., Borovkova, E. I., Hramkov, A. N., Kiselev, A. R., Prokhorov, M. D., et al. (2021). Decrease of coherence between the respiration and parasympathetic control of the heart rate with aging. Chaos 31:073105. doi: 10.1063/5.0056624
Ponomarenko, V. I., Prokhorov, M. D., Karavaev, A. S., Kiselev, A. R., Gridnev, V. I., and Bezruchko, B. P. (2013). Synchronization of low-frequency oscillations in the cardiovascular system: application to medical diagnostics and treatment. Eur. Phys. J. Spec. Top. 222, 2687–2696. doi: 10.1140/epjst/e2013-02048-1
Prokhorov, M. D., Karavaev, A. S., Ishbulatov, Y. M., Ponomarenko, V. I., Kiselev, A. R., and Kurths, J. (2021). Interbeat interval variability versus frequency modulation of heart rate. Phys. Rev. E. 103:042404. doi: 10.1103/PhysRevE.103.042404
Prokhorov, M. D., Ponomarenko, V. I., Gridnev, V. I., Bodrov, M. B., and Bespyatov, A. B. (2003). Synchronization between main rhythmic processes in the human cardiovascular system. Phys. Rev. E. 68:041913. doi: 10.1103/PhysRevE.68.041913
Rechtschaffen, A., and Kales, A. (1968). A Manual of Standardized Terminology, Techniques and Scoring System of Sleep Stages in Human Subjects. UCLA Brain Information Service. Los Angeles: Brain Research Institute.
Ringwood, J. V., and Malpas, S. C. (2001). Slow oscillations in blood pressure via a nonlinear feedback model. Am. J. Physiol. Regul. Integr. Comp. Physiol. 280, R1105–R1115. doi: 10.1152/ajpregu.2001.280.4.R1105
Rosenblum, M., and Kurths, J. (1998). “Analysing synchronization phenomena from bivariate data by means of the hilbert transform,” in Nonlinear Analysis of Physiological Data, eds H. Kantz, J. Kurths, and G. Mayer-Kress (Berlin: Springer), 91–99.
Schreiber, T., and Schmitz, A. (1996). Improved surrogate data for nonlinearity tests. Phys. Rev. Lett. 77, 635–638. doi: 10.1103/PhysRevLett.77.635
Schumann, A. Y., Bartsch, R. P., Penzel, T., Ivanov, P. C., and Kantelhardt, J. W. (2010). Aging effects on cardiac and respiratory dynamics in healthy subjects across sleep stages. Sleep 33, 943–955. doi: 10.1093/sleep/33.7.943
Shaffer, F., and Ginsberg, J. P. (2017). An overview of heart rate variability metrics and norms. Front. Public. Health. 5:258. doi: 10.3389/fpubh.2017.00258
Sharma, G., and Goodwin, J. (2006). Effect of aging on respiratory system physiology and immunology. Clin. Interv. Aging 1, 253–260. doi: 10.2147/ciia.2006.1.3.253
Shiogai, Y., Stefanovska, A., and McClintock, P. V. E. (2010). Nonlinear dynamics of cardiovascular ageing. Phys. Rep. 488, 51–110. doi: 10.1016/j.physrep.2009.12.003
Sleight, P., La Rovere, M. T., Mortara, A., Pinna, G., Maestri, R., Leuzzi, S., et al. (1995). Physiology and pathophysiology of heart rate and blood pressure variability in humans: is power spectral analysis largely an index of baroreflex gain? Clin. Sci. 88, 103–109. doi: 10.1042/cs0880103
Smyth, H. S., Sleight, P., and Pickering, G. W. (1969). Reflex regulation of arterial pressure during sleep in man: a quantitative method of assessing baroreflex sensitivity. Circ. Res. 24, 109–121. doi: 10.1161/01.res.24.1.109
Somers, V. K., Dyken, M. E., Mark, A. L., and Abboud, F. M. (1993). Sympathetic-nerve activity during sleep in normal subjects. N. Engl. J. Med. 328, 303–307. doi: 10.1056/NEJM199302043280502
Subramanian, S. K., Sharma, V. K., Arunachalam, V., Rajendran, R., and Gaur, A. (2019). Comparison of baroreflex sensitivity and cardiac autonomic function between adolescent athlete and non-athlete boys - a cross-sectional study. Front. Physiol. 10:1043. doi: 10.3389/fphys.2019.01043
Swenne, C. A. (2013). Baroreflex sensitivity: mechanisms and measurement. Neth. Heart J. 21, 58–60. doi: 10.1007/s12471-012-0346-y
Tan, C. O. (2013). Heart rate variability: are there complex patterns? Front. Physiol. 4:165. doi: 10.3389/fphys.2013.00165
Task Force of the European Society of Cardiology [TFESC] (1996). Heart rate variability: standards of measurement, physiological interpretation and clinical use. Circulation 3, 1043–1065. doi: 10.1161/01.cir.93.5.1043
Theiler, J., Eubank, S., Longtin, A., Galdrikian, B., and Farmer, J. D. (1992). Testing for nonlinearity in time series: the method of surrogate data. Phys. D. 58, 77–94. doi: 10.1016/0167-2789(92)90102-S
Tripathy, R. K., and Acharya, U. (2018). Use of features from RR-time series and EEG signals for automated classification of sleep stages in deep neural network framework. Biocybern. Biomed. Eng. 38, 890–902. doi: 10.1016/J.BBE.2018.05.005
Valente, M., Javorka, M., Porta, A., Bari, V., Krohova, J., Czippelova, B., et al. (2018). Univariate and multivariate conditional entropy measures for the characterization of short-term cardiovascular complexity under physiological stress. Physiol. Meas. 39:014002. doi: 10.1088/1361-6579/aa9a91
Van de Borne, P., Nguyen, H., Biston, P., Linkowski, P., and Degaute, J. P. (1994). Effects of wake and sleep stages on the 24-h autonomic control of blood pressure and heart rate in recumbent men. Am. J. Physiol. 266, H548–H554. doi: 10.1152/ajpheart.1994.266.2.H548
Van Roon, A. M., Mulder, L. J. M., Althaus, M., and Mulder, G. (2004). Introducing a baroreflex model for studying cardiovascular effects of mental workload. Psychophysiology 41, 961–981. doi: 10.1111/j.1469-8986.2004.00251.x
Vanneau, T., Quiquempoix, M., Trignol, A., Verdonk, C., van Beers, P., Sauvet, F., et al. (2021). Determination of the sleep–wake pattern and feasibility of NREM/REM discrimination using the non-invasive piezoelectric system in rats. J. Sleep Res. 30:e13373. doi: 10.1111/jsr.13373
Vanoli, E., Adamson, P. B., Lin, B., Pinna, G. D., Lazzara, R., and Orr, W. C. (1995). Heart rate variability during specific sleep stages. A comparison of healthy subjects with patients after myocardial infarction. Circulation 91, 1918–1922. doi: 10.1161/01.cir.91.7.1918
Wagner, C. D., and Persson, P. B. (1998). Chaos in the cardiovascular system: an update. Cardiovasc. Res. 40:257. doi: 10.1016/s0008-6363(98)00251-x
Wessel, N., Berg, K., Kraemer, J. F., Gapelyuk, A., Rietsch, K., Hauser, T., et al. (2020). Cardiac autonomic dysfunction and incidence of de novo atrial fibrillation: heart rate variability vs. heart rate complexity. Front. Physiol. 11:596844. doi: 10.3389/fphys.2020.596844
Young, B. E., Kaur, J., Vranish, J. R., Stephens, B. Y., Barbosa, T. C., Cloud, J. N., et al. (2020). Augmented resting beat-to-beat blood pressure variability in young, healthy, non-Hispanic black men. Exp. Physiol. 105, 1102–1110. doi: 10.1113/EP088535
Keywords: autonomic control, cardiovascular system, sleep studies, synchronization, apnea, interbeat intervals, blood pressure
Citation: Karavaev AS, Skazkina VV, Borovkova EI, Prokhorov MD, Hramkov AN, Ponomarenko VI, Runnova AE, Gridnev VI, Kiselev AR, Kuznetsov NV, Chechurin LS and Penzel T (2022) Synchronization of the Processes of Autonomic Control of Blood Circulation in Humans Is Different in the Awake State and in Sleep Stages. Front. Neurosci. 15:791510. doi: 10.3389/fnins.2021.791510
Received: 08 October 2021; Accepted: 09 December 2021;
Published: 12 January 2022.
Edited by:
Yue-Der Lin, Feng Chia University, TaiwanCopyright © 2022 Karavaev, Skazkina, Borovkova, Prokhorov, Hramkov, Ponomarenko, Runnova, Gridnev, Kiselev, Kuznetsov, Chechurin and Penzel. This is an open-access article distributed under the terms of the Creative Commons Attribution License (CC BY). The use, distribution or reproduction in other forums is permitted, provided the original author(s) and the copyright owner(s) are credited and that the original publication in this journal is cited, in accordance with accepted academic practice. No use, distribution or reproduction is permitted which does not comply with these terms.
*Correspondence: Anatoly S. Karavaev, a2FyYXZhZXZhc0BnbWFpbC5jb20=
Disclaimer: All claims expressed in this article are solely those of the authors and do not necessarily represent those of their affiliated organizations, or those of the publisher, the editors and the reviewers. Any product that may be evaluated in this article or claim that may be made by its manufacturer is not guaranteed or endorsed by the publisher.
Research integrity at Frontiers
Learn more about the work of our research integrity team to safeguard the quality of each article we publish.