
94% of researchers rate our articles as excellent or good
Learn more about the work of our research integrity team to safeguard the quality of each article we publish.
Find out more
ORIGINAL RESEARCH article
Front. Neurosci., 16 September 2021
Sec. Brain Imaging Methods
Volume 15 - 2021 | https://doi.org/10.3389/fnins.2021.731596
This article is part of the Research TopicInnovative fMRI Data Modeling Methods for Brain-Related Diseases/DisordersView all 12 articles
 Feiling Lou1†
 Jiejie Tao1†Ronghui Zhou1Shuangli Chen1
 Andan Qian1
 Chuang Yang2Xiangwu Zheng1
 Bicheng Chen3
 Zhishan Hu4*
 Meihao Wang1*
Objective: Attention deficit hyperactivity disorder (ADHD) is a commonly diagnosed neuropsychiatric disorder in children, which is characterized by inattention, hyperactivity and impulsivity. Using resting-state functional magnetic resonance imaging (R-fMRI), the alterations of static and dynamic characteristics of intrinsic brain activity have been identified in patients with ADHD. Yet, it remains unclear whether the concordance among indices of dynamic R-fMRI is altered in ADHD.
Methods: R-fMRI scans obtained from 50 patients with ADHD and 28 healthy controls (HC) were used for the current study. We calculated the regional dynamic changes in brain activity indices using the sliding-window method and compared the differences in variability of these indices between ADHD patients and HCs. Further, the concordance among these dynamic indices was calculated and compared. Finally, the relationship between variability/concordance of these indices and ADHD-relevant clinical test scores was investigated.
Results: Patients with ADHD showed decreased variability of dynamic amplitude of low-frequency fluctuation (dALFF) in the left middle frontal gyrus and increased one in right middle occipital gyrus, as compared with the HCs. Besides, ADHD patients showed decreased voxel-wise concordance in the left middle frontal gyrus. Further, lower voxel-wise concordance in ADHD’s left middle frontal gyrus was associated with more non-perseverative errors in Wisconsin Card Sorting Test, which reflects worse cognitive control.
Conclusion: Our findings suggest that variability and concordance in dynamic brain activity may serve as biomarkers for the diagnosis of ADHD. Further, the decreased voxel-wise concordance is associated with deficit in cognitive control in ADHD patients.
Attention deficit hyperactivity disorder (ADHD) is characterized by inattention, hyperactivity and impulsivity. It is one of the most commonly diagnosed childhood neurodevelopmental disorder, whose prevalence in school-age children and adolescents is estimated at 7.2% (Thomas et al., 2015). This disorder seriously affects these children’s academic performance and social skills and causes immense burden for their families.
Maladaptive in the intrinsic brain activity of ADHD was frequently reported in previous studies. Many of these findings were derived from resting-state functional magnetic resonance imaging (R-fMRI), which measures the blood oxygen level dependent (BOLD) signal without task or stimulation and further characterizes the spatiotemporal organization of brain activities (Forster et al., 1998; Fox and Raichle, 2007). In specific, multiple R-fMRI indices have been developed to depict the intrinsic BOLD signal. For example, amplitude of low frequency fluctuation (ALFF) characterizes the intensity of local activity of brain spontaneous activity (Zang et al., 2007; Zou et al., 2008); Regional homogeneity (ReHo) measures the consistency of regional neural activity (Zang et al., 2004); Degree centrality (DC) describes the association between a local area with the whole brain (Buckner et al., 2009; Zuo et al., 2012); Voxel mirror homotopic connectivity (VMHC) represents the functional connectivity between each pair of symmetrical interhemispheric voxels (Zuo et al., 2010). Global signal connectivity (GSC) is described as the correlation between local voxels and global signal (Hahamy et al., 2014; Power et al., 2017).
These R-fMRI indices have been used to characterize the maladaptive brain functions in patients with ADHD. For example, children with ADHD exhibited increased ALFF in the occipital cortex and globus pallidus (An et al., 2013; Li et al., 2014), and decreased one in the left orbitofrontal cortex and ventral superior frontal gyrus (Li et al., 2014), showing hyperactive visual processing and hypoactive frontal control. Meanwhile, increased ReHo was reported in the bilateral lingual and fusiform gyri and right dorsal anterior cingulate cortices, and decreased ReHo in the bilateral ventral medial prefrontal cortex, cerebellum and right middle frontal gyrus, and right precuneus (An et al., 2013), which again indicated deficit in frontal lobe. In addition, the increased ReHo in right dorsal anterior cingulate cortex and left lingual gyrus, and the decreased ReHo in right cerebellum were associated with higher ADHD symptom scores in the ADHD group (An et al., 2013). Meantime, decreased DC was observed in the head of the right pallidum, caudate and putamen and in the left postcentral cortex (Di Martino et al., 2013), as well as right posterior cingulate gyrus and frontoparietal network (Jiang et al., 2019). Also, it was found that children with ADHD exhibited increased DC in the cerebellar anterior lobe, cingulate gyrus and middle occipital cortex, and increased VMHC in bilateral superior frontal, middle occipital, and cerebellar anterior lobes (Jiang et al., 2019). The findings above have proven that the R-fMRI indices can successfully capture the dysfunctions in the brains of ADHD patients.
Although these studies provided insights into the neural basis of ADHD, they failed to capture the dynamic changes in brain activities. Recent evidence demonstrated the temporal dynamic in brain activity patterns (Hutchison et al., 2013; Allen et al., 2014) and found that the alterations in these patterns were associated with neurological and psychiatric disorders. For example, patients with generalized anxiety disorder (GAD) exhibited increased variability in dynamic ALFF (dALFF) across wide spread brain regions (Cui et al., 2020). Meanwhile, patients with major depressive disorder (MDD) showed decreased variability in dALFF in the emotion network (Li et al., 2019). As for patients with ADHD, one study reported that they showed decreased mean value and variability in dynamic ReHo in the parietal lobe, compared to the healthy control group (Kim et al., 2018).
In addition, the concordance, i.e., temporal and spatial coupling, among multiple dynamic brain activity indices shows stable individual difference (Yan et al., 2017). Studies revealed that patients with psychiatric disorders exhibited decreased concordance in brain activity indices. For example, patients with schizophrenia showed decreased volume-wise concordance in whole gray matter and reduced voxel-wise concordance in multiple brain regions. Moreover, these concordance changes were negatively correlated with their onset age (Zhu et al., 2018). For MDD patients, reduced concordance was found in a wide range of brain regions, and the reduction was associated with impaired prospective memory and sustained attention (Zhu et al., 2019). Considering the tight relationship between the concordance of R-fMRI indices and mental disorders, the concordance may also underpin the ADHD. However, little has been done to explore this potential biomarker.
The current study aimed to bridge this gap. In specific, we compared the variability of dynamic R-fMRI indices and concordance among them between patients with ADHD and healthy controls, and further correlated the variability/concordance with the clinical test scores. Based on the results of previous studies, we hypothesized that ADHD patients would exhibit abnormalities in dynamic brain activity and its concordance, and this concordance would be related to its clinical manifestations. Our study may enhance the understanding of the neural mechanism underlying ADHD.
Fifty-eight drug-naïve ADHD patients were recruited from the Out-patient Clinic of the First Affiliated Hospital of Wenzhou Medical University. Meanwhile, 31 healthy controls matched in gender, age and IQ were recruited from local schools. The diagnosis of ADHD was performed by three experienced psychiatrists according to the Fifth Edition of the Diagnostic and Statistical Manual of Mental Disorders (DSM-V). For all the participants, the exclusion criteria were: (1) conduct disorder, oppositional defiant disorder, or any other psychotropic disorder besides ADHD; (2) history of major neurological or physical illness; (3) current or history use of psychotropic drugs; (4) intelligence quotient (IQ) lower than 80; (5) MR scanning contraindications. This study was approved by the Ethics Committee of the First Affiliated Hospital of Wenzhou Medical University. All participants were well informed and written informed consent was obtained before the test.
The revised version of Conners’ Parent Rating Scale (CPRS) (Conners et al., 1998) was used to assess children’s behavioral problems, including conduct problems, study problems, psychosomatic disorders, impulse hyperactivity, anxiety, and hyperactivity.
The computerized Wisconsin Card Sorting Test (WCST) (Feldstein et al., 1999) was used to assess the executive function, including cognitive flexibility, working memory, continuous attention, and response inhibition. In specific, patients were required to match two cards according to the color, shape or quantity. After 10 trials of correct matching, one completed session was counted and the rule would be changed. The task was ended if the participants complete six sessions or 128 trials. The perseverative errors (at least two successive errors) and non-perseverative errors were counted. Note that non-perseverative errors were counted as the difference between the total number of errors and the number of perseverative errors.
Images were acquired in a 3T GE Sigma HDX 3.0 scanner (GE Healthcare, United States) with the following parameters: repetition time (TR) = 2,000 ms, echo time (TE) = 30 ms, 31 axial slices, slice thickness = 4 mm, slice gap = 0.2 mm, flip angle = 90°, matrix size = 64 × 64, field of view (FOV) = 192 × 192 mm, and 240 volumes. High-spatial-resolution T1-weighted 3D images were obtained axially using the following parameters:162 axial slices, repetition time (TR) = 7,200 ms, echo time (TE) = 2.2 ms, flip angle = 7°, section thickness = 1 mm, gap = 0, field of view (FOV) = 256 × 256 mm, data matrix = 256 × 256. During the scanning, sponge earplugs were used to reduce scanner noise, and foam cushions were used to minimize head movement. The subjects were required to be relax, stay still, close their eyes, and stay awake.
Data Processing and Analysis for Brain Imaging (DPABI) (Yan et al., 2016) was used for data preprocessing: (1) the first 10 volumes were eliminated to enable subjects to adapt to the scanning environment and the magnetic field to be stable; (2) slice timing correction; (3) head motion correction (subjects were excluded from further analysis if their maximal head motion exceeded 3 mm displacement or 3°of rotation, 8 ADHD patients and 3 HCs were therefore excluded, leaving 50 ADHD patients and 28 HCs); (4) structural image alignment, aligning the individual T1-weighted image to the average functional image through six-degree-of-freedom linear transformation; (5) structural image segmentation, which divides the structural image into gray matter, white matter and cerebrospinal fluid; (6) nuisance covariates regression, including the Friston-24 motion parameters, white matter signals, cerebrospinal fluid signals and linear drift. Note that the multiple direction motion parameters and the mean frame-wise displacement (FD) of each subject were calculated to evaluate and compare the head motion, results were listed in Table 1 and Supplementary Table 1; (7) based on the segmented images, the individual space was transformed to the MNI space using the DARTEL (diffeomorphic anatomical registration through exponentiated lie algebra) tool, and the resampled voxel size is 3 mm × 3 mm × 3 mm.
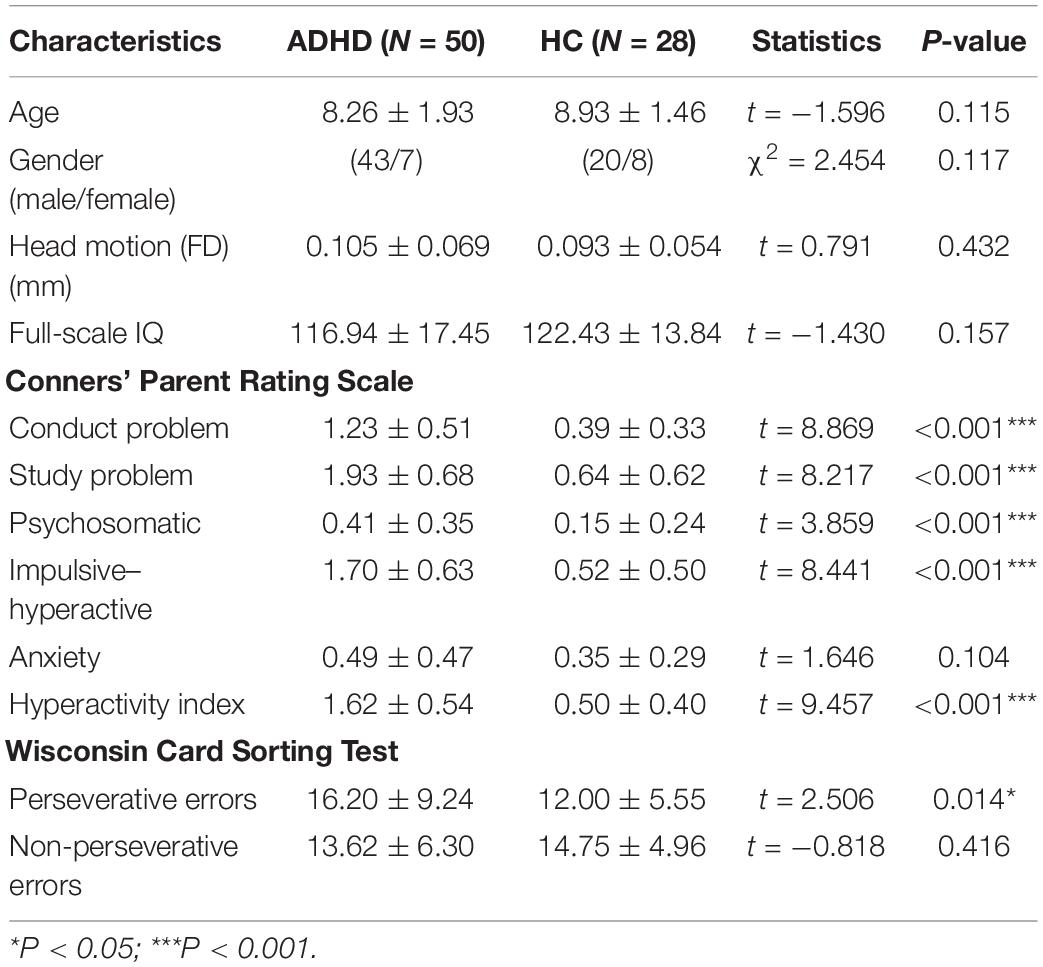
Table 1. Clinical and demographic characteristics of ADHD patients and HCs.
R-fMRI indices were calculated with following procedures:
ALFF (Zang et al., 2007; Zou et al., 2008). After Fourier transform of time series of a voxel, ALFF takes the mean amplitude of a specific frequency range (0.01–0.08 Hz) as the intensity of local activity of the voxel.
ReHo (Zang et al., 2004). The Kendall’s coefficient of concordance between the time series of a given voxel and the time series of its closest voxel.
DC (Buckner et al., 2009; Zuo et al., 2012). In this study, we calculate the Pearson correlation coefficient between the time course of each voxel and the time course of every other voxel in the whole brain. For each voxel, DC denotes the sum of connections that showed a correlation coefficient exceeding 0.25 (Buckner et al., 2009; Yan et al., 2017). Correlations below this threshold were considered mainly caused by signal noise. Meanwhile, it has been proven that different threshold selection from 0.1 to 0.3 did not significantly change the network structure (Buckner et al., 2009). The obtained DC values were converted to Z-scores by subtracting the global mean DC and dividing by the SD of the whole brain DC, the obtained voxel-wise DC map.
VMHC (Zuo et al., 2010). Function images were transformed into a symmetric space. Then, Pearson’s correlation coefficients between time series from homologous brain regions were calculated (VMHC). Finally, the VMHC maps were transformed by Fisher Z-transformation for subsequent analysis.
GSC (Hahamy et al., 2014; Power et al., 2017). BOLD signals from all the voxels were averaged as the global signal. Pearson correlation coefficients between each voxel time course and the global signal were calculated to get the GSC maps, finally The GSC maps included in the subsequent analysis were Fisher Z-transformed.
In particular, dynamics of these R-fMRI indices were analyzed using Temporal Dynamic Analysis (TDA) toolkits based on DPABI (Yan et al., 2016). Specifically, R-fMRI indices mentioned above were computed with the hamming windows (window length = 32 TR, window step = 4 TR, generating 50 windows). Previous studies have revealed that even a window length ranged from 30 to 60 s is able to capture dynamic functional connectivity fluctuations and different window lengths do not yield significantly different results (Preti et al., 2017). Also, previous studies have demonstrated that the step size does not dramatically affect the variance of dynamic properties of R-fMRI (Liao et al., 2019). Therefore, we used a window length of 32 TR (64 s) and a step size of 4 TR (8 s) (Yang et al., 2020). More importantly, different window length (48 TR/64 TR) were used to validate our results (see Supplementary Materials). The R-fMRI indices mentioned above were prefixed with a d to indicate the dynamic indices. For example, dALFF represents dynamic ALFF. Further, the standard deviation (SD) of each index across the time series from each voxel was calculated and normalized across the voxels to measure the variability in these dynamic R-fMRI indices. Finally, the normalized SD maps of each dynamic R-fMRI index were smoothed (FWHM = 4 mm) to improve the signal-to-noise ratio.
The concordance of five dynamic R-fMRI indices (ALFF, ReHo, DC, VMHC, and GSC) were calculated. In specific, volume-wise and voxel-wise concordance was measured by Kendall’s W among these indices (Yan et al., 2017). The volume-wise concordance (spatial concordance) was calculated in two steps. First, compute the Kendall’s W of the five indices across voxels for each window. Second, the dynamic volume-wise concordance was computed as the averaged Kendall’s W across all time windows for each participant. The voxel-wise concordance (temporal concordance) was measured by the Kendall’s W of the five indices across all time windows. By doing this, each voxel (voxel-wise) was assigned a concordance value. These voxel-wise concordance maps were then smoothed (FWHM = 4 mm) for subsequent analyses. Thus, for each participant, they got one volume-wise concordance value and N (N = number of voxels) voxel-wise concordance values.
Importantly, we validated the results with the window length of 48 and 64 TR.
We compared age, IQ, ADHD-relevant clinical variables between ADHD patients and healthy controls using two-sample t-tests. Meanwhile, gender distributions were compared using chi-square test. These statistical analyses were performed with SPSS 23.0.
The dynamic R-fMRI indices and voxel-wise concordance were compared using two-sample t-test, and the whole-brain gray mask was applied, and the results were corrected by multiple comparisons using Gaussian random field theory (GRF, voxel-wise p < 0.001, cluster-wise p < 0.05, two-tailed). Meanwhile, the volume-wise concordance was compared using analysis of covariance (ANCOVA). Further, Pearson or Spearman partial correlation was used to quantify the associations between dynamic indices and ADHD-relevant clinical test scores. Note that the age, gender, IQ, and head motions are controlled as covariates.
The characteristics of samples were summarized in Table 1. In particular, the ADHD group and the HCs group showed no significant differences in age, gender, head motion, or IQ. As measured by CPRS, ADHD patients exhibited significantly higher hyperactive and impulsive, and had more serious behavior and learning problems. In Wisconsin Card Sorting Test, the number of perseverative errors in ADHD group was higher than that in HC group (P = 0.014).
Compared with HCs, the ADHD group exhibited increased dALFF variability in right middle occipital gyrus and decreased dALFF variability in left middle frontal gyrus (GRF, voxel-wise p < 0.001, cluster-wise p < 0.05, two-tailed; see Table 2 and Figure 1). No significant between-group difference was found for the dynamics of other R-fMRI indices.

Table 2. Brain regions with significant differences in R-fMRI dynamic indices (SD) between ADHD patients and HCs.
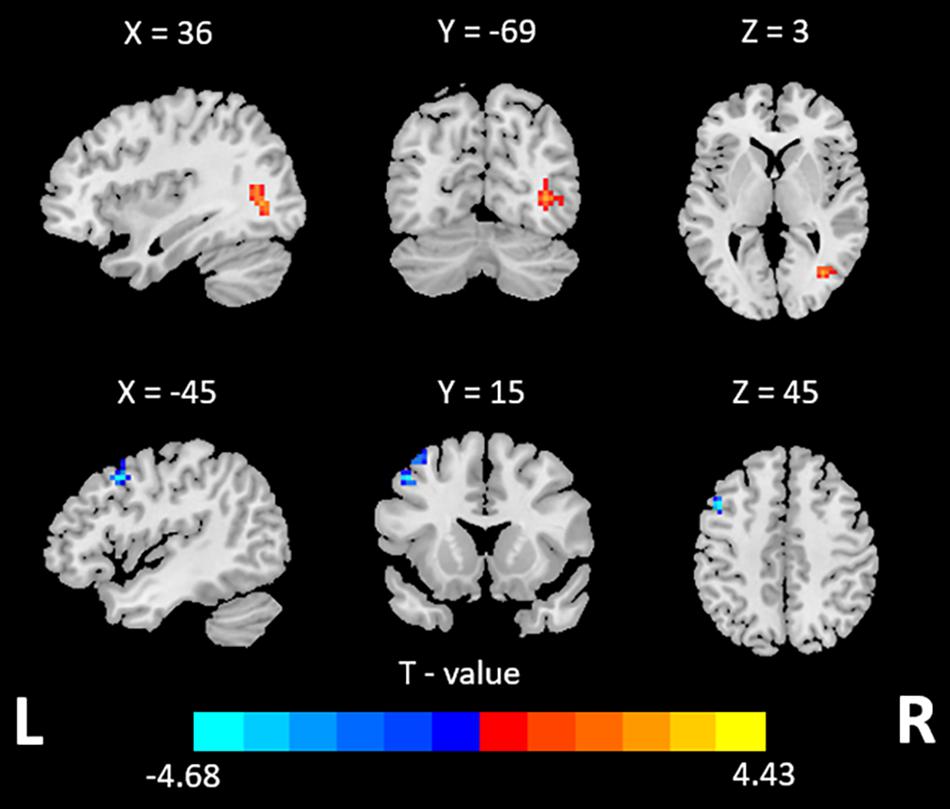
Figure 1. Brain regions showing different dALFF variability between the ADHD and HCs.
The ANCOVA results indicated no significant differences in volume-wise concordance between the ADHD group and HC group. However, ADHD patients showed decreased voxel-wise concordance in left middle frontal gyrus (GRF, voxel-wise p < 0.001, cluster-wise p < 0.05, two-tailed; see Table 3 and Figure 2).

Table 3. Brain region with decreased voxel-wise concordance in ADHD.

Figure 2. Brain region showing different voxel-wise concordance between the ADHD and HCs.
No significant correlations were found between the CPRS scores and altered dALFF variability for the ADHD group. However, the abnormal voxel-wise concordance of the left middle frontal was negatively correlated with the non-perseverative errors in WCST of patients with ADHD (Pearson partial correlation, r = −0.367, p = 0.012; see Figure 3). Meanwhile, we found no correlation between left middle frontal voxel-wise concordance and non-persistent errors in HC group (Pearson partial correlation, r = 0.099, p = 0.646; see Figure 3).
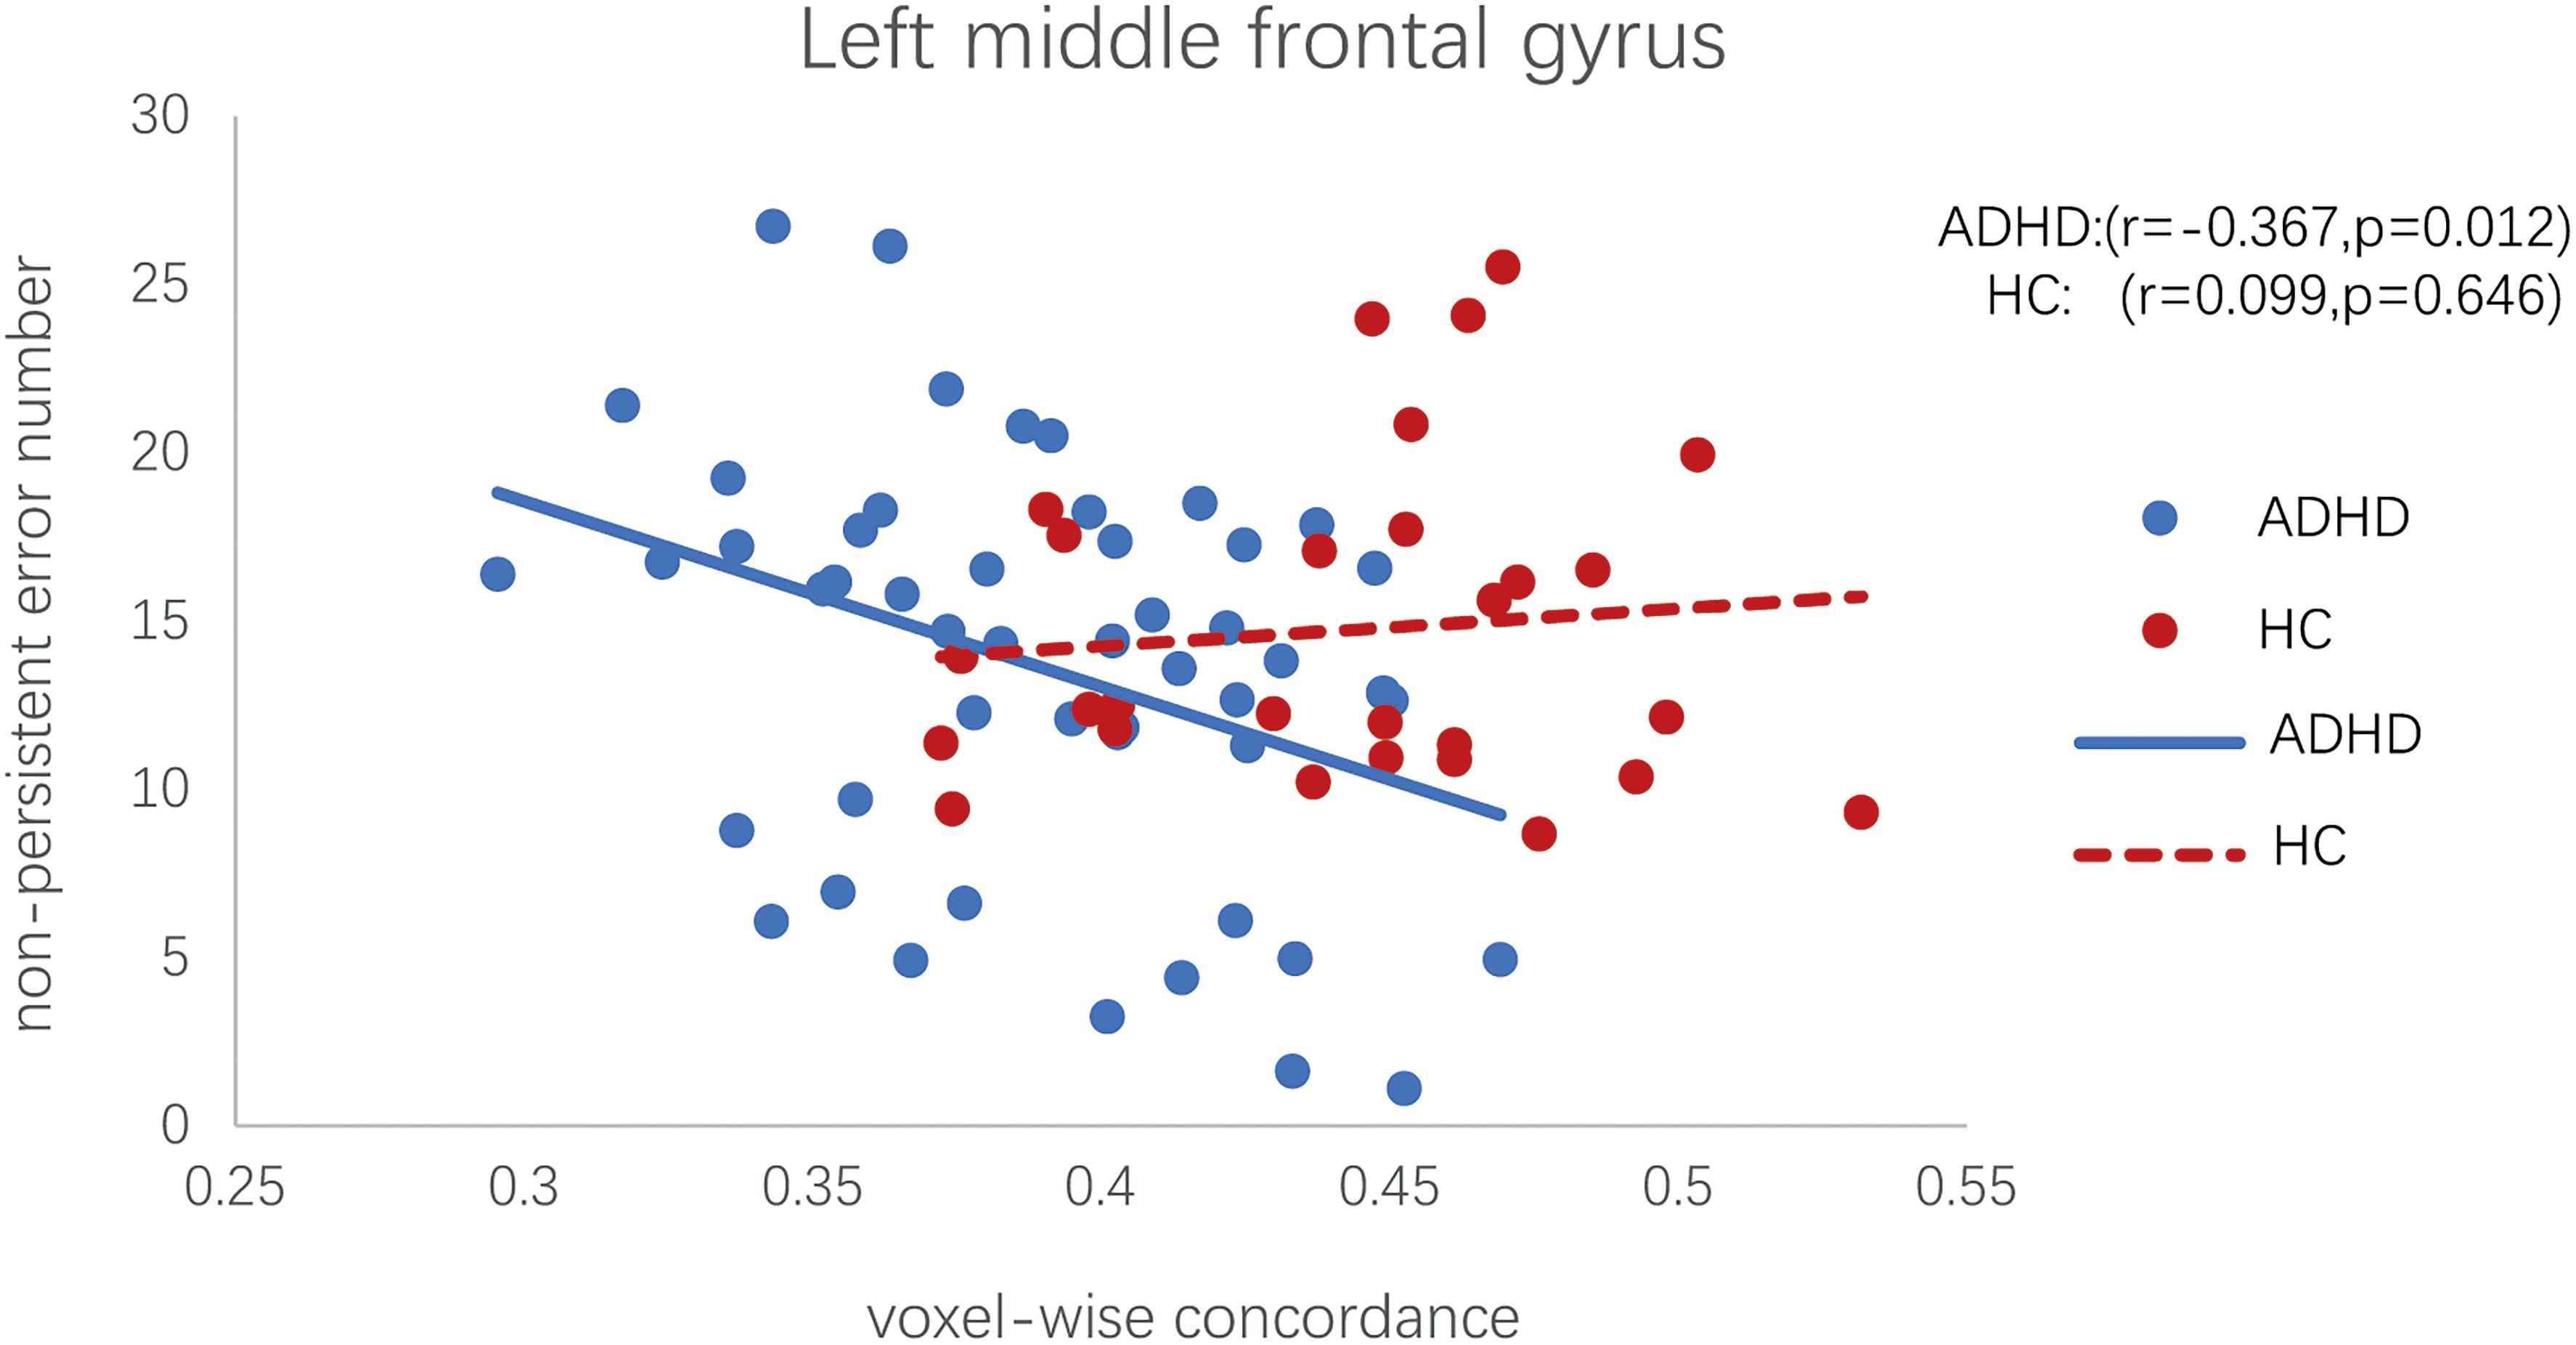
Figure 3. Scatter plot of the voxel-wise concordance in the left middle frontal and the non-perseverative errors in WCST of patients with ADHD. (Pearson partial correlation scatter diagram, controlling for effects of head motion, age, IQ, and gender).
The validation results with the window length of 48 and 64 TR showed good agreement with the results mentioned above (Supplementary Tables 2–5 and Supplementary Figures 1–6).
Abnormality in intrinsic brain activities is tightly associated with ADHD. This study systematically compared the dynamic changes in resting-state brain activities of patients with ADHD with HCs. Specifically, we calculated the temporal variability, spatial and temporal concordance of dynamic R-fMRI indices including ALFF, ReHo, DC, VMHC, and GSC in both groups. These properties were then compared between groups and correlated with the clinical variables, in which both the alterations and correlations were identified.
Specifically, for the variability, ADHD patients exhibited increased dALFF variability in right middle occipital gyrus and decreased one in left middle frontal gyrus, which may reflect the hyper-activation in visual cortex and hypo-activation in frontal cortex. This is consistent with a previous study in which decreased ReHo was found in frontal and increased ReHo and ALFF was found in visual cortex (An et al., 2013).
The development of the frontal lobe is essential for the acquisition, execution and control of a wide range of functions (Rosch and Mostofsky, 2019). And frontal lobe is a component of the brain region of the cognitive-attention network (cingulate-frontal lobe-parietal lobe), these areas are typically involved in cognitive, attentional, executive function, response inhibition, motor control, and working memory (Bush, 2011). Deficits in frontal lobe can lead to a series of developmental disorders like ADHD, and increase the psychopathological vulnerability. Many studies have revealed that the structural and functional abnormalities in the frontal lobe of patients with ADHD (Albajara Sáenz et al., 2019). For example, the volume of gray matter (Shaw et al., 2011) and the ALFF (Yang et al., 2011) in the middle frontal gyrus was decreased in ADHD patients. One previous study also exhibited decreased functional connectivity between right middle frontal gyrus and whole brain, and the decreased was associated with lower IQ (Shaw and Sudre, 2021). Consistent with the previous studies, we also observed decreased dALFF variability in middle frontal gyrus. The decreased dALFF variability indicated abnormal temporal fluctuations of brain activity in this region. Such an abnormal pattern may underlie the deficit in cognitive control of patients with ADHD, and the failure in cognitive control plays a key role in the main symptoms of ADHD.
Structural and functional alterations in occipital were also reported in previous studies. For example, reduced gray matter volume in the right middle occipital gyrus (Wang L. J. et al., 2020) and hyper-activation of occipital lobe function was found in ADHD (Tian et al., 2008; Icer et al., 2019), indicating that atypical visual processing may play a key role. Previous study also reported that the decreased connectivity between the frontal cortex and visual cortex was associated with increased severity in ADHD symptoms (Wang M. et al., 2020). Meanwhile, the interaction between the dorsal attention network and visual cortex is important for maintaining attention (Shulman et al., 2009). These findings suggest that brain activities in frontal and occipital regions and their interactions may play a key role in ADHD, which awaits further investigation.
Alterations in concordance among the dynamic R-fMRI indices were also identified in patients with ADHD. A recent study found that R-fMRI regional indices was high concordant in brain cortical and subcortical areas across the time window (Yan et al., 2017), and the voxel-wise concordance reflects homogeneity between these indices. Several studies on schizophrenia or MDD have found abnormal voxel-wise concordance in multiple brain regions (Zhu et al., 2018, 2019). These findings suggest that the concordance of dynamic indices may be an important biomarker for neuropsychiatric disorders. In our study, ADHD patients exhibited decreased voxel-wise concordance in the left middle frontal, which was consistent with the decreased dALFF variability in middle frontal gyrus, indicating maladaptive in frontal lobe.
In addition, we found that the voxel-wise concordance change in left middle frontal gyrus was negatively correlated with non-perseverative errors in WCST of ADHD group. Whereas, we did not find a correlation between them in the HCs. WCST is widely used to assess executive function, including cognitive flexibility, working memory, continuous attention and response inhibition (Godinez et al., 2012). Non-perseverative error measures the difficulties in working memory, sustained attention, and response inhibition (Barceló, 1999; Barceló and Knight, 2002; Godinez et al., 2012). Furthermore, non-perseverative errors have been found to be associated with frontal lobe function in patients with ADHD (Qian et al., 2018). However, no significant difference in non-perseverative errors was found between ADHD patients and healthy controls. This may due to the relatively small sample size, which might induce more variance and undermine the difference between these two groups. Nevertheless, this implies that the concordance in left middle frontal gyrus can be a sensitive biomarker that can capture the changes in non-preservative errors in ADHD patients.
Our findings highlighted the role of frontal lobe in the neuropathological mechanism of ADHD, and demonstrated that concordance of R-fMRI indices can serve as a biomarker to indicate the deficit in frontal lobe. To date, the diagnosis of ADHD is still based on symptom scores from clinical interviews, which can be subjective and can be influenced by many factors, such as the experience, stereotype, and cultural differences. Neuropsychiatric biomarkers can help to build a standard and objective diagnosis system, which can benefit the patients. R-fMRI is among the neuropsychiatric tools that have the potential to find the biomarkers (Abi-Dargham and Horga, 2016). Such biomarkers, combined with the rapidly developed machine learning algorithms, researchers are able to precisely classify the ADHD from healthy control (Du et al., 2018). R-fMRI indices such as ReHo (Wang et al., 2013) and functional connectivity (Fair et al., 2012) have been frequently used by these researchers. Functional concordance incorporates features from multiple metrics, which are fully explored in the current study, can also be used to train the machine learning models, and thereby can promote the accuracy of classification and prediction of ADHD.
Further, the behavioral dysfunction may be too subtle to be measured, just like the non-perseverative errors that failed to be capture by the current study. However, as mentioned above, the R-fMRI indices as proposed by the current study are able to evaluated the maladaptive of brain functions.
This study has several limitations. First, no significant differences were found among some dynamic indices, which may be due to the relatively small sample size. A larger sample size is needed to validate the alterations in dynamic brain function in ADHD and examine the relationship between dynamic variables and psychological data. Second, the current study only focus on the BOLD signal from gray matter. However, previous studies have demonstrated the white matter signals also provide valuable information (Peer et al., 2017; Ding et al., 2018; Li et al., 2020a,b). Hence, further studies are need to explore the altered variability and concordance of white matter signals in patients with ADHD. Third, this study used a variety of indices to reflect different patterns of dynamic spontaneous brain activity, but the seed-based functional connectivity analysis (FC) and independent component analysis (ICA) were not included in the analysis, this is because ICA may be biased by component selection and FC may be biased by seed definition. In future studies, more supplementary R-fMRI indices should be considered, which may help to describe the spontaneous brain activity more thoroughly and understand its underlying physiological processes more deeply.
The current study investigated the variability and concordance of a range of commonly used R-fMRI indices in ADHD. We found that patients with ADHD exhibited increased dALFF variability in right middle occipital gyrus and decreased dALFF variability in left middle frontal gyrus. Meanwhile, we found that voxel-wise concordance of a series of R-fMRI indices in patients with ADHD was decreased in frontal lobe, and a greater decrease was related to worse WSCT performance. These findings suggest that dynamic analysis and functional concordance may provide new insights into the neuropathological mechanism of ADHD.
The raw data supporting the conclusions of this article will be made available by the authors, without undue reservation.
The studies involving human participants were reviewed and approved by the Ethics Committee of the First Affiliated Hospital of Wenzhou Medical University. Written informed consent to participate in this study was provided by the participants’ legal guardian/next of kin.
FL and JT analyzed the data and wrote the manuscript. RZ analyzed the data. SC and AQ collected the MRI data. CY, XZ, and BC evaluated the subjects. ZH and MW designed and supervised the experiment, and finalized the manuscript. All authors reviewed the manuscript and made significant contribution to this manuscript.
This work was supported by the Wenzhou Municipal Science and Technology Bureau, China (grant No. Y20180185), the Medical Health Science and Technology Project of Zhejiang Provincial Health Commission (grant No. 2019KY102), the National Natural Science Foundation of China (62007002), and the China Postdoctoral Science Foundation (2020M670189).
The authors declare that the research was conducted in the absence of any commercial or financial relationships that could be construed as a potential conflict of interest.
All claims expressed in this article are solely those of the authors and do not necessarily represent those of their affiliated organizations, or those of the publisher, the editors and the reviewers. Any product that may be evaluated in this article, or claim that may be made by its manufacturer, is not guaranteed or endorsed by the publisher.
We thank the First Affiliated Hospital of Wenzhou Medical University for its support. And we also thank all the volunteers for their participations.
The Supplementary Material for this article can be found online at: https://www.frontiersin.org/articles/10.3389/fnins.2021.731596/full#supplementary-material
Abi-Dargham, A., and Horga, G. (2016). The search for imaging biomarkers in psychiatric disorders. Nat. Med. 22, 1248–1255. doi: 10.1038/nm.4190
Albajara Sáenz, A., Villemonteix, T., and Massat, I. (2019). Structural and functional neuroimaging in attention-deficit/hyperactivity disorder. Dev. Med. Child Neurol. 61, 399–405.
Allen, E. A., Damaraju, E., Plis, S. M., Erhardt, E. B., Eichele, T., and Calhoun, V. D. (2014). Tracking whole-brain connectivity dynamics in the resting state. Cereb. Cortex 24, 663–676. doi: 10.1093/cercor/bhs352
An, L., Cao, Q. J., Sui, M. Q., Sun, L., Zou, Q. H., Zang, Y. F., et al. (2013). Local synchronization and amplitude of the fluctuation of spontaneous brain activity in attention-deficit/hyperactivity disorder: a resting-state fMRI study. Neurosci. Bull. 29, 603–613. doi: 10.1007/s12264-013-1353-8
Barceló, F. (1999). Electrophysiological evidence of two different types of error in the Wisconsin Card Sorting Test. Neuroreport 10, 1299–1303. doi: 10.1097/00001756-199904260-00027
Barceló, F., and Knight, R. T. (2002). Both random and perseverative errors underlie WCST deficits in prefrontal patients. Neuropsychologia 40, 349–356. doi: 10.1016/s0028-3932(01)00110-5
Buckner, R. L., Sepulcre, J., Talukdar, T., Krienen, F. M., Liu, H., Hedden, T., et al. (2009). Cortical hubs revealed by intrinsic functional connectivity: mapping, assessment of stability, and relation to Alzheimer’s disease. J. Neurosci. 29, 1860–1873. doi: 10.1523/jneurosci.5062-08.2009
Bush, G. (2011). Cingulate, frontal, and parietal cortical dysfunction in attention-deficit/hyperactivity disorder. Biol. Psychiatry 69, 1160–1167. doi: 10.1016/j.biopsych.2011.01.022
Conners, C. K., Sitarenios, G., Parker, J. D., and Epstein, J. N. (1998). The revised Conners’ Parent Rating Scale (CPRS-R): factor structure, reliability, and criterion validity. J. Abnorm. Child Psychol. 26, 257–268.
Cui, Q., Sheng, W., Chen, Y., Pang, Y., Lu, F., Tang, Q., et al. (2020). Dynamic changes of amplitude of low-frequency fluctuations in patients with generalized anxiety disorder. Hum. Brain Mapp. 41, 1667–1676. doi: 10.1002/hbm.24902
Di Martino, A., Zuo, X. N., Kelly, C., Grzadzinski, R., Mennes, M., Schvarcz, A., et al. (2013). Shared and distinct intrinsic functional network centrality in autism and attention-deficit/hyperactivity disorder. Biol. Psychiatry 74, 623–632. doi: 10.1016/j.biopsych.2013.02.011
Ding, Z., Huang, Y., Bailey, S. K., Gao, Y., Cutting, L. E., Rogers, B. P., et al. (2018). Detection of synchronous brain activity in white matter tracts at rest and under functional loading. Proc. Natl. Acad. Sci. U.S.A. 115, 595–600. doi: 10.1073/pnas.1711567115
Du, Y., Fu, Z., and Calhoun, V. D. (2018). Classification and prediction of brain disorders using functional connectivity: promising but challenging. Front. Neurosci. 12:525. doi: 10.3389/fnins.2018.00525
Fair, D. A., Nigg, J. T., Iyer, S., Bathula, D., Mills, K. L., Dosenbach, N. U., et al. (2012). Distinct neural signatures detected for ADHD subtypes after controlling for micro-movements in resting state functional connectivity MRI data. Front. Syst. Neurosci. 6:80. doi: 10.3389/fnsys.2012.00080
Feldstein, S. N., Keller, F. R., Portman, R. E., Durham, R. L., Klebe, K. J., and Davis, H. P. (1999). A comparison of computerized and standard versions of the Wisconsin Card Sorting Test. Clin. Neuropsychol. 13, 303–313. doi: 10.1076/clin.13.3.303.1744
Forster, B. B., MacKay, A. L., Whittall, K. P., Kiehl, K. A., Smith, A. M., Hare, R. D., et al. (1998). Functional magnetic resonance imaging: the basics of blood-oxygen-level dependent (BOLD) imaging. Can. Assoc. Radiol. J. 49, 320–329.
Fox, M. D., and Raichle, M. E. (2007). Spontaneous fluctuations in brain activity observed with functional magnetic resonance imaging. Nat. Rev. Neurosci. 8, 700–711. doi: 10.1038/nrn2201
Godinez, D. A., Friedman, N. P., Rhee, S. H., Miyake, A., and Hewitt, J. K. (2012). Phenotypic and genetic analyses of the Wisconsin Card Sort. Behav. Genet. 42, 209–220. doi: 10.1007/s10519-011-9502-1
Hahamy, A., Calhoun, V., Pearlson, G., Harel, M., Stern, N., Attar, F., et al. (2014). Save the global: global signal connectivity as a tool for studying clinical populations with functional magnetic resonance imaging. Brain Connect. 4, 395–403. doi: 10.1089/brain.2014.0244
Hutchison, R. M., Womelsdorf, T., Allen, E. A., Bandettini, P. A., Calhoun, V. D., Corbetta, M., et al. (2013). Dynamic functional connectivity: promise, issues, and interpretations. Neuroimage 80, 360–378. doi: 10.1016/j.neuroimage.2013.05.079
Icer, S., Gengec Benli, S., and Ozmen, S. (2019). Differences in brain networks of children with ADHD: whole–brain analysis of resting–state fMRI. Int. J. Imaging Syst. Technol. 29, 645–662. doi: 10.1002/ima.22348
Jiang, K. H., Yi, Y., Li, L., Li, H. X., Shen, H. J., Zhao, F. Q., et al. (2019). Functional network connectivity changes in children with attention-deficit hyperactivity disorder: a resting-state fMRI study. Int. J. Dev. Neurosci. 78, 1–6. doi: 10.1016/j.ijdevneu.2019.07.003
Kim, J. I., Yoo, J. H., Kim, D., Jeong, B., and Kim, B. N. (2018). The effects of GRIN2B and DRD4 gene variants on local functional connectivity in attention-deficit/hyperactivity disorder. Brain Imaging Behav. 12, 247–257. doi: 10.1007/s11682-017-9690-2
Li, F., He, N., Li, Y., Chen, L., Huang, X., Lui, S., et al. (2014). Intrinsic brain abnormalities in attention deficit hyperactivity disorder: a resting-state functional MR imaging study. Radiology 272, 514–523. doi: 10.1148/radiol.14131622
Li, J., Biswal, B. B., Meng, Y., Yang, S., Duan, X., Cui, Q., et al. (2020a). A neuromarker of individual general fluid intelligence from the white-matter functional connectome. Transl. Psychiatry 10:147.
Li, J., Chen, H., Fan, F., Qiu, J., Du, L., Xiao, J., et al. (2020b). White-matter functional topology: a neuromarker for classification and prediction in unmedicated depression. Transl. Psychiatry 10:365.
Li, J., Duan, X., Cui, Q., Chen, H., and Liao, W. (2019). More than just statics: temporal dynamics of intrinsic brain activity predicts the suicidal ideation in depressed patients. Psychol. Med. 49, 852–860. doi: 10.1017/s0033291718001502
Liao, W., Li, J., Ji, G. J., Wu, G. R., Long, Z., Xu, Q., et al. (2019). Endless fluctuations: temporal dynamics of the amplitude of low frequency fluctuations. IEEE Trans. Med. Imaging 38, 2523–2532. doi: 10.1109/tmi.2019.2904555
Peer, M., Nitzan, M., Bick, A. S., Levin, N., and Arzy, S. (2017). Evidence for functional networks within the human brain’s white matter. J. Neurosci. 37, 6394–6407. doi: 10.1523/jneurosci.3872-16.2017
Power, J. D., Plitt, M., Laumann, T. O., and Martin, A. (2017). Sources and implications of whole-brain fMRI signals in humans. Neuroimage 146, 609–625. doi: 10.1016/j.neuroimage.2016.09.038
Preti, M. G., Bolton, T. A. W., and Van De Ville, D. (2017). The dynamic functional connectome: state-of-the-art and perspectives. Neuroimage 160, 41–54. doi: 10.1016/j.neuroimage.2016.12.061
Qian, A., Tao, J., Wang, X., Liu, H., Ji, L., Yang, C., et al. (2018). Effects of the 2-repeat allele of the DRD4 gene on neural networks associated with the prefrontal cortex in children With ADHD. Front. Hum. Neurosci. 12:279. doi: 10.3389/fnhum.2018.00279
Rosch, K. S., and Mostofsky, S. (2019). Development of the frontal lobe. Handb. Clin. Neurol. 163, 351–367.
Shaw, P., Gilliam, M., Liverpool, M., Weddle, C., Malek, M., Sharp, W., et al. (2011). Cortical development in typically developing children with symptoms of hyperactivity and impulsivity: support for a dimensional view of attention deficit hyperactivity disorder. Am. J. Psychiatry 168, 143–151. doi: 10.1176/appi.ajp.2010.10030385
Shaw, P., and Sudre, G. (2021). Adolescent attention-deficit/hyperactivity disorder: understanding teenage symptom trajectories. Biol. Psychiatry 89, 152–161. doi: 10.1016/j.biopsych.2020.06.004
Shulman, G. L., Astafiev, S. V., Franke, D., Pope, D. L., Snyder, A. Z., McAvoy, M. P., et al. (2009). Interaction of stimulus-driven reorienting and expectation in ventral and dorsal frontoparietal and basal ganglia-cortical networks. J. Neurosci. 29, 4392–4407. doi: 10.1523/jneurosci.5609-08.2009
Thomas, R., Sanders, S., Doust, J., Beller, E., and Glasziou, P. (2015). Prevalence of attention-deficit/hyperactivity disorder: a systematic review and meta-analysis. Pediatrics 135, e994–e1001.
Tian, L., Jiang, T., Liang, M., Zang, Y., He, Y., Sui, M., et al. (2008). Enhanced resting-state brain activities in ADHD patients: a fMRI study. Brain Dev. 30, 342–348. doi: 10.1016/j.braindev.2007.10.005
Wang, L. J., Li, S. C., Kuo, H. C., Chou, W. J., Lee, M. J., Chou, M. C., et al. (2020). Gray matter volume and microRNA levels in patients with attention-deficit/hyperactivity disorder. Eur. Arch. Psychiatry Clin. Neurosci. 270, 1037–1045.
Wang, M., Hu, Z., Liu, L., Li, H., Qian, Q., and Niu, H. (2020). Disrupted functional brain connectivity networks in children with attention-deficit/hyperactivity disorder: evidence from resting-state functional near-infrared spectroscopy. Neurophotonics 7:015012.
Wang, X., Jiao, Y., Tang, T., Wang, H., and Lu, Z. (2013). Altered regional homogeneity patterns in adults with attention-deficit hyperactivity disorder. Eur. J. Radiol. 82, 1552–1557. doi: 10.1016/j.ejrad.2013.04.009
Yan, C. G., Wang, X. D., Zuo, X. N., and Zang, Y. F. (2016). DPABI: data processing & analysis for (resting-state) brain imaging. Neuroinformatics 14, 339–351. doi: 10.1007/s12021-016-9299-4
Yan, C. G., Yang, Z., Colcombe, S. J., Zuo, X. N., and Milham, M. P. (2017). Concordance among indices of intrinsic brain function: insights from inter-individual variation and temporal dynamics. Sci. Bull. 62, 1572–1584. doi: 10.1016/j.scib.2017.09.015
Yang, H., Wu, Q., Guo, L., Li, Q., Long, X., Huang, X., et al. (2011). Abnormal spontaneous brain activity in medication-naïve ADHD children: a resting state fMRI study. Neurosci. Lett. 502, 89–93. doi: 10.1016/j.neulet.2011.07.028
Yang, Y., Peng, G., Zeng, H., Fang, D., Zhang, L., Xu, S., et al. (2020). Effects of the SNAP25 on integration ability of brain functions in children with ADHD. J. Atten. Disord. doi: 10.1177/1087054720964561
Zang, Y., Jiang, T., Lu, Y., He, Y., and Tian, L. (2004). Regional homogeneity approach to fMRI data analysis. Neuroimage 22, 394–400. doi: 10.1016/j.neuroimage.2003.12.030
Zang, Y. F., He, Y., Zhu, C. Z., Cao, Q. J., Sui, M. Q., Liang, M., et al. (2007). Altered baseline brain activity in children with ADHD revealed by resting-state functional MRI. Brain Dev. 29, 83–91. doi: 10.1016/j.braindev.2006.07.002
Zhu, J., Zhang, Y., Zhang, B., Yang, Y., Wang, Y., Zhang, C., et al. (2019). Abnormal coupling among spontaneous brain activity metrics and cognitive deficits in major depressive disorder. J. Affect. Disord. 252, 74–83. doi: 10.1016/j.jad.2019.04.030
Zhu, J., Zhu, D. M., Qian, Y., Li, X., and Yu, Y. (2018). Altered spatial and temporal concordance among intrinsic brain activity measures in schizophrenia. J. Psychiatr. Res. 106, 91–98. doi: 10.1016/j.jpsychires.2018.09.015
Zou, Q. H., Zhu, C. Z., Yang, Y., Zuo, X. N., Long, X. Y., Cao, Q. J., et al. (2008). An improved approach to detection of amplitude of low-frequency fluctuation (ALFF) for resting-state fMRI: fractional ALFF. J. Neurosci. Methods 172, 137–141. doi: 10.1016/j.jneumeth.2008.04.012
Zuo, X. N., Ehmke, R., Mennes, M., Imperati, D., Castellanos, F. X., Sporns, O., et al. (2012). Network centrality in the human functional connectome. Cereb. Cortex 22, 1862–1875. doi: 10.1093/cercor/bhr269
Keywords: ADHD, resting-state fMRI, temporal dynamics, concordance, variability
Citation: Lou F, Tao J, Zhou R, Chen S, Qian A, Yang C, Zheng X, Chen B, Hu Z and Wang M (2021) Altered Variability and Concordance of Dynamic Resting-State fMRI Indices in Patients With Attention Deficit Hyperactivity Disorder. Front. Neurosci. 15:731596. doi: 10.3389/fnins.2021.731596
Received: 27 June 2021; Accepted: 26 August 2021;
Published: 16 September 2021.
Edited by:
Xiaopeng Song, Harvard Medical School, United StatesReviewed by:
Shao-Wei Xue, Affiliated Hospital of Hangzhou Normal University, ChinaCopyright © 2021 Lou, Tao, Zhou, Chen, Qian, Yang, Zheng, Chen, Hu and Wang. This is an open-access article distributed under the terms of the Creative Commons Attribution License (CC BY). The use, distribution or reproduction in other forums is permitted, provided the original author(s) and the copyright owner(s) are credited and that the original publication in this journal is cited, in accordance with accepted academic practice. No use, distribution or reproduction is permitted which does not comply with these terms.
*Correspondence: Zhishan Hu, aHV6aGlzaGFuQG1lLmNvbQ==; Meihao Wang, d3p3bWhAd211LmVkdS5jbg==
†These authors have contributed equally to this work
Disclaimer: All claims expressed in this article are solely those of the authors and do not necessarily represent those of their affiliated organizations, or those of the publisher, the editors and the reviewers. Any product that may be evaluated in this article or claim that may be made by its manufacturer is not guaranteed or endorsed by the publisher.
Research integrity at Frontiers
Learn more about the work of our research integrity team to safeguard the quality of each article we publish.