- 1Department of Medical Imaging and Tianjin Key Laboratory of Functional Imaging, Tianjin Medical University General Hospital, Tianjin, China
- 2Department of Mathematics, School of Science, Tianjin University of Science and Technology, Tianjin, China
- 3Tianjin Key Laboratory of Lung Cancer Metastasis and Tumor Microenvironment, Tianjin Lung Cancer Institute, Tianjin Medical University General Hospital, Tianjin, China
- 4Department of Neurology, Tianjin Medical University General Hospital, Tianjin, China
Disruptions in brain connectivity have been widely reported in Alzheimer’s disease (AD). Morphometric similarity (MS) mapping provides a new way of estimating structural connectivity by interregional correlation of T1WI- and DTI-derived parameters within individual brains. Here, we aimed to identify AD-related MS changing patterns and genes related to the changes and further explored the molecular and cellular mechanism underlying MS changes in AD. Both 3D-T1WI and DTI data of 106 AD patients and 106 well-matched healthy elderly individuals from the ADNI database were included in our study. Cortical regions with significantly decreased MS were found in the temporal and parietal cortex, increased MS was found in the frontal cortex and variant changes were found in the occipital cortex in AD patients. Mean MS in regions with significantly changed MS was positively or negatively associated with memory function. Negative MS-related genes were significantly downregulated in AD, specifically enriched in neurons, and participated in biological processes, with the most significant term being synaptic transmission. This study revealed AD-related cortical MS changes associated with memory function. Linking gene expression to cortical MS changes may provide a possible molecular and cellular substrate for MS abnormality and cognitive decline in AD.
Introduction
Alzheimer’s disease (AD) is a neurodegenerative disease marked by progressive neuron loss, manifested by short-term memory and other cognitive impairment symptoms (Wang et al., 2020). AD-related neurodegeneration involves several brain regions, in which the entorhinal, hippocampal and temporal cortices are the most reported (Lerch et al., 2005; Im et al., 2008; Morra et al., 2008; Seong et al., 2010; Li et al., 2014; Femminella et al., 2018). Structural indicators of these regions, including gray matter density (Frisoni et al., 2002), volume (Busatto et al., 2003), cortical thickness (Pettigrew et al., 2017), and curvature (Im et al., 2008; Seong et al., 2010), have been found to be decreased in AD patients. White matter studies based on diffusion tensor imaging (DTI) have also demonstrated reduced integrity in the temporal lobe as well as white matter tracts connecting frontal and temporal regions in AD (Naggara et al., 2006; Kantarci et al., 2017). In recent years, AD has been widely regarded as a disconnected syndrome whereby a large-scale brain network is progressively disrupted by neuropathological processes. MR topological studies constructed whole-brain structural networks and demonstrated abnormal topological properties in multiple brain regions, including the hippocampal, frontal, temporal, parietal and occipital regions, verifying brain network disruption and disconnection between anatomically connected brain regions in AD patients (Lo et al., 2010; Yao et al., 2010).
All the above-mentioned multiregional changes in either gray matter (from 3D T1WI) or white matter (from DTI) may be attributed to dysconnectivity of large-scale brain structural networks in AD. However, a structural covariance network using T1WI could not be applied to single-subject level analysis, and precisely estimating long-distance connections still constrains DTI-based tractography. Here, we adopted a different parameter from the past—“morphometric similarity (MS)”—which is estimated as the inter-regional correlation of multiple macro- and micro-structural multimodal MRI variables, based on both structural T1WI and DTI (Stam et al., 2007). It reflects the anatomical connections of different brain areas from histological similarity and axonal connectivity within an individual human brain (Seidlitz et al., 2018). Given that AD has been considered a disconnection syndrome due to regional vulnerability to cellular neurodegeneration and disconnection of distant cortical regions (Gonzalez-Escamilla et al., 2020), it is suitable to evaluate brain anatomical connectivity in AD patients using MS as a neuroimaging indicator.
AD is a highly heritable disease (Bellenguez et al., 2020). Investigating the link between related gene expression and internal brain structure helps to understand the pathophysiological processes of the disease. The Allen Human Brain Atlas (AHBA) can present gene transcription information in the same standard space as neuroimaging data, providing a new approach for linking gene expression to neuroimaging phenotypes. With this approach, only a few reports combine gene transcription data with gray matter volumes in AD. However, it is unclear which genes related to AD-specific MS changes are specific to which neurological functions and how the expression of these genes affects MS changes. In the current study, we investigated the MS changing pattern map in AD and spatially associated the MS changing pattern map with anatomically patterned gene expression using data from the AHBA. We aimed to identify AD-related MS changing patterns and genes closely related to the changes and further explore the cellular and molecular mechanism underlying MS changes in AD.
Materials and Methods
Participates
A total of 113 AD patients with their initial 3T MRI scans, including both 3D T1WI and DTI data, were obtained from ADNI database1 which followed the standard ADNI-GO and ADNI-2 protocols (Jack et al., 2010; Weiner et al., 2017). The main inclusion criteria were as follows: (1). subjective memory concern as reported by subject, study partner or clinician; (2). abnormal memory function documented by scoring within the education adjusted ranges on the Logical Memory II subscale from the Wechsler Memory Scale-Revised; (3). Mini-Mental State Exam (MMSE) score between 20 and 26; (4). Clinical Dementia Rating 0.5 or 1.0; and 5. NINCDS/ADRDA criteria for probable AD. All images were visually inspected by two radiologists, and seven patients with poor image quality (2 patients’ 3D T1WI and five patients’ DTI) were excluded. Finally, 106 AD patients with qualified image data were included (63 males and 43 females; mean age 75, ranging from 55 to 90 years). For comparison, an equal number of age- and gender-matched healthy elders with qualified 3D-T1WI and DTI were selected from the ADNI database (63 males and 43 females; mean age 75, ranging from 55 to 90 years). The detailed scan parameters are provided in Supplementary Table 1. General cognitive function was assessed by the MMSE and the Clinical Dementia Rating. Memory function was evaluated by a memory composite score obtained for the majority of participants (94 subjects with AD and 99 subjects with healthy elderly individuals) (Crane et al., 2012).
Morphometric Similarity Estimation
Surface-based morphology parameter estimation from high-resolution T1WI was performed using FreeSurfer v6.0.0.2 The DTI data were preprocessed according to the pipeline of FMRIB’s Diffusion Toolbox implemented in FSL 5.0.10.3 The detailed preprocessing procedures for T1WI and DTI data are provided in Supplementary Material.
The DTI parameters of fractional anisotropy and mean diffusion were defined as myelination metrics. Among the surface-based morphology parameters, the gray matter, surface area and cortical thickness were defined as gray matter metrics, and the intrinsic/Gaussian curvature and mean curvature were the curvature metrics.
To adjust the variation from multiple sites and scanners, the ComBat harmonization of surface-based morphology and diffusion parameters across scanners and sites was performed before the downstream morphometric similarity estimation (Fortin et al., 2017, 2018). Then, these metrics were Z-score transformed to improve normality.
The Pearson correlation of gray matter, curvature and myelination metrics between each pair of cortical regions was performed to generate 308 × 308 MS matrices for each subject. Then, the 308 × 308 MS matrices were averaged across the 308 cortical regions to calculate the regional MS for every 308 cortical regions. From the brain connectome perspective, the regional MS represents the weighted degree of each cortical node, which was connected by signed and weighted edges of pairwise similarity to all other cortical nodes in the whole brain.
Transcription-Imaging Association
A compiled transcription matrix of six postmortem adult brains from the AHBA4 was acquired from the data directory for Neuroscience in Psychiatry Network manuscript,5 which provided expression values for each of 20,737 genes estimated in 151 cortical regions of the left hemisphere. PLS regression was used to identify genes whose transcriptional profiles were significantly associated with regional MS differences. In this study, the independent variable was the compiled AHBA transcription matrix (151 regions × 20,737 genes), and the dependent variables were the vector of regional MS case-control T-values from the left hemisphere (151 regions). The first PLS component (PLS1) weight of each gene was assigned in terms of its contribution to the overall model. Then, the ratio of each gene’s PLS1 weight to its bootstrapped standard error (1,000 resamplings with replacement of the 151 cortical regions) was calculated as a Z score. Here, genes with | Z score | > 4.72 (Bonferroni correction of P < 0.05) denoted the PLS1 gene set. Details about the transcription-imaging association are provided in Supplementary Material.
Disease Enrichment Analyses
Disease enrichment analyses were used to explore whether the PLS1 gene set was enriched in AD-related differentially expressed genes (DEGs). The expression dataset with series accession number GSE5281 from the Gene Expression Omnibus database6 was acquired to screen the AD-related DEGs. The LIMMA package (version 3.42.2) of R software was used to analyze the DEGs between AD and normal elderly individuals. P < 0.01 and | log2 (fold change) | > 1 were defined as the thresholds for screening AD-related DESs. Fisher’s exact test was used to evaluate the significance of the overlap between PLS1 gene sets and AD-related DEGs. The Bonferroni method was used to correct for multiple comparisons (both up- and downregulated DEGs) (Pc < 0.05, an uncorrected P < 0.05/2 = 0.025). Details about the disease enrichment analyses are provided in Supplementary Material.
Cell-Type-Specific Analysis
The RNAseq dataset with series accession number GSE73721 from the Gene Expression Omnibus database was acquired to perform cell-type-specific analysis. pSI v1.17 was used to determine the specific neocortical cell type for which the PLS1-genes were enriched. A pSI threshold of 0.05 was used to generate the cell-type-enriched gene lists for each type of cortical cell. Fisher’s exact test was used to evaluate the significance of the overlap between PLS1 gene sets and cell-type-specific genes for each type of cortical cell. The Bonferroni method was used to correct for multiple comparisons (5 cell types) (Pc < 0.05, an uncorrected P < 0.05/4 = 0.01). Details about the cell type-specific analysis are provided in Supplementary Material.
Gene Ontology Analysis
The clusterProfiler package (v3.14.3) of R software was used to perform the gene ontology (GO) analysis. Our study only focused on the biological process of GO terms in which the PLS1 gene sets were enriched. A Bonferroni adjusted P-value < 0.05 was considered significant.
Statistical Analysis
The statistical analyses for demographic and cognitive data were performed using the Statistical Package for the Social Sciences (SPSS version 18.0). Comparisons between AD patients and healthy elderly individuals were performed using a two-sample T-test for continuous variables with a normal distribution and a chi-squared test for categorical variables. To test whether the MS of brain regions with significant case-control differences were associated with memory function, partial correlation analysis was conducted with age, gender, and years of education as nuisance covariates. The Pearson correlation analysis was used to test the association between the Z scored expression values of PLS1 gene sets and the T statistics of case-control differences in MS. The resulting P-values above were Bonferroni corrected for multiple comparisons. The case-control difference in regional MS was estimated by fitting linear models with age, gender and education as covariates, and the resulting P-values for each region were false discovery rate (FDR) corrected for multiple comparisons.
Results
Demographics and Cognition
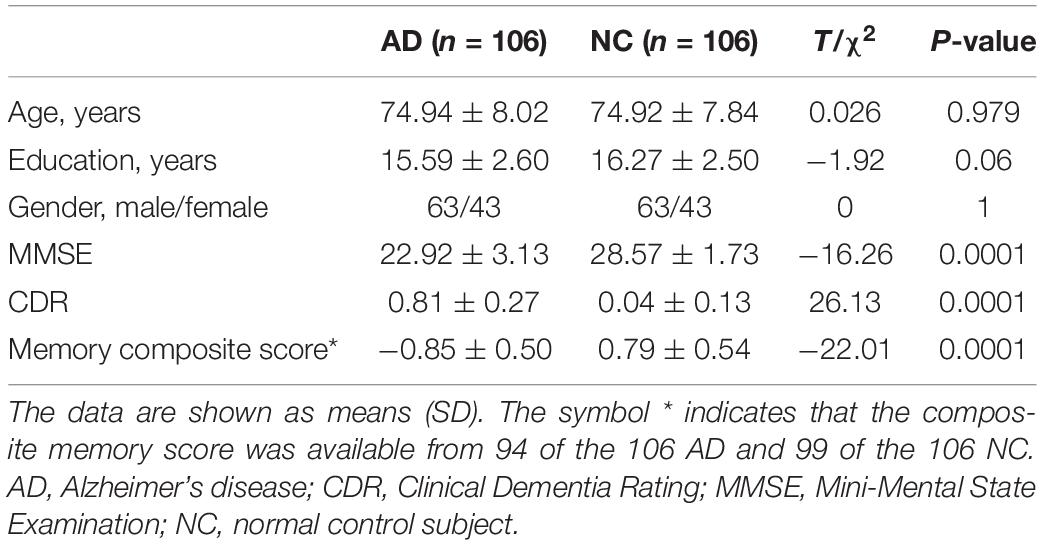
A total of 106 AD patients and the same number of age- and gender-matched healthy elderly individuals with qualified image data were ultimately included in the present study. The demographic and cognitive data of these subjects are shown in Table 1. Significant differences were found in terms of MMSE (P = 0.0001), Clinical Dementia Rating (P = 0.0001), and memory composite scores (P = 0.0001). No significant differences were observed in terms of age (P = 0.98), gender (P = 1), or years of education (P = 0.06).
Morphometric Similarity Differences Between Alzheimer’s Disease and Healthy Elders
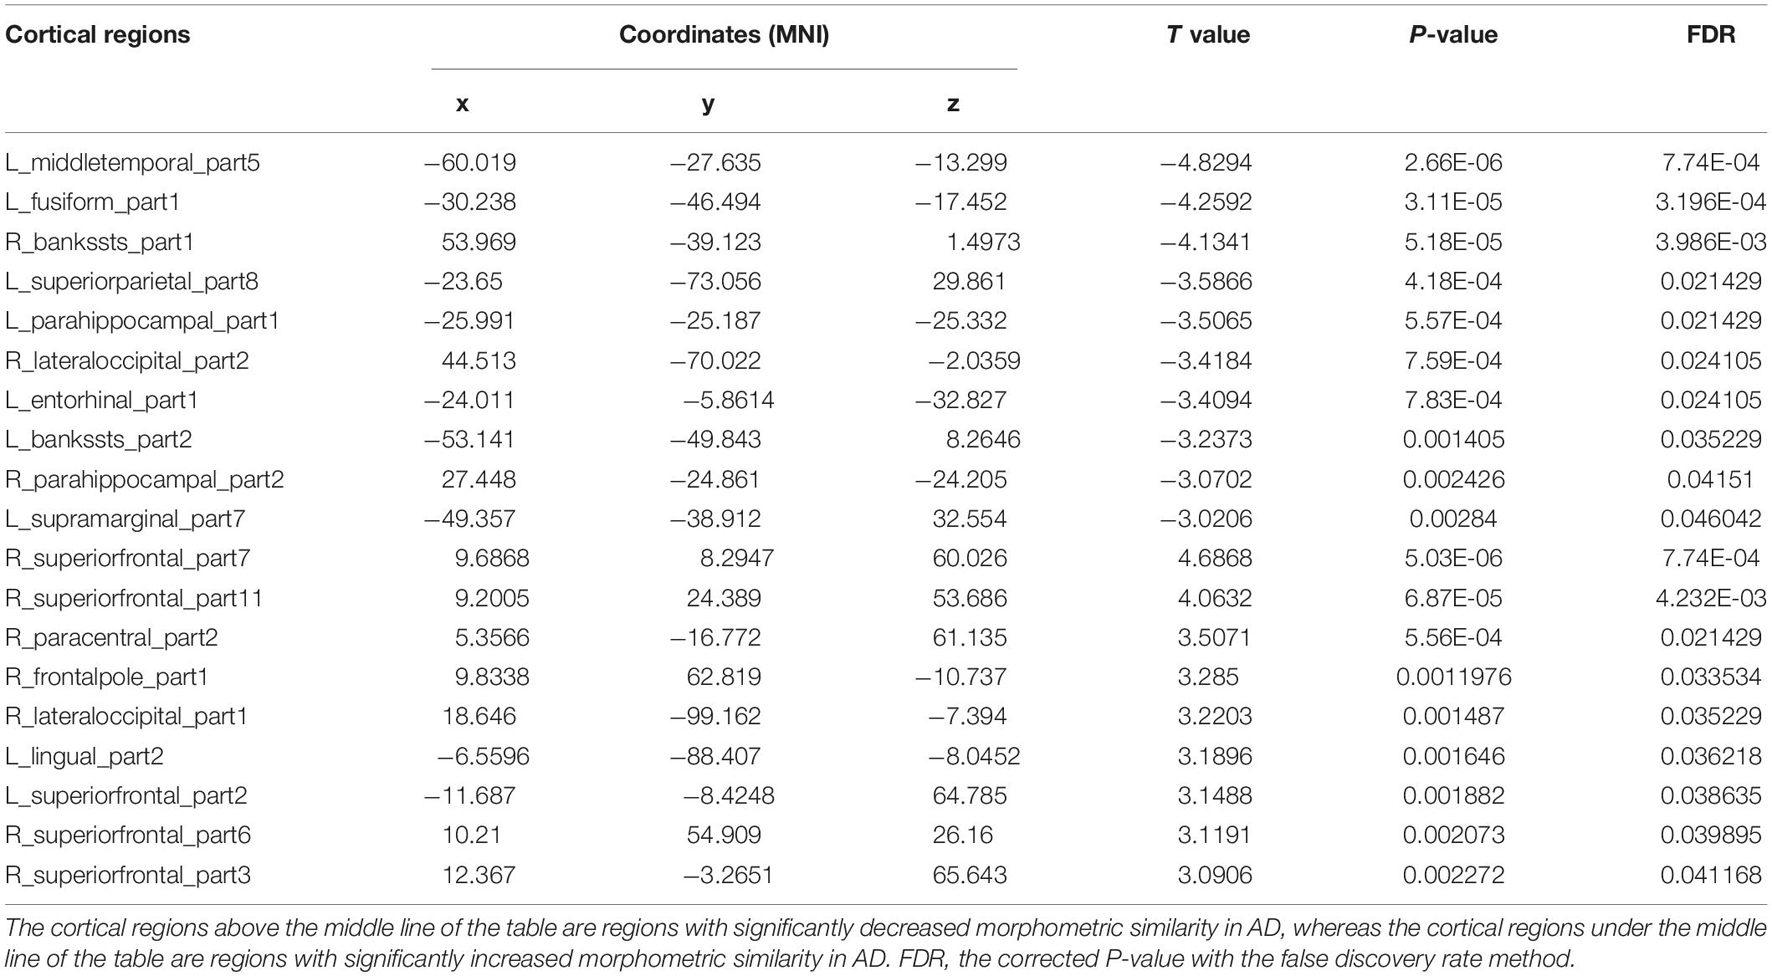
The cortical map in Figure 1 demonstrated the significant differences in regional MS at each cortical area between AD and healthy elderly individuals. Cortical regions with significantly decreased MS were observed in the left middle temporal lobe, left fusiform gyrus, bilateral banks of superior temporal sulci, bilateral parahippocampal lobes, left entorhinal cortex, left superior parietal lobe, left supramarginal gyrus and right lateral occipital lobe (Table 2). Cortical regions with significantly increased MS were found in the bilateral superior frontal lobes, right paracentral lobe, right frontal pole cortex, left lingual gyrus and right lateral occipital lobe (Table 2). The partial correlation analysis showed that the mean MS average across the 10 regions with decreased MS was significantly positively associated with the memory composite score (r = 0.43, P = 0.0001), and the mean MS average across the nine regions with increased MS was significantly negatively associated with the memory composite score (r = −0.35, P = 0.0001) (Figure 2).
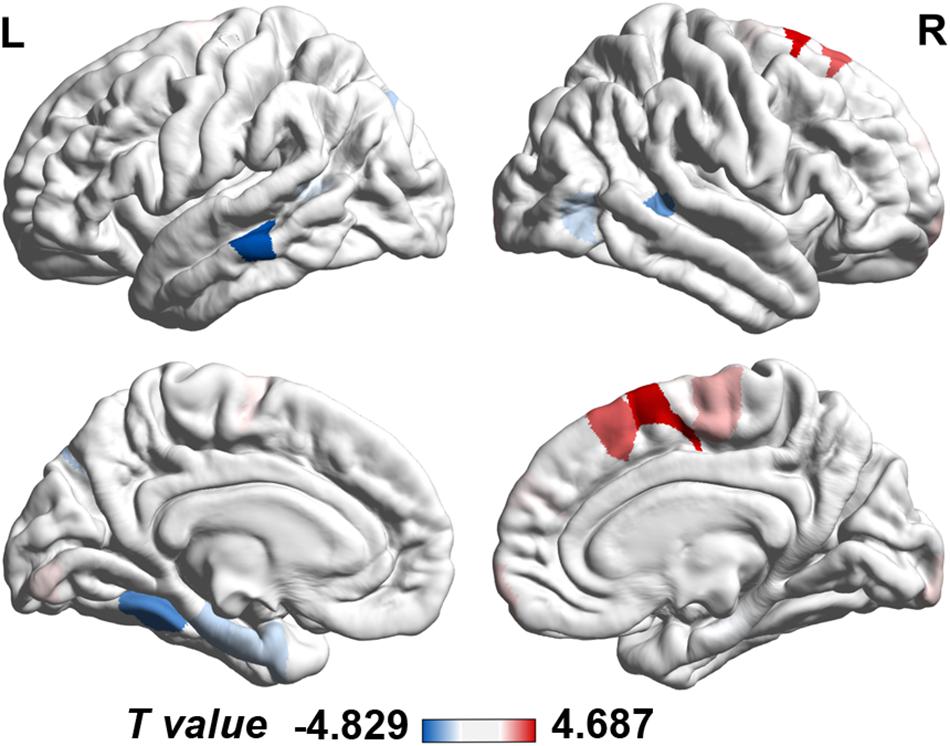
Figure 1. Case-control differences in regional morphometric similarity (P < 0.05, FDR corrected). Regions in blue indicate significantly decreased morphometric similarity in AD, whereas regions in red indicate significantly increased morphometric similarity in AD. FDR, false discovery rate; L, left; R, right.
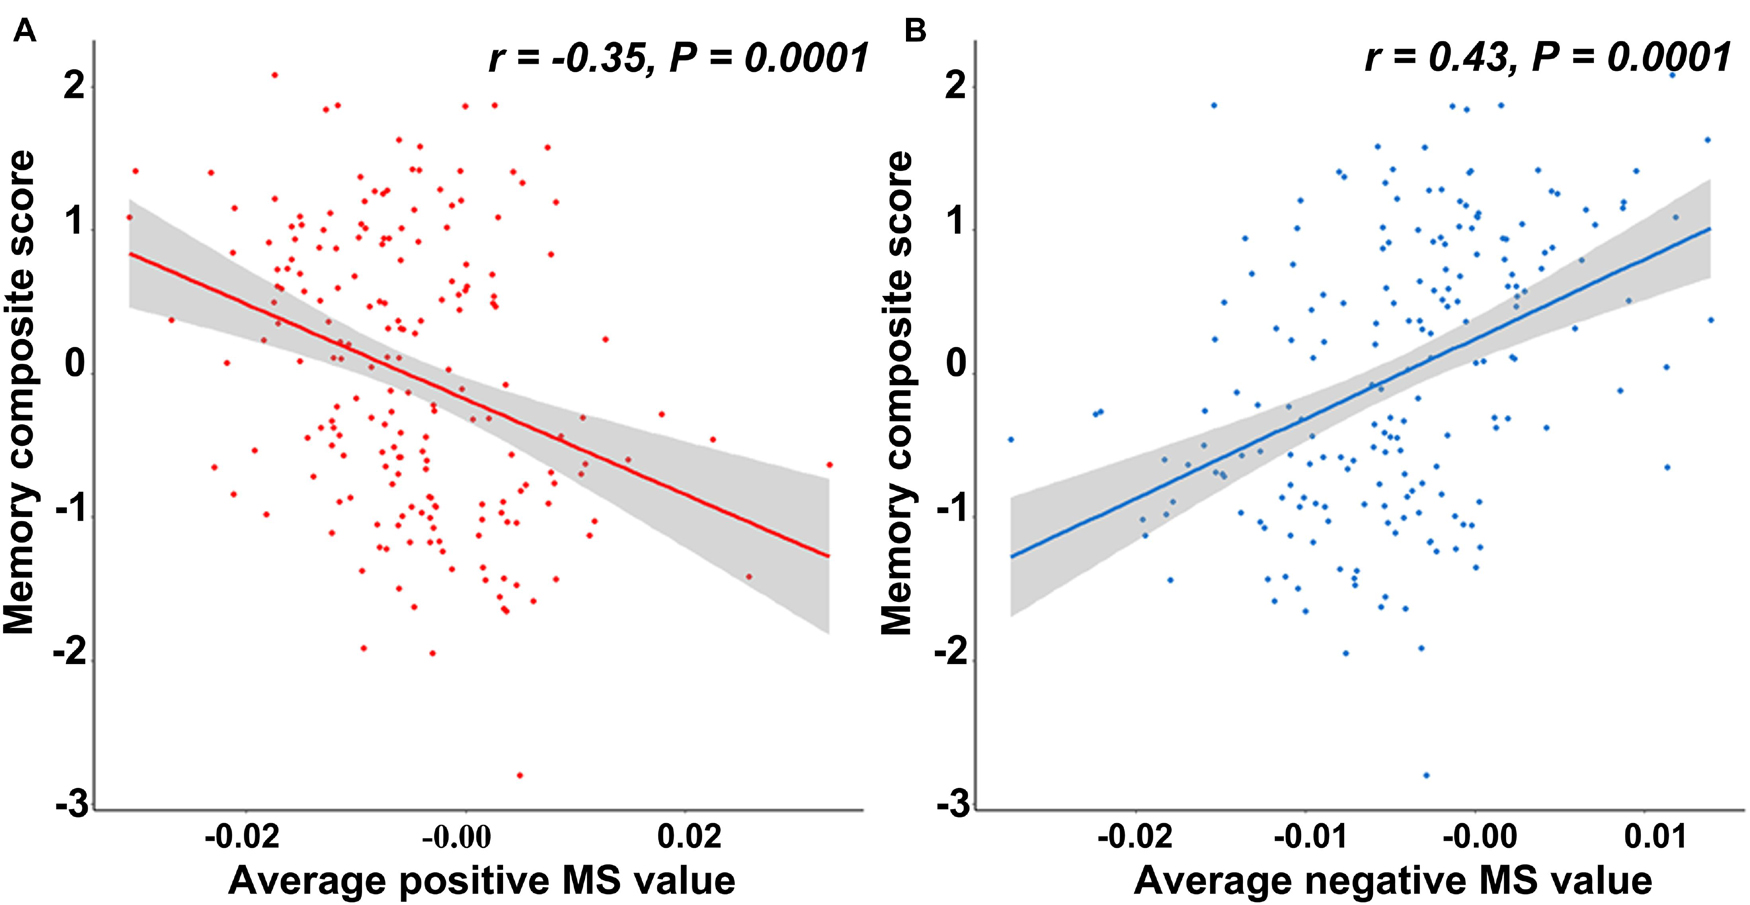
Figure 2. The relationship between the memory composite score and regional morphometric similarity. (A) The average morphometric similarity in regions with significantly increased morphometric similarity in AD is significantly negatively correlated with the memory composite score. (B) The average morphometric similarity in regions with significantly decreased morphometric similarity in AD is significantly positively correlated with the memory composite score.
Gene-Morphometric Similarity Spatial Correlations and Characters
First PLS Component Gene Expression Associated With Morphometric Similarity Difference
The PLS regression analysis revealed 1,932 genes with normalized PLS1 weights Z score < −4.72 (Bonferroni correction of P < 0.05), which were defined as the PLS1-genes, and 2,139 genes with normalized PLS1 weights Z score > 4.72 (Bonferroni correction of P < 0.05), which were defined as the PLS1 + genes (Supplementary Table 2). The majority of cortical regions on the PLS1 + gene expression map were in accordance with those on the case-control T map of regional MS (Figures 3A,B), whereas the majority of cortical regions on the PLS1-gene expression map were in contrast with those on the case-control T map of regional MS (Figures 3A–C). Pearson correlation analysis revealed that the expression of PLS1 + genes was significantly positively correlated with regional MS differences (r = 0.45, P = 0.0001) (Figure 3D), whereas the expression of PLS1-genes was significantly negatively correlated with regional MS differences (r = −0.44, P = 0.0001) (Figure 3E).
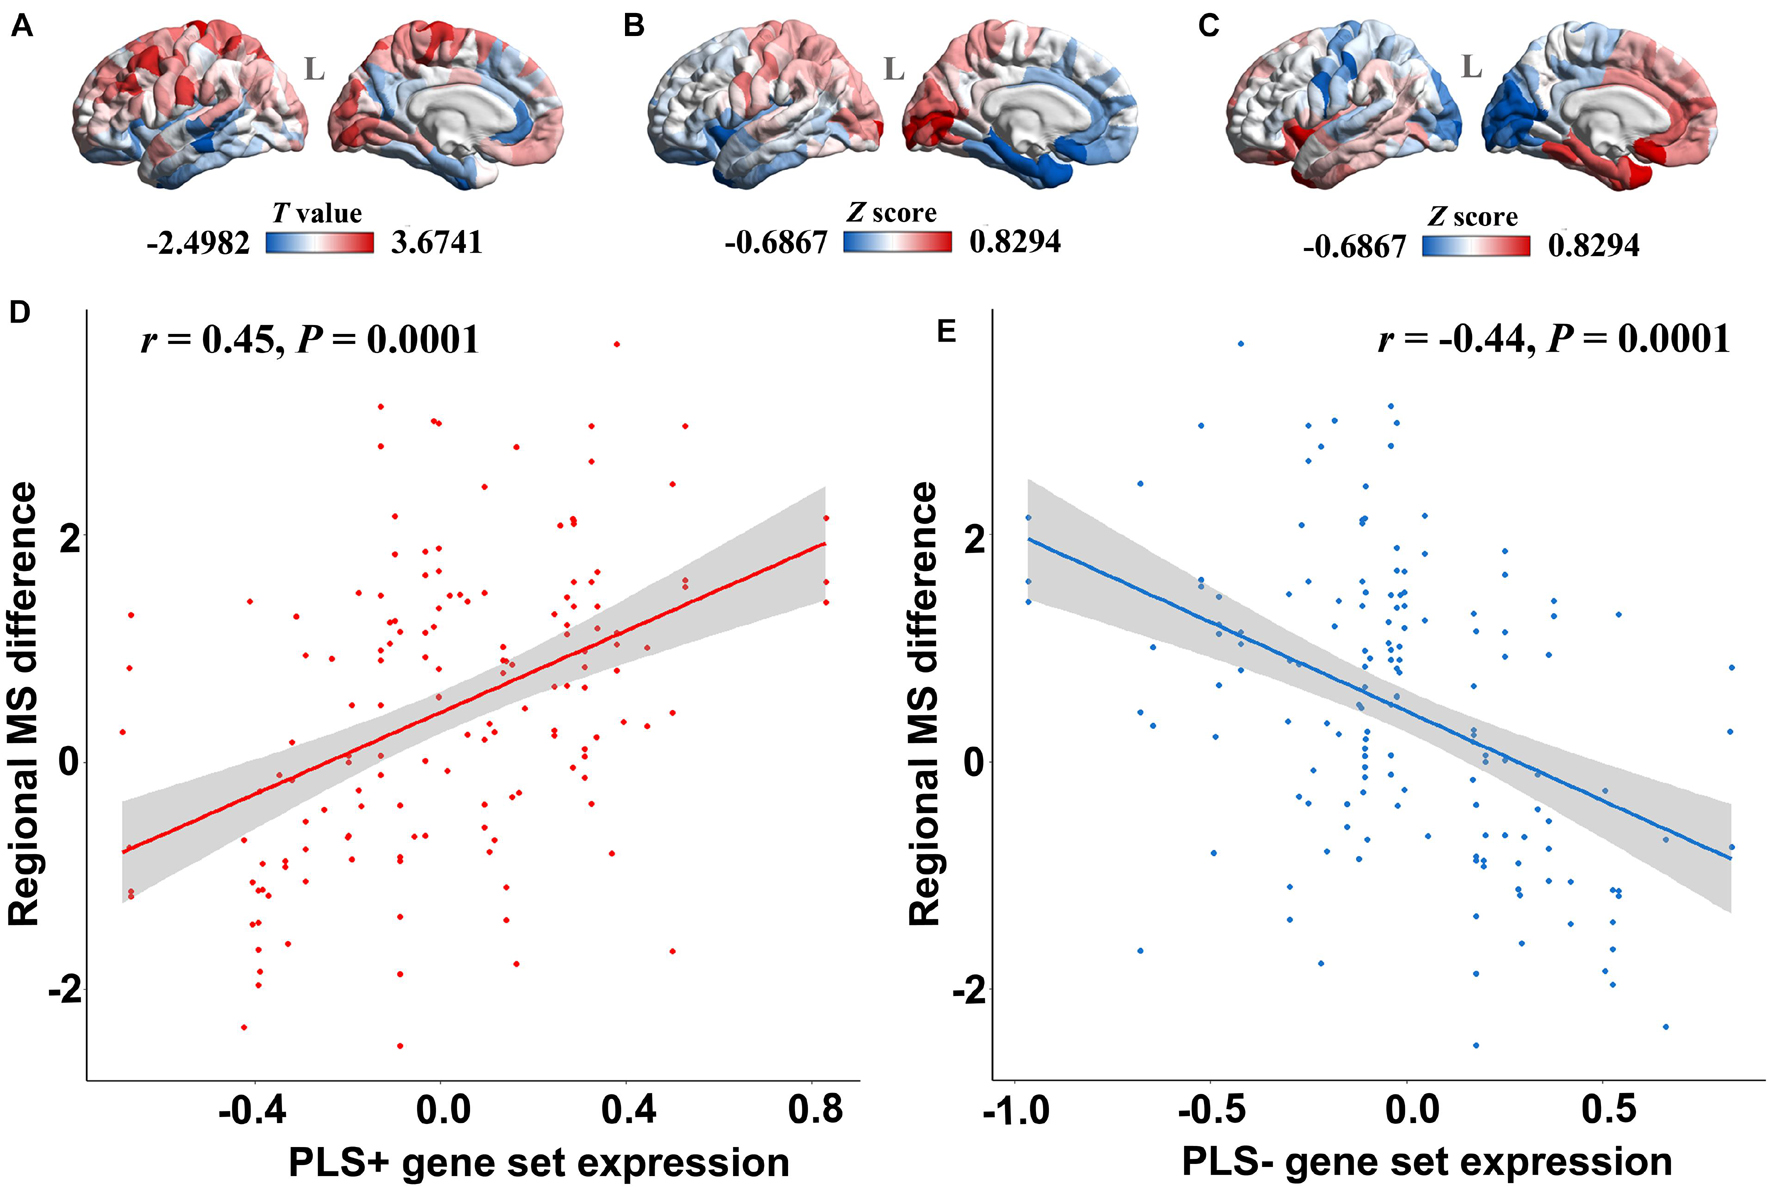
Figure 3. The relationship between PLS1 gene set expression and regional morphometric similarity differences. (A) The regional morphometric similarity case-control T map in the left hemisphere. The regions in red indicate increased morphometric similarity in AD, whereas the blue color indicates decreased morphometric similarity in AD. (B) The PLS1 + gene set expression map illustrates that regions in red have increased expression of the PLS1 + gene set, whereas regions in blue have decreased expression of the PLS1 + gene set. (C) The PLS1-gene set expression map illustrates that regions in red have increased expression of the PLS1-gene set, whereas regions in blue have decreased expression of the PLS1-gene set. (D) The point plot in red shows that the expression of the PLS1 + gene set is significantly positively correlated with the regional morphometric similarity difference between AD patients and healthy elderly individuals. (E) The blue point plot shows that the expression of the PLS1-gene set is significantly negatively correlated with regional morphometric similarity differences between AD patients and healthy elderly individuals.
Alzheimer’s Disease-Related Differentially Expressed Genes Enrichment for First PLS Component-Genes
A total of 1,800 significant DEGs between AD and normal elderly individuals were identified from the GSE5281 series, with 708 upregulated and 1,092 downregulated genes (Figure 4A and Supplementary Table 3). Both upregulated and downregulated genes were defined as AD-related DEGs. The enrichment analysis revealed that PLS1-genes were significantly enriched in downregulated DEGs (Pc = 5.43 × 10⁻¹²) but not in upregulated DEGs (Pc = 1) (Figures 4B–D). In addition, PLS1 + genes were not significantly enriched in upregulated DEGs (Pc = 1) or in downregulated DEGs (Pc = 1) (Figures 4C–E).
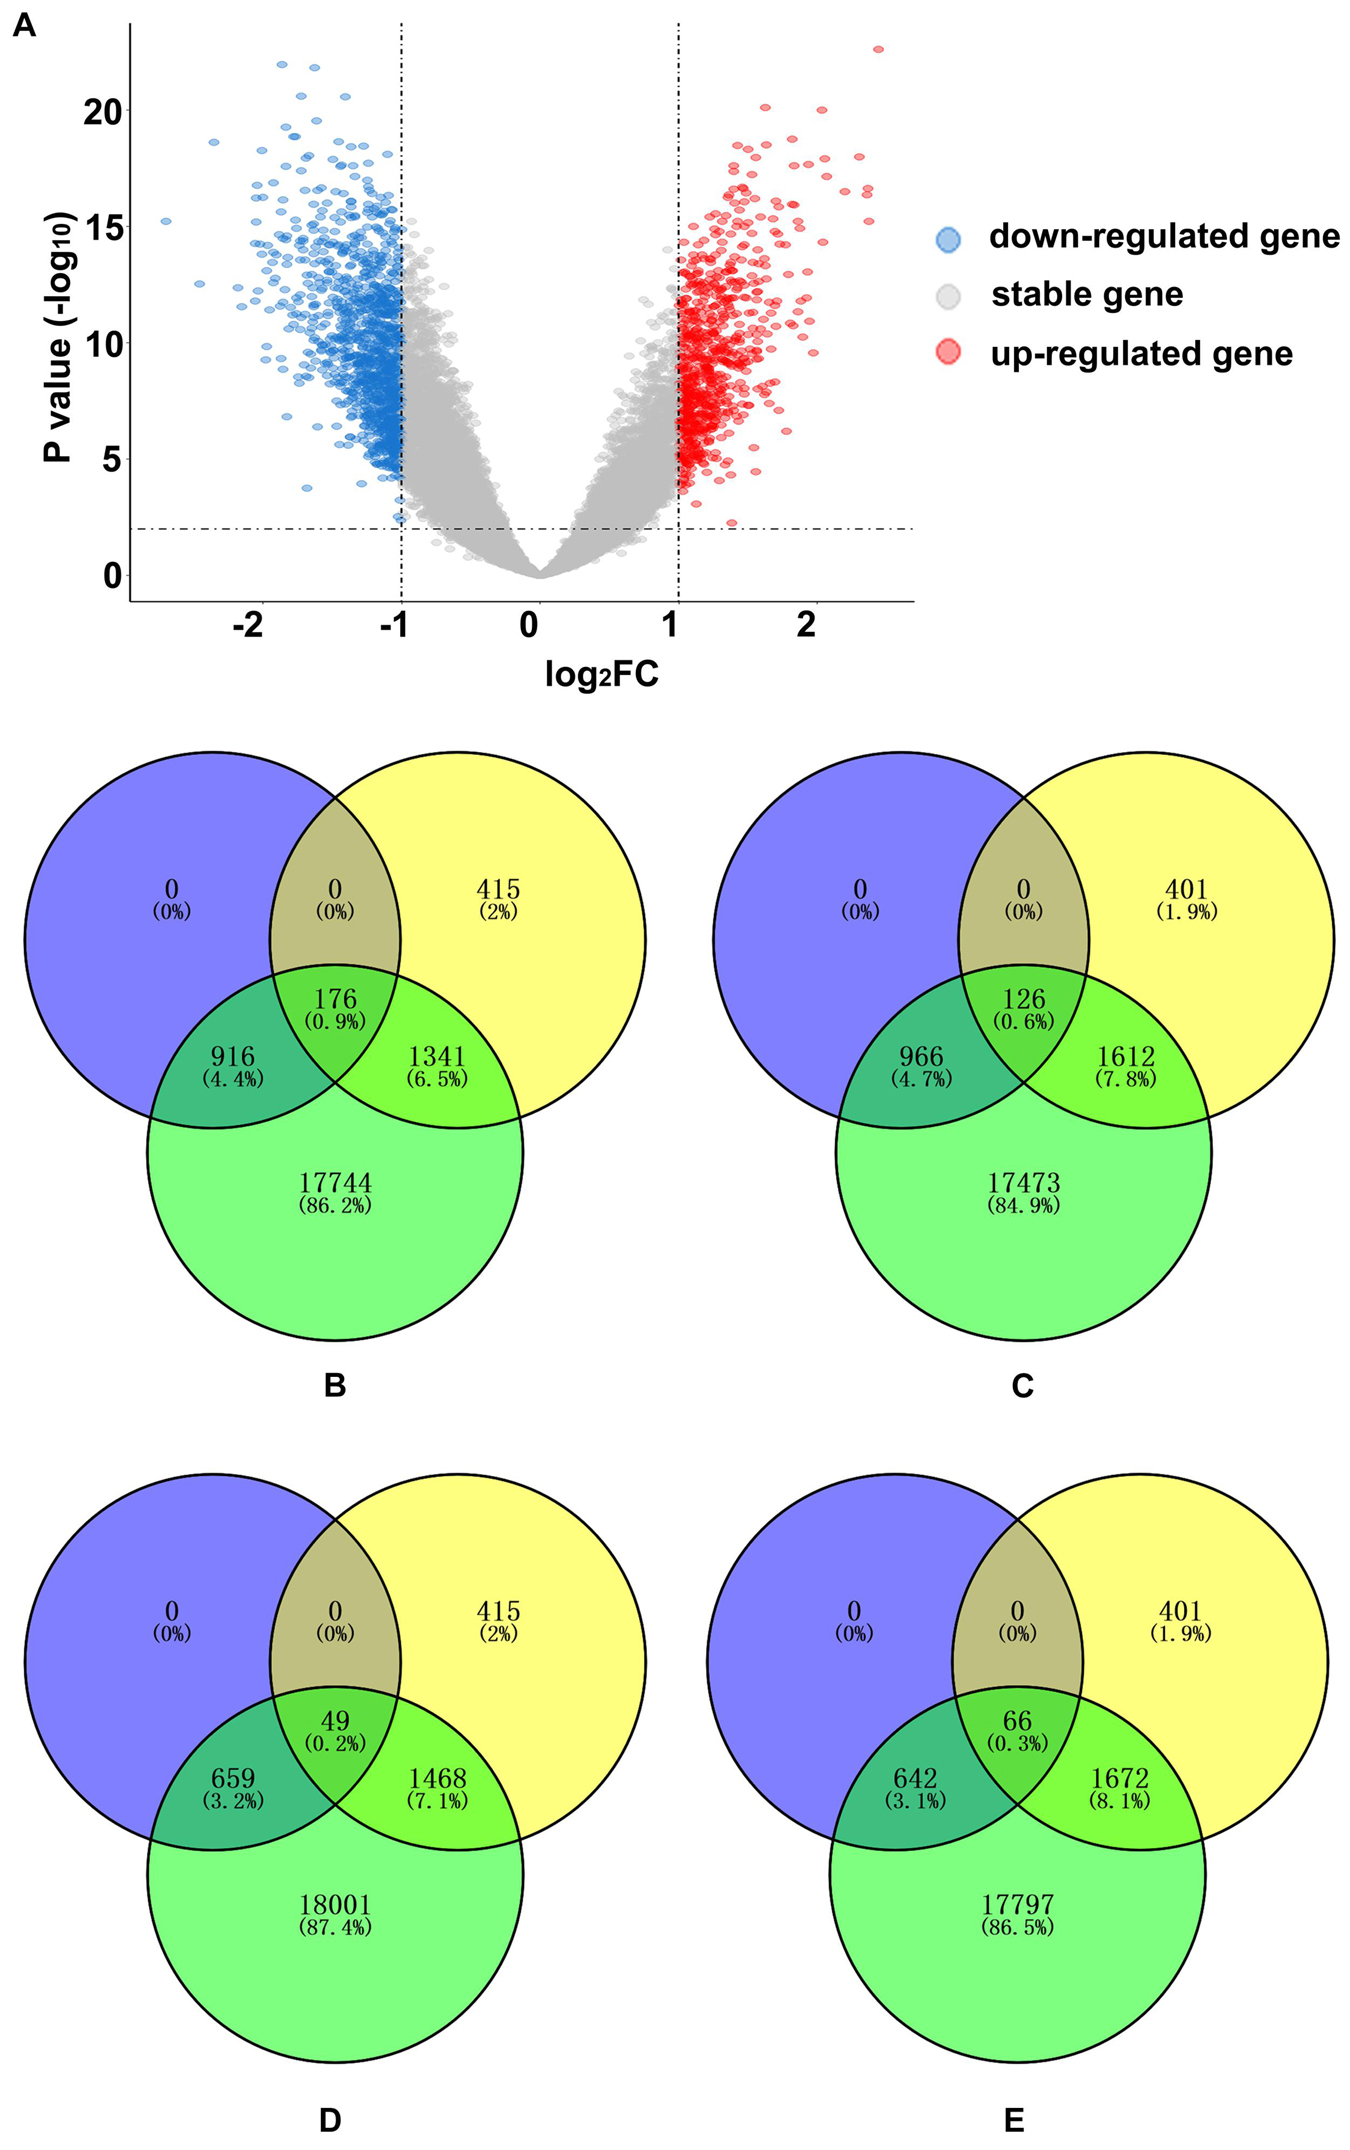
Figure 4. AD-related DEG enrichment analyses for PLS1 gene sets. (A) The volcano plot shows 708 upregulated genes in red on the right and 1,092 downregulated genes in blue on the left. (B) The PLS1-genes significantly overlapped with downregulated genes. The number of overlapping genes was 176, accounting for 0.9% of the total genes. The purple circle indicates 1,092 downregulated genes, the yellow circle indicates 1,932 PLS1-genes and the green circle indicates 20,177 background genes. (C) The PLS1 + genes did not significantly overlap with downregulated genes. The number of overlapping genes was 126, accounting for 0.6% of the total genes. The purple circle indicates 1,092 downregulated genes, the yellow circle indicates 2,139 PLS1 + genes and the green circle indicates 20,177 background genes. (D) The PLS1-genes did not significantly overlap with the upregulated genes. The number of overlapping genes was 49, accounting for 0.2% of the total genes. The purple circle indicates 708 up-regulated genes, the yellow circle indicates 1,932 PLS1-genes, and the green circle indicates 20,177 background genes. (E) The PLS1 + genes did not significantly overlap with upregulated genes. The number of overlapping genes was 66, accounting for 0.3% of the total genes. The purple circle indicates 708 upregulated genes, the yellow circle indicates 2,139 PLS1 + genes and the green circle indicates 20,177 background genes. DEGs, differentially expressed genes; FC, fold change; PLS, partial least squares regression.
Cell-Type Specificity of First PLS Component-Genes
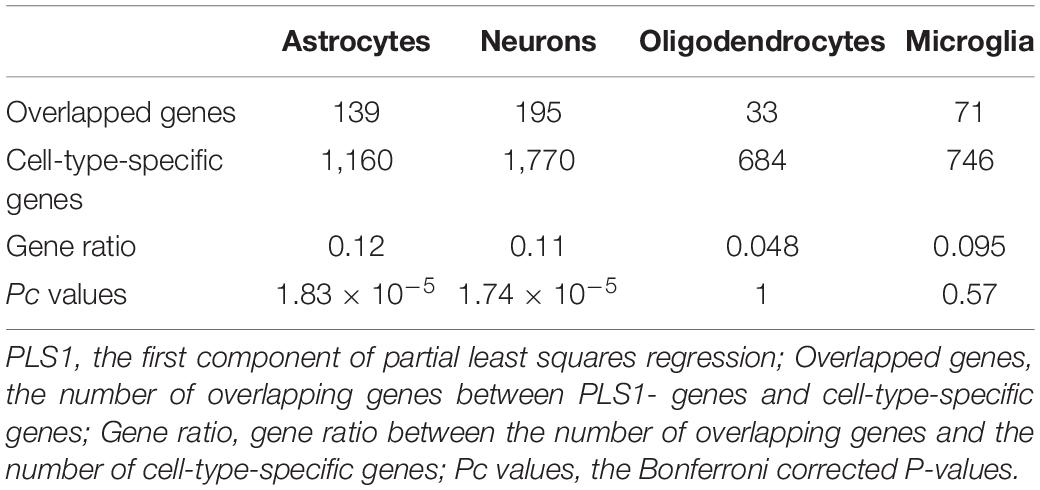
The cell-type-enriched gene lists for each type of cortical cell are provided in Supplementary Table 4. The PLS1-genes showed significant specific expression in neurons (Pc = 1.83 × 10⁻⁵) and astrocytes (Pc = 1.74 × 10⁻⁵) but not in oligodendrocytes (Pc = 1) or microglia (Pc = 0.57) (Table 3 and Figure 5A). The PLS1 + genes were not significantly enriched in any type of neocortical cell (Pc = 1 for all) (Table 4 and Figure 5B).
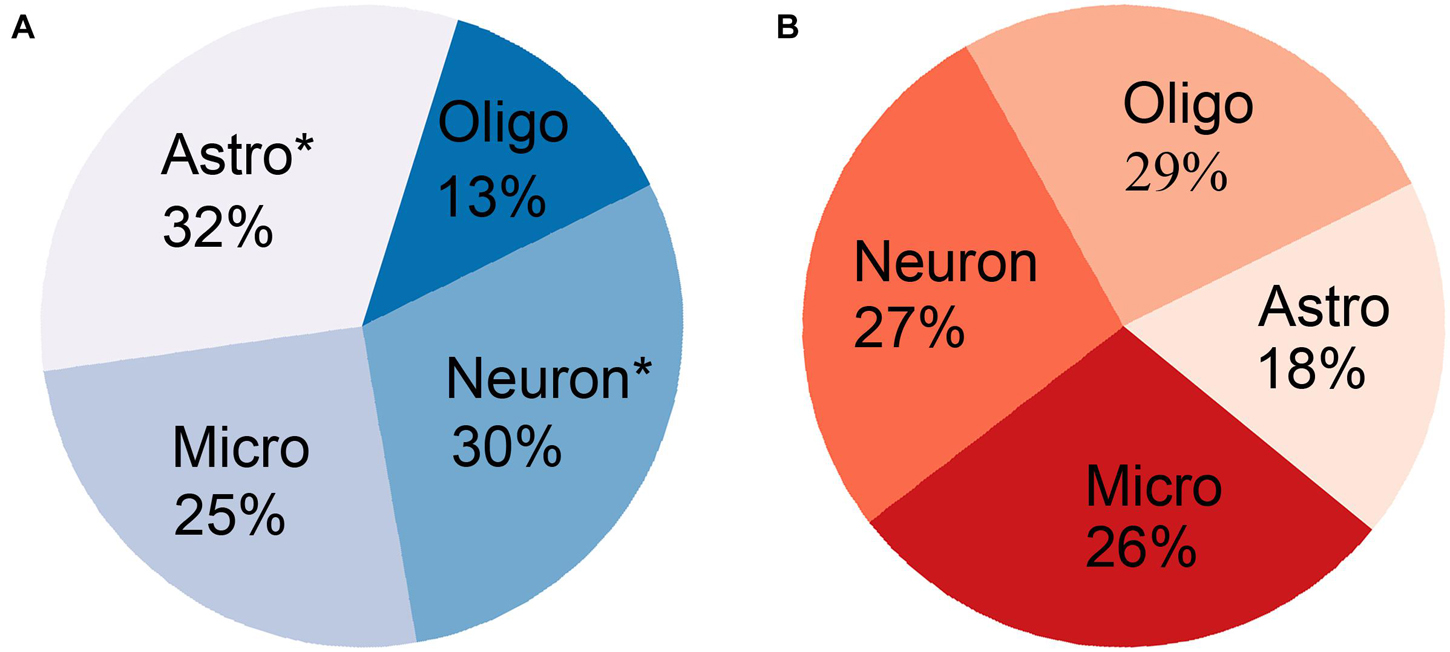
Figure 5. The percentage of gene ratio between overlapping genes and cell-type-specific genes for each type of neocortical cell. (A) The PLS1-genes significantly overlapped with cell-type-specific genes in neurons and astrocytes (asterisk) but not in oligodendrocytes and microglia. (B) The PLS1 + genes did not significantly overlap with cell-type-specific genes in any type of neocortical cell.
Gene Ontology Enrichment for First PLS Component-Gene Sets
The GO analysis revealed that significant biological processes of the PLS1-genes were mainly enriched in neuron-specific terms, including synaptic signaling, neurotransmitter release, axonogenesis, and cognition (Figure 6A and Supplementary Table 5). However, the PLS1 + genes were involved in non-neuron-specific biological processes, including potassium ion transport and protein localization (Figure 6B and Supplementary Table 5).
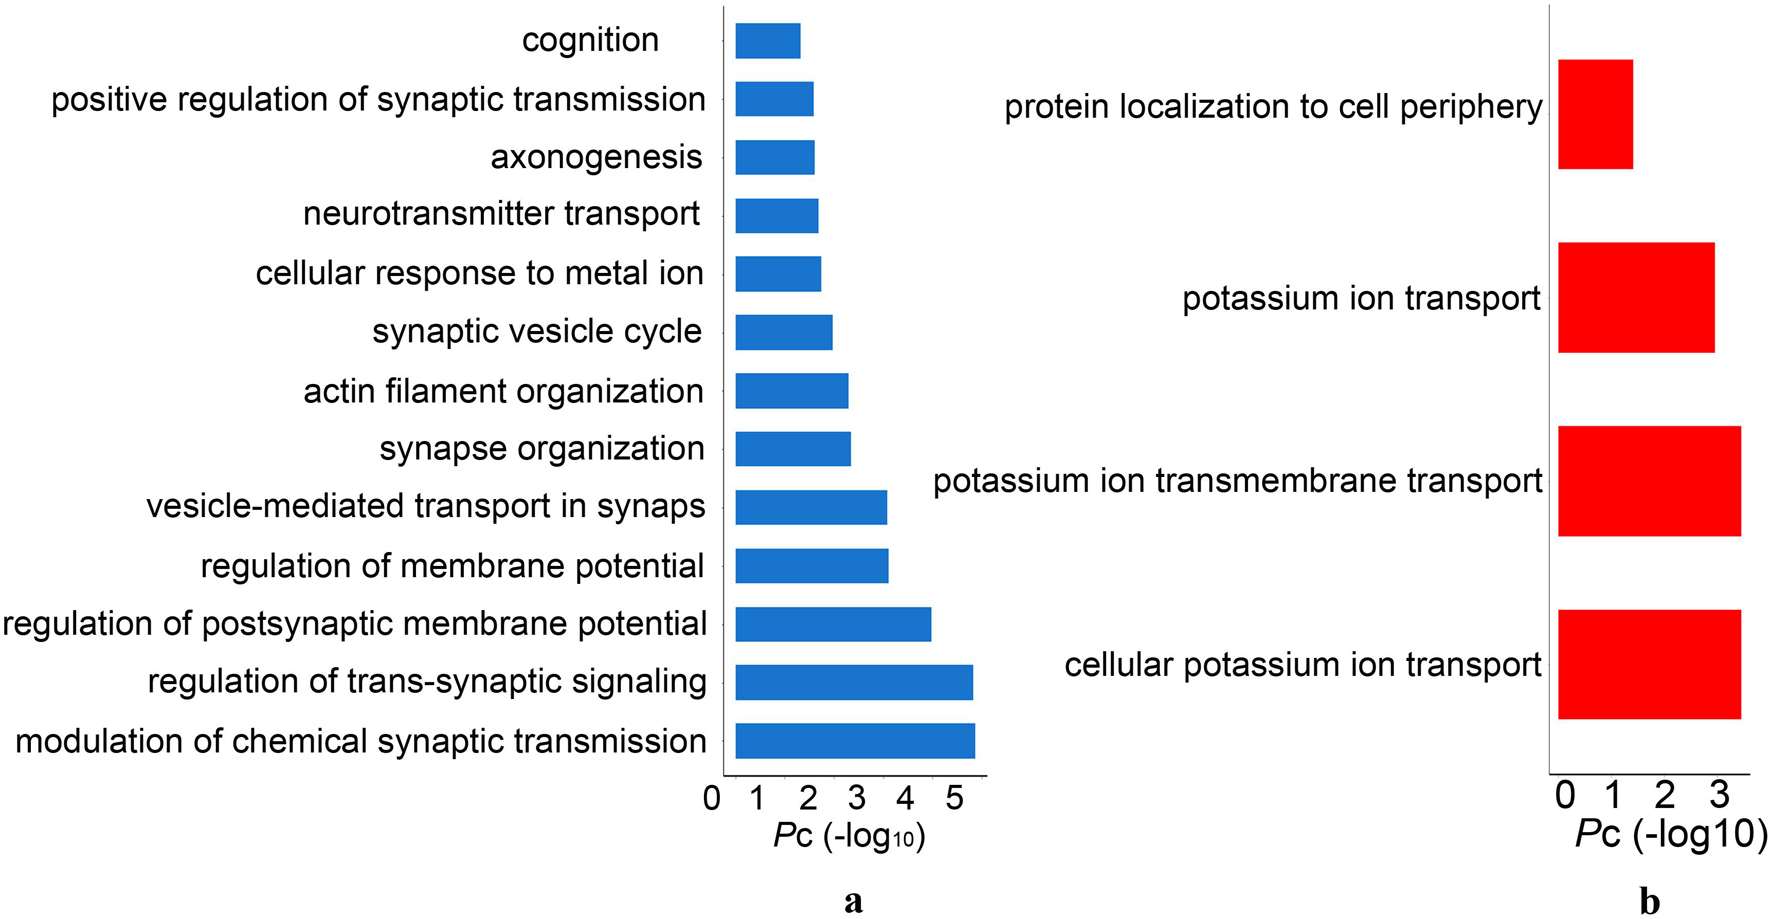
Figure 6. The significant gene ontology terms of biological process for PLS1 gene sets. (A) The PLS1-genes were significantly enriched in synaptic signaling, neurotransmitter release, axonogenesis and cognition. (B) The PLS1 + genes were significantly enriched in potassium ion transport and protein localization. Pc, the Bonferroni corrected P-values.
Discussion
Morphometric Similarity Changing Patterns and Associated Memory Function in Alzheimer’s Disease
The MS quantifies the similarity in terms of multiple MRI parameters measured in each area. Compared with traditional measurements based on a single MRI sequence, MS considering multiple MRI morphometric indices (based on both structural T1WI and DTI) could reflect the anatomical connections of different brain areas based on histological similarity and axonal connectivity within an individual human brain.
This study showed that AD patients had decreased regional MS in multiple AD-susceptible regions in the temporal and parietal cortex. Additionally, increased regional MS in several frontal areas and variable changing MS in parts of the occipital cortex were also detected in AD patients compared with healthy elderly individuals. The mean MS average across those regions with decreased regional MS was positively associated with memory function. In contrast, the mean MS average across those regions with increased regional MS was negatively associated with memory function.
Our findings were consistent with a large number of studies reporting decreased gray matter volume and cortical thickness (Lerch et al., 2005; Femminella et al., 2018), lower average mean curvature (Im et al., 2008; Morra et al., 2008) and shallower sulcal depth (Im et al., 2008) in the hippocampus, temporal lobe, fusiform gyrus, and entorhinal cortex in AD, with the left hemisphere being dominant. DTI studies revealed disruptions of white matter integrity in the early stage of AD in limbic fiber tracks with direct connections to medial temporal lobe structures (Kalus et al., 2006; Zhang et al., 2007; Sexton et al., 2010). Moreover, decreased connectivity of multiple brain regions, including the temporal lobe, hippocampus, fusiform gyrus and parietal lobe, has also been documented as the cause of cognitive decline in AD patients (Bokde et al., 2006; Stam et al., 2007; He et al., 2008). Decreased MS in multiple brain regions, including the temporal, parietal and part of the occipital cortical regions in AD, reflected the weakening of the abovementioned brain regions’ anatomical connections from the histological and cellular architecture level and implied increased architectonic differentiation and decreased axonal connectivity between these cortical regions. We further found a correlation between the weakening of this anatomical connection and the impairment of memory function, suggesting that the anatomical disconnection caused by the reduction of the similarity of histology and cellular architecture may be the neural basis for the impairment of memory function in AD patients.
Our result of elevated MS in the prefrontal areas and the left lingual gyrus in AD patients suggested increased architectonic similarity and enhanced axonal connectivity in these regions in AD patients. These findings were consistent with enhanced functional activation and connectivity within frontal regions in the early stage of AD (Grady et al., 2003; Aganj et al., 2020). In addition, at the local network level, changes in connectivity of the left lingual gyrus were also reported to be significantly negatively correlated with behavioral performance in AD patients (Chang et al., 2020). We tended to interpret the increased prefrontal and lingual MS in AD as a structural compensatory reallocation of cognitive resources. This explanation was further supported by the negative correlation between the average MS value of the brain areas and increased MS and memory function in AD patients. The more structural compensatory the increase in MS is, the worse the performance of the memory function is. As the disease becomes severe, the structural compensatory increase may disappear, but this needs to be confirmed by future longitudinal studies. Regarding the occipital areas, most AD studies have reported atrophy, hypometabolism (Ten Kate et al., 2018; Das et al., 2021) and connection changes (Huang et al., 2020) in this area in AD patients. Studies have also found an up-regulated signaling pathway located in the occipital area in AD patients, which suggests that an enhancement in dying or surviving neurons plays a protective role by compensating for decreased neurotransmission during the progression of AD (Jacobs et al., 2006). The inconsistent MS change patterns in the occipital areas in AD patients in the current study may be related to different functional areas with distinct changing patterns in the occipital lobe, which was supported by the evidence of the dissociation between impaired explicit memory encoding in secondary visual areas and intact implicit encoding in the primary visual cortex in AD.
Linking Gene Expression to Morphometric Similarity Difference Map and Functional Annotation
PLS analysis showed that the PLS1 + gene was positively correlated with the AD-related MS difference map, and the PLS1-gene was negatively correlated with the AD-related MS difference map. However, only PLS1-genes were significantly enriched in downregulated AD-related DEGs. GO analysis and cell-type-specific analysis showed that the PLS-genes were cytologically enriched in neurons and astrocytes and functionally involved in neuron-specific biological processes, including synaptic signaling, neurotransmitter release, axonogenesis, and cognition. Because PLS1 + genes were not enriched in AD differential genes and implicated in non-neuron-specific functions, the following discussion mainly focuses on the PLS1-genes.
The circuitry of the human brain is formed by neuronal networks in which astrocytes embed. Synaptic signaling, neurotransmitter release and axonogenesis are fundamental to highly efficient neuronal networks, which maintain normal cognition in humans (Verkhratsky et al., 2010). The loss of neurons and synapses and axon destruction are common findings in AD neuropathology and are related to cognitive decline in AD patients. Exposure of astrocytes to Aβ may induce astrocyte activation (Diniz et al., 2017) and release proinflammatory cytokines, contributing to neuronal death (Wood et al., 2015). As PLS1-genes were significantly enriched in downregulated AD-related DEGs, it can be presumed that the reduced expression of PLS1-genes may lead to neuron death, axon deterioration and synapse loss, causing histological similarity and anatomical connectivity destruction and, thus, abnormal MS changes in AD.
The PLS1-genes acted as a whole gene set in the enrichment analysis for AD-related DEGs, cortical cell types and GO terms. We cannot ensure that every single gene in the PLS1-gene set was enriched in AD-related DEGs, cortical cell types and GO terms simultaneously. The significance of the enrichment analysis did not represent for the true biological connection. Further in vitro and in vivo experiments are warranted to validate our hypothesis. Although variation from multiple sites and scanners could be moderately adjusted using ComBat harmonization, different scan protocols still affected the results. More robust methods are needed in the future to properly control the batch effect from multiple sites and scanners.
In summary, this study revealed AD-related cortical MS changes associated with memory function. Linking gene expression to cortical MS changes, the negative MS-related genes were found to be enriched explicitly in neurons and astrocytes, participate in neuron-specific biological processes and be significantly downregulated in AD. These findings may provide a possible molecular and cellular substrate for MS abnormalities and cognitive decline in AD.
Data Availability Statement
The original contributions presented in the study are included in the article/Supplementary Material, further inquiries can be directed to the corresponding author/s.
Ethics Statement
The Data used in this study were obtained from the Alzheimer’s Disease Neuroimaging Initiative (ADNI) (http://adni.loni.usc.edu/). The ADNI data were previously collected across 50 research sites. Study subjects gave written informed consent at the time of enrollment for imaging and genetic sample collection and completed questionnaires approved by each participating sites’ Institutional Review Board (IRB). The list of all sites can be found in Supplementary Material, Data Sheet 2. All procedures performed in studies involving human participants were in accordance with the ethical standards of the institutional and/or national research committee and with the 1964 Helsinki declaration and its later amendments or comparable ethical standards. The patients/participants provided their written informed consent to participate in this study.
Author Contributions
JS and YZ conceived the idea. MM and ZX analyzed the MRI data. HW analyzed the transcription data. NZ analyzed the behavioral data. YZ wrote the initial draft. All authors agreed with the final version of the manuscript.
Funding
This work was supported by the National Natural Science Foundation of China (81601476 and 81870831).
Conflict of Interest
The authors declare that the research was conducted in the absence of any commercial or financial relationships that could be construed as a potential conflict of interest.
Publisher’s Note
All claims expressed in this article are solely those of the authors and do not necessarily represent those of their affiliated organizations, or those of the publisher, the editors and the reviewers. Any product that may be evaluated in this article, or claim that may be made by its manufacturer, is not guaranteed or endorsed by the publisher.
Supplementary Material
The Supplementary Material for this article can be found online at: https://www.frontiersin.org/articles/10.3389/fnins.2021.731292/full#supplementary-material
Footnotes
- ^ http://adni.loni.ucla.edu
- ^ http://surfer.nmr.mgh.harvard.edu/
- ^ http://www.fmrib.ox.ac.uk
- ^ http://human.brain-map.org/
- ^ https://doi.org/10.6084/m9.figshare.2057796.v1
- ^ https://www.ncbi.nlm.nih.gov/geo/
- ^ http://genetics.wustl.edu/jdlab/psi_package/
References
Aganj, I., Frau-Pascual, A., Iglesias, J. E., Yendiki, A., Augustinack, J. C., Salat, D. H., et al. (2020). Compensatory brain connection discovery in Alzheimer’s disease. Proc. IEEE Int. Symp. Biomed. Imaging 2020, 283–287. doi: 10.1109/ISBI45749.2020.9098440
Bellenguez, C., Grenier-Boley, B., and Lambert, J. C. (2020). Genetics of Alzheimer’s disease: where we are, and where we are going. Curr. Opin. Neurobiol. 61, 40–48. doi: 10.1016/j.conb.2019.11.024
Bokde, A. L., Lopez-Bayo, P., Meindl, T., Pechler, S., Born, C., Faltraco, F., et al. (2006). Functional connectivity of the fusiform gyrus during a face-matching task in subjects with mild cognitive impairment. Brain 129, 1113–1124. doi: 10.1093/brain/awl051
Busatto, G. F., Garrido, G. E., Almeida, O. P., Castro, C. C., Camargo, C. H., Cid, C. G., et al. (2003). A voxel-based morphometry study of temporal lobe gray matter reductions in Alzheimer’s disease. Neurobiol. Aging 24, 221–231. doi: 10.1016/S0197-4580(02)00084-2
Chang, Y. T., Hsu, J. L., Huang, S. H., Hsu, S. W., Lee, C. C., and Chang, C. C. (2020). Functional connectome and neuropsychiatric symptom clusters of Alzheimer’s disease. J. Affect. Disord. 273, 48–54. doi: 10.1016/j.jad.2020.04.054
Crane, P. K., Carle, A., Gibbons, L. E., Insel, P., Mackin, R. S., Gross, A., et al. (2012). Development and assessment of a composite score for memory in the Alzheimer’s Disease Neuroimaging Initiative (ADNI). Brain Imaging Behav. 6, 502–516. doi: 10.1007/s11682-012-9186-z
Das, G., Dubey, S., Sinharoy, U., Mukherjee, A., Banerjee, S., Lahiri, D., et al. (2021). Clinical and radiological profile of posterior cortical atrophy and comparison with a group of typical Alzheimer disease and amnestic mild cognitive impairment. Acta Neurol. Belg. 121, 1009–1018. doi: 10.1007/s13760-020-01547-4
Diniz, L. P., Tortelli, V., Matias, I., Morgado, J., Bérgamo Araujo, A. P., Melo, H. M., et al. (2017). Astrocyte transforming growth factor beta 1 protects synapses against Aβ oligomers in Alzheimer’s disease model. J Neurosci 37, 6797–6809. doi: 10.1523/JNEUROSCI.3351-16.2017
Femminella, G. D., Thayanandan, T., Calsolaro, V., Komici, K., Rengo, G., Corbi, G., et al. (2018). Imaging and molecular mechanisms of alzheimer’s disease: a review. Int. J. Mol. Sci. 19:3702. doi: 10.3390/ijms19123702
Fortin, J. P., Cullen, N., Sheline, Y. I., Taylor, W. D., Aselcioglu, I., Cook, P. A., et al. (2018). Harmonization of cortical thickness measurements across scanners and sites. Neuroimage 167, 104–120. doi: 10.1016/j.neuroimage.2017.11.024
Fortin, J. P., Parker, D., Tunç, B., Watanabe, T., Elliott, M. A., Ruparel, K., et al. (2017). Harmonization of multi-site diffusion tensor imaging data. Neuroimage 161, 149–170. doi: 10.1016/j.neuroimage.2017.08.047
Frisoni, G. B., Testa, C., Zorzan, A., Sabattoli, F., Beltramello, A., Soininen, H., et al. (2002). Detection of grey matter loss in mild Alzheimer’s disease with voxel based morphometry. J. Neurol. Neurosurg. Psychiatry 73, 657–664. doi: 10.1136/jnnp.73.6.657
Gonzalez-Escamilla, G., Miederer, I., Grothe, M. J., Schreckenberger, M., Muthuraman, M., and Groppa, S. (2020). Metabolic and amyloid PET network reorganization in Alzheimer’s disease: differential patterns and partial volume effects. Brain Imaging Behav. 15, 190–204. doi: 10.1007/s11682-019-00247-9
Grady, C. L., McIntosh, A. R., Beig, S., Keightley, M. L., Burian, H., and Black, S. E. (2003). Evidence from functional neuroimaging of a compensatory prefrontal network in Alzheimer’s disease. J. Neurosci. 23, 986–993. doi: 10.1523/JNEUROSCI.23-03-00986.2003
He, Y., Chen, Z., and Evans, A. (2008). Structural insights into aberrant topological patterns of large-scale cortical networks in Alzheimer’s disease. J. Neurosci. 28, 4756–4766. doi: 10.1523/JNEUROSCI.0141-08.2008
Huang, S. Y., Hsu, J. L., Lin, K. J., and Hsiao, I. T. (2020). A novel individual metabolic brain network for 18F-FDG PET imaging. Front. Neurosci. 14:344. doi: 10.3389/fnins.2020.00344
Im, K., Lee, J. M., Seo, S. W., Hyung Kim, S., Kim, S. I., and Na, D. L. (2008). Sulcal morphology changes and their relationship with cortical thickness and gyral white matter volume in mild cognitive impairment and Alzheimer’s disease. Neuroimage 43, 103–113. doi: 10.1016/j.neuroimage.2008.07.016
Jack, C. R. Jr., Bernstein, M. A., Borowski, B. J., Gunter, J. L., Fox, N. C., Thompson, P. M., et al. (2010). Update on the magnetic resonance imaging core of the Alzheimer’s disease neuroimaging initiative. Alzheimers Dement. 6, 212–220. doi: 10.1016/j.jalz.2010.03.004
Jacobs, E. H., Williams, R. J., and Francis, P. T. (2006). Cyclin-dependent kinase 5, Munc18a and Munc18-interacting protein 1/X11alpha protein up-regulation in Alzheimer’s disease. Neuroscience 138, 511–522. doi: 10.1016/j.neuroscience.2005.11.017
Kalus, P., Slotboom, J., Gallinat, J., Mahlberg, R., Cattapan-Ludewig, K., Wiest, R., et al. (2006). Examining the gateway to the limbic system with diffusion tensor imaging: the perforant pathway in dementia. Neuroimage 30, 713–720. doi: 10.1016/j.neuroimage.2005.10.035
Kantarci, K., Murray, M. E., Schwarz, C. G., Reid, R. I., Przybelski, S. A., Lesnick, T., et al. (2017). White-matter integrity on DTI and the pathologic staging of Alzheimer’s disease. Neurobiol. Aging 56, 172–179. doi: 10.1016/j.neurobiolaging.2017.04.024
Lerch, J. P., Pruessner, J. C., Zijdenbos, A., Hampel, H., Teipel, S. J., and Evans, A. C. (2005). Focal decline of cortical thickness in Alzheimer’s disease identified by computational neuroanatomy. Cereb. Cortex 15, 995–1001. doi: 10.1093/cercor/bhh200
Li, S., Yuan, X., Pu, F., Li, D., Fan, Y., Wu, L., et al. (2014). Abnormal changes of multidimensional surface features using multivariate pattern classification in amnestic mild cognitive impairment patients. J. Neurosci. 34, 10541–10553. doi: 10.1523/JNEUROSCI.4356-13.2014
Lo, C. Y., Wang, P. N., Chou, K. H., Wang, J., He, Y., and Lin, C. P. (2010). Diffusion tensor tractography reveals abnormal topological organization in structural cortical networks in Alzheimer’s disease. J. Neurosci. 30, 16876–16885. doi: 10.1523/JNEUROSCI.4136-10.2010
Morra, J. H., Tu, Z., Apostolova, L. G., Green, A. E., Avedissian, C., Madsen, S. K., et al. (2008). Validation of a fully automated 3D hippocampal segmentation method using subjects with Alzheimer’s disease mild cognitive impairment, and elderly controls. Neuroimage 43, 59–68. doi: 10.1016/j.neuroimage.2008.07.003
Naggara, O., Oppenheim, C., Rieu, D., Raoux, N., Rodrigo, S., Dalla Barba, G., et al. (2006). Diffusion tensor imaging in early Alzheimer’s disease. Psychiatry Res. 146, 243–249. doi: 10.1016/j.pscychresns.2006.01.005
Pettigrew, C., Soldan, A., Zhu, Y., Wang, M. C., Brown, T., Miller, M., et al. (2017). Cognitive reserve and cortical thickness in preclinical Alzheimer’s disease. Brain Imaging Behav. 11, 357–367. doi: 10.1007/s11682-016-9581-y
Seidlitz, J., Vasa, F., Shinn, M., Romero-Garcia, R., Whitaker, K. J., Vertes, P. E., et al. (2018). Morphometric similarity networks detect microscale cortical organization and predict inter-individual cognitive variation. Neuron 97, 231.e7–247.e7. doi: 10.1016/j.neuron.2017.11.039
Seong, J. K., Im, K., Yoo, S. W., Seo, S. W., Na, D. L., and Lee, J. M. (2010). Automatic extraction of sulcal lines on cortical surfaces based on anisotropic geodesic distance. Neuroimage 49, 293–302. doi: 10.1016/j.neuroimage.2009.08.013
Sexton, C. E., Mackay, C. E., Lonie, J. A., Bastin, M. E., Terrière, E., O’Carroll, R. E., et al. (2010). MRI correlates of episodic memory in Alzheimer’s disease, mild cognitive impairment, and healthy aging. Psychiatry Res. 184, 57–62. doi: 10.1016/j.pscychresns.2010.07.005
Stam, C. J., Jones, B. F., Nolte, G., Breakspear, M., and Scheltens, P. (2007). Small-world networks and functional connectivity in Alzheimer’s disease. Cereb. Cortex 17, 92–99. doi: 10.1093/cercor/bhj127
Ten Kate, M., Dicks, E., Visser, P. J., van der Flier, W. M., Teunissen, C. E., Barkhof, F., et al. (2018). Atrophy subtypes in prodromal Alzheimer’s disease are associated with cognitive decline. Brain 141, 3443–3456. doi: 10.1093/brain/awy264
Verkhratsky, A., Olabarria, M., Noristani, H. N., Yeh, C. Y., and Rodriguez, J. J. (2010). Astrocytes in Alzheimer’s disease. Neurotherapeutics 7, 399–412. doi: 10.1016/j.nurt.2010.05.017
Wang, Y., Yang, D., Li, Q., Kaufer, D., Styner, M., and Wu, G. (2020). Characterizing the propagation pattern of neurodegeneration in Alzheimer’s disease by longitudinal network analysis. Proc. IEEE Int. Symp. Biomed. Imaging 2020, 292–295. doi: 10.1109/ISBI45749.2020.9098513
Weiner, M. W., Veitch, D. P., Aisen, P. S., Beckett, L. A., Cairns, N. J., Green, R. C., et al. (2017). The Alzheimer’s disease neuroimaging initiative 3: continued innovation for clinical trial improvement. Alzheimers Dement. 13, 561–571. doi: 10.1016/j.jalz.2016.10.006
Wood, L. B., Winslow, A. R., Proctor, E. A., McGuone, D., Mordes, D. A., Frosch, M. P., et al. (2015). Identification of neurotoxic cytokines by profiling Alzheimer’s disease tissues and neuron culture viability screening. Sci. Rep. 5:16622. doi: 10.1038/srep16622
Yao, Z., Zhang, Y., Lin, L., Zhou, Y., Xu, C., Jiang, T., et al. (2010). Abnormal cortical networks in mild cognitive impairment and Alzheimer’s disease. PLoS Comput. Biol. 6:e1001006. doi: 10.1371/journal.pcbi.1001006
Keywords: Alzheimer’s disease, morphometric similarity, Allen Human Brain Atlas, gene transcription, sMRI = structural MRI
Citation: Zhang Y, Ma M, Xie Z, Wu H, Zhang N and Shen J (2021) Bridging the Gap Between Morphometric Similarity Mapping and Gene Transcription in Alzheimer’s Disease. Front. Neurosci. 15:731292. doi: 10.3389/fnins.2021.731292
Received: 26 June 2021; Accepted: 03 September 2021;
Published: 29 September 2021.
Edited by:
Liang Zhan, University of Pittsburgh, United StatesReviewed by:
Zhigang Qi, Capital Medical University, ChinaShaoqiang Han, First Affiliated Hospital of Zhengzhou University, China
Copyright © 2021 Zhang, Ma, Xie, Wu, Zhang and Shen. This is an open-access article distributed under the terms of the Creative Commons Attribution License (CC BY). The use, distribution or reproduction in other forums is permitted, provided the original author(s) and the copyright owner(s) are credited and that the original publication in this journal is cited, in accordance with accepted academic practice. No use, distribution or reproduction is permitted which does not comply with these terms.
*Correspondence: Junlin Shen, c2hlbmp1bmxpbjgzOTBAMTYzLmNvbQ==
 Yang Zhang1
 Nan Zhang
 Junlin Shen