 Micael Teixeira1,2†
 Christian Mancini1†
 Corentin Aurèle Wicht1
 Gianluca Maestretti3
 Thierry Kuntzer4
 Dario Cazzoli5,6
 Michael Mouthon1
 Jean-Marie Annoni1
 Joelle Nsimire Chabwine1,7*
- 1Neurology Unit, Medicine Section, Laboratory for Cognitive and Neurological Science, Department of Neuroscience and Movement Science, Faculty of Science and Medicine, University of Fribourg, Fribourg, Switzerland
- 2Faculty of Medicine, University of Bern, Bern, Switzerland
- 3Department of Orthopedics, Fribourg Hospital, Fribourg, Switzerland
- 4Nerve-Muscle Unit, Neurology Service, Department of Clinical Neurosciences, Lausanne University Hospital (CHUV), University of Lausanne, Lausanne, Switzerland
- 5Gerontechnology and Rehabilitation Group, ARTORG Center for Biomedical Engineering Research, University of Bern, Bern, Switzerland
- 6Perception and Eye Movement Laboratory, Department of Neurology, Inselspital, Bern University Hospital, University of Bern, Bern, Switzerland
- 7Division of Neurorehabilitation, Fribourg Hospital, Fribourg, Switzerland
This preliminary investigation aimed to assess beta (β) oscillation, a marker of the brain GABAergic signaling, as a potential objective pain marker, hence contributing at the same time to the mechanistic approach of pain management. This case–control observational study measured β electroencephalographic (EEG) oscillation in 12 right-handed adult male with chronic neuropathic pain and 10 matched controls (∼55 years). Participants were submitted to clinical evaluation (pain visual analog scale, Hospital Anxiety, and Depression scale) and a 24-min high-density EEG recording (BIOSEMI). Data were analyzed using the EEGlab toolbox (MATLAB), SPSS, and R. The global power spectrum computed within the low (Lβ, 13–20 Hz) and the high (Hβ, 20–30 Hz) β frequency sub-bands was significantly lower in patients than in controls, and accordingly, Lβ was negatively correlated to the pain visual analog scale (R = −0.931, p = 0.007), whereas Hβ correlation was at the edge of significance (R = −0.805; p = 0.053). Patients’ anxiety was correlated to pain intensity (R = 0.755; p = 0.003). Normalization of the low and high β global power spectrum (GPS) to the GPS of the full frequency range, while confirming the significant Lβ power decrease in chronic neuropathic pain patients, vanished the significance of the Hβ decrease, as well as the correlation between Lβ power and pain intensity. Our results suggest that the GABAergic Lβ EEG oscillation is affected by chronic neuropathic pain. Confirming the Lβ GPS decrease and the correlation with pain intensity in larger studies would open new opportunities for the clinical application of gamma-aminobutyric acid-modifying therapies.
Introduction
Pain is a major public health challenge, and a large number of available analgesic drugs do not prevent from high treatment failure rate (Mantha et al., 1993). Despite the great variety of pain etiologies, all pain types are treated using similar drugs, irrespective of their underlying mechanisms (Vargas-Schaffer, 2010), which could explain why successful analgesia is hard to reach. A mechanism-based classification of pain could probably help improving treatment efficiency. Several neurotransmitters are involved in nociception (Schaible, 2007; Ossipov et al., 2010), including gamma-aminobutyric acid (GABA), the major brain inhibitory neurotransmitter, which plays a critical role in different pain processing steps (Enna and McCarson, 2006; Barr et al., 2013). Thus, the GABAergic signaling could be a suitable candidate for a mechanism-based approach to characterize and manage pain.
Pain can be evaluated by means of several clinical tools, among which the Visual Analog Scale (VAS), the Numerical Rating Scale (Haefeli and Elfering, 2006; Hawker et al., 2011), and the Brief Pain Inventory (BPI), the latter taking also into account the complexity and the impact of pain on multiple domains of life, such as sleep and mood (Cleeland and Ryan, 1994; Tan et al., 2004; Shi et al., 2017). These scales are all based on the patient’s subjective pain perception, which is influenced by many factors, such as the cognitive state, mood, etc. On the other hand, many brain areas contributing to pain regulation (within the pain matrix) are also involved in several other functions, such as cognition, emotion, motivation, or other sensory modalities (Ossipov et al., 2010). For all these reasons, the pain matrix structure and function (and thereby pain perception) can be influenced by all the factors mentioned earlier (Bushnell et al., 2013). This complex interplay between factors interfering with both pain regulation and its subjective perception makes it difficult to find a comprehensive assessment tool. Hence, the need for a complementary evaluation, based on more objective criteria, e.g., biomarkers related to physiological pain mechanisms, that could contribute to characterize further and hopefully better manage pain (Archibald et al., 2018).
Successful analgesia is achieved when pain intensity (evaluated by the VAS) is <3 (Mantha et al., 1993). This pain level could be considered as a cutoff value defining in a very simple way what a “significant” pain is, even if other classifications of pain severity exist (Mantha et al., 1993; Collins et al., 1997). The International Association for Studies of Pain defines chronic pain as lasting for more than 3 months (Fine, 2011; Treede et al., 2015). However, the concept of chronic pain refers to the prolonged duration of pain because substantial and long-lasting changes are thought to occur within the pain matrix in this context (Schaible, 2007; Baliki et al., 2012; Baliki et al., 2014). Animal experimental data show that, in chronic pain situations, virtually the whole set of neurotransmitters (including GABA and glutamate) modify their functioning in pain regulating regions. This ultimately leads to an imbalance between excitation and inhibition in favor of excitation (Ossipov et al., 2010; Pinheiro et al., 2016). Therefore, one could expect the brain inhibitory input (mainly mediated by the GABAergic signaling) to lower under these conditions. Some studies show indeed a decrease in cortical inhibition correlated to pain intensity (Barr et al., 2013; Henderson et al., 2013; Parker et al., 2016), whereas others show the opposite (i.e., an increase of inhibition) (Sarnthein et al., 2006; Lim et al., 2016). Most of these preliminary studies were conducted in patients suffering from the pain of different origins, using varied electrophysiological and brain imaging techniques and methods, and data analysis was most of the time not standardized.
Brain GABAergic activity can be measured via several techniques, including transcranial magnetic stimulation (Premoli et al., 2014), and electroencephalography (EEG), a noninvasive, cheap, and readily accessible tool to assess brain electrical activity (Barr et al., 2013). The beta (β, 13–30 Hz) and gamma (γ, 30–100 Hz) EEG oscillations represent an index of the brain’s GABAergic activity, as they are mainly produced by inhibitory interneurons (Gaetz et al., 2011; Christian et al., 2015; Baumgarten et al., 2016). Electroencephalographic studies of pain-related GABAergic signaling focus mostly on the γ frequency domain, although γ waves are generated deep in the brain and are therefore not easy to record with scalp EEG (Rutkove, 2007). On the contrary, data concerning pain-related β EEG activity are scarce (Barr et al., 2013; Bushnell et al., 2013; Pinheiro et al., 2016), whereas β activity, related to the amount of GABA in the somatosensory cortex (Baumgarten et al., 2016), is more reliably measured by scalp EEG.
Thus, brain GABAergic activity can be reliably measured by EEG β oscillations. In a mechanistic approach of pain assessment, β oscillations could represent an index of the GABAergic component of pain. This pilot case–control study aimed, therefore, at recording β EEG oscillations in patients suffering from chronic neuropathic pain (CNP), with the hypothesis that β waves would decrease and be negatively correlated with pain intensity, in accordance with most convincing data (Harris and Clauw, 2012; Barr et al., 2013; Parker et al., 2016).
Materials and Methods
Study Design
This case–control cross-sectional, observational study involved patients suffering from CNP and sex (all males)-matched healthy controls of similar age (±5 years). Participants were recruited and investigated between September 2015 and January 2018.
Participants
Patients (all right-handed) suffered from CNP due to a peripheral nerve lesion in the lower limbs lasting for ≥6 months. The diagnosis of peripheral neuropathy was made by a specialist (neurologist, pain specialist, or an orthopedist specialized in spine surgery) and supported by a “Douleur Neuropathique 4 questions” (DN4) (Bouhassira et al., 2005; Bennett et al., 2007) score of ≥4. Exclusion criteria were the presence of any central nervous system lesion or disease (including epilepsy, parasomnia, and cognitive impairment), the coexistence of other types of pain, and analgesic surgical interventions within less than 6 months before inclusion. Sex- and overall age-matched controls [independent t-test: t(16.955) = 0.358; p = 0.738] fulfilled the same inclusion (except for the presence of pain) and exclusion criteria as patients.
The study fulfilled the requirements of the Declaration of Helsinki and was approved by the Ethics Committee of Vaud under the reference 331/15. Each participant signed informed consent before any investigation.
Data Collection
Interview, Clinical Examination, and Clinical Scores
In total, 16 CNP patients and 14 healthy controls were screened. Among them, two controls were finally excluded because they happened to have exclusion criteria upon a second check. All recruited participants underwent individual, in-person interview following a standardized questionnaire including personal and medical data and information on their sleep behavior. In addition, sleep-related [Insomnia Severity Index (Omachi, 2011)] and mood-related [Hospital Anxiety and Depression (HAD) (Zigmond and Snaith, 1983)] scales were compiled. Three additional scales related to pain were included in patients’ assessment: the DN4, to confirm the neuropathic pattern of pain (Bouhassira et al., 2005; Bennett et al., 2007), the VAS, to quantify pain intensity (Collins et al., 1997), and the BPI, French version (Poundja et al., 2007), to further characterize pain and evaluate its impact on patients’ life (Kerns et al., 1985). For the purpose of the analysis included in this paper, only data related to pain and mood were considered.
Clinical examination was performed by medical doctors (JNC and JMA) or one trained medical student (MT) to confirm lower-limb localization of pain and absence of exclusion criteria.
Electrophysiological Recordings
All EEG recordings took place in the morning to exclude bias due to nychthemeral variations of pain (Strian et al., 1989). During EEG recordings, participants sat alone in a quiet room shielded in a Faraday cage and were requested to minimize eye blinks or any other body movements. The EEG recording protocol consisted of a 24-min resting-state paradigm (i.e., without any task involvement), mostly with eyes closed (Figure 1A), a condition considered to reflect a basal arousal state and accompanied by an increased alpha frequency amplitude (Barry et al., 2007). The alpha (α) global power spectrum (GPS) averaged over all patients for epochs recorded in eye-closed (Figure 1B) vs. in eye-open (Figure 1C) conditions appeared to be different. The visual difference observed between the two topoplots was indeed statistically confirmed, showing ∼100 times higher power with eyes closed (p = 0.002). Similar results were observed in controls (more than 10 times higher GPS in the eye-closed condition; not shown in the figure): 2.07 (3.81) dB for the eyes-closed condition and −0.13 (3.42) dB for the eyes-open condition [t(9) = −4.186, p = 0.002]. Thus, lower α amplitudes in the eye-open condition confirm significant changes occurring in EEG signals, which could have introduced a bias in our analysis of other frequency bands if not taken into account. For this reason, only data recorded in the eye-closed condition were considered when performing all remaining analyses.
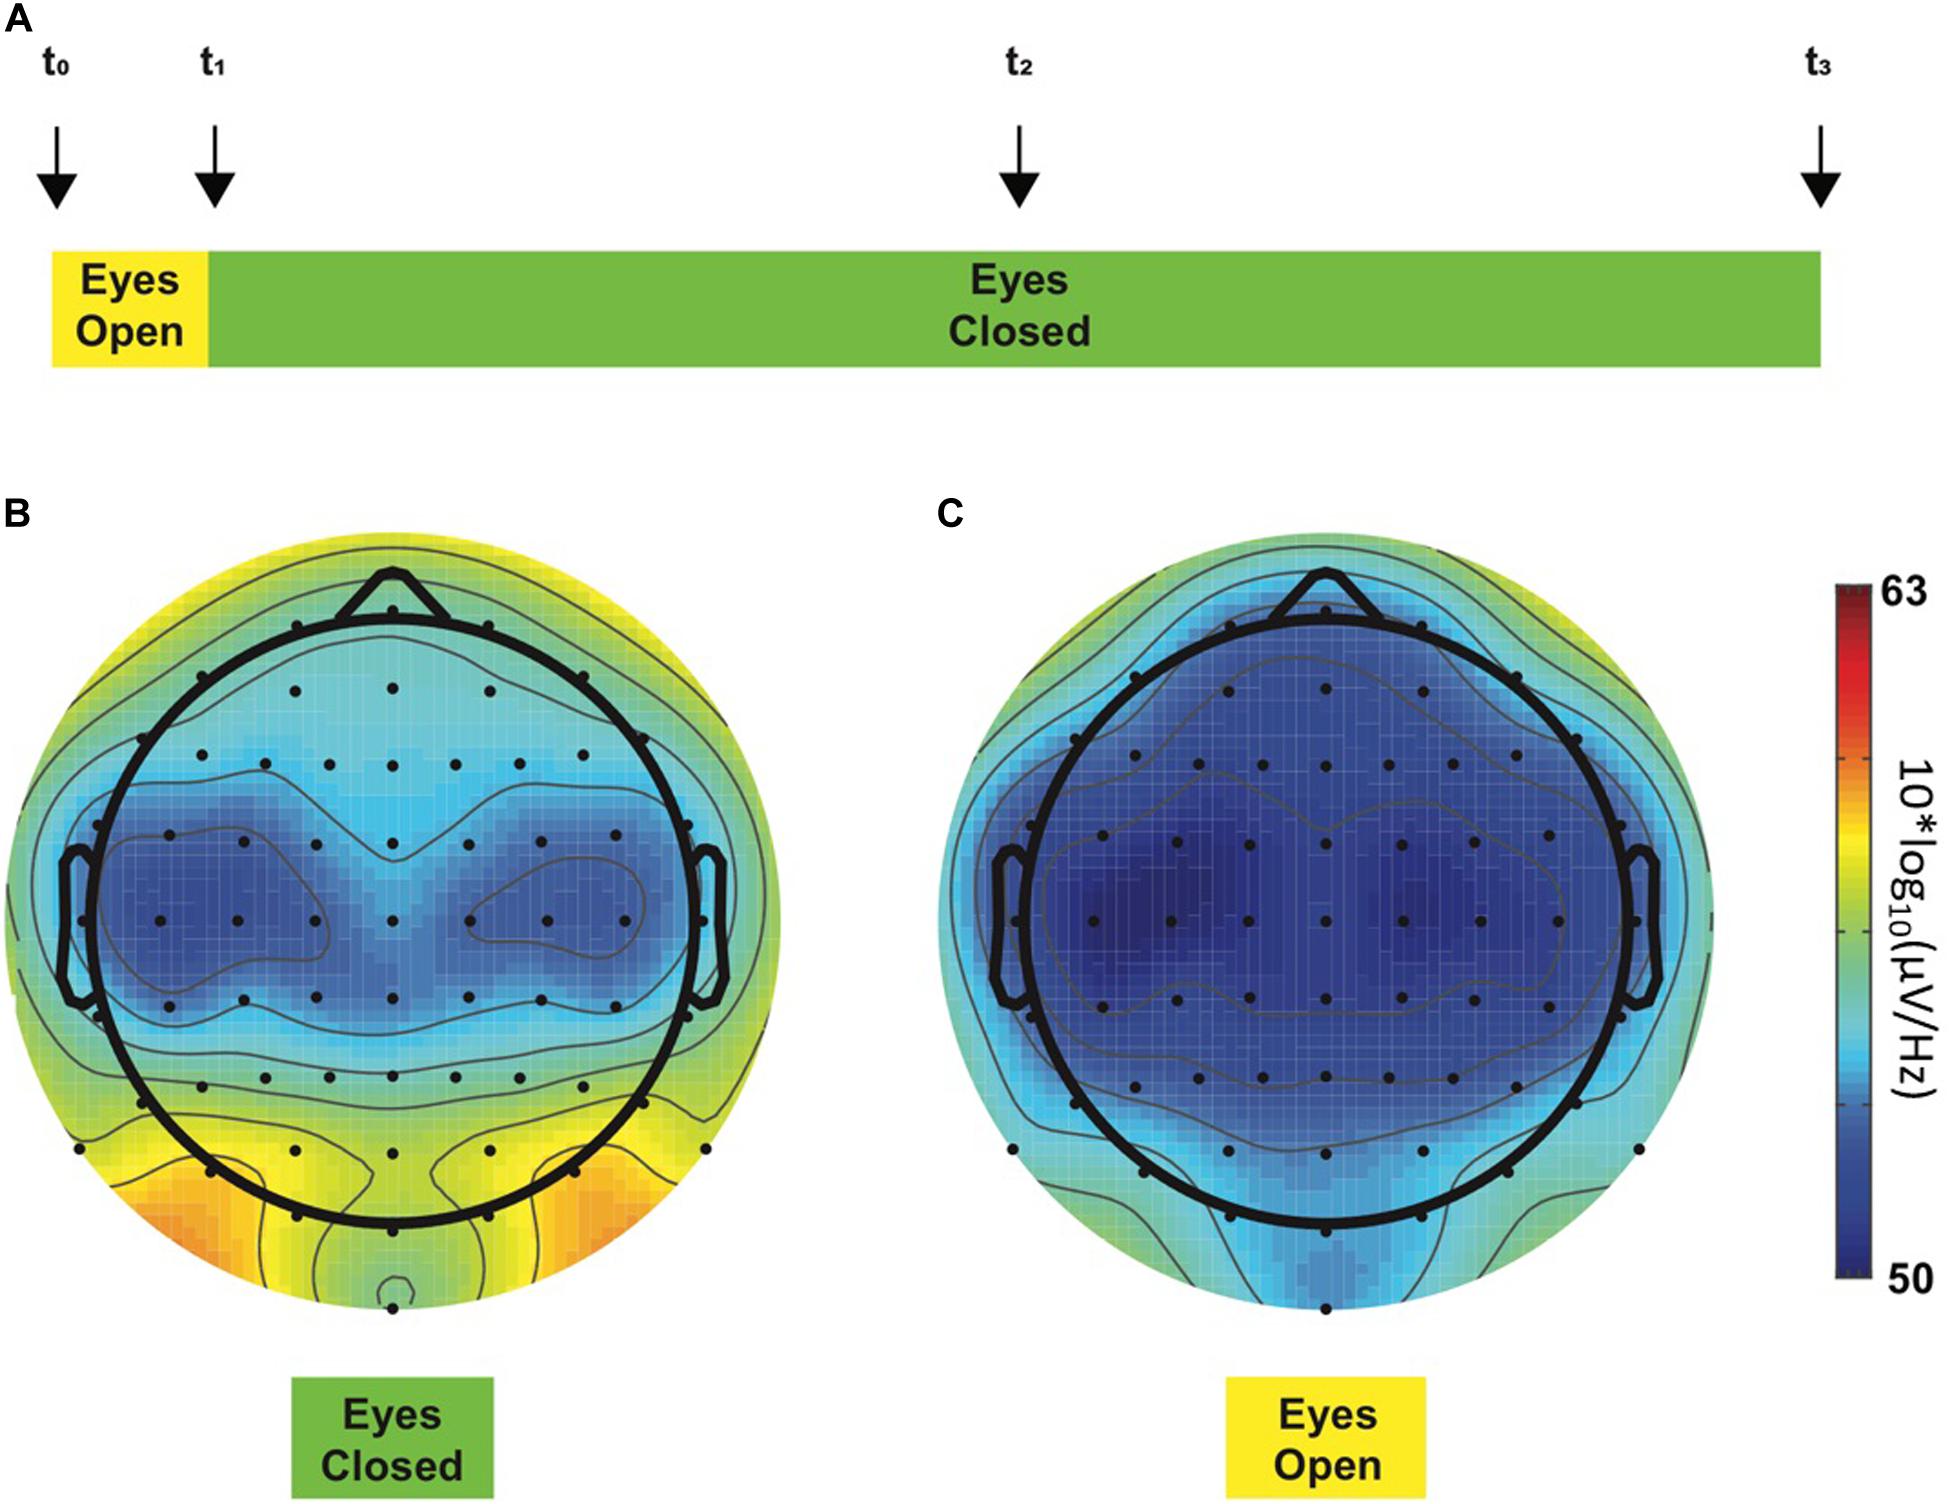
Figure 1. Resting-state EEG recording protocol (A). This 24-min experiment started with a 2-min period, during which the participant opened his eyes (yellow color), and for the rest of the experiment, the eyes had to remain closed (green color). Four acoustic cues (“beeps,” vertical arrows) were presented to the participant during the experimental session to warn him about the ongoing experimental step, i.e., to switch to the eye-closed condition or to keep him awake. Each participant was instructed concerning the meaning of each acoustic cue before the beginning of the experiment. First and last beeps (t_0 and t_3, respectively) determined the beginning and the end of the experimental session, respectively. Second beep (t_1) occurred 2 min after t_0 and instructed the participant to close his eyes, whereas the third beep (t_2) occurred in the middle of the experiment and was implemented to maintain the participants awake as they tend to fall asleep. Alpha GPS-derived topoplots in all chronic neuropathic pain patients during eye-closed (B) and eye-open (C) experimental steps. The color bar at the right side of the figures represents ascending alpha power values from the lowest at the bottom [blue, 50 10*log10(μV/Hz)] through the highest at the top [red, 63 10*log10(μV/Hz)]. As expected, two alpha peaks were observed in posterior regions on the left and the right side, respectively, during the eyes-closed condition (B, left topoplot). On the contrary, these prominent peaks disappeared when the eyes were open (C, right topoplot). GPS significantly differed between eye-closed [−0.02 (4.21) dB] and eye-open [−2.17 (4.15) dB] conditions [t(11) = −4.072, p = 0.002].
The EEG data were continuously recorded at 1,024 Hz using a high-density (64 electrodes) EEG (BIOSEMI ActiveTwo) recording system referenced to the built-in CMS-DRL ground (BIOSEMI, Amsterdam, Netherlands).
Data Analysis
Electroencephalography Preprocessing
Spectral Analysis
Automated data preprocessing was performed using a customized MATLAB script based on the EEGLab Toolbox (Delorme and Makeig, 2004) and on the preprocessing pipeline developed by Bigdely-Shamlo et al. (2015) First, raw EEG data were re-referenced to the Cz electrode, down-sampled to 512 Hz, and band-pass filtered between 1 and 60 Hz for artifact removal preparation (Winkler et al., 2015). Automated artifact rejection algorithms (EEGLab plugins) were applied to remove sinusoidal noise stemming from alternating current power line fluctuations [CleanLine (Mullen, 2012)] or high amplitude eyes movements, muscle artifacts, and electrode drifts [Artifact Subspace Reconstruction (Chang et al., 2018)]. Channel interpolation algorithms were used to detect any flawed channels (limited to a maximum of seven rejected electrodes). Preprocessed EEG data were then segmented in 2-s epochs, and two additional artifact detection algorithms were applied to ensure adequate cleaning of epoched data. Finally, re-referencing to average reference was mandatory before all spectral analyses.
It was important to analyze only data recorded in wakefulness because sleep stages were expected to interfere with fast EEG oscillations, including beta waves (Barry et al., 2007). Data analysis was based on a windowed Fourier transform. This was performed with MATLAB and the EEGLab toolbox for MATLAB.
To automatically select data recorded in wakefulness state, a data-driven analysis was developed following empirical evidence (Diaz et al., 2016). This method computes the ratio between the α (8–12 Hz) and the Theta (θ, 5–7 Hz) GPS. For this purpose, a 4-s windowed fast Fourier transform was performed (on 4-s windows obtained by regrouping adjacent 2-s epochs). Only 4-s windows with α/θ ratio ≥1 were considered to be recorded in wakefulness and selected for further analyses. Selected epochs were finally submitted to a 2-s windowed Fourier transformation for frequency analysis between 2 and 48 Hz to minimize electronic devices’ noise and because all frequencies of interest were below 48 Hz.
In the present paper, only data concerning the β (13–30 Hz) and the delta (δ, 2–4 Hz) frequency range are presented. The δ frequency was selected as a negative control, owing to the absence of clear links between δ oscillations and chronic pain in the literature (Pinheiro et al., 2016). The GPS for a given frequency was computed by averaging the respective frequency power data across all epochs recorded over all electrodes in a particular participant. A logarithmic transformation was used to obtain near-normally distributed data (Gasser et al., 1982). Unless otherwise specified, all data are presented in this log-transformed version. Data were then converted to decibel to remove any artefactual constant activity in the signal (represented in the results section as 10∗log10) (Delorme and Makeig, 2004).
Initial analyses evidenced that the β frequency domain was characterized by two prominent “peaks” (maxima) of power in most subjects, located approximately at 16 and 25 Hz, which corresponded to the centers, respectively, of the Lβ (13–20 Hz) and the Hβ (20–30 Hz) frequency sub-bands (von Rotz et al., 2017). Therefore, all subsequent spectral analyses were performed separately in the two defined β sub-bands.
Data Normalization
Normalization of computed Lβ and Hβ GPS to the GPS over the total analyzed frequency range (1–60 Hz; GPStotal) was performed as follows: first, the logarithmic transformation used in the analysis of the non-normalized data to obtain near-normally distributed data was inverted, after that, the respective ratio between Lβ (GPSlβ) and Hβ GPS (GPShβ) and the GPStotal were computed, and finally, the logarithmic transformation of the ratio was computed back to obtain the normalized GPS (GPSnormalized). The following formula summarizes the normalization procedure for the Lβ GPS: Lβ GPSnormalized = 10∗log10 [10∗∗(GPSlB/10)/10∗∗(GPStotal/10)].
Beta Power Maxima and Minima Localization
To localize the power maxima on the scalp (i.e., in the sensor space), the horizontal head section was divided into four quadrants in a way that avoided misleading or ambiguous interpretation (adapted from Grabner and De Smedt, 2012). After averaging β power over all electrodes in each quadrant (following the same procedure as for the GPS; see spectral analysis earlier), the computed GPS was named GPSq. The quadrant with the highest power was considered to be the localization of the maximal β GPSq (GPSqmax). The procedure to compute the minimal GPS (GPSqmin) was exactly the same as for the GPSqmax, except that the minimum power was depicted instead of the maximum.
Statistical Analyses
Statistical analyses were performed using the SPSS 24.0 software (IBM SPSS Statistics). All log-transformed EEG data (GPS) were successfully tested for normality (Kolmogorov–Smirnov test and visual inspection of data distribution). Unless otherwise specified, data are expressed as mean (SD). Differences among δ, Lβ, and Hβ frequency bands within groups were assessed using a multivariate analysis of variance. Group differences were evaluated using post-hoc Student’s t-test, and the significance threshold (set at p < 0.05, 95% confidence interval) was corrected for multiple comparisons with the Bonferroni method (αc = 0.017). Correlations were assessed using the Pearson’s r correlation coefficient (two-sided).
Results
General Data
All participants underwent a formal interview and participated in the EEG assessment. However, only 12 patients and 10 controls were retained for the final analysis [mean age 54.4 (8.0) and 56.3 (15.6) years, respectively], as four patients had a DN4 score <4, whereas two controls suffered from low-intensity pain at the time of EEG assessment. Unless otherwise specified, analyses were performed in all CNP patients (n = 12) and/or in all controls (n = 10) as appropriate.
Patients had a DN4 score distributed between 4 and 8 [5.7 (1.3)]. Table 1 gives an overview of pain-causing peripheral neuropathy types and etiologies. The great majority of patients suffered from painful radiculopathy related to spine arthrosis, whereas the few remaining cases had polyneuropathy due to diabetes or suspect of paraneoplastic origin. Most patients also reported other sensory symptoms such as tingling, prickling, hypoesthesia, etc. Less than half of them benefited from nonsurgical treatments alone or in combination (nonsteroidal anti-inflammatory drugs, antidepressants, opiates, or even alternative treatment methods). Table 2 shows additional individual information on pain intensity recorded via the VAS. The level of pain on the day of the EEG recording (VASd) was in general slightly lower than pain intensity perceived on average during the last 2 weeks [VAS2w; respectively, 3.2 (2.1) and 4.2 (1.6)/10; p = 0.05 with a paired t-test]. Answers to question no. 6 of the BPI questionnaire [French version (Poundja et al., 2007)] corresponded exactly to the VASd (Tittle et al., 2003) (R = 0.992, p < 0.001), whereas the level of pain in general (question no. 5 of the BPI questionnaire) was similar to the VAS2w (R = 0.982, p < 0.001), further confirming that the VAS2w represented the intensity of pain perceived by patients in general.
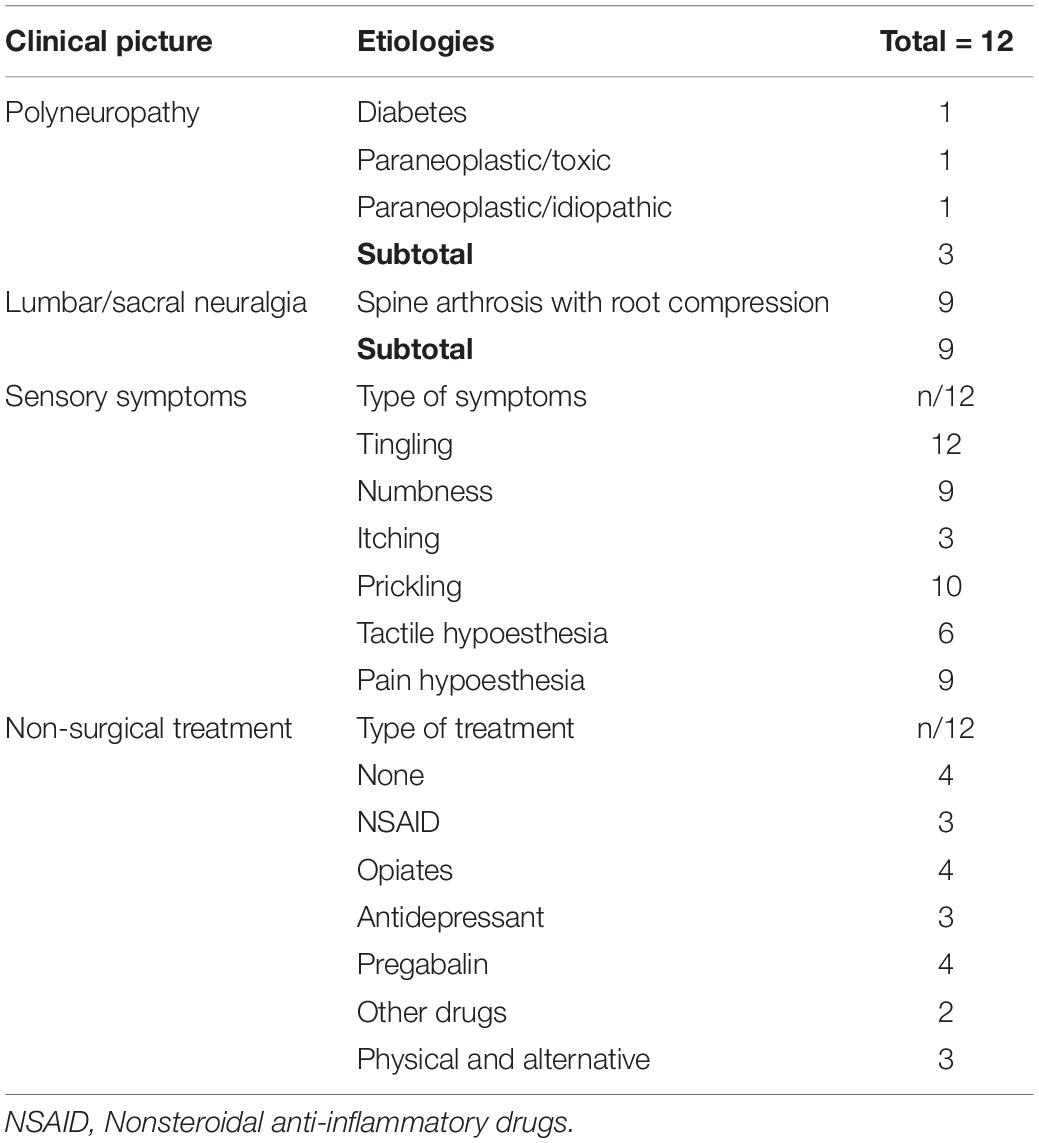
Table 1. Patients’ information concerning pain etiologies, associated sensory symptoms, and analgesic treatment.
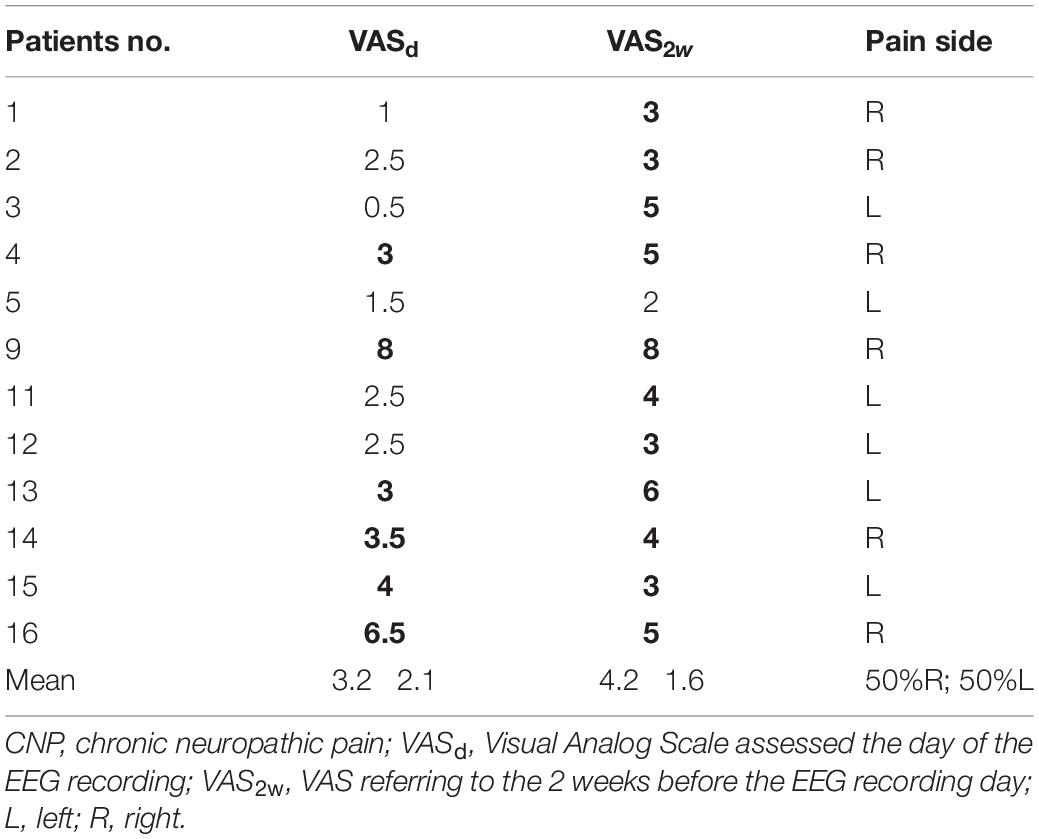
Table 2. Pain intensity scores (significant levels in bold) and predominating pain side in CNP patients.
Spectral Analysis
In all 22 participants, power spectral densities were computed following windowed fast Fourier transforms after appropriate preprocessing (see section “Materials and Methods”). The output of this analysis is shown in one illustrative patient and one control, respectively, in Figures 2A,B. The frequencies of interest are highlighted in gray (δ), red (Lβ), and green (Hβ) colors. In addition to the prominent α peak (see section “Materials and Methods”), the two peaks defining the Lβ and the Hβ frequency sub-bands (von Rotz et al., 2017) (see also the insets of these two figures representing the GPS over the whole frequency spectrum) are visible around 16 and 25 Hz. Lower power in the Lβ and the Hβ domains in patients compared with controls can already be suspected at this stage (inset graph scales are similar).
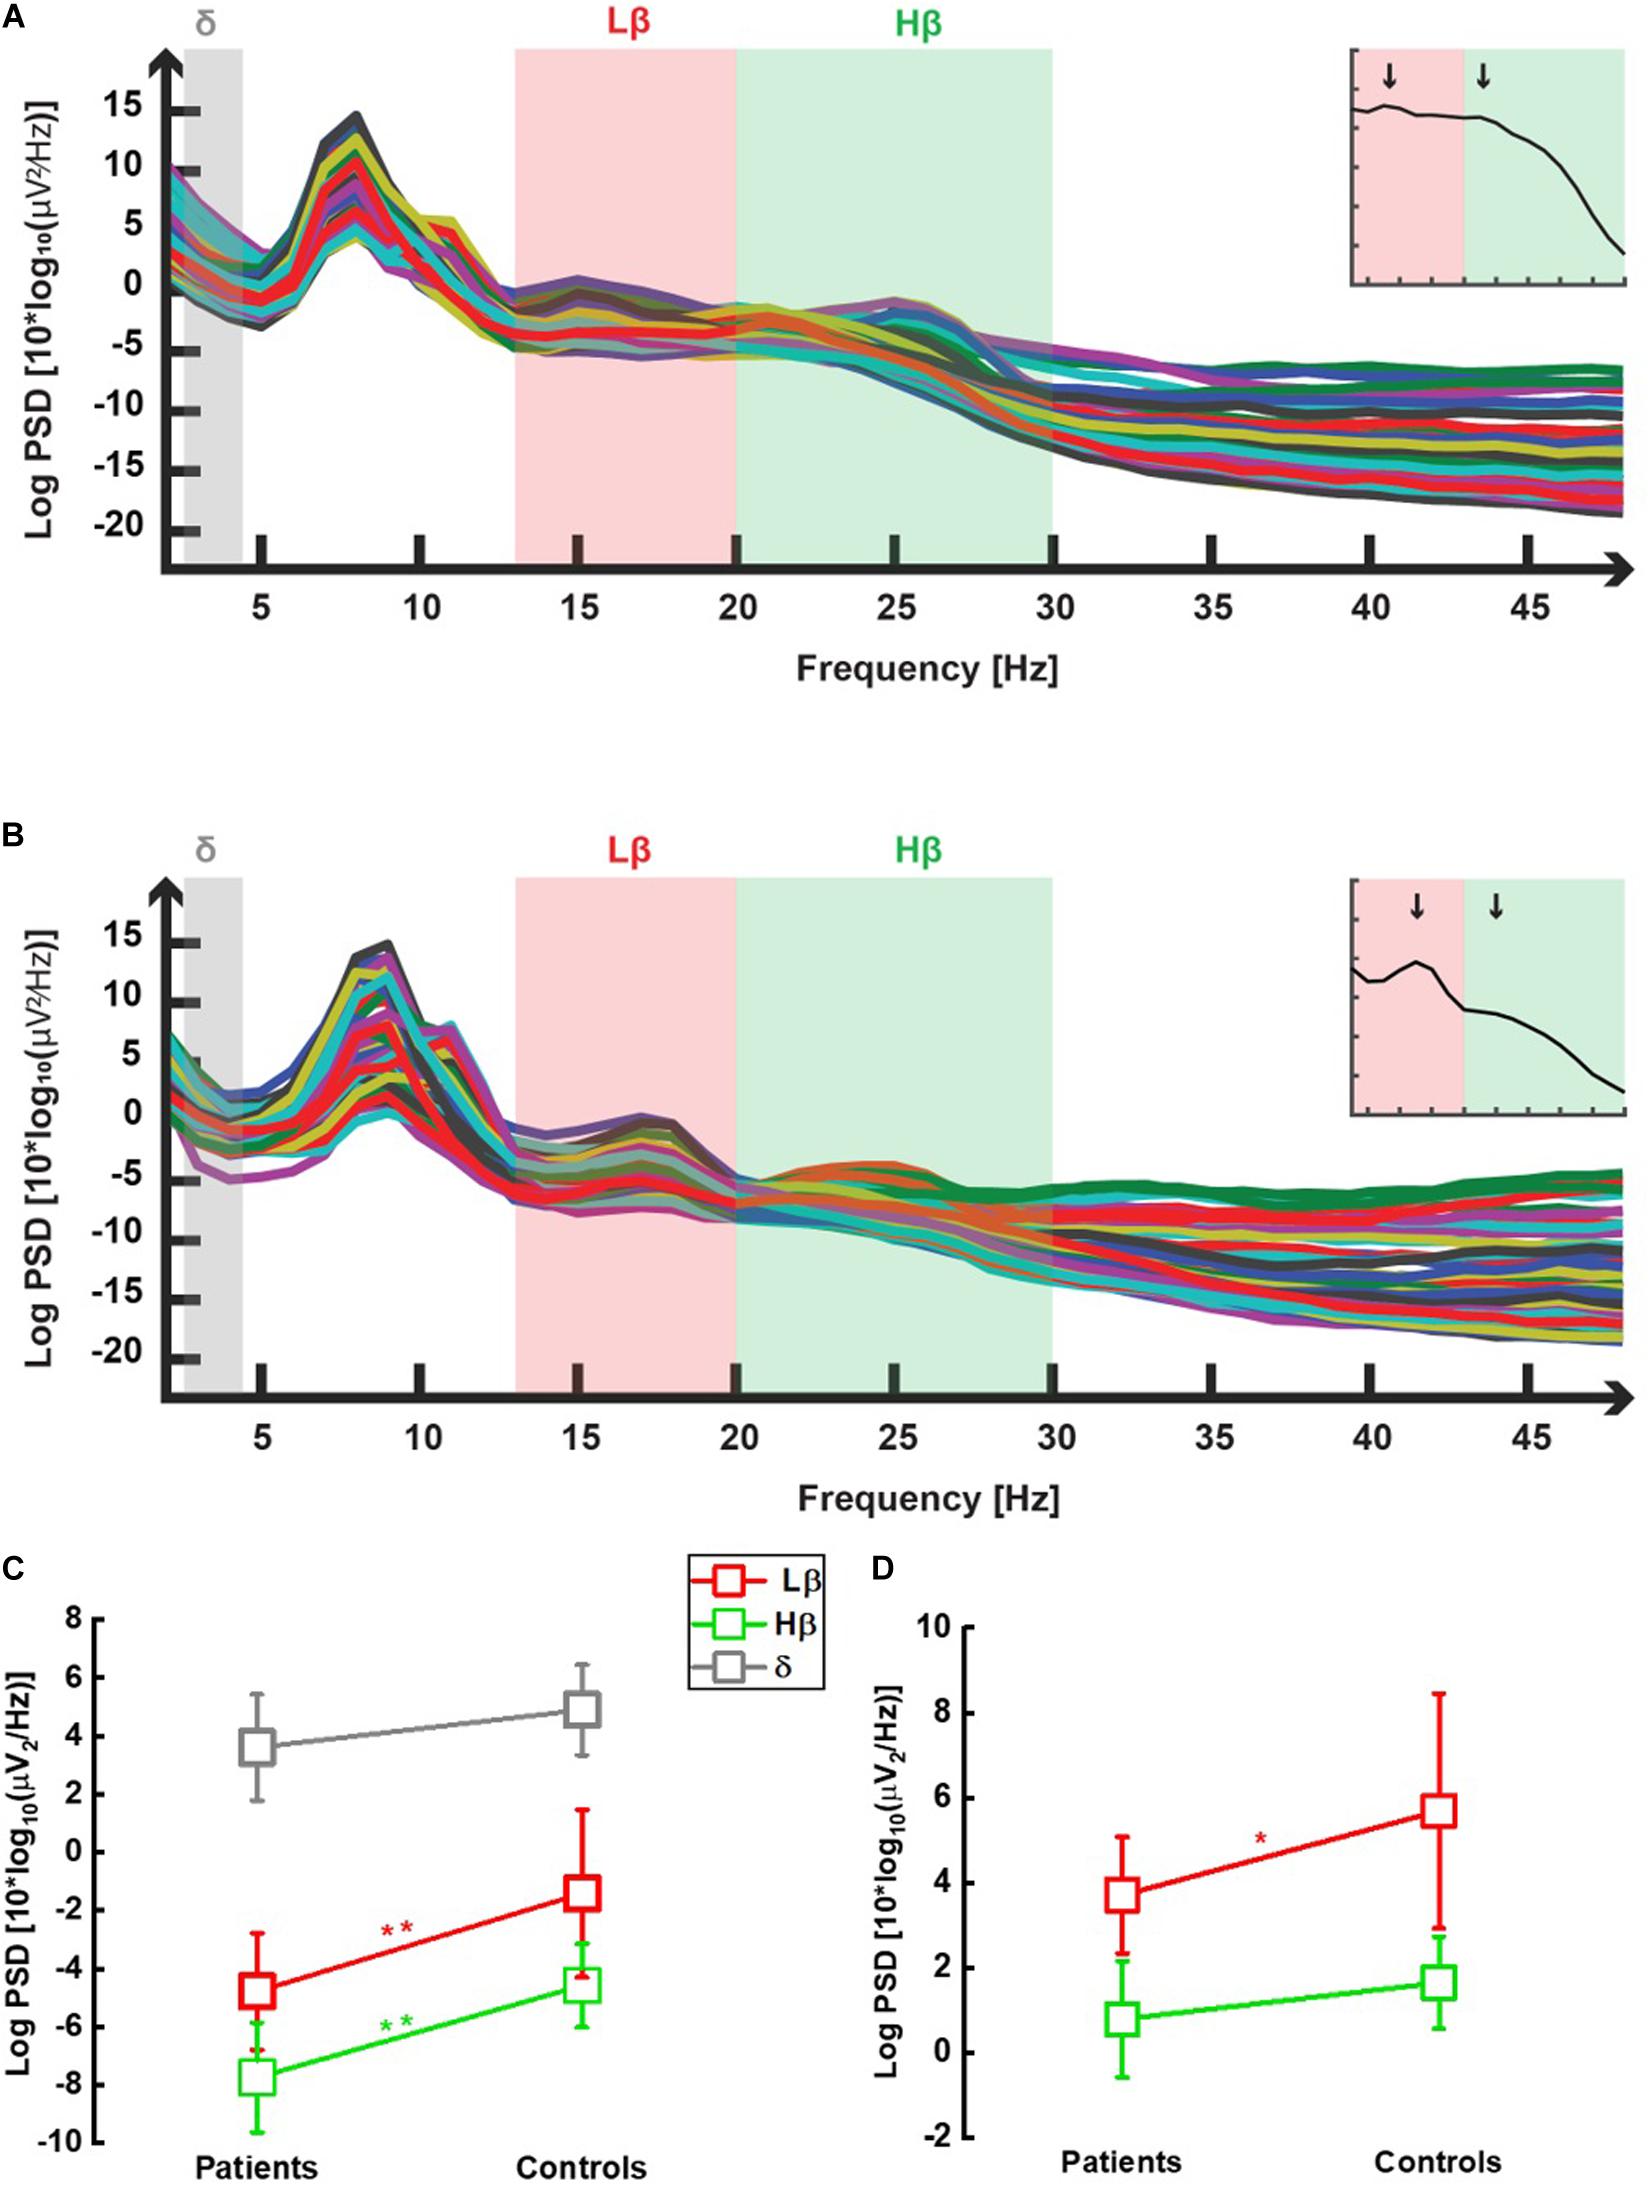
Figure 2. Power spectral densities averaged over all selected epochs in one chronic neuropathic pain patient (A) and in one control (B). In both graphs, power spectral densities obtained in the eye-closed condition, after selection of epochs recorded in wakefulness and 2 s-windowed-Fourier transform between 2 and 48 Hz (see section “Materials and Methods”), were plotted against the whole analyzed frequency spectrum. Each trace represents one channel (i.e., one electrode). One prominent peak is observed as expected, in the α range (8–12 Hz) (cf. eye-closed condition). Two additional peaks were seen within the low β (Lβ; 13–20 Hz, light red color) and high β (Hβ; 20–30 Hz, light green color) sub-bands, both in patients (A) and in controls (B). No peak was observed in the delta (δ; 2–4 Hz, light gray) frequency range. β peaks occurred, respectively, approximately 16 and 25 Hz in most participants, as illustrated by the two vertical black arrows in the two insets showing the GPS computed over all frequencies derived from each main graph, respectively. GPS in the low β (Lβ), high β (Hβ), and δ frequency ranges for chronic neuropathic pain patients and healthy controls. All data are shown as mean (SD). Non-normalized data (C): Patients displayed lower Lβ (13–20 Hz, red open squares) GPS than controls [−4.7 (2.0) dB vs. 1.4 (2.9) dB] in a highly significant manner [t-test: t(20) = −3.226, p = 0.004]. Likewise, the difference between patients’ Hβ (20–30 Hz, green open squares) GPS [−7.7 (1.9) dB] and controls [−5.4 (1.2) dB] was highly significant [t-test: t(20) = −3.271, p = 0.004]. Within the δ (2–4 Hz, gray open squares) range, no significant GPS difference was observed between patients and controls [2.0 (1.7) and 3.4 (1.7) dB, respectively, t(20) = 1.919, p = 0.069]. Normalized data (D): a significant decrease in Lβ (13–20 Hz, red open squares) GPS was noticed in patients compared with controls (GPS values are positive due to computation of ratio between two negative numbers): 3.7 (1.4) dB vs. 5.7 (2.8) dB) [t-test: t(20) = −2.186, p = 0.041]. In the Hβ (20–30 Hz, green open squares) range, the decrease was not anymore significant: 0.8 (1.4) vs. 1.6 (1.1) [t-test: t(20) = −1.610, p = 0.123].
Global Power Spectra in the Lβ and Hβ Sub-Bands, and δ Band
As shown in Figure 2C, both Lβ and Hβ GPS were significantly lower in patients [−4.7 (2.0) and −7.7 (1.9) dB, respectively] than in controls [−1.4 (2.9) and −5.4 (1.2) dB, respectively] (p = 0.004 for both EEG markers). There was a significant effect of frequency [F(2, 40) = 225, 93, p < 0.001] and of group [F(1, 20) = 12.37, p = 0.002] but no interaction [F(2, 40) = 2.41, p = 0.102]. On the contrary, there was no statistical difference in the δ GPS between patients [2.0 (1.7) dB] and healthy participants [3.4 (1.7) dB; p = 0.069] (Figure 2C). The significance threshold (α = 0.05) was corrected to αc0.017 with the Bonferroni method for multiple (n = 3) comparisons.
After normalizing Lβ and Hβ GPS to the GPS over the full range of frequencies band-filtered for data analysis (see section “Materials and Methods” for details), CNP patients still had significantly lower Lβ GPS compared with controls [respectively, 3.7 (1.4) and 5.7 (2.8) dB, p = 0.041], whereas the decrease noticed in the Hβ frequency range lost significance [0.8 (1.4) and 1.6 (1.1) dB, p = 0.123] (Figure 2D).
Power Maxima and Minima Localization
As an attempt to localize the maximal and the minimal β power in the sensor-space, we computed β GPS for the four defined quadrants (GPSq; see section “Materials and Methods” for the detailed procedure) and considered the quadrant holding the maximal GPSq (GPSqmax) and the minimal GPSq (GPSqmin) as the localization of, respectively, the β maximum and minimum. In the Lβ range, most patients (regardless of their predominant pain side) and controls displayed GPSqmax in the posterior, left region (75 and 80%, respectively). The pattern of GPSqmax localization was different in the Hβ range: 58.3% of patients showed the maximal averaged power in the anterior, left quadrant, whereas 70% of controls displayed their GPSqmax within the right hemisphere (equally distributed in anterior and posterior regions). The GPSqmin was variably distributed in controls (Lβ frequency: 70% in the anterior left, 17% in the posterior right; Hβ frequency: 40% in the anterior left and 50% in the posterior right), and in CNP patients [in the Lβ range: 50% in the anterior left quadrant, 33% in the anterior right, and 17% in the posterior right; in the Hβ range: 50% in the posterior right, the rest being equally observed (17%) in the three other quadrants], no relationship being observed with the predominant pain side. Here also, no remarkable difference was observed between patients and controls.
Correlations Between Electroencephalographic Markers and Pain Intensity in Patients
The GPS was clearly lower in patients than in controls, both in the Lβ and in the Hβ frequency ranges. Thus, we expected a negative correlation between the VAS and the GPS for both EEG markers. On the day of the EEG recording, patients had pain levels at the limit of significance (VASd ∼3) (Mantha et al., 1993; Jensen et al., 2003; see Table 2). When relating their VASd to the GPS, no significant correlation was found, neither in the Lβ range (R = −0.453; p = 0.139) nor in the Hβ range (R = −0.349; p = 0.349). Interestingly, when we further discriminated between patients with nonsignificant pain (VASd < 3) and those with significant pain (VASd ≥ 3), no correlation was found in the absence of significant pain (n = 6) (Lβ: R = −0.418; p = 0.409; Hβ: R = 0.253; p = 0.629), whereas in patients with VASd ≥ 3 (n = 6), a strong correlation was now observed both in the Lβ (R = –.931; p = 0.007), while only at the edge of significance in the Hβ range (R = −0.805; p = 0.053). None of the two GABAergic markers was correlated to the VAS2w (Lβ: R = −0.133; p = 0.680; Hβ: R = −0.281; p = 0.376), even when splitting between patients with VAS2w < 3 and VAS2w ≥ 3 (data not shown). The GPS in the δ range did not correlate neither with the VASd (R = −0.385; p = 0.216 for) nor with the VAS2w (R = 0.282; p = 0.375), even when only considering patients with VAS ≥ 3 (data not shown).
Upon normalization, no correlation was anymore observed between Lβ GPS and VASd (R = −0.061, p = 0.851), even when solely evaluated in CNP patients with VASd ≥ 3 (R = −0.118, p = 0.824). There was no correlation between Hβ GPS and VASd (data not shown).
Relation Between Mood and Pain
Because mood interacts with pain (Klyne et al., 2018), participants were administered the HAD questionnaire (see section “Materials and Methods”) (Zigmond and Snaith, 1983; Bjelland et al., 2002). Patients (n = 12) were moderately anxious [HADanx sub-score; 8.9 (3.6)] but not controls [5.3(2.8)] [t(20) = 2.541, p = 0.019], and the depression sub-score was normal in both groups [5.5 (4.3) and 2.2 (1.3), respectively]. Interestingly, the HADanx positively correlated with the VASd in patients (R = 0.755; p = 0.003) most probably due to the subgroup with VASd ≥ 3 (n = 6), which was the only one displaying a significant, positive correlation (R = 0.895; p = 0.016), contrary to the one with VASd < 3 (R = 0.375; p = 0.464). No correlation was found between VAS2w (n = 12) and HADanx (data not shown). Altogether, these observations suggest that anxiety and pain intensity interacted daily but not on average. It was also interesting to assess the impact of pain on mood state. BPI question no. 9b (BPImood) is specifically related to this issue. The BPImood score was highly correlated to HADanx (R = 0.711, p = 0.01). Thus, pain-diseased patients were anxious and had their pain intensity increasing with anxiety level, and the influence of pain on their mood was measurable in the anxiety domain. However, this study was not specifically designed to measure this interaction. It should be noted that no correlation was observed between the HADanx score and all studied EEG markers.
Discussion
In the present pilot study, we recorded β EEG oscillations as an indicator of brain GABAergic activity (Christian et al., 2015) in patients with lower limb CNP of peripheral origin and matched controls, with the hypothesis that the β EEG activity could be a biomarker of CNP. More specifically, given the increased cortical excitation reported in chronic pain situations (see later discussion), we expected the (inhibitory) GABAergic signaling (and hence the β EEG activity) to decrease in patients.
In our analyses, we considered the GPS as a quantitative measurement of β EEG oscillatory activity. The most important result of our study is that, in accordance with our assumptions, the β GPS was significantly lower in patients than in healthy controls both in the Lβ and in the Hβ frequency sub-bands but not in the δ range (analyzed as a negative control). Our results are in accordance with transcranial magnetic stimulation, magnetic resonance spectroscopy, and EEG-based measurements performed in chronic pain patients, which found, respectively, decreased cortical inhibition (Barr et al., 2013), cortical GABA concentrations (Baumgarten et al., 2016), and lower γ oscillations (as GABAergic EEG marker) (Barr et al., 2013) in pain controlling regions. However, some studies reported rather increased β activity in neurogenic pain (Sarnthein et al., 2006). Beyond the heterogeneity of studied populations (i.e., mixed etiologies of neuropathic pain), several methodological issues can be raised: acquired data were down-sampled from 512 to 64 Hz, with a high risk of bias in the final output considering the frequency range of interest; data acquired with eyes closed were pooled together with those recorded in eye-open conditions, which is reported to dramatically modify both the topography and the magnitude of different frequency components (Barry et al., 2007). In addition, the wakefulness state was not segregated from sleepiness or drowsiness in these studies, with the great risk of slowing down the whole EEG recording pattern (Brown et al., 2012). Finally, the β frequency domain was segmented with different cutoffs. Other studies in patients with fibromyalgia, a disease in which mechanisms generating chronic pain are still elusive, reported at the same time increased (Lim et al., 2016), unchanged (Fallon et al., 2018), or decreased (Mhalla et al., 2010) cortical inhibition. Our study was conducted in a homogenous population (patients suffered all from neuropathic pain due to lesions in lower limb peripheral nerves), and data analysis was standardized using validated methods [selection of data recorded only in awaken state (Diaz et al., 2016) and β frequency segmentation (von Rotz et al., 2017)] in accordance with the two peaks observed in EEG data. Thus, the present results can be considered as reliable under the conditions in which the study was performed. The fact that normalization did not vanish the significant decrease adds up to the robustness of this finding. Furthermore, our data fit better with the current understanding of the pathophysiological mechanisms leading to chronic pain, i.e., a decreased brain inhibition underpinned by a deficiency in GABAergic signaling (Parker et al., 2016; Pelletier et al., 2017; Thibaut et al., 2017), which seems to be more specifically associated with neuropathic pain (Schwenkreis et al., 2010; Henderson et al., 2013; Parker et al., 2016).
The Lβ (but not the Hβ or δ) GPS was highly correlated with pain intensity when the latter was significant (Mantha et al., 1993; Collins et al., 1997), reinforcing our working hypothesis. However, the observed correlation disappeared after normalization, as well as significance of Hβ GPS differences between CNP patients and controls, which suggests that there could be a bias related to other differences between these two groups, such as in the GPS computed over the full range of frequencies. Alternatively, considering that there exists no standard among normalization methods that fits all EEG data (Bogaarts et al., 2016), one could not exclude the hypothesis that the discrepancy noticed between non-normalized and normalized data is only the effect of a nonsuitable normalization procedure. On the other hand, the small sample size could itself explain this lack of significant results after normalization. Overall, it seems that interpretation of differences between non-normalized and normalized data is possibly not unique and should be left open for further investigations in larger studies and an adequate normalization procedure clearly determined.
In conclusion, the association between Lβ GPS, supposedly measuring brain GABAergic activity, and pain intensity suggests that Lβ oscillations is a potential CNP biomarker, even if the measured modality of pain is still to be more precisely determined and these preliminary results confirmed in larger investigation settings.
Given the major contribution of GABA to pain regulation, we expected the reduction observed in the GABAergic markers of pain (reflected by the GPSqmin) to be located within the cerebral hemisphere contralateral to the pain side (Barr et al., 2013). To our great surprise, GPSqmin localization was irrespective of patients’ pain side in the Lβ as in the Hβ frequency range. Furthermore, the distribution of both GPSqmin and GPSqmax in Lβ and Hβ seemed to be similar in patients and controls, with comparable lateralization trends in the two groups. This finding would suggest a relationship with nociception rather than with pathological pain. Interestingly, most patients and controls (all right-handed) had their Lβ GPSqmax located in the left and posterior hemisphere. A recent study conducted in healthy right-handed individuals found a positive and linear correlation between the β EEG oscillatory activity and the endogenous concentration of GABA in the somatosensory cortex only in the left hemisphere (Baumgarten et al., 2016). Likewise, chronic pain diseased-patients displayed left-lateralized structural changes in the sensory-motor cortex areas (Baliki et al., 2012) and in the left posterior thalamus (Schmidt-Wilcke et al., 2007) (which has nociceptive projections (Kramer et al., 2017a,b) to the somatosensory cortex (Viaene et al., 2011; Castejon et al., 2016). Thus, it seems that the GABAergic neurotransmission involved in nociception (more specifically measured by Lβ GPS) is lateralized to the dominant handedness hemisphere of both healthy and chronic pain populations, in contradiction with previous data stating bilateral or right-sided pain processing inputs (Coghill et al., 2001; Favilla et al., 2014).
If we consider that Lβ GPS was strongly correlated to pain intensity, we could further assume that Lβ might represent the sensory modality of pain (supposedly measured by the VAS (Boggero and Carlson, 2015). On the other hand, the correlation between Hβ GPS and pain intensity (VASd) was only at the edge of significance, whereas VASd was positively correlated with HADanx. Interestingly, emerging data suggest that Hβ GPS could possibly be related to anxiety and similar mood disorders, pointing out rather an increase of β oscillations in this context (Roohi-Azizi et al., 2017; Ribas et al., 2018). In contrast, our data failed to show that the correlation between Hβ GPS and HADanx. Since HB GPSqmax was mostly located in the anterior quadrants, Hβ GPS could be related to the affective component of pain (Boggero and Carlson, 2015), of which controlling structures are located more anteriorly in the brain (Kuner and Kuner, 2020), thereby making the evoked link with the affective life. However, because the present study was not designed to distinguish between the sensory and the affective components of pain, further investigations are needed to explore more precisely the hypotheses mentioned earlier. Additionally, localization in the sensor space of EEG signals is subject to discussion (Rutkove, 2007), whereas leg representation in the sensory homunculus is close to the midline, making it difficult to reliably determine the lateralization side. More accurate analyses (e.g., source localization) are needed to get more insight into this issue.
Overall, our data suggest a plausible relation between CNP and the GABAergic EEG makers investigated and, more specifically, the Lβ GPS, in accordance with our working hypothesis. The Hβ GPS, less consistently associated with pain, could be related to affective parameters such as anxiety or the affective component of pain. However, we should be cautious in generalizing our conclusions or extrapolating them to other settings given the low number of participants in this study and the differences induced by data normalization. In addition, it is difficult to further specify, at this stage, what is exactly being measured through these EEG markers, knowing that β oscillations have also been associated with other brain functions or pathological situations (Mallet et al., 2008; Mirzaei et al., 2017; Clarke et al., 2018; Mane et al., 2018). On the other hand, one could argue that the found differences and correlations are related in general to sensory symptoms of the patients’ neuropathy and not specific to pain. However, the patients’ neurological examination found only minor sensory deficits unequally distributed among patients. If sensory deficits had played a significant role in these findings, the consistency of data would not be as remarkable as observed. Thus, we think that the data obtained are, on a somatic level, more likely to be related to pain.
Conclusion and Future Directions
The present pilot study aimed at studying the β EEG oscillatory activity as a GABAergic marker indexing chronic pain, having in mind the need for a better and more objective evaluation and mechanistic classification of pain to improve analgesic treatment efficiency.
In line with our main hypothesis, we found that CNP patients had lower EEG Lβ GPS than healthy controls and that Lβ power was negatively correlated to pain intensity. However, when data were normalized to the total GPS, the correlation between Lβ GPS and pain intensity was not found anymore. It also seemed that Lβ-related nociceptive GABAergic neurotransmission could be lateralized in somatosensory brain areas of the handedness-dominant hemisphere, in contradiction with the current knowledge.
These preliminary results, although needing confirmation, open the possibility for an objective evaluation of pain by means of a short (24-min) EEG recording at rest. Furthermore, the marker we studied seems to be solely related to GABAergic signaling (and presumably to GABA cortical concentration). This should therefore open a way to a mechanism-based classification of pain and subsequently toward a more personalized GABA-based analgesic therapy depending on the extent to which the GABAergic signaling is involved.
In the future, it would be interesting to study the same markers in other pain models, assessing the role played by GABA in their underlying mechanisms.
Data Availability Statement
The raw data supporting the conclusions of this article will be made available by the authors, without undue reservation, to any qualified researcher.
Ethics Statement
The studies involving human participants were reviewed and approved by the Commission cantonale d’éthique et de la recherche sur l’être humain-Vaud (CER-VD). The patients/participants provided their written informed consent to participate in this study.
Author Contributions
MT: major contribution to the patients’ recruitment, contribution to the controls’ recruitment, major contribution to the data collection, and manuscript writing and revision. CM: contribution to the study conception and initiation, major participation to the controls’ recruitment, major contribution to the data collection, data interpretation, and data analysis, and contribution to the manuscript writing and revision. CW: major contribution to the data analysis and data interpretation and contribution to the manuscript writing and revision. GM: major participation to the patients’ recruitment and study initiation and contribution to the data discussion. TK: contribution to the study conception and initiation, participation in the patients’ recruitment, manuscript revision, and language editing. DC: major contribution to the manuscript revision and language editing. MM: participation in the data collection, contribution to the data analysis, manuscript writing, and manuscript revision. J-MA: contribution to the data interpretation and significant contribution to the manuscript revision. JC: study conception and initiation, data collection, data analysis, main data interpretation, manuscript writing, and manuscript revision. All authors contributed to the article and approved the submitted version.
Conflict of Interest
The authors declare that the research was conducted in the absence of any commercial or financial relationships that could be construed as a potential conflict of interest.
Funding
This work was supported by the Quadrimed Medical Congress (www.quadrimed.ch) and the University of Fribourg (Fonds de recherche du Centenaire; project nos. 666, 2017 and 714, 2018).
Acknowledgments
We are thankful to Patricia Zangger for her contribution to the early phase of the study implementation and patient recruitment, to Lucas Spierer for the discussion on study design and results, and to Stefan Goetz for his meaningful remarks on the potential clinical impact of the results.
Abbreviations
α, Alpha; BPI, Brief pain inventory; BPImood, Brief pain inventory score related to the mood (question n ° 9b); CNP, Chronic neuropathic pain; δ, Delta; dB, Decibel; DN4, Douleurs neuropathique 4 questions; EEG, Electroencephalogram/Electroencephalography/Electroencephalographic; γ, Gamma; GABA, Gamma-aminobutyric acid; GPS, Global power spectrum; GPSq, Global power spectrum of a scalp quadrant; GPSqmax, the highest power of the Global power spectrum in a scalp quadrant; GPSqmin, the lowest power of the global power spectrum in a scalp quadrant; HAD, Hospital anxiety and depression; HADanx, Hospital anxiety and depression subscore for anxiety; Hβ, High beta; Hz, Hertz; Lβ, Low beta; θ, Theta; TMS, Transcranial magnetic stimulation; VAS, Visual analog scale; VASd, Visual analog scale recorded the same day as the electroencephalogram; VAS2w, Visual analog scale of the last 2 weeks before electroencephalogram.
References
Archibald, J., Warner, F. M., Ortiz, O., Todd, M., and Jutzeler, C. R. (2018). Recent advances in objectifying pain using neuroimaging techniques. J. Neurophysiol. 120, 387–390. doi: 10.1152/jn.00171.2018
Baliki, M. N., Mansour, A. R., Baria, A. T., and Apkarian, A. V. (2014). Functional reorganization of the default mode network across chronic pain conditions. PLoS One 9:e106133. doi: 10.1371/journal.pone.0106133
Baliki, M. N., Petre, B., Torbey, S., Herrmann, K. M., Huang, L., Schnitzer, T. J., et al. (2012). Corticostriatal functional connectivity predicts transition to chronic back pain. Nat. Neurosci. 15, 1117–1119. doi: 10.1038/nn.3153
Barr, M. S., Farzan, F., Davis, K. D., Fitzgerald, P. B., and Daskalakis, Z. J. (2013). Measuring GABAergic inhibitory activity with TMS-EEG and its potential clinical application for chronic pain. J. Neuroimmune Pharmacol. 8, 535–546. doi: 10.1007/s11481-012-9383-y
Barry, R. J., Clarke, A. R., Johnstone, S. J., Magee, C. A., and Rushby, J. A. (2007). EEG differences between eyes-closed and eyes-open resting conditions. Clin. Neurophysiol. 118, 2765–2773. doi: 10.1016/j.clinph.2007.07.028
Baumgarten, T. J., Oeltzschner, G., Hoogenboom, N., Wittsack, H. J., Schnitzler, A., and Lange, J. (2016). Beta peak frequencies at rest correlate with endogenous GABA+/Cr concentrations in sensorimotor cortex areas. PLoS One 11:e0156829. doi: 10.1371/journal.pone.0156829
Bennett, M. I., Attal, N., Backonja, M. M., Baron, R., Bouhassira, D., Freynhagen, R., et al. (2007). Using screening tools to identify neuropathic pain. Pain 127, 199–203. doi: 10.1016/j.pain.2006.10.034
Bigdely-Shamlo, N., Mullen, T., Kothe, C., Su, K.-M., and Robbins, K. (2015). The PREP pipeline: standardized preprocessing for large scale EEG analysis. Front. Neuroinform. 9:16. doi: 10.3389/fninf.2015.00016
Bjelland, I., Dahl, A. A., Haug, T. T., and Neckelmann, D. (2002). The validity of the hospital anxiety and depression scale. An updated literature review. J. Psychosom. Res. 52, 69–77.
Bogaarts, J. G., Gommer, E. D., Hilkman, D. M. W., van Kranen-Mastenbroek, V. H. J. M., and Reulen, J. P. H. (2016). Optimal training dataset composition for SVM-based, age-independent, automated epileptic seizure detection. Med. Biol. Eng. Comp. 54, 1285–1293. doi: 10.1007/s11517-016-1468-y
Boggero, I. A., and Carlson, C. R. (2015). Somatosensory and affective contributions to emotional, social, and daily functioning in chronic pain patients. Pain Med. 16, 341–347. doi: 10.1111/pme.12598
Bouhassira, D., Attal, N., Alchaar, H., Boureau, F., Brochet, B., Bruxelle, J., et al. (2005). Comparison of pain syndromes associated with nervous or somatic lesions and development of a new neuropathic pain diagnostic questionnaire (DN4). Pain 114, 29–36. doi: 10.1016/j.pain.2004.12.010
Brown, R. E., Basheer, R., McKenna, J. T., Strecker, R. E., and McCarley, R. W. (2012). Control of sleep and wakefulness. Physiol. Rev. 92, 1087–1187. doi: 10.1152/physrev.00032.2011
Bushnell, M. C., Ceko, M., and Low, L. A. (2013). Cognitive and emotional control of pain and its disruption in chronic pain. Nat. Rev. Neurosci. 14, 502–511. doi: 10.1038/nrn3516
Castejon, C., Barros-Zulaica, N., and Nunez, A. (2016). Control of somatosensory cortical processing by thalamic posterior medial nucleus: a new role of thalamus in cortical function. PLoS One 11:e0148169. doi: 10.1371/journal.pone.0148169
Chang, C., Hsu, S., Pion-Tonashini, L., and Jung, T. (2018). Evaluation of artifact subspace reconstruction for automatic EEG artifact removal. Conf. Proc. Annu. Int. Conf. IEEE Eng. Med. Biol. Soc. 2018, 1242–1245.
Christian, E., Snyder, D., Song, W., Gurley, D., Smolka, J., Maier, D., et al. (2015). EEG-b/g spectral power elevation in rat: a translatable biomarker elicited by GABA(Aa2/3)-positive allosteric modulators at nonsedating anxiolytic doses. J. Neurophysiol. 113, 116–131. doi: 10.1152/jn.00539.2013
Clarke, A., Roberts, B. M., and Ranganath, C. (2018). Neural oscillations during conditional associative learning. Neuroimage 174, 485–493. doi: 10.1016/j.neuroimage.2018.03.053
Cleeland, C. S., and Ryan, K. M. (1994). Pain assessment: global use of the Brief Pain Inventory. Ann. Acad. Med. Singapore 23, 129–138.
Coghill, R. C., Gilron, I., and Iadarola, M. J. (2001). Hemispheric lateralization of somatosensory processing. J. Neurophysiol. 85, 2602–2612. doi: 10.1152/jn.2001.85.6.2602
Collins, S. L., Moore, R. A., and McQuay, H. J. (1997). The visual analogue pain intensity scale: what is moderate pain in millimetres? Pain 72, 95–97. doi: 10.1016/s0304-3959(97)00005-5
Delorme, A., and Makeig, S. (2004). EEGLAB: an open source toolbox for analysis of single-trial EEG dynamics including independent component analysis. J. Neurosci. Methods 134, 9–21. doi: 10.1016/j.jneumeth.2003.10.009
Diaz, B. A., Hardstone, R., Mansvelder, H. D., Van Someren, E. J., and Linkenkaer-Hansen, K. (2016). Resting-state subjective experience and EEG biomarkers are associated with sleep-onset latency. Front. Psychol. 7:492. doi: 10.3389/fpsyg.2016.00492
Enna, S. J., and McCarson, K. E. (2006). The role of GABA in the mediation and perception of pain. Adv. Pharmacol. 54, 1–27. doi: 10.1016/s1054-3589(06)54001-3
Fallon, N., Chiu, Y., Nurmikko, T., and Stancak, A. (2018). Altered theta oscillations in resting EEG of fibromyalgia syndrome patients. Eur. J. Pain 22, 49–57. doi: 10.1002/ejp.1076
Favilla, S., Huber, A., Pagnoni, G., Lui, F., Facchin, P., Cocchi, M., et al. (2014). Ranking brain areas encoding the perceived level of pain from fMRI data. Neuroimage 90, 153–162. doi: 10.1016/j.neuroimage.2014.01.001
Fine, P. G. (2011). Long-term consequences of chronic pain: mounting evidence for pain as a neurological disease and parallels with other chronic disease states. Pain Med. 12, 996–1004. doi: 10.1111/j.1526-4637.2011.01187.x
Gaetz, W., Edgar, J. C., Wang, D. J., and Roberts, T. P. (2011). Relating MEG measured motor cortical oscillations to resting gamma-aminobutyric acid (GABA) concentration. Neuroimage 55, 616–621. doi: 10.1016/j.neuroimage.2010.12.077
Gasser, T., Bacher, P., and Mocks, J. (1982). Transformations towards the normal distribution of broad band spectral parameters of the EEG. Electroencephalogr. Clin. Neurophysiol. 53, 119–124. doi: 10.1016/0013-4694(82)90112-2
Grabner, R. H., and De Smedt, B. (2012). Oscillatory EEG correlates of arithmetic strategies: a training study. Front. Psychol. 3:428. doi: 10.3389/fpsyg.2012.00428
Haefeli, M., and Elfering, A. (2006). Pain assessment. Eur. Spine J. 15(Suppl. 1) S17–S24. doi: 10.1007/s00586-005-1044-x
Harris, R. E., and Clauw, D. J. (2012). Imaging central neurochemical alterations in chronic pain with proton magnetic resonance spectroscopy. Neurosci. Lett. 520, 192–196. doi: 10.1016/j.neulet.2012.03.042
Hawker, G. A., Mian, S., Kendzerska, T., and French, M. (2011). Measures of adult pain: visual Analog Scale for Pain (VAS Pain), Numeric Rating Scale for Pain (NRS Pain), McGill Pain Questionnaire (MPQ), Short-Form McGill Pain Questionnaire (SF-MPQ), Chronic Pain Grade Scale (CPGS), Short Form-36 Bodily Pain Scale (SF-36 BPS), and Measure of Intermittent and Constant Osteoarthritis Pain (ICOAP). Arthritis Care Res. 63(Suppl. 11) S240–S252. doi: 10.1002/acr.20543
Henderson, L. A., Peck, C. C., Petersen, E. T., Rae, C. D., Youssef, A. M., Reeves, J. M., et al. (2013). Chronic pain: lost inhibition? J. Neurosci. 33, 7574–7582. doi: 10.1523/JNEUROSCI.0174-13.2013
Jensen, M. P., Chen, C., and Brugger, A. M. (2003). Interpretation of visual analog scale ratings and change scores: a reanalysis of two clinical trials of postoperative pain. J. Pain 4, 407–414. doi: 10.1016/s1526-5900(03)00716-8
Kerns, R. D., Turk, D. C., and Rudy, T. E. (1985). The west haven-yale multidimensional pain inventory (WHYMPI). Pain 23, 345–356. doi: 10.1016/0304-3959(85)90004-1
Klyne, D. M., Moseley, G. L., Sterling, M., Barbe, M. F., and Hodges, P. W. (2018). Individual variation in pain sensitivity and conditioned pain modulation in acute low back pain: effect of stimulus type, sleep, and psychological and lifestyle factors. J. Pain 19, e1–e18. doi: 10.1016/j.jpain.2018.02.017
Kramer, P. R., Stinson, C., Umorin, M., Deng, M., Rao, M., Bellinger, L. L., et al. (2017a). Lateral thalamic control of nociceptive response after whisker pad injection of varicella zoster virus. Neuroscience 356, 207–216. doi: 10.1016/j.neuroscience.2017.05.030
Kramer, P. R., Strand, J., Stinson, C., Bellinger, L. L., Kinchington, P. R., Yee, M. B., et al. (2017b). Role for the ventral posterior medial/posterior lateral thalamus and anterior cingulate cortex in affective/motivation pain induced by varicella zoster virus. Front. Integr. Neurosci. 11:27. doi: 10.3389/fnint.2017.00027
Kuner, R., and Kuner, T. (2020). Cellular circuits in the brain and their modulation in acute and chronic pain. Physiol. Rev. 101, 213–258. doi: 10.1152/physrev.00040.2019
Lim, M., Kim, J. S., Kim, D. J., and Chung, C. K. (2016). Increased low- and high-frequency oscillatory activity in the prefrontal cortex of fibromyalgia patients. Front. Hum. Neurosci. 10:111. doi: 10.3389/fnhum.2016.00111
Mallet, N., Pogosyan, A., Marton, L. F., Bolam, J. P., Brown, P., and Magill, P. J. (2008). Parkinsonian beta oscillations in the external globus pallidus and their relationship with subthalamic nucleus activity. J. Neurosci. 28, 14245–14258. doi: 10.1523/JNEUROSCI.4199-08.2008
Mane, R., Chew, E., Phua, K. S., Ang, K. K., Vinod, A. P., and Guan, C. (2018). Quantitative EEG as biomarkers for the monitoring of post-stroke motor recovery in BCI and tDCS rehabilitation. Annu. Int. Conf. IEEE Eng. Med. Biol. Soc. 2018, 3610–3613. doi: 10.1109/EMBC.2018.8512920
Mantha, S., Thisted, R., Foss, J., Ellis, J. E., and Roizen, M. F. (1993). A proposal to use confidence intervals for visual analog scale data for pain measurement to determine clinical significance. Anesthesia Anal. 77, 1041–1047.
Mhalla, A., de Andrade, D. C., Baudic, S., Perrot, S., and Bouhassira, D. (2010). Alteration of cortical excitability in patients with fibromyalgia. Pain 149, 495–500. doi: 10.1016/j.pain.2010.03.009
Mirzaei, A., Kumar, A., Leventhal, D., Mallet, N., Aertsen, A., Berke, J., et al. (2017). Sensorimotor processing in the basal ganglia leads to transient beta oscillations during behavior. J. Neurosci. 37, 11220–11232. doi: 10.1523/JNEUROSCI.1289-17.2017
Mullen, T. (2012). NITRC: CleanLine: Tool/Resource Info. Available online at: http://www.nitrc.org/projects/cleanline (accessed July 16, 2019).
Omachi, T. A. (2011). Measures of sleep in rheumatologic diseases: epworth sleepiness scale (ESS), functional outcome of sleep questionnaire (FOSQ), insomnia severity index (ISI), and pittsburgh sleep quality index (PSQI). Arthritis Care Res. 63(Suppl. 11) S287–S296. doi: 10.1002/acr.20544
Ossipov, M. H., Dussor, G. O., and Porreca, F. (2010). Central modulation of pain. J. Clin. Invest. 120, 3779–3787. doi: 10.1172/JCI43766
Parker, R. S., Lewis, G. N., Rice, D. A., and McNair, P. J. (2016). Is motor cortical excitability altered in people with chronic pain? A systematic review and meta-analysis. Brain Stimul. 9, 488–500. doi: 10.1016/j.brs.2016.03.020
Pelletier, R., Higgins, J., and Bourbonnais, D. (2017). The relationship of corticospinal excitability with pain, motor performance and disability in subjects with chronic wrist/hand pain. J. Electromyogr. Kinesiol. 34, 65–71. doi: 10.1016/j.jelekin.2017.04.002
Pinheiro, E. S., de Queiros, F. C., Montoya, P., Santos, C. L., do Nascimento, M. A., Ito, C. H., et al. (2016). Electroencephalographic patterns in chronic pain: a systematic review of the literature. PLoS One 11:e0149085. doi: 10.1371/journal.pone.0149085
Poundja, J., Fikretoglu, D., Guay, S., and Brunet, A. (2007). Validation of the French version of the brief pain inventory in Canadian veterans suffering from traumatic stress. J. Pain Symptom Manag. 33, 720–726. doi: 10.1016/j.jpainsymman.2006.09.031
Premoli, I., Castellanos, N., Rivolta, D., Belardinelli, P., Bajo, R., Zipser, C., et al. (2014). TMS-EEG signatures of GABAergic neurotransmission in the human cortex. J. Neurosci. 34, 5603–5612. doi: 10.1523/JNEUROSCI.5089-13.2014
Ribas, V. R., Ribas, R. G., Nóbrega, J. d. A., Nóbrega, M. V. d., Espécie, J. A. d. A., Calafange, M. T., et al. (2018). Pattern of anxiety, insecurity, fear, panic and/or phobia observed by quantitative electroencephalography (QEEG). Dement. Neuropsychol. 12, 264–271. doi: 10.1590/1980-57642018dn12-030007
Roohi-Azizi, M., Azimi, L., Heysieattalab, S., and Aamidfar, M. (2017). Changes of the brain’s bioelectrical activity in cognition, consciousness, and some mental disorders. Med. J. Islamic Republic Iran 31:53. doi: 10.14196/mjiri.31.53
Rutkove, S. B. (2007). “Introduction to volume conduction,” in The Clinical Neurophysiology Primer, eds A. S. a. R. Blum and B. Seward (New York, NY: Humana Press), 43–53. doi: 10.1007/978-1-59745-271-7_4
Sarnthein, J., Stern, J., Aufenberg, C., Rousson, V., and Jeanmonod, D. (2006). Increased EEG power and slowed dominant frequency in patients with neurogenic pain. Brain 129(Pt 1), 55–64. doi: 10.1093/brain/awh631
Schaible, H. (2007). Peripheral and central mechanisms of pain generation. Handbook Exp. Pharmacol. 177, 3–28. doi: 10.1007/978-3-540-33823-9_1
Schmidt-Wilcke, T., Luerding, R., Weigand, T., Jurgens, T., Schuierer, G., Leinisch, E., et al. (2007). Striatal grey matter increase in patients suffering from fibromyalgia–a voxel-based morphometry study. Pain 132(Suppl. 1) S109–S116. doi: 10.1016/j.pain.2007.05.010
Schwenkreis, P., Scherens, A., Ronnau, A. K., Hoffken, O., Tegenthoff, M., and Maier, C. (2010). Cortical disinhibition occurs in chronic neuropathic, but not in chronic nociceptive pain. BMC Neurosci. 11:73. doi: 10.1186/1471-2202-11-73
Shi, Q. L., Mendoza, T. R., Dueck, A. C., Ma, H. J., Zhang, J., Qian, Y., et al. (2017). Determination of mild, moderate, and severe pain interference in patients with cancer. Pain 158, 1108–1112. doi: 10.1097/j.pain.0000000000000890
Strian, F., Lautenbacher, S., Galfe, G., and Holzl, R. (1989). Diurnal variations in pain perception and thermal sensitivity. Pain 36, 125–131. doi: 10.1016/0304-3959(89)90120-6
Tan, G., Jensen, M. P., Thornby, J. I., and Shanti, B. F. (2004). Validation of the Brief Pain Inventory for chronic nonmalignant pain. J. Pain 5, 133–137. doi: 10.1016/j.jpain.2003.12.005
Thibaut, A., Zeng, D., Caumo, W., Liu, J., and Fregni, F. (2017). Corticospinal excitability as a biomarker of myofascial pain syndrome. Pain Reports 2:e594. doi: 10.1097/PR9.0000000000000594
Tittle, M. B., McMillan, S. C., and Hagan, S. (2003). Validating the brief pain inventory for use with surgical patients with cancer. Oncol. Nurs. Forum 30, 325–330. doi: 10.1188/03.ONF.325-330
Treede, R. D., Rief, W., Barke, A., Aziz, Q., Bennett, M. I., Benoliel, R., et al. (2015). A classification of chronic pain for ICD-11. Pain 156, 1003–1007. doi: 10.1097/j.pain.0000000000000160
Vargas-Schaffer, G. (2010). Is the WHO analgesic ladder still valid? Twenty-four years of experience. Can. Fam. Phys. 56, e202–e205.
Viaene, A. N., Petrof, I., and Sherman, S. M. (2011). Properties of the thalamic projection from the posterior medial nucleus to primary and secondary somatosensory cortices in the mouse. Proc. Natl. Acad. Sci. U.S.A. 108, 18156–18161. doi: 10.1073/pnas.1114828108
von Rotz, R., Kometer, M., Dornbierer, D., Gertsch, J., Gachet, M., Vollenweider, F., et al. (2017). Neurornal oscillations and synchronicity associated with gamma-hydroxybutyrate during resting-state in healthy male volunteers. Psychopharmacology 234, 1957–1968. doi: 10.1007/s00213-017-4603-z
Winkler, I., Debener, S., Müller, K.-R., and Tangermann, M. (2015). On the influence of high-pass filtering on ICA-based artifact reduction in EEG-ERP. Annu. Int. Conf. IEEE Eng. Med. Biol. Soc. 2015, 4101–4105.
Keywords: neuropathic pain, chronic pain, EEG, GABA, Beta oscillation, biomarker
Citation: Teixeira M, Mancini C, Wicht CA, Maestretti G, Kuntzer T, Cazzoli D, Mouthon M, Annoni J-M and Chabwine JN (2021) Beta Electroencephalographic Oscillation Is a Potential GABAergic Biomarker of Chronic Peripheral Neuropathic Pain. Front. Neurosci. 15:594536. doi: 10.3389/fnins.2021.594536
Received: 13 August 2020; Accepted: 25 January 2021;
Published: 26 February 2021.
Edited by:
Jiuquan Zhang, Chongqing University, ChinaReviewed by:
Lu Zhang, Georgia Institute of Technology, United StatesJean-Pascal Lefaucheur, Independent Researcher, Créteil, France
Copyright © 2021 Teixeira, Mancini, Wicht, Maestretti, Kuntzer, Cazzoli, Mouthon, Annoni and Chabwine. This is an open-access article distributed under the terms of the Creative Commons Attribution License (CC BY). The use, distribution or reproduction in other forums is permitted, provided the original author(s) and the copyright owner(s) are credited and that the original publication in this journal is cited, in accordance with accepted academic practice. No use, distribution or reproduction is permitted which does not comply with these terms.
*Correspondence: Joelle Nsimire Chabwine, am9lbGxlLmNoYWJ3aW5lQHVuaWZyLmNo
†These authors have contributed equally to this work