
94% of researchers rate our articles as excellent or good
Learn more about the work of our research integrity team to safeguard the quality of each article we publish.
Find out more
ORIGINAL RESEARCH article
Front. Neurosci., 18 March 2021
Sec. Brain Imaging Methods
Volume 15 - 2021 | https://doi.org/10.3389/fnins.2021.593723
This article is part of the Research TopicCommunity Series in Advanced PET, SPECT, MR and Optical Imaging in Clinical and Pre-Clinical Research of Neuropsychiatric Disorders - Volume IView all 24 articles
 Yang Li1,2,3†
 Kaijun Liu4†
 Chang Li2
 Yu Guo2
 Jingqin Fang2
 Haipeng Tong2
 Yi Tang1
 Junfeng Zhang2
 Jinju Sun1
 Fangyang Jiao1Qianhui Zhang5Rongbing Jin1,6*Kunlin Xiong2,6*
 Xiao Chen1,6*
A majority of blast-induced mild traumatic brain injury (mTBI) patients experience persistent neurological dysfunction with no findings on conventional structural MR imaging. It is urgent to develop advanced imaging modalities to detect and understand the pathophysiology of blast-induced mTBI. Fluorine-18 fluorodeoxyglucose positron emission tomography (18F-FDG PET) could detect neuronal function and activity of the injured brain, while MR spectroscopy provides complementary information and assesses metabolic irregularities following injury. This study aims to investigate the effectiveness of combining 18F-FDG PET with MR spectroscopy to evaluate acute and subacute metabolic cerebral alterations caused by blast-induced mTBI. Thirty-two adult male Sprague–Dawley rats were exposed to a single blast (mTBI group) and 32 rats were not exposed to the blast (sham group), followed by 18F-FDG PET, MRI, and histological evaluation at baseline, 1–3 h, 1 day, and 7 days post-injury in three separate cohorts. 18F-FDG uptake showed a transient increase in the amygdala and somatosensory cortex, followed by a gradual return to baseline from day 1 to 7 days post-injury and a continuous rise in the motor cortex. In contrast, decreased 18F-FDG uptake was seen in the midbrain structures (inferior and superior colliculus). Analysis of MR spectroscopy showed that inflammation marker myo-inositol (Ins), oxidative stress marker glutamine + glutamate (Glx), and hypoxia marker lactate (Lac) levels markedly elevated over time in the somatosensory cortex, while the major osmolyte taurine (Tau) level immediately increased at 1–3 h and 1 day, and then returned to sham level on 7 days post-injury, which could be due to the disruption of the blood–brain barrier. Increased 18F-FDG uptake and elevated Ins and Glx levels over time were confirmed by histology analysis which showed increased microglial activation and gliosis in the frontal cortex. These results suggest that 18F-FDG PET and MR spectroscopy can be used together to reflect more comprehensive neuropathological alterations in vivo, which could improve our understanding of the complex alterations in the brain after blast-induced mTBI.
Blast-induced traumatic brain injury (TBI), the most common injury of modern warfare, has been receiving great interest worldwide recently (Benzinger et al., 2009). The nature of modern warfare and the frequent use of improvised explosive devices (IEDs) have led to increases in mild TBI (mTBI), which is defined as loss of consciousness lasting less than 30 min, an initial Glasgow Coma Score (GCS) of 13–15, and posttraumatic amnesia lasting less than 24 h (Bailes and Cantu, 2001; Belanger et al., 2007). Even though the acute symptoms of mTBI may be mild and transient, experimental and clinical studies have found metabolic, biochemical, and structural changes caused by mTBI. Mild TBI causes a complex pathophysiological cascade, including dramatic alterations in ionic homeostasis (Katayama et al., 1991), disruption of the blood–brain barrier (BBB) (Walls et al., 2016; Kuriakose et al., 2018), injury-induced neuroinflammation (Kokiko-Cochran and Godbout, 2018; Missault et al., 2019), and diffuse axonal injury (Ling et al., 2012; Venkatasubramanian et al., 2020). However, majority of mTBI patients experience neurological dysfunction with no findings on conventional clinical imaging methods, such as structural magnetic resonance imaging (MRI) or computed tomography (CT) (Le and Gean, 2009). Due to the difficulty of imaging assessment on mTBI patients, especially in the acute or subacute phase, there needs more emphasis on the development of advanced imaging modalities, so that the therapeutic management of mTBI patients can be improved.
Several advanced in vivo imaging techniques have been used to investigate TBI to better understand the temporal microstructural and functional changes following TBI, such as diffusion tensor imaging (DTI), functional MRI (fMRI), MR spectroscopy (MRS), positron emission tomography (PET), etc. (Croall et al., 2014; Zhuo et al., 2015; Harris et al., 2016; Jaiswal et al., 2019; Kulkarni et al., 2019; Venkatasubramanian et al., 2020). DTI has been widely used to investigate the microstructural responses after mTBI. Many different regions have been found to be affected, since DTI is highly sensitive to axonal damage related to mTBI (Mayer et al., 2010; Tang et al., 2017; Badea et al., 2018; Venkatasubramanian et al., 2020). In contrast to the structural information offered by DTI regarding brain integrity, some studies have explored functional and biochemical changes following brain injury using other imaging modalities. Fluorine-18 fluorodeoxyglucose PET (18F-FDG PET) is a powerful imaging technique that can map regional cerebral metabolism patterns in vivo. Cerebral glucose metabolism significantly associates with neuronal function and activity of the injured brain (Garnett et al., 2001; Casey et al., 2008). Clinical and animal studies have shown that changes in glucose metabolism of the brain in hours to days following exposure to blast injury have been more complex than the chronic hypometabolism using 18F-FDG PET (Stocker et al., 2014; Awwad et al., 2015; Meabon et al., 2016; Jaiswal et al., 2019). PET imaging provides exquisite sensitivity when compared with CT or MR imaging, but with reduced resolution. In vivo MRS provides complementary information and assesses metabolic irregularities following injury. Metabolites such as N-acetylaspartate (NAA), choline (Cho), and lactate (Lac), glutamate and glutamine (Glx), myo-inositol (Ins), and taurine (Tau) detected by 1H MRS provide information related to brain injury, inflammation, ischemia, and mitochondrial dysfunction (Xu et al., 2011; Harris J.L. et al., 2012; Sajja et al., 2012; Zhuo et al., 2015). 18F-FDG PET and MRS could be used to investigate the neuropathological changes after brain injury from different aspects. However, it is currently unclear if 18F-FDG PET could be used synergistically with MRS to elucidate the acute pathological alterations in the brain and improve diagnostic and prognostic measures after blast-induced mTBI.
In this study, we aim to evaluate hyperacute, acute, and subacute metabolic cerebral alterations caused by blast-induced mTBI in rats via the combination of in vivo MRS and 18F-FDG PET. Animals were exposed to a single blast overpressure wave, underwent MRS and 18F-FDG PET, and sacrificed for histological analysis at baseline, 1–3 h post-injury (hyperacute phase), 1 day post-injury (acute phase), and 7 days post-injury (subacute phase). Combining these two imaging methods could reflect more comprehensive neuropathological alterations in vivo after blast-induced mTBI.
Sixty-four adult male Sprague–Dawley rats (obtained from the Experimental Animal Center of Daping Hospital, Chongqing, China) weighing 200∼225 g were randomly assigned into two groups, namely the mTBI group (n = 32) and the sham group (n = 32). Throughout the experiment, rats were kept in a temperature- and humidity-controlled room under a 12-h light/12-h dark cycle with food and water except during 18F-FDG uptake. All animal procedures used in this study were approved by the Administration of Affairs Concerning Experimental Animals Guideline of Army Medical University. The use of laboratory animals was in compliance with the guidelines of National Institutes of Health. All animal experiments were approved by the Animal Use Subcommittee of Army Medical University.
Figure 1A shows the experimental scheme for animals in this study. The study contained three cohorts of adult male Sprague–Dawley rats. The first cohort received blast-induced mTBI (n = 6) or sham (n = 6) and underwent PET/CT scans with 18F-FDG prior to injury and at 1–3 h, 1 day, and 7 days post-injury. The second cohort received blast-induced mTBI (n = 6) or sham (n = 6) and underwent MRI scans including conventional structure imaging and MRS prior to injury and at 1–3 h, 1 day, and 7 days post-injury. The last cohort received blast-induced mTBI (n = 20) or sham (n = 20) and were sacrificed for Evans blue penetration assay and immunohistochemical analysis prior to injury and at 1–3 h, 1 day, and 7 days post-injury.
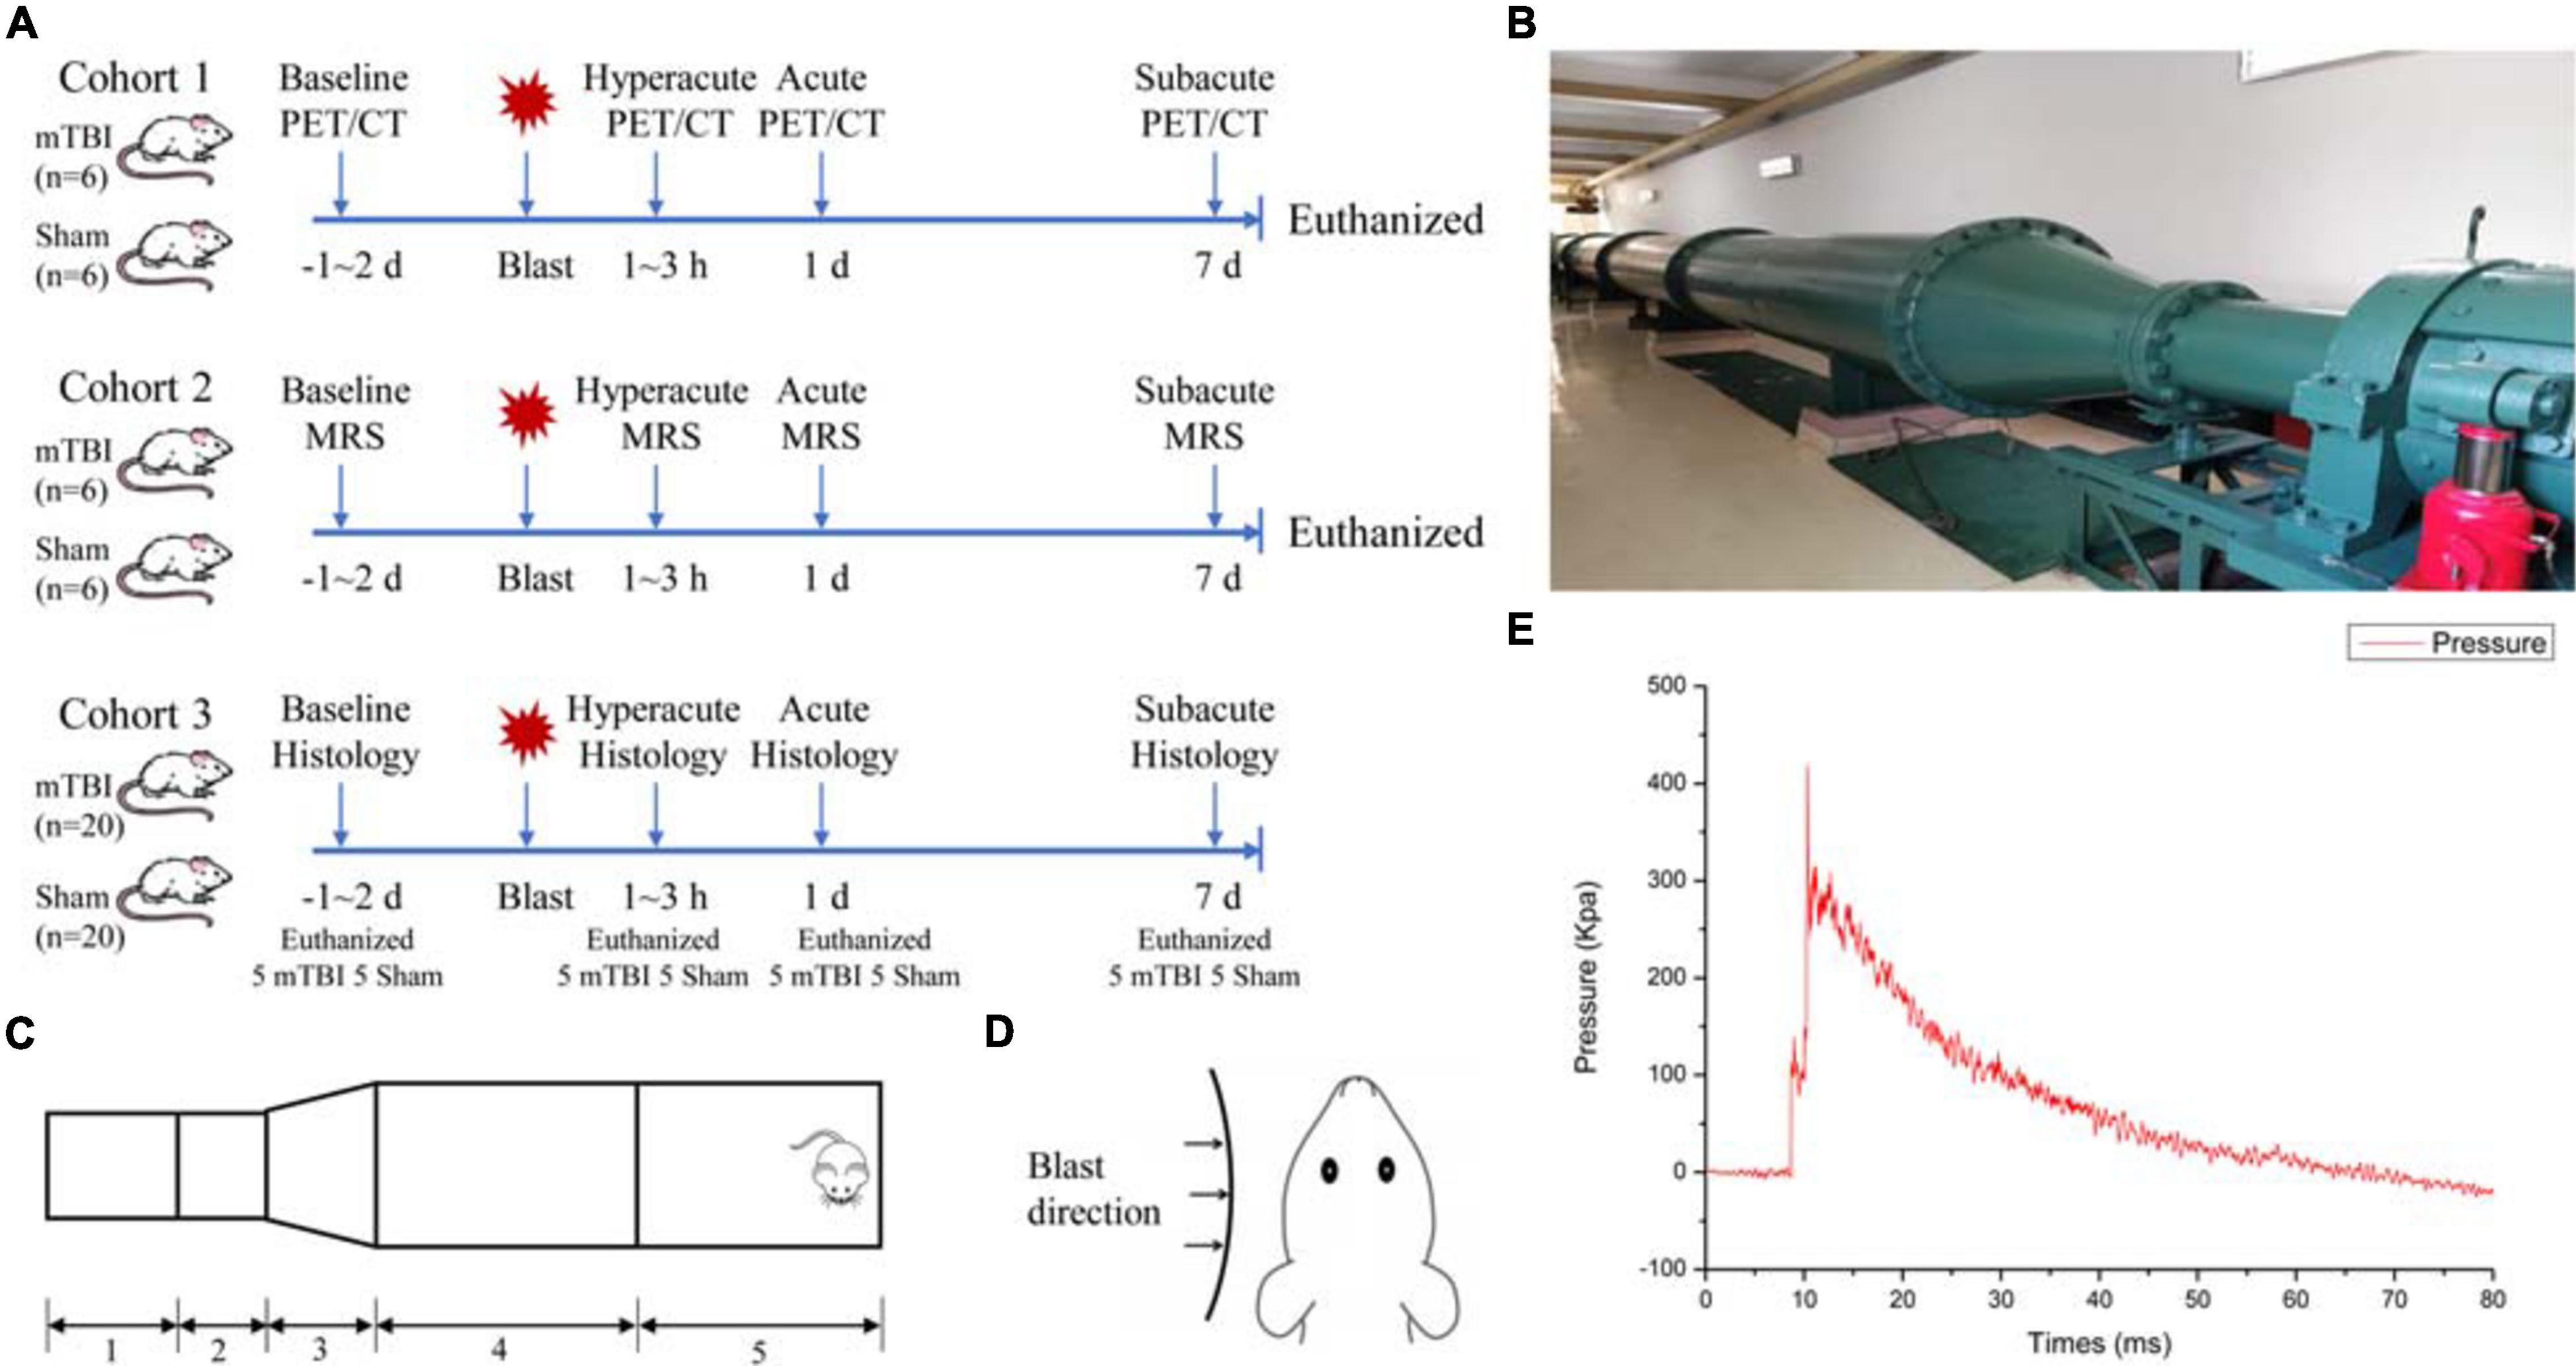
Figure 1. Schematic drawing of the experimental protocol and bio-shock tubes (BST-I). (A) Overall experimental scheme for blast-induced mild traumatic brain injury (mTBI) and sham rats. (B) The diagram of the BST-I shock tube. (C) BST-I model: (1) driving section, (2) double-clamping diaphragm section, (3) conical section, (4) transition section, and (5) test section. (D) Blast was directed to the left side of all rats. (E) Representative blast waves from a single blast illustrating peak pressure values of 139.146 and 364.86 kPa, lasting 48.41 ms.
The bio-shock tube (BST-I) apparatus (Figures 1B,C) was used to produce blast injury as previously described (Ning et al., 2019). All rats were anesthetized in an induction chamber with 4–5% isoflurane in 100% oxygen for approximately 5 min. Then, the anesthetized rats in the mTBI group were placed into individual cages (one rat/cage) in the prone position with the left side facing the direction of the membrane during blast (Figure 1D). All cages were positioned at the same vertical plane to ensure equal pressure exposure and to prevent subsequent secondary or tertiary blast injuries. The BST-I apparatus generated two levels of lower-intensity blast waves. The values for the peak overpressure were 139.146 and 364.86 kPa, lasting 48.41 ms (Figure 1E). Following the blast, the rats were removed from the apparatus and placed in a supine position in a cage. Sham rats went through the same procedure of anesthesia and were placed in the BST-I apparatus without being exposed to the blast waves. The righting reflex time was recorded for both mTBI and sham rats.
Rats were food-deprived 4∼6 h before 18F-FDG injection. 18F-FDG was injected intravenously via the tail vein to both mTBI and sham rats with the dose of 37 MBq/rat. After 40 min of uptake, static PET scan was performed for 30 min in list mode (350∼650 keV, 2.56 ns) using a small animal micro PET/CT scanner (Pingseng, Jiangsu, China). A three-bed CT scan was acquired in rat mode (60 kVp, 500 μA, exposure time 320 ms) following PET scans for anatomical localization, attenuation, and scatter corrections. The CT image matrix was 352 × 352 × 536 with a voxel size of 0.23 × 0.23 × 0.23 mm. The parameters for reconstruction were as follows: reconstruction algorithm = 3D-OSEM/MAP with 2 OSEM iterations and 18 MAP iterations; scatter, attenuation, and decay corrections applied; requested resolution = 0.5 mm; image matrix = 256 × 256 × 159; and voxel size = 0.39 × 0.39 × 0.80 mm. The intrinsic resolution of the PET scanner was approximately 1.4 mm full width at half maximum (FWHM) at the center of the field of view.
Processing and analysis of 18F-FDG PET data was performed using PMOD software version 3.6 (PMOD Technologies, Ltd., Zurich, Switzerland) as previously described (Park et al., 2019). For volume of interest (VOI) analysis, the PET data were registered to the 58 regions in the W. Schiffer rat brain template and atlas by PMOD (Supplementary Table 1). The standard uptake value (SUV) in defined subregions of the rat brain was automatically applied to measure. This study evaluated 58 brain regions and the entire atlas was used for whole brain normalization as previously reported (Byrnes et al., 2014). The regional SUVw was calculated by dividing the standardized 18F-FDG uptake value for the individual target region by that for the whole brain.
MR imaging experiments were conducted before and at 1–3 h, 1 day, and 7 days after blast in the mTBI and sham groups. All MR imaging experiments were performed with 7 T animal scanner (Biospin70/20 USR, Bruker BioSpin, Ettlingen, Germany) equipped with a four-channel rat head transmitter/receiver coil. Rats were initially anesthetized in a box with 5% isoflurane in oxygen, then anesthesia was maintained by 2% isoflurane in oxygen during MR scanning. The respiration and heart rate were monitored throughout the experiment. Scanning sequences included T1-weighted imaging (Turbo-RARE, echo time/repetition time: 6.5 ms/800 ms, field of view: 30 × 30 mm, matrix: 256 × 256, slice thickness: 1 mm), T2-weighted imaging (Turbo-RARE, echo time/repetition time: 30 ms/3,000 ms, field of view: 30 × 30 mm, matrix: 256 × 256, slice thickness: 1 mm), and MRS (STEAM, echo time/repetition time: 3 ms/3.5 ms, a single 2 × 2 × 2 mm3 voxel was located in the left somatosensory cortex region based on T2-weighted images). The MRS voxels were localized in the somatosensory cortex and hippocampus region of the rat brain. These regions were chosen because they were implicated in previous studies using other TBI models (Larson et al., 2011; Sajja et al., 2012; Awwad et al., 2015; Brabazon et al., 2017; Salberg et al., 2017; Tang et al., 2017). MRS data were analyzed by jMRUI software 5.2, and the method of parameterization implemented in jMRUI software was applied: advanced method for accurate, robust, and efficient spectral fitting (AMARES). The AMARES algorithm estimates the area under each peak based on the frequency and half-width of each peak (Vanhamme et al., 1997), and the relative levels of Ins, Tau, Cho, Glx, Glu, NAA, and Lac to creatine (Cr) were assessed. The Cr spectral intensity was used as reference as previously reported for relative quantitation because of its relatively stable concentration in the brain (Xu et al., 2011).
The permeability of the BBB was determined by measuring the penetration of Evans blue (Solarbio, Beijing, China) in the brain tissues of three rats in each group at each time point. Evans blue (2% in saline; 4 ml/kg body weight) was injected intravenously via the tail vein 1 h before measurement. The anesthetized rats were perfused transcardially with saline before sampling. Photos of the brains were taken with a digital camera. Each sample was weighed and homogenized with 400 μl PBS, then precipitated by 60% trichloroacetic acid overnight. The sample was centrifuged for 30 min at 10,000 rpm. Absorption of the supernatant was measured at a wavelength of 620 nm with a plate reader. The extravasation of Evans blue was quantified as microgram/gram brain tissue with an Evans blue standardized curve.
For histological analysis of brain tissue, two rats in each group at each time point were euthanized, then perfused with 4% paraformaldehyde followed by saline. The entire brain was collected and fixed in 4% paraformaldehyde. After being fixed for over 48 h, the brain tissues were embedded in paraffin. Brain tissue was sectioned at 20 μm. Hematoxylin/eosin (H&E) staining on paraffin sections was histologically reviewed. For immunochemistry, Vectastain Elite ABC Kit (Vector Laboratories, Burlingame, CA, United States) and DAB Peroxidase Substrate Kit (Vector Laboratories, Burlingame, CA, United States) were used with primary antibodies, namely anti-rat Iba1 (ab178846, Abcam, Cambridge, MA, United States), anti-rat GFAP (ab7260, Abcam, Cambridge, MA, United States), and anti-rat NeuN (ab177487, Abcam, Cambridge, MA, United States), followed by biotinylated goat anti-rabbit and anti-mouse IgG that were used as secondary antibodies (Vector Laboratories, Burlingame, CA, United States). Images were then collected with an Olympus BX43 microscope (Olympus America, Center Valley, PA, United States). We examined entire sections at × 40 magnification to identify “hot spot” regions of protein expression within the frontal cortex and hippocampus, from which five hot spots were selected for imaging. Immunoreactivity of these proteins was evaluated using the mean optical density (IOD/area) of protein expressions at × 200 magnification field by Image-Pro Plus 6.0 (Media Cybernetics, Rockville, MD, United States).
All data are presented as mean ± standard deviation (SD). For the PET, MRS, and immunohistochemical data, two-way analysis of variance (ANOVA) with repeated measures was used to analyze alterations in 18F-FDG uptake, various neurometabolites, Evans blue, and immunohistochemical index (IOD/area values) over time. Individual comparisons at each time point or different groups were conducted with Sidak’s multiple comparisons test. All statistical analyses were performed using GraphPad Prism 8 (GraphPad Software, San Diego, CA, United States). Two-tailed p values were calculated with the significance level at 0.05.
All rats survived the blast, without observable skull fracture and apnea. Both sham and mTBI groups had similar righting reflex time, with the average time of 296.2 ± 35.4 s for the sham group and 325.7 ± 40.2 s for the mTBI group. There were no significant differences in size and weight between these two groups at any time points after the blast. Moreover, rats in neither group showed any visible sign of injury in the brain on T1- and T2-weighted images at any time points after the blast (Supplementary Figure 1).
Among 58 brain regions, 10 VOIs were found significantly changed between sham and mTBI rats in 18F-FDG uptake from baseline to day 7, including the bilateral amygdala (F1,5 = 4.137, p = 0.0253), somatosensory cortex (F1,5 = 13.43, p = 0.0145), motor cortex (F1,5 = 7.479, p = 0.0410), colliculus inferior (F1,5 = 38.77, p = 0.0016), and colliculus superior (F1,5 = 16.82, p = 0.0093) (Figure 2B and Supplementary Table 2). As shown in Supplementary Table 2, the changes of 18F-FDG uptake in bilateral VOIs were similar, so that we combined SUVw of the left and right VOIs as SUVw average to be compared at different time points. At 1–3 h post-injury, the amygdala (+ 5.97%, p = 0.0103) and somatosensory cortex (+ 6.82%, p = 0.0245) presented increased 18F-FDG uptake in the mTBI group, compared with the sham group. Subsequently, 18F-FDG uptake in the amygdala and somatosensory cortex gradually returned to baseline from 1 to 7 days post-injury in the mTBI group, with a significant difference in somatosensory cortex by 1 day (+ 6.12%, p = 0.0429) compared with the sham group (Figures 2A,C,D). 18F-FDG uptake in the motor cortex increased in the mTBI group from 1 day (+ 3.60%, p = 0.0326) to 7 days post-injury (+ 3.41%, p = 0.0446) (Figures 2A,E). However, at 1–3 h post-injury, decreased 18F-FDG uptake was observed in two midbrain structures, i.e., the inferior colliculus (-17.21%, p < 0.0001) and superior colliculus (-6.75%, p = 0.0094). Then, 18F-FDG uptake in the superior colliculus and inferior colliculus gradually returned to baseline from 1 to 7 days post-injury in the mTBI group, with a significant difference in the inferior colliculus by 1 day (-12.43%, p < 0.0001) and 7 days (-7.68%, p = 0.0049) and in the superior colliculus by 1 day (-5.95%, p = 0.0230) compared with the sham group (Figures 2A,F,G).
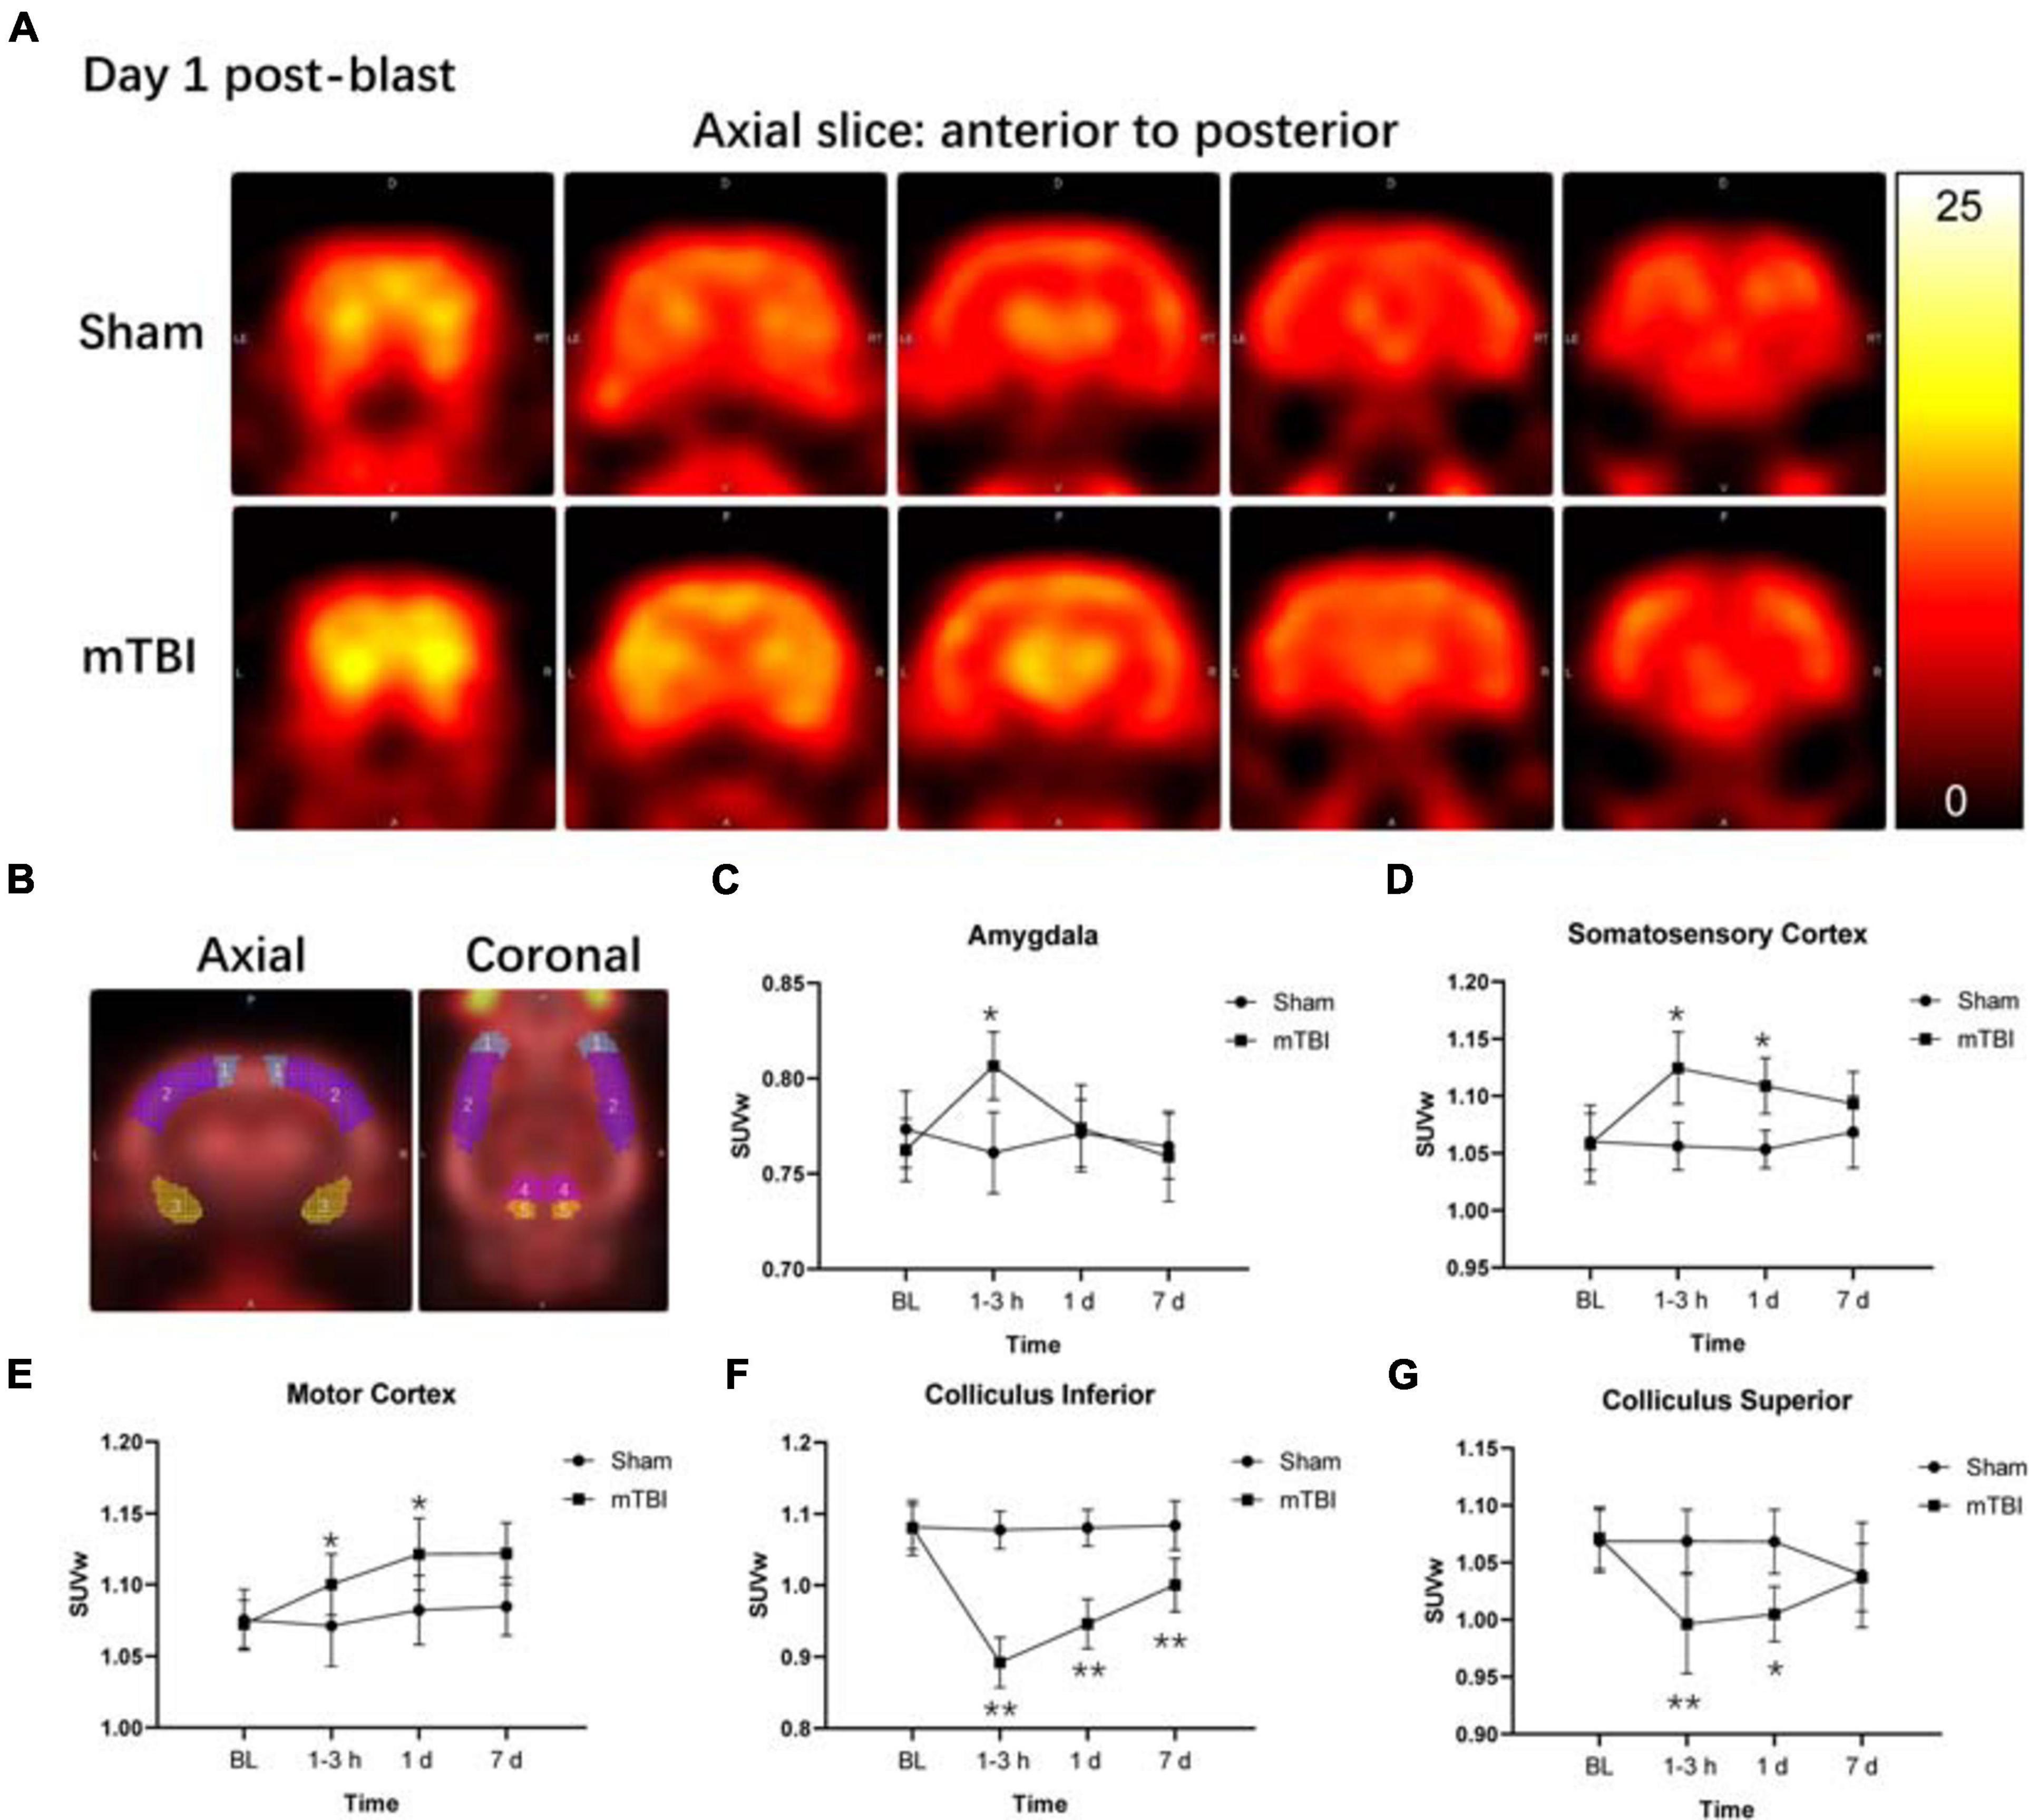
Figure 2. Fluorine-18 fluorodeoxyglucose positron emission tomography (18F-FDG PET) reveals both increased and decreased brain metabolism in multiple regions after blast-induced mTBI. (A) Representative axial 18F-FDG PET images in the brain from anterior to posterior (left to right) of a sham (up) and a blast (bottom) rat on day 1 post-blast. In the corresponding PET images, yellow and black represent relative higher and lower values, respectively. (B) Volume-based analysis of 18F-FDG uptake showing five regions with significant changes between sham and mTBI rats: (1) motor cortex, (2) somatosensory cortex, (3) amygdala, (4) colliculus superior, and (5) colliculus inferior. (C–G) Box plots show 18F-FDG uptake at 1–3 h, 1 day, and 7 days post-injury in these five regions of mTBI and sham rats. Box and whisker plots display median, first and third quartiles, minimum, and maximum. **p < 0.01 vs. the sham group; *p < 0.05 vs. the sham group.
The MRS voxel was placed to the somatosensory cortex (Figure 3A) and hippocampus (Supplementary Figure 2A) of rat brain. High-quality spectra with narrow linewidths were generally obtained in this study (Figure 3B and Supplementary Figure 2B). For the somatosensory cortex, MRS revealed relative levels of glia marker Ins (F1,5 = 54.49, p = 0.0007), oxidative stress and gliosis marker Glx (F1,5 = 31.38, p = 0.0025), and hypoxic indicator Lac markedly elevated as early as 1–3 h and day 1 post-injury, together with day 7 (Figures 3C–E). The major osmolyte, the relative level of Tau (F1,5 = 21.90, p = 0.0054), immediately increased as early as 1–3 h (+ 160.37%, p < 0.0001), continuously elevated by 1 day (+ 276.48%, p < 0.0001), but decreased to sham level on 7 days post-injury (+ 11.92%, p = 0.9444) (Figure 3F). The mTBI group showed a significant increased relative level of Cho on 7 days post-injury, compared with the sham group (+ 24.04%, p = 0.0366) (Figure 3G). No significant reduction in the relative level of NAA was found in the mTBI group, compared with the sham group at each time point (F1,5 = 0.9721, p = 0.3694) (Figure 3H). However, no significant differences of these metabolites, namely Ins (F1,5 = 3.218, p = 0.1328), Glx (F1,5 = 2.068, p = 0.2099), Lac (F1,5 = 1.860, p = 0.2308), Tau (F1,5 = 0.03899, p = 0.8512), Cho (F1,5 = 1.628, p = 0.2580), and NAA (F1,5 = 0.7159, p = 0.4361), were observed in the hippocampus between the mTBI group and the sham group (Supplementary Figures 2C–H).
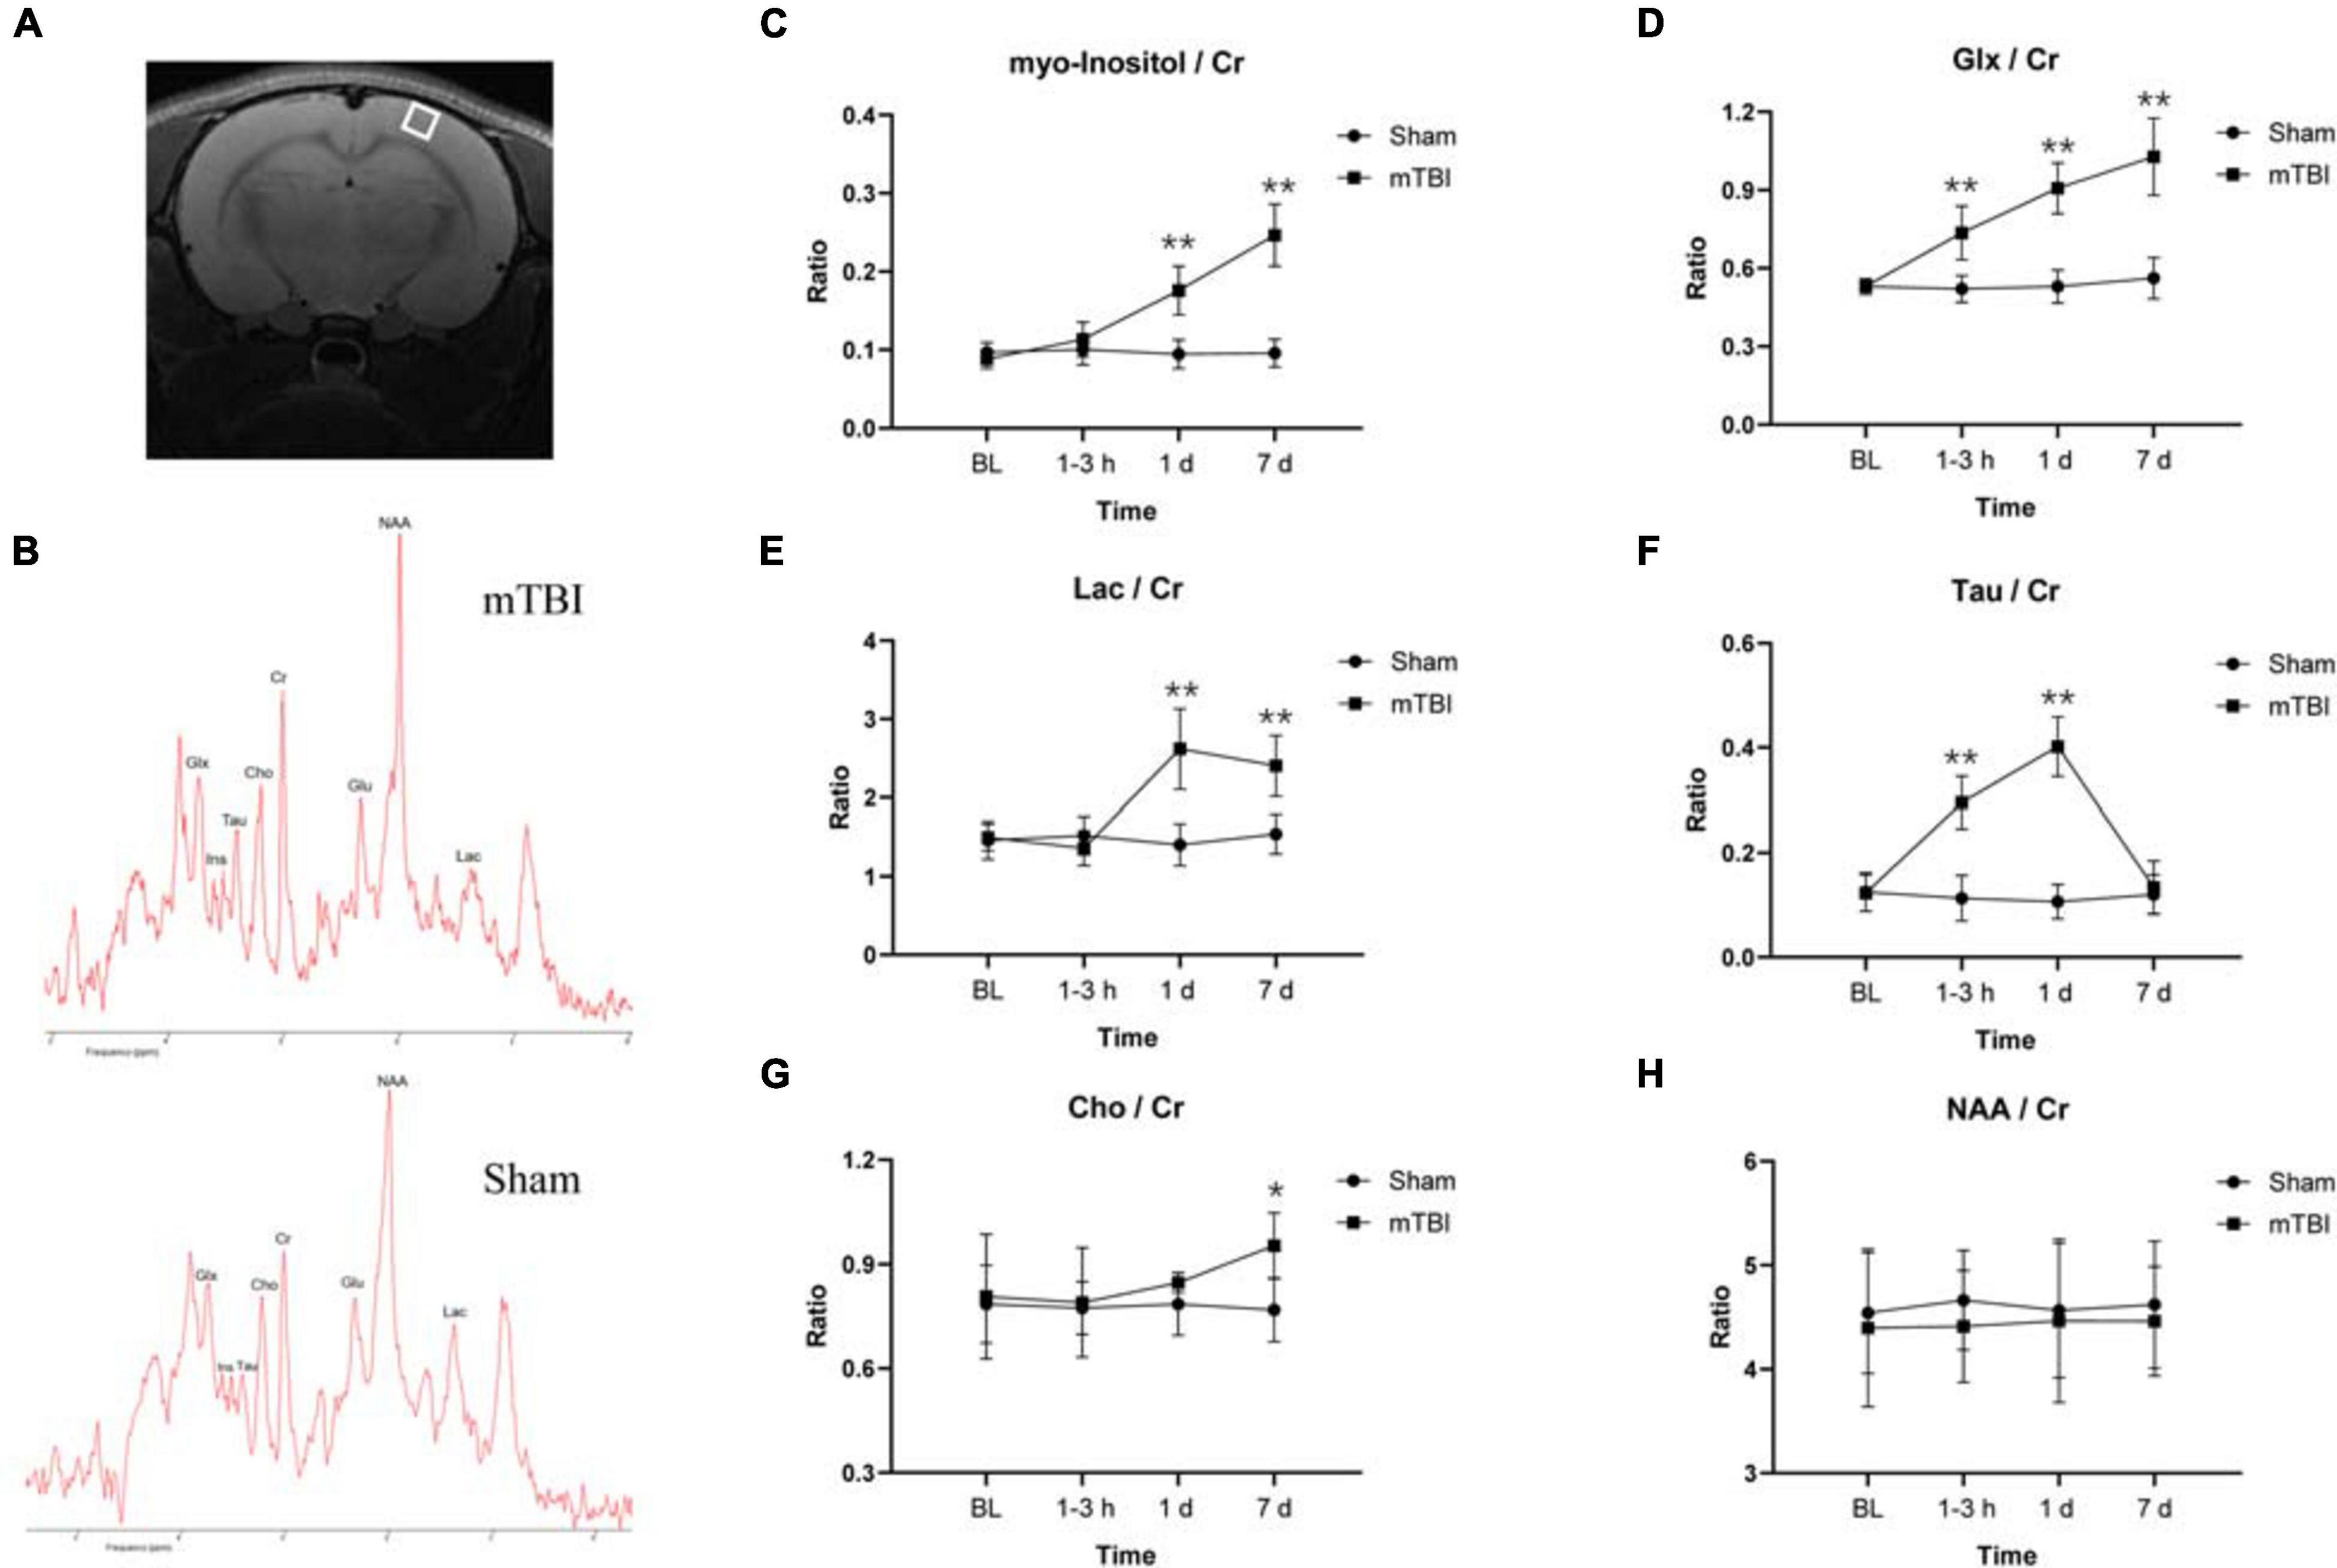
Figure 3. Magnetic resonance spectroscopy (MRS) detects in vivo dynamic neurochemical alterations in the somatosensory cortex region after blast-induced mTBI. Placement of voxel in the somatosensory cortex region [white box (A)] with a representative spectrum (up: mTBI 1–3 h post-injury; bottom: sham) (B). (C–H) Box plots show the relative levels of Ins, Glx, Lac, Tau, Cho, and NAA at 1–3 h, 1 day, and 7 days post-injury in somatosensory cortex of mTBI and sham rats. Box and whisker plots display median, first and third quartiles, minimum, and maximum. **p < 0.01 vs. the sham group; *p < 0.05 vs. the sham group. Ins, myo-inositol; Tau, taurine; Cho, choline; Glx, glutamine + glutamate; Glu, glutamate; NAA, N-acetylaspartate; Lac, lactate; Cr, creatine.
To further corroborate the effect of the blast-induced mTBI on the frontal cortex and hippocampus shown in MRS and 18F-FDG PET/CT examination, we employed histopathological analysis on brain tissue sections. Evans blue (EB) penetration assay showed significantly higher EB contents in mTBI rats at 1–3 h and 1 day after injury than those in the sham group (p = 0.0003, p < 0.0001, respectively), with no significant difference of EB contents between mTBI rats at 7 day and the sham group (p = 0.5252) (Figures 4A,B). This indicated that blast led to the disruption of the BBB immediately following injury to 1 day post-injury and recovered at 7 days post-injury. H&E staining showed no significant alteration in tissue composition of the frontal cortex (Figure 5A) and hippocampus (Supplementary Figure 3A) after blast at each time point. Furthermore, immunohistochemical staining for Iba 1, the microglia marker, revealed more Iba 1-positive cells in the frontal cortex of mTBI rats at each time point and elevated as the time went on (p < 0.0001), which was consistent with the findings of 18F-FDG PET and Ins alterations in MRS (Figures 5B,C). Glial changes in the frontal cortex were also among the most marked after blast-induced mTBI. GFAP immunostaining for astrocytes demonstrated the same trend as Iba 1 in the mTBI group (p < 0.0001) (Figures 5B,D). However, no marked difference was found on NeuN expression, the neuron marker, in the frontal cortex between the mTBI group and the sham group at each time point post-injury (p = 0.1025) (Figures 5B,E). On the contrary, no significant difference was shown between the mTBI group and the sham group on the expressions of Iba 1 (p = 0.8591), GFAP (p = 0.5935), and NeuN (p = 0.7671) in the hippocampus (Supplementary Figures 3B–E).
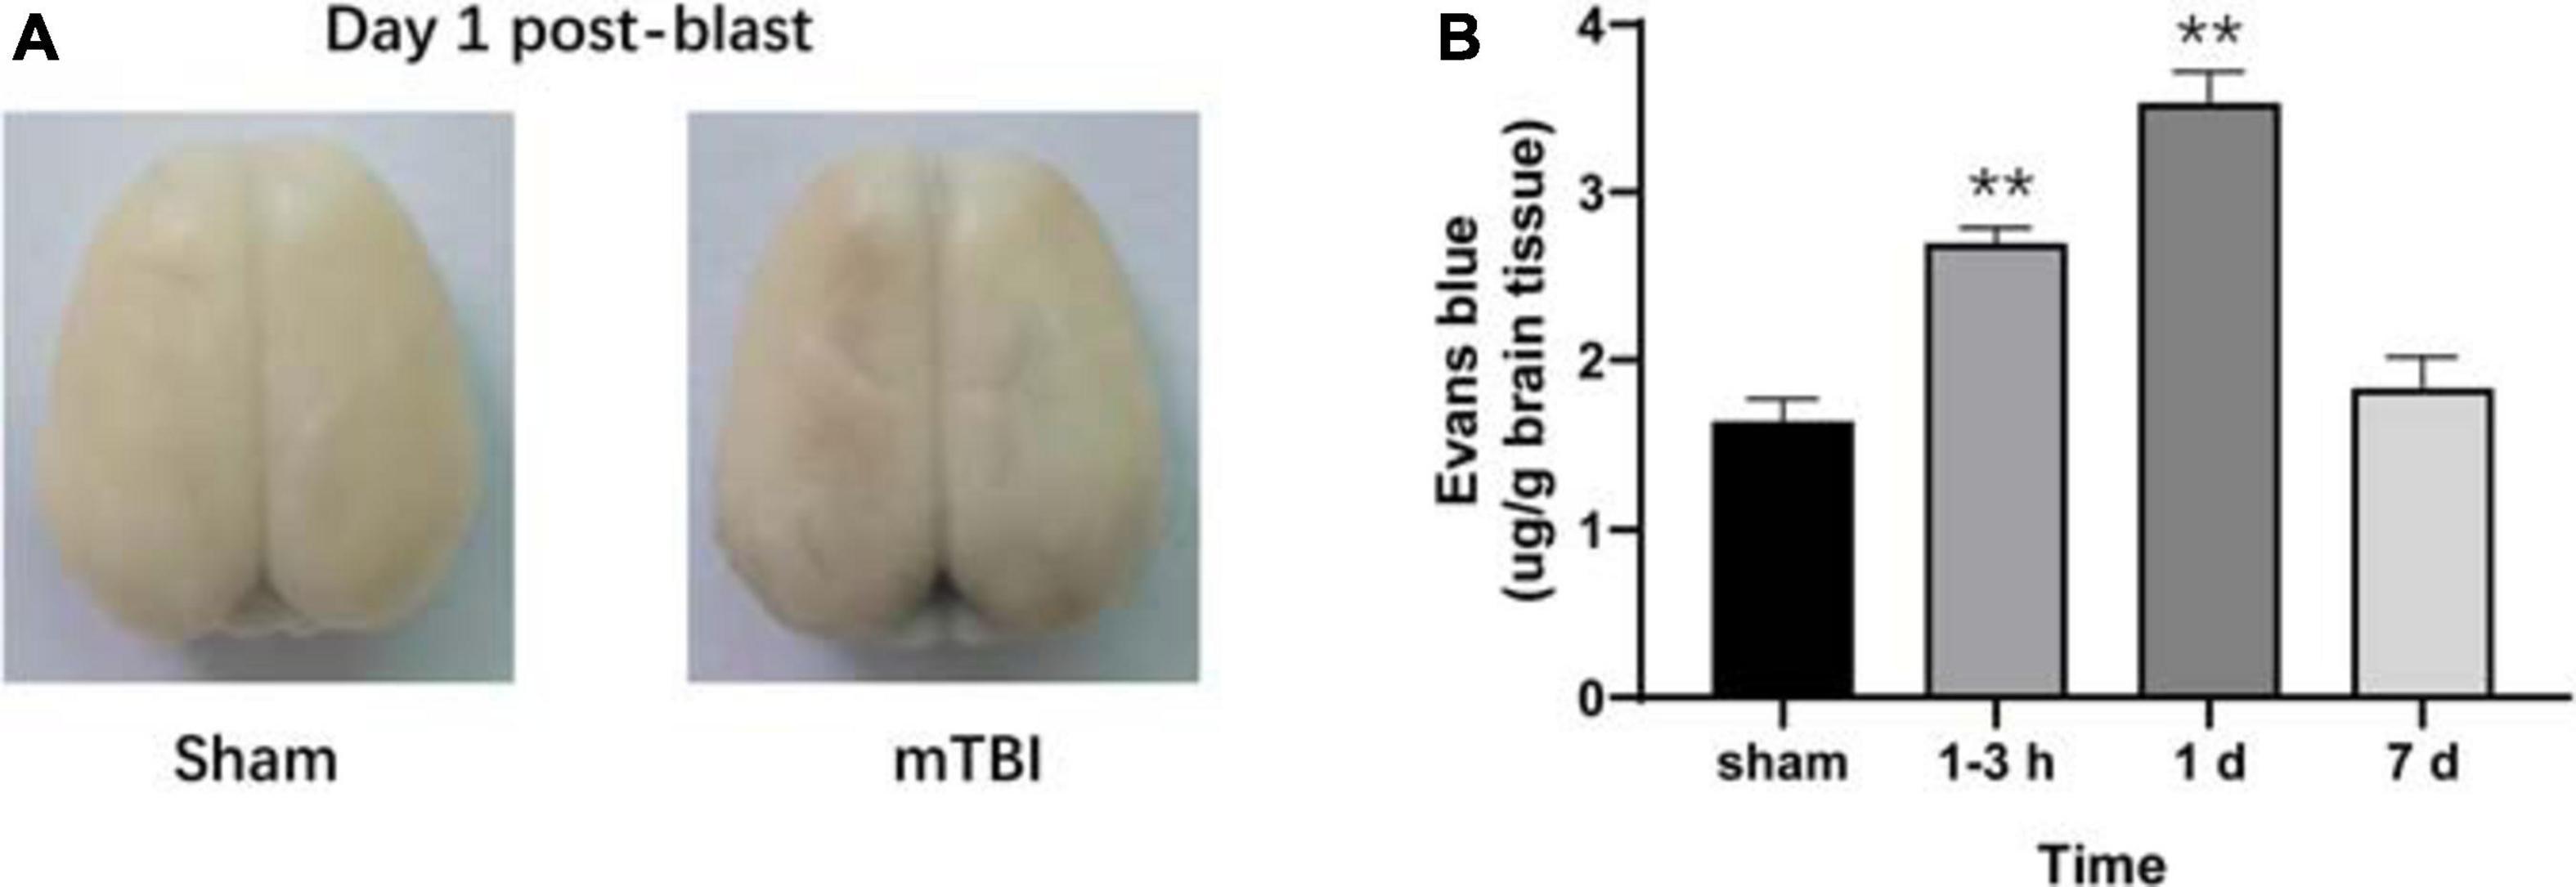
Figure 4. Evans blue (EB) penetration assay reveals progressive alterations of the blood–brain barrier (BBB) in rats after blast-induced mTBI. (A) Representative EB dyeing images of a sham (left) and a blast (right) rat on day 1 post-blast. (B) EB content in brain tissue was also quantified and expressed as micrograms of EB per gram of brain tissue. **p < 0.001 vs. the sham group.
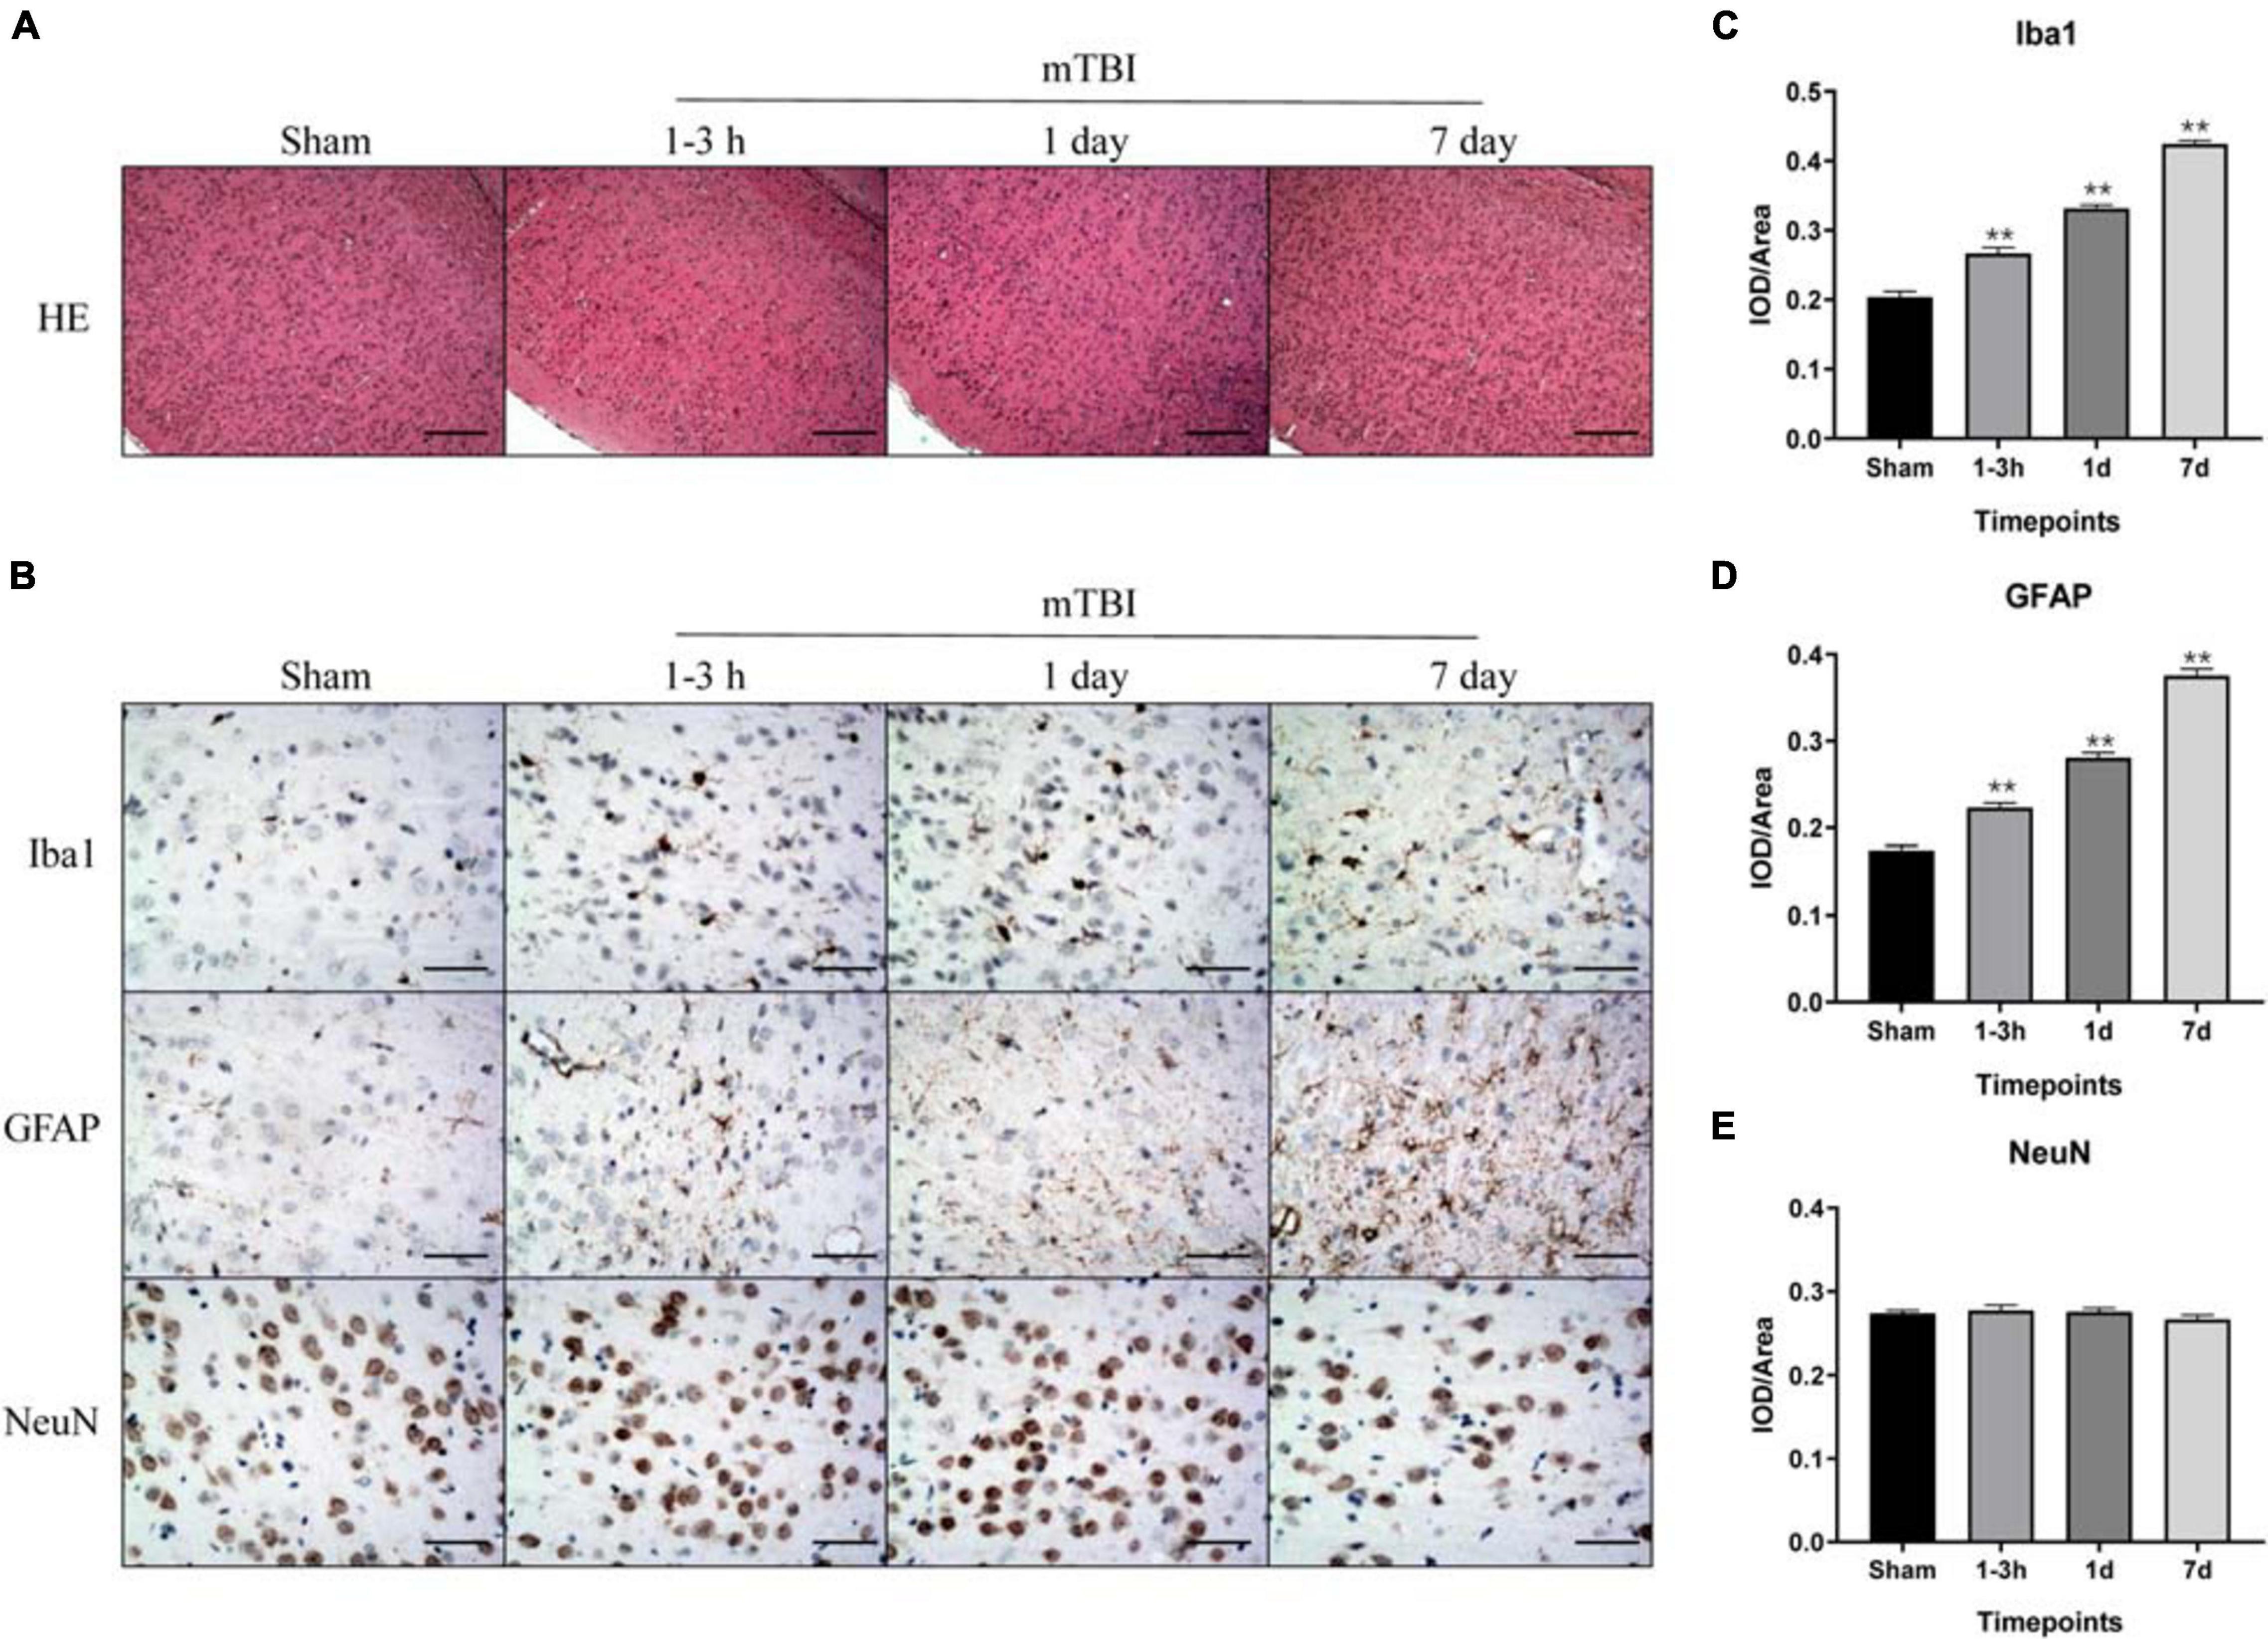
Figure 5. Immunohistochemical analysis of inflammation, injury, and astrogliosis in the frontal cortex region after blast-induced mTBI. (A) H&E staining shows no obvious lesion after exposure to blast at each time point in mTBI rats. (B) Representative immunohistochemical staining for Iba 1, GFAP, and NeuN expression in the frontal cortex region is shown at each time point following injury in sham and mTBI rats. (C–E) Iba 1, GFAP, and NeuN expression levels were quantified. The scale bar denotes 250 μm in (A) and 50 μm in (B). **p < 0.01 vs. the sham group.
To the best of our knowledge, this is the first in vivo study to apply a combination of 18F-FDG PET and MRS to detect progressive changes of brain metabolism after blast-induced mTBI. We demonstrate early metabolic cerebral alterations following blast-induced mTBI, including hyperacute, acute, and subacute phases. Our current study reveals five main findings: (1) no visible brain injuries were observed on conventional T1- and T2-weighted imaging until 7 days following exposure to blast; (2) Ins, Glx, and Lac levels markedly elevated over time in the somatosensory cortex, while the Tau level immediately increased at 1–3 h and 1 day, and then returned to sham level on 7 days post-injury; (3) mTBI produced an acute increase in 18F-FDG uptake in the amygdala, somatosensory cortex, and motor cortex, but decreases in the midbrain structures; (4) Evans blue penetration assay revealed that blast led to the disruption of the BBB immediately following injury to 1 day post-injury and recovered at 7 days post-injury; and (5) histological findings showed a significant elevated expression of inflammatory marker Iba 1 and gliosis marker GFAP over time in the frontal cortex.
Traditionally, physicians have relied on CT and MRI to identify intracranial bleeding, lesions, and skull fractures. However, many patients with mTBI suffer neural injury at a microscopic level. They have persistent neurological symptoms despite normal MRI and CT imaging (Delouche et al., 2016; Honce et al., 2016). This study showed no visible sign of lesions in the brain on T1- and T2-weighted images following exposure to blast, which is similar to the previous findings (Tang et al., 2017). Because of the sensitivity of 1H MRS and 18F-FDG PET to metabolic changes in vivo, we performed these techniques to track the dynamic changes of brain metabolism following blast-induced mTBI.
Ins is a glial marker, including the reactive gliosis or microglia infiltration, which has been recognized as a marker of inflammation (Ashwal et al., 2004). We observed increased Ins level in the somatosensory cortex from 1–3 h to 7 days post-injury, consistent with the inflammation and gliosis responding to injury. These findings were confirmed by the immunohistochemistry using Iba 1 and GFAP immunolabeling in this study. Oxidative stress produces rapid and excessive elevation of extracellular glutamate and then is taken up by astrocytes and forms glutamine via the glutamine synthase enzyme, which is tightly controlled by gliosis (Zhong et al., 2006; Maas et al., 2008; Petronilho et al., 2010). Glx, combined glutamate–glutamine, also markedly increased over time after blast in this study. Several studies have detected elevated Glu levels that persist for several hours following severe TBI in humans and following mild to severe TBI in animal models (Singh et al., 2017), which agrees with our findings. Some other studies demonstrate that mitochondrial dysfunction caused by the very early stage of TBI may affect glutaminase activity leading to alterations of glutamate and glutamine (Xu et al., 2011). Lactate is the end product of anaerobic glycolysis and, therefore, a useful indicator of hypoxia/ischemic cellular condition. Lac level went up till 7 days post-injury, indicating hypoxia/ischemia and alternate metabolic pathways being likely activated in the somatosensory cortex after injury, which has also been reported in earlier studies on TBI (Makoroff et al., 2005; Dienel, 2012; Harris J.L. et al., 2012). Furthermore, Tau, a major osmolyte, immediately increased after trauma until 1 day post-injury, which may be due to the disruption of the BBB. In support of this idea, we performed Evans blue penetration assay to detect alteration of the BBB after injury, which revealed the disruption of the BBB immediately following injury to 1 day post-injury and recovered at 7 days post-injury. Moreover, recent studies have demonstrated that blast injury leads to the breakdown of the BBB immediately following injury with further increase in permeability continuing for several hours (Walls et al., 2016; Kuriakose et al., 2018). Interestingly, an elevated Cho level was only found on 7 days post-injury, which may be due to shearing of myelin and cellular membranes (Ross et al., 1998). The study of children with TBI showed significant increased Cho/Cr and decreased NAA/Cr in normal-appearing brain (Holshouser et al., 2005). However, no significant alterations were found in NAA level in our study. Immunohistochemistry showed that NeuN expression level did not change significantly over time, which confirmed the results of NAA in MRS.
Glucose is the major substrate for metabolism in the brain and has been studied extensively in non-blast TBI. Studies on non-blast TBI models reveal that metabolic alterations within the brain are dynamic and varied by regions depending on the severity of TBI, the model used, and the time of metabolic measurements (Richards et al., 2001; Casey et al., 2008; Harris N.G. et al., 2012; Prins et al., 2013). Few studies have detected changes in 18F-FDG uptake following primary blast exposure in rodents. Increased 18F-FDG uptake in the whole brain, especially regions associated with executive and vestibulomotor function, on 1 day post-injury was reported, and then resolved by 9 days following blast to head (Awwad et al., 2015). Jaiswal et al. (2019) examined 18F-FDG uptake in the brain by VOI- and voxel-based analysis following a single blast. Like us, they observed an acute increase in 18F-FDG uptake in the amygdala and somatosensory cortex and a decrease in multiple midbrain structures at 1–3 h following blast. Interestingly, in our current study, glucose metabolism in the motor cortex was also markedly elevated from 1 to 7 days post-injury, where increased Ins and Glx levels in MRS were observed. These temporal and regional changes in glucose metabolism following blast are due to inflammation and gliosis, which were confirmed by immunohistochemistry.
The hippocampus has been reported to be the common injured region. Previous studies have shown that the hippocampus was vulnerable to controlled cortical impact (CCI)-mediated neuronal death, occurring as early as 24 h post-injury and continuing for weeks after injury (Kabadi et al., 2012; Zhou et al., 2012; Loane et al., 2014). Rats undergoing lateral fluid percussion injury (FPI) showed markedly reduced FDG uptake in the hippocampus from 1 week after FPI to 6 months. However, in this study, no significant changes were found in the hippocampus on 18F-FDG PET, MRS, and immunohistochemistry from the hyperacute phase to the subacute phase. Consistent with our study, Jaiswal et al. (2019) showed no significant difference between the blast-induced mTBI group and the sham group in the hippocampus on 18F-FDG PET imaging at the acute and subacute stages. Walls et al. (2016) also showed no BBB damage and colocalized neuroinflammatory changes in the hippocampus from 4 h to several days post-injury in the blast-induced TBI model. These inconsistent results may be explained by different mTBI models and detected changes at different TBI stages. Further studies are needed to investigate alterations in the chronic phase and conduct other imaging modalities following blast-induced TBI.
In our study, 18F-FDG PET imaging reflects neuronal function and activity of cells including neurons and glial cells/inflammatory cells. MRS provides complementary information and assesses metabolites following injury, which can reflect the pathophysiological condition of the brain after injury indirectly, such as inflammation, ischemia, hypoxia, etc. 18F-FDG PET and MRS could be used to investigate neuropathological changes after brain injury from different aspects. Therefore, combining these two imaging methods could reflect more comprehensive neuropathological alterations in vivo after blast-induced mTBI. In addition, 18F-FDG PET provides metabolic information of the whole brain after a single scanning, while MRS offers metabolic information of one specific region. Thus, this may provide us a diagnostic strategy that 18F-FDG PET could firstly be performed on mTBI patients to find the abnormal regions and to define regions of interest for MRS, which may improve the diagnostic measures and therapeutic management after mTBI.
However, our study has limitations. First, the study design does not allow direct comparisons, since MRS and 18F-FDG PET were performed in two different cohorts. Second, we did not assess behavioral outcome of these animals. Future work should combine comprehensive behavioral testing with in vivo findings. Third, a small number of animals were used in the histological analysis. Fourth, the corpus callosum was not contained in the 58 regions of the W. Schiffer rat brain template, resulting in no information of 18F-FDG uptake in the corpus callosum. Previous studies have reported that the corpus callosum is more vulnerable to injury in non-blast TBI models (Brabazon et al., 2017). However, a characteristic pattern of blast-induced mTBI has not been identified. Thus, whether there are significant metabolic changes in the corpus callosum or not remains unknown. In future studies, other software should be used for PET image analysis, and DTI, sensitive to examining axonal injury, should also be performed to detect microstructural alterations after blast exposure.
In conclusion, we demonstrate for the first time that a combination of 18F-FDG PET and MRS could detect progressive changes of brain metabolism after blast-induced mTBI in hyperacute, acute, and subacute post-injury period. Combining these two imaging methods could reflect more comprehensive neuropathological alterations in vivo after blast-induced mTBI. These findings offer useful information in understanding the pathophysiology of blast-induced mTBI, including inflammation, gliosis, hypoxia/ischemia, and BBB disruption.
The original contributions presented in the study are included in the article/Supplementary Material, further inquiries can be directed to the corresponding authors.
The animal study was reviewed and approved by the Animal Use Subcommittee of Army Medical University.
XC, RJ, and KX conceived and designed the study. YL and CL established the model. YL, YG, and JZ collected and analyzed the MRI and MRS data. YT produced the PET radioligand. JS and FJ conducted the PET measurements. XC and JF analyzed the FDG PET data. HT and KL conducted and analyzed the histology. XC and KL performed the statistics, figure preparation, and wrote the manuscript. QZ edited the manuscript. All authors revised the manuscript and read and approved the submitted version.
This work was supported by grants from the National Natural Science Foundation of China (81801672 and 81571889), the Natural Science Foundation of Chongqing (cstc2019jcyj-msxmX0123), Science and Technology Innovation Ability Enhancement Project of Army Medical University (2019XLC3054), Talent Innovation Ability Training Program of Daping Hospital (2019CXLCC010), and Chongqing Clinical Research Centre of Imaging and Nuclear Medicine (CSTC2015YFPT-gcjsyjzx0175).
The reviewer CZ declared a past co-authorship with one of the author FJ to the handling editor.
The remaining authors declare that the research was conducted in the absence of any commercial or financial relationships that could be construed as a potential conflict of interest.
The Supplementary Material for this article can be found online at: https://www.frontiersin.org/articles/10.3389/fnins.2021.593723/full#supplementary-material
Ashwal, S., Holshouser, B., Tong, K., Serna, T., Osterdock, R., Gross, M., et al. (2004). Proton spectroscopy detected myoinositol in children with traumatic brain injury. Pediatr. Res. 56, 630–638. doi: 10.1203/01.PDR.0000139928.60530.7D
Awwad, H. O., Gonzalez, L. P., Tompkins, P., Lerner, M., Brackett, D. J., Awasthi, V., et al. (2015). Blast overpressure waves induce transient anxiety and regional changes in cerebral glucose metabolism and delayed hyperarousal in rats. Front. Neurol. 6:132. doi: 10.3389/fneur.2015.00132
Badea, A., Kamnaksh, A., Anderson, R. J., Calabrese, E., Long, J. B., and Agoston, D. V. (2018). Repeated mild blast exposure in young adult rats results in dynamic and persistent microstructural changes in the brain. Neuroimage Clin. 18, 60–73. doi: 10.1016/j.nicl.2018.01.007
Bailes, J. E., and Cantu, R. C. (2001). Head injury in athletes. Neurosurgery 48, 26–45. doi: 10.1097/00006123-200101000-00005 discussion 45-6.,
Belanger, H. G., Vanderploeg, R. D., Curtiss, G., and Warden, D. L. (2007). Recent neuroimaging techniques in mild traumatic brain injury. J. Neuropsychiatry Clin. Neurosci. 19, 5–20. doi: 10.1176/jnp.2007.19.1.5
Benzinger, T. L., Brody, D., Cardin, S., Curley, K. C., Mintun, M. A., Mun, S. K., et al. (2009). Blast-related brain injury: imaging for clinical and research applications: report of the 2008 st. Louis workshop. J. Neurotrauma 26, 2127–2144. doi: 10.1089/neu.2009-0885
Brabazon, F., Wilson, C. M., Shukla, D. K., Mathur, S., Jaiswal, S., Bermudez, S., et al. (2017). [(18)F]FDG-PET combined with MRI elucidates the pathophysiology of traumatic brain injury in rats. J. Neurotrauma 34, 1074–1085. doi: 10.1089/neu.2016.4540
Byrnes, K. R., Wilson, C. M., Brabazon, F., von Leden, R., Jurgens, J. S., Oakes, T. R., et al. (2014). FDG-PET imaging in mild traumatic brain injury: a critical review. Front. Neuroenergetics 5:13. doi: 10.3389/fnene.2013.00013
Casey, P. A., McKenna, M. C., Fiskum, G., Saraswati, M., and Robertson, C. L. (2008). Early and sustained alterations in cerebral metabolism after traumatic brain injury in immature rats. J. Neurotrauma 25, 603–614. doi: 10.1089/neu.2007.0481
Croall, I. D., Cowie, C. J., He, J., Peel, A., Wood, J., Aribisala, B. S., et al. (2014). White matter correlates of cognitive dysfunction after mild traumatic brain injury. Neurology 83, 494–501. doi: 10.1212/WNL.0000000000000666
Delouche, A., Attye, A., Heck, O., Grand, S., Kastler, A., Lamalle, L., et al. (2016). Diffusion MRI: pitfalls, literature review and future directions of research in mild traumatic brain injury. Eur. J. Radiol. 85, 25–30. doi: 10.1016/j.ejrad.2015.11.004
Dienel, G. A. (2012). Brain lactate metabolism: the discoveries and the controversies. J. Cereb. Blood Flow Metab. 32, 1107–1138. doi: 10.1038/jcbfm.2011.175
Garnett, M. R., Corkill, R. G., Blamire, A. M., Rajagopalan, B., Manners, D. N., Young, J. D., et al. (2001). Altered cellular metabolism following traumatic brain injury: a magnetic resonance spectroscopy study. J. Neurotrauma 18, 231–240. doi: 10.1089/08977150151070838
Harris, J. L., Yeh, H. W., Choi, I. Y., Lee, P., Berman, N. E., Swerdlow, R. H., et al. (2012). Altered neurochemical profile after traumatic brain injury: (1)H-MRS biomarkers of pathological mechanisms. J. Cereb. Blood Flow Metab. 32, 2122–2134. doi: 10.1038/jcbfm.2012.114
Harris, N. G., Mironova, Y. A., Chen, S. F., Richards, H. K., and Pickard, J. D. (2012). Preventing flow-metabolism uncoupling acutely reduces axonal injury after traumatic brain injury. J. Neurotrauma 29, 1469–1482. doi: 10.1089/neu.2011.2161
Harris, N. G., Verley, D. R., Gutman, B. A., Thompson, P. M., Yeh, H. J., and Brown, J. A. (2016). Disconnection and hyper-connectivity underlie reorganization after TBI: a rodent functional connectomic analysis. Exp. Neurol. 277, 124–138. doi: 10.1016/j.expneurol.2015.12.020
Holshouser, B. A., Tong, K. A., and Ashwal, S. (2005). Proton MR spectroscopic imaging depicts diffuse axonal injury in children with traumatic brain injury. AJNR Am. J. Neuroradiol. 26, 1276–1285.
Honce, J. M., Nyberg, E., Jones, I., and Nagae, L. (2016). Neuroimaging of Concussion. Phys. Med. Rehabil. Clin. N. Am. 27, 411–428. doi: 10.1016/j.pmr.2016.01.002
Jaiswal, S., Knutsen, A. K., Wilson, C. M., Fu, A. H., Tucker, L. B., Kim, Y., et al. (2019). Mild traumatic brain injury induced by primary blast overpressure produces dynamic regional changes in [(18)F]FDG uptake. Brain Res. 1723:146400. doi: 10.1016/j.brainres.2019.146400
Kabadi, S. V., Stoica, B. A., Loane, D. J., Byrnes, K. R., Hanscom, M., Cabatbat, R. M., et al. (2012). Cyclin D1 gene ablation confers neuroprotection in traumatic brain injury. J. Neurotrauma 29, 813–827. doi: 10.1089/neu.2011.1980
Katayama, Y., Kawamata, T., Tamura, T., Hovda, D. A., Becker, D. P., and Tsubokawa, T. (1991). Calcium-dependent glutamate release concomitant with massive potassium flux during cerebral ischemia in vivo. Brain Res. 558, 136–140. doi: 10.1016/0006-8993(91)90730-j
Kokiko-Cochran, O. N., and Godbout, J. P. (2018). The inflammatory continuum of traumatic brain injury and Alzheimer’s Disease. Front. Immunol. 9:672. doi: 10.3389/fimmu.2018.00672
Kulkarni, P., Morrison, T. R., Cai, X., Iriah, S., Simon, N., Sabrick, J., et al. (2019). Neuroradiological changes following single or repetitive mild TBI. Front. Syst. Neurosci. 13:34. doi: 10.3389/fnsys.2019.00034
Kuriakose, M., Rama Rao, K. V., Younger, D., and Chandra, N. (2018). Temporal and spatial effects of blast overpressure on blood-brain barrier permeability in traumatic brain injury. Sci. Rep. 8:8681. doi: 10.1038/s41598-018-26813-7
Larson, M. J., Farrer, T. J., and Clayson, P. E. (2011). Cognitive control in mild traumatic brain injury: conflict monitoring and conflict adaptation. Int. J. Psychophysiol. 82, 69–78. doi: 10.1016/j.ijpsycho.2011.02.018
Le, T. H., and Gean, A. D. (2009). Neuroimaging of traumatic brain injury. Mt. Sinai J. Med. 76, 145–162. doi: 10.1002/msj.20102
Ling, J. M., Pena, A., Yeo, R. A., Merideth, F. L., Klimaj, S., Gasparovic, C., et al. (2012). Biomarkers of increased diffusion anisotropy in semi-acute mild traumatic brain injury: a longitudinal perspective. Brain 135, 1281–1292. doi: 10.1093/brain/aws073
Loane, D. J., Kumar, A., Stoica, B. A., Cabatbat, R., and Faden, A. I. (2014). Progressive neurodegeneration after experimental brain trauma: association with chronic microglial activation. J. Neuropathol. Exp. Neurol. 73, 14–29. doi: 10.1097/NEN.0000000000000021
Maas, A. I., Stocchetti, N., and Bullock, R. (2008). Moderate and severe traumatic brain injury in adults. Lancet Neurol. 7, 728–741. doi: 10.1016/S1474-4422(08)70164-9
Makoroff, K. L., Cecil, K. M., Care, M., and Ball, W. S. Jr. (2005). Elevated lactate as an early marker of brain injury in inflicted traumatic brain injury. Pediatr. Radiol. 35, 668–676. doi: 10.1007/s00247-005-1441-7
Mayer, A. R., Ling, J., Mannell, M. V., Gasparovic, C., Phillips, J. P., Doezema, D., et al. (2010). A prospective diffusion tensor imaging study in mild traumatic brain injury. Neurology 74, 643–650. doi: 10.1212/WNL.0b013e3181d0ccdd
Meabon, J. S., Huber, B. R., Cross, D. J., Richards, T. L., Minoshima, S., Pagulayan, K. F., et al. (2016). Repetitive blast exposure in mice and combat veterans causes persistent cerebellar dysfunction. Sci. Transl. Med. 8:321ra6. doi: 10.1126/scitranslmed.aaa9585
Missault, S., Anckaerts, C., Blockx, I., Deleye, S., Van Dam, D., Barriche, N., et al. (2019). Neuroimaging of subacute brain inflammation and microstructural changes predicts long-term functional outcome after experimental traumatic brain injury. J. Neurotrauma 36, 768–788. doi: 10.1089/neu.2018.5704
Ning, Y. L., Yang, N., Chen, X., Tian, H. K., Zhao, Z. A., Zhang, X. Z., et al. (2019). Caffeine attenuates brain injury but increases mortality induced by high-intensity blast wave exposure. Toxicol. Lett. 301, 90–97. doi: 10.1016/j.toxlet.2018.11.004
Park, J. H., Hong, J. H., Lee, S. W., Ji, H. D., Jung, J. A., Yoon, K. W., et al. (2019). The effect of chronic cerebral hypoperfusion on the pathology of Alzheimer’s disease: a positron emission tomography study in rats. Sci. Rep. 9:14102. doi: 10.1038/s41598-019-50681-4
Petronilho, F., Feier, G., de Souza, B., Guglielmi, C., Constantino, L. S., Walz, R., et al. (2010). Oxidative stress in brain according to traumatic brain injury intensity. J. Surg. Res. 164, 316–320. doi: 10.1016/j.jss.2009.04.031
Prins, M. L., Alexander, D., Giza, C. C., and Hovda, D. A. (2013). Repeated mild traumatic brain injury: mechanisms of cerebral vulnerability. J. Neurotrauma 30, 30–38. doi: 10.1089/neu.2012.2399
Richards, H. K., Simac, S., Piechnik, S., and Pickard, J. D. (2001). Uncoupling of cerebral blood flow and metabolism after cerebral contusion in the rat. J. Cereb. Blood Flow Metab. 21, 779–781. doi: 10.1097/00004647-200107000-00002
Ross, B. D., Ernst, T., Kreis, R., Haseler, L. J., Bayer, S., Danielsen, E., et al. (1998). 1H MRS in acute traumatic brain injury. J. Magn. Reson. Imaging 8, 829–840. doi: 10.1002/jmri.1880080412
Sajja, V. S., Galloway, M. P., Ghoddoussi, F., Thiruthalinathan, D., Kepsel, A., Hay, K., et al. (2012). Blast-induced neurotrauma leads to neurochemical changes and neuronal degeneration in the rat hippocampus. NMR Biomed. 25, 1331–1339. doi: 10.1002/nbm.2805
Salberg, S., Yamakawa, G., Christensen, J., Kolb, B., and Mychasiuk, R. (2017). Assessment of a nutritional supplement containing resveratrol, prebiotic fiber, and omega-3 fatty acids for the prevention and treatment of mild traumatic brain injury in rats. Neuroscience 365, 146–157. doi: 10.1016/j.neuroscience.2017.09.053
Singh, K., Trivedi, R., Verma, A., D’Souza, M. M., Koundal, S., Rana, P., et al. (2017). Altered metabolites of the rat hippocampus after mild and moderate traumatic brain injury – a combined in vivo and in vitro (1) H-MRS study. NMR Biomed. 30:e3764. doi: 10.1002/nbm.3764
Stocker, R. P., Cieply, M. A., Paul, B., Khan, H., Henry, L., Kontos, A. P., et al. (2014). Combat-related blast exposure and traumatic brain injury influence brain glucose metabolism during REM sleep in military veterans. Neuroimage 99, 207–214. doi: 10.1016/j.neuroimage.2014.05.067
Tang, S., Xu, S., Fourney, W. L., Leiste, U. H., Proctor, J. L., Fiskum, G., et al. (2017). Central nervous system changes induced by underbody blast-induced hyperacceleration: an in vivo diffusion tensor imaging and magnetic resonance spectroscopy study. J. Neurotrauma 34, 1972–1980. doi: 10.1089/neu.2016.4650
Vanhamme, L., van den Boogaart, A., and Van Huffel, S. (1997). Improved method for accurate and efficient quantification of MRS data with use of prior knowledge. J. Magn. Reson. 129, 35–43. doi: 10.1006/jmre.1997.1244
Venkatasubramanian, P. N., Keni, P., Gastfield, R., Li, L., Aksenov, D., Sherman, S. A., et al. (2020). Diffusion tensor imaging detects acute and subacute changes in corpus callosum in blast-induced traumatic brain injury. ASN Neuro 12:1759091420922929. doi: 10.1177/1759091420922929
Walls, M. K., Race, N., Zheng, L., Vega-Alvarez, S. M., Acosta, G., Park, J., et al. (2016). Structural and biochemical abnormalities in the absence of acute deficits in mild primary blast-induced head trauma. J. Neurosurg. 124, 675–686. doi: 10.3171/2015.1.JNS141571
Xu, S., Zhuo, J., Racz, J., Shi, D., Roys, S., Fiskum, G., et al. (2011). Early microstructural and metabolic changes following controlled cortical impact injury in rat: a magnetic resonance imaging and spectroscopy study. J. Neurotrauma 28, 2091–2102. doi: 10.1089/neu.2010.1739
Zhong, C., Zhao, X., Van, K. C., Bzdega, T., Smyth, A., Zhou, J., et al. (2006). NAAG peptidase inhibitor increases dialysate NAAG and reduces glutamate, aspartate and GABA levels in the dorsal hippocampus following fluid percussion injury in the rat. J. Neurochem. 97, 1015–1025. doi: 10.1111/j.1471-4159.2006.03786.x
Zhou, H., Chen, L., Gao, X., Luo, B., and Chen, J. (2012). Moderate traumatic brain injury triggers rapid necrotic death of immature neurons in the hippocampus. J. Neuropathol. Exp. Neurol. 71, 348–359. doi: 10.1097/NEN.0b013e31824ea078
Keywords: blast injury, mild traumatic brain injury, positron emission tomography, fluorodeoxyglucose, magnetic resonance spectroscopy
Citation: Li Y, Liu K, Li C, Guo Y, Fang J, Tong H, Tang Y, Zhang J, Sun J, Jiao F, Zhang Q, Jin R, Xiong K and Chen X (2021) 18F-FDG PET Combined With MR Spectroscopy Elucidates the Progressive Metabolic Cerebral Alterations After Blast-Induced Mild Traumatic Brain Injury in Rats. Front. Neurosci. 15:593723. doi: 10.3389/fnins.2021.593723
Received: 11 August 2020; Accepted: 19 February 2021;
Published: 18 March 2021.
Edited by:
Szilvia Anett Nagy, University of Pécs, HungaryReviewed by:
Arnold Tóth, University of Pécs, HungaryCopyright © 2021 Li, Liu, Li, Guo, Fang, Tong, Tang, Zhang, Sun, Jiao, Zhang, Jin, Xiong and Chen. This is an open-access article distributed under the terms of the Creative Commons Attribution License (CC BY). The use, distribution or reproduction in other forums is permitted, provided the original author(s) and the copyright owner(s) are credited and that the original publication in this journal is cited, in accordance with accepted academic practice. No use, distribution or reproduction is permitted which does not comply with these terms.
*Correspondence: Rongbing Jin, amlucmI5OUAxMjYuY29t; Kunlin Xiong, MTA5OTQ4OTY5QHFxLmNvbQ==; Xiao Chen, eGlhb2NoZW4yMjlAZm94bWFpbC5jb20=
†These authors have contributed equally to this work
Disclaimer: All claims expressed in this article are solely those of the authors and do not necessarily represent those of their affiliated organizations, or those of the publisher, the editors and the reviewers. Any product that may be evaluated in this article or claim that may be made by its manufacturer is not guaranteed or endorsed by the publisher.
Research integrity at Frontiers
Learn more about the work of our research integrity team to safeguard the quality of each article we publish.