 Wei Wei
 Tingting Zhu
 Xiaoyu Wang
 Lingyu Li
 Qihong Zou
 Yating Lv
- 1Institutes of Psychological Sciences, Hangzhou Normal University, Hangzhou, China
- 2Zhejiang Key Laboratory for Research in Assessment of Cognitive Impairments, Hangzhou, China
- 3Center for MRI Research, Academy for Advanced Interdisciplinary Studies, Peking University, Beijing, China
The application of repetitive transcranial magnetic stimulation (rTMS) over the primary motor cortex (M1) could influence the intrinsic brain activity in the sensorimotor network (SMN). However, how rTMS modulates the topological organization of the SMN remains unclear. In this study, we employed resting-state fMRI to investigate the topological alterations in the functional SMN after application of different frequency rTMS over the left M1. To accomplish this, we collected MRI data from 45 healthy participants who were randomly divided into three groups based on rTMS frequency (HF, high-frequency 3 Hz; LF, low-frequency 1 Hz; and SHAM). Individual large-scale functional SMN was constructed by correlating the mean time series among 29 regions of interest (ROI) in the SMN and was fed into graph-based network analyses at multiple levels of global organization and nodal centrality. Our results showed that compared with the network metrics before rTMS stimulation, the left paracentral lobule (PCL) exhibited reduced nodal degree and betweenness centrality in the LF group after rTMS, while the right supplementary motor area (SMA) exhibited reduced nodal betweenness centrality in the HF group after rTMS. Moreover, rTMS-related alterations in nodal metrics might have been attributable to the changes in connectivity patterns and local activity of the affected nodes. These findings reflected the potential of using rTMS over M1 as an effective intervention to promote motor function rehabilitation.
Introduction
Transcranial magnetic stimulation (TMS) is a focal and noninvasive technique that utilizes short, rapidly changing magnetic field pulses to induce electrical currents in underlying cortical tissue (Hallett, 2007; Fox et al., 2012). Repetitive TMS (rTMS) at different frequencies could induce distinct effects: high-frequency rTMS (>1 Hz) has been indicated to facilitate the cortical excitability of the ipsilateral hemisphere (Peinemann et al., 2004; Pascual-Leone et al., 2005; Khedr et al., 2009; Corti et al., 2012; Du et al., 2018), while low-frequency rTMS (≤1 Hz) could induce decreased cortical excitability in the ipsilateral side and increased excitability in the contralateral hemisphere (Muellbacher et al., 2000; Ziemann, 2004; Khedr et al., 2009; Corti et al., 2012; Du et al., 2018).
The application of rTMS over the primary motor cortex (M1), one of the vital brain areas responsible for motor control and execution, has been proven effective in several studies which explored its usage for promoting motor rehabilitation after stroke (Corti et al., 2012) or Parkinson’s disease (Lomarev et al., 2006; González-García et al., 2011). rTMS over M1 has not only induced brain activity changes in the stimulated area (Bestmann et al., 2003, 2004) but also influenced regions belonging to the sensorimotor network (SMN) which was spatially beyond the stimulated site (Bestmann et al., 2003, 2004; Yoo et al., 2008; Salinas et al., 2011, 2013, 2016). Bestmann et al. (2004) measured MRI signal changes during high-frequency rTMS (3.125 Hz) over the left primary sensorimotor cortex (M1/S1) with supra- and subthreshold intensity. They found high-frequency rTMS at different intensities activated a similar pattern of primary motor and sensorimotor regions such as supplementary motor area (SMA), premotor cortex, cingulate motor cortex and thalamus though subthreshold stimulation was with reduced effects. Yoo et al. (2008) examined the cortical activation following high-frequency rTMS (10 Hz) over right M1. The significant activations in the bilateral basal ganglia, left superior frontal gyrus, bilateral pre-SMA, right medial temporal lobe and right inferior parietal lobe associated with enhanced motor performance during a sequential finger motor task were detected. A baboon model developed by Salinas was employed to illustrate the cerebral blood flow (CBF) changes using the positron emission tomography (PET) imaging during suprathreshold rTMS over the left M1 at different high-frequency rates (3 Hz, 5 Hz, 10 Hz, 15 Hz). In addition to the stimulated M1 area, the significant increased CBF were found in regions within SMN (SMA and premotor cortex) for all high-frequency rTMS (Salinas et al., 2013). However, previous studies interested in the local activity alterations in regions within the SMN. The human brain has been revealed to integrate various inputs through multiple distributed systems and operate as a network (Barch, 2013; Sporns, 2014), which made the network approaches particularly suitable for the investigation of the human brain. Complex network analysis, one powerful tool to map the brain network, characterizes both intra- and inter-network connectivity patterns for the complete convergence of brain areas (Bassett and Bullmore, 2009; Craddock et al., 2013). Therefore, the complex network approaches could offer a more general view of the rTMS effects on the SMN.
Recent studies have applied multimodal neuroimaging data to construct the human brain networks with graph-based network analyses (Bullmore and Sporns, 2009; He and Evans, 2010). So far, several organizational principles of human brain networks have consistently been detected such as small-worldness (Liao et al., 2017) and the existence of hubs (van den Heuvel and Sporns, 2013). Resting-state functional MRI (rs-fMRI) measures spontaneous neuronal activity in human brain (Biswal et al., 1995) and has been commonly applied to explore the topological organization of brain functional networks (Wang et al., 2010). Park et al. (2014) demonstrated that increased global efficiency and decreased local efficiency of the whole brain network was observed in participants who had greater motor performance changes after employing high-frequency rTMS (10 Hz) over the right M1. However, how different frequency rTMS over M1 modulates topological organization in the SMN remains unclear.
In this study, we employed resting-state fMRI before and after the application of rTMS over left M1 to investigate the topological alterations in the SMN. Specifically, we sought to determine whether and how different frequency rTMS influences the topological organization of the SMN.
Materials and Methods
Participants
Forty-five right-handed healthy participants who had no history of neurological or psychiatric diseases and no contraindications for TMS and MRI were recruited from local universities (23 ± 2.67 years, 25 females) in the present study. The participants were randomly divided into three groups by rTMS frequency, including high-frequency group (HF, 3 Hz; n = 15, age = 24 ± 2.56 years, 8 females), low-frequency group (LF, 1 Hz; n = 15, age = 22.8 ± 3.1 years, 8 females) and sham group (SHAM; n = 15, age = 22.4 ± 2.16 years, 9 females). This study was approved by the Ethics Committee of the Center for Cognition and Brain Disorders at Hangzhou Normal University. All participants signed informed consents before attending the study.
MRI Data Acquisition
In this study, we chose the offline measures which are intended to examine the plasticity induced by rTMS at different frequencies (Rounis et al., 2005; Yoo et al., 2008). Each participant underwent one MRI scan before and one scan after rTMS stimulation using the same imaging protocol. The second MRI scan was performed within 30 min after stimulation (HF, 13.93 ± 4.3 min; LF, 14.67 ± 5.01 min; SHAM, 12.4 ± 5.18 min).
Two MRI scans were performed on a GE 3T scanner (MR-750, GE Medical Systems, Milwaukee, WI) at the Affiliated Hospital of Hangzhou Normal University. Each MRI scan included the following three sessions:
Resting-state fMRI: Echo-planar imaging sequence, 43 axial slices, 240 volumes, repetition time (TR) = 2000 ms, echo time (TE) = 30 ms, field of view (FOV) = 220 × 220 mm2, voxel size = 3.44 mm × 3.44 mm × 3.20 mm, flip angle = 60°.
Structural MRI: 3D-MPRAGE sequence, 176 sagittal slices, TR = 8100 ms, TE = 3.1 ms, FOV = 256 × 256 mm2, voxel size = 1 mm × 1 mm × 1 mm.
Task-fMRI: acquired using the same parameters as the rs-fMRI. A block-designed finger-tapping task was performed in this session, which consisted of eight 20s task blocks and seven 20s rest blocks. The participants were instructed to press a key with right index finger following presentation of a red circle flashed at a frequency of 1 Hz during the task blocks, and to stare at a white cross in the center of screen during the rest blocks. This session was acquired after resting-state fMRI scanning session to exclude the effects of finger moves on the resting-state BOLD signal.
rTMS Intervention
The rTMS was applied using a Magstim TMS machine (Magstim Inc., Sheffield, United Kingdom) equipped with a figure-of-eight coil. All applications of rTMS followed the safety guidance of rTMS provided by the International Workshop (Wassermann, 1998).
Resting Motor Threshold
Participants were instructed to sit and relax comfortably in an adjustable armchair. Motor evoked potential (MEP) amplitudes were recorded from abductor pollicis brevis (APB) muscle of right hand. For each participant, the target coordinates of left M1 were located in the hand knob area on structural image and were marked with Brainsight software1. The frameless stereotaxy was then applied to coregister the structural image to the head for each participant (Paus et al., 1997). Each participant’s head position was assessed using the Polaris infrared tracking system (Northern Digital, Waterloo, Canada) base on four landmarks (nasion, nose tip and intertragal notch of both ears) on the structural image. Single-pulse TMS was first delivered to target position while the coil was systematically moved in 1-cm increments at a constant suprathreshold stimulus intensity to detect the “hot spot” (Yoo et al., 2008), where the MEPs in the APB muscle could be evoked with maximum peak-to-peak amplitude and shortest latencies (Cárdenas-Morales et al., 2013). The resting motor threshold (RMT) was defined as the lowest stimulus intensity eliciting MEP amplitudes greater than 50 μV at least five times in 10 consecutive trials over the hot spot (Rossini et al., 1994; Rothwell et al., 1999). During the rTMS application, the surface electromyography (EMG) of the APB muscle was constantly recorded.
Location of TMS Target Region
Individual activation map from the right finger-tapping task was generated using SPM122. For each participant, the activation map was then projected to the anatomical image using Brainsight software1. The most significantly activated voxel in the left anterior wall of the central sulcus was located as the individual TMS target for rTMS stimulation.
TMS Protocol
The coil was placed tangentially over the target region in left M1 after the anatomical coregistration using frameless stereotaxy. All stimulations were administered with the magnitude of the pulse set at 90% RMT.
HF group: High-frequency rTMS included five consecutive pulse blocks interleaved with 15 s of quitting time. Each block was composed of 300 pulses at a frequency of 3 Hz and lasted for 100 s. Each participant received a total of 1500 pulses over the course of 9.3 min. The motor threshold of HF group was 62 ± 6.5%.
LF group: Low-frequency rTMS also included five consecutive pulse blocks interleaved with 15 s of quitting time. Each block comprised 300 pulses at a frequency of 1 Hz and lasted for 300 s. Each participant received a total of 1500 pulses lasting 26 min. The motor threshold of LF group was 63 ± 6.3%.
SHAM group: For sham group, the coil was placed at a 90° angle to the skull and the stimulation parameters were same as the LF group.
Resting-State fMRI Data Preprocessing
The resting-state fMRI data was processed with the GRETNA package (Wang et al., 2015), including the following steps: (1) discarding the first five volumes for signal equilibrium and participants’ adaptation to the scanning noise; (2) slice timing correction for the time delay between slices; (3) intervolume head motion correction; (4) coregistration of individual T1 images to the functional images; (5) spatial normalization to the Montreal Neurological Institute (MNI) space via deformation fields from tissue segmentation of the T1 images; (6) removing the linear trend of the time courses; (7) bandpass filtration (0.01–0.08 Hz); and (8) regressing out the head motion effect (Friston 24 parameter) (Friston et al., 1996), white matter and cerebrospinal fluid signals. Note that, all nuisance signals were also bandpass filtered (0.01–0.08 Hz) (Hallquist et al., 2013).
Network Construction
For the node definition, we extracted 29 non-overlapping sensorimotor regions of interest (ROI) from a functional brain atlas (Power et al., 2011) as nodes (Table 1 and Figure 1). We calculated the average of weighted blood oxygen level-dependent signals of all voxels in each ROI (with the weights representing gray matter probabilities) as the time course of that ROI. The Pearson correlation coefficients between time courses of each pair of ROIs were then calculated. Thus, we obtained a 29 × 29 correlation matrix for each participant.
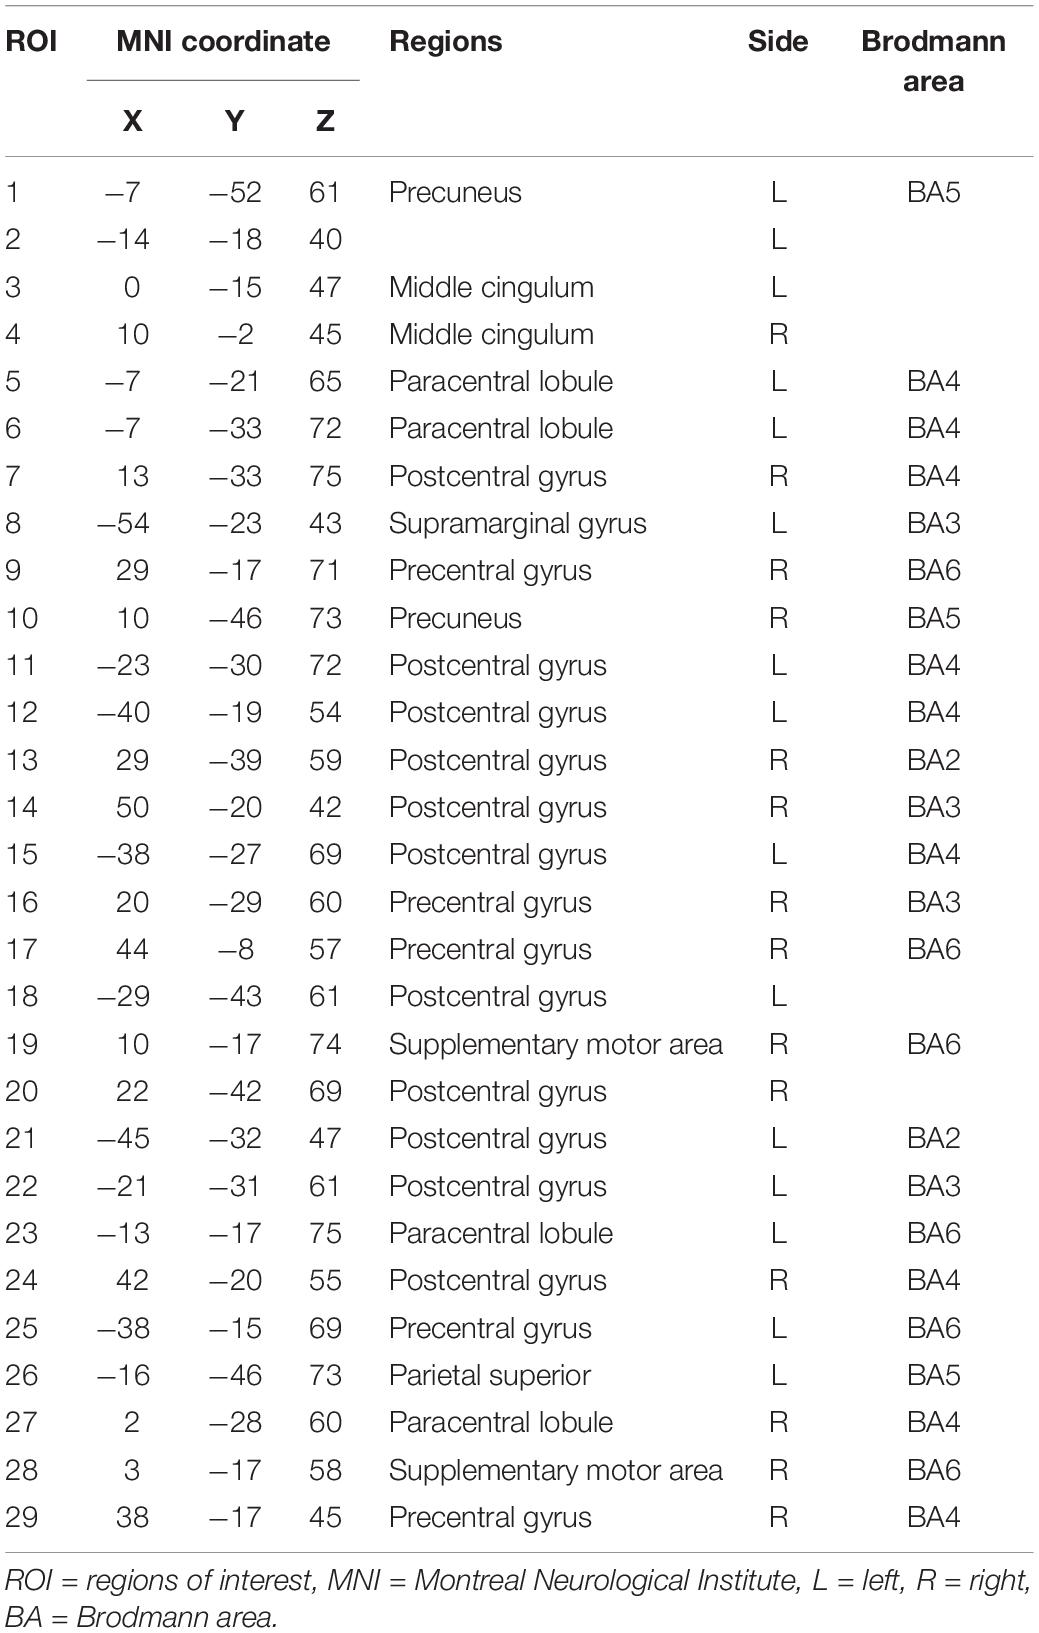
Table 1. Regions of interest in the sensorimotor network.
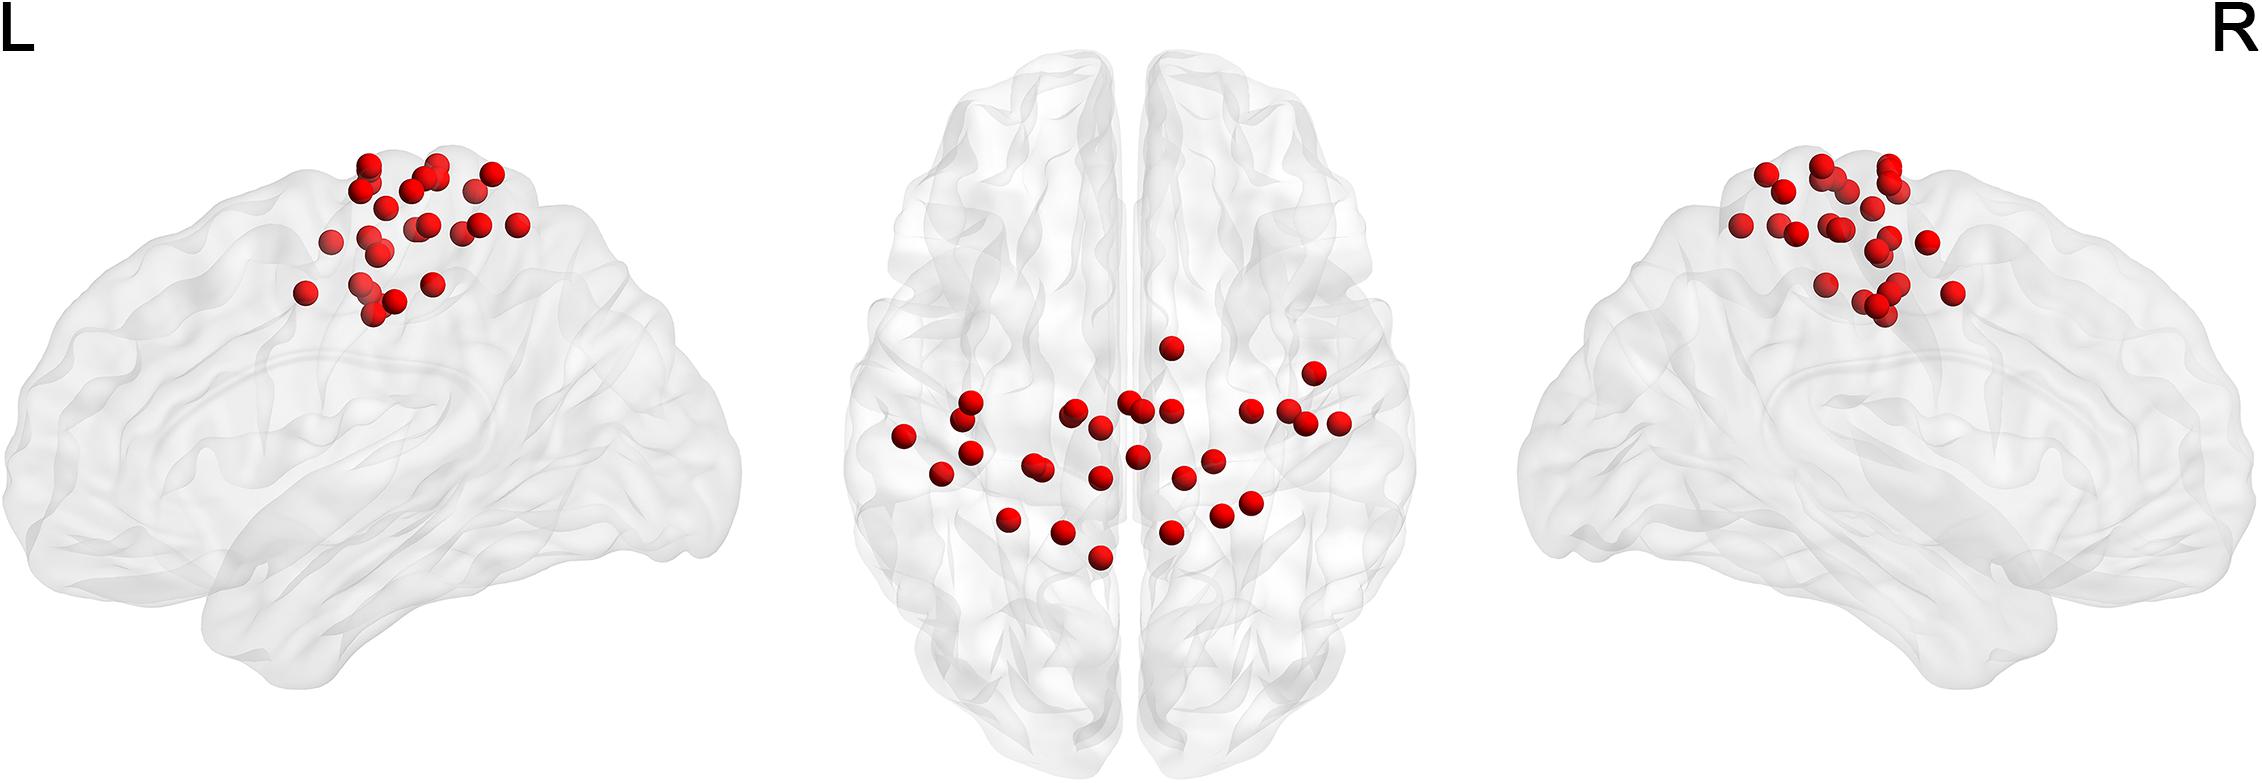
Figure 1. The distribution of 29 ROIs in the sensorimotor network (Power et al., 2011) was visualized in surface space using the BrainNet Viewer (Xia et al., 2013).
To denoise spurious interregional connectivity, a sparsity-based thresholding procedure was employed to ensure the same network density for all participants. We repeatedly converted each matrix into a binary matrix by thresholding all correlation metrics in a sparsity range (from 0.04 to 0.4 at an interval as 0.02), which ensured that the resultant networks had sparse properties (Achard et al., 2006; Wang et al., 2009). It should be noted that the negative correlations were excluded due to the ambiguous interpretation and unfavorable influences on test–retest reliability (Fox et al., 2009; Murphy et al., 2009; Weissenbacher et al., 2009; Wang et al., 2011). We then performed the following network analyses at each sparsity threshold, which resulted in curves of sparsity for each of network metrics listed below.
Network Analysis
After SMN construction, two global metrics (global efficiency and local efficiency) and three nodal centrality metrics (efficiency, degree, and betweenness) were further calculated for each network matrix to characterize their topological organization as previous study (Lv et al., 2019). These metrics were explained below in a binary network G with N nodes and K edges.
Global Metrics
Efficiency is an index which describe the network from the perspective of parallel information flow (Latora and Marchiori, 2001; Achard and Bullmore, 2007). The global efficiency is calculated with following equations:
The dij, computed as the smallest sum of the edges throughout all the possible paths connects node i and node j, denotes the shortest path length between two nodes i and j. The global efficiency reflects the ability of parallel information transmission within the network.
The local efficiency of the network is the average of all nodal efficiencies, which is calculated as follows:
The Eglob(Gi) is the global efficiency of the subgraph of node i (Gi), which is comprised of nodes directly linking to node i. The local efficiency represents the capability of information exchange over each subgraph when the index node is removed.
The normalized local efficiency () and normalized global efficiency () were further calculated by dividing each by the corresponding mean derived from 100 random networks with the same number of nodes, edges and degree distribution as the real network (Maslov and Sneppen, 2002; Milo et al., 2002). The network was topologically organized as a small-world if its normalized global efficiency was approximately equal to 1 and its normalized local efficiency was larger than 1 (Watts and Strogatz, 1998).
Nodal Centrality Metrics
For node i in a network, the nodal degree centrality is calculated as the sum of edges between node i and other nodes:
The nodal efficiency is computed as the reciprocal of the shortest path length between node i and all the other nodes in the network (Achard and Bullmore, 2007):
The nodal betweenness centrality is defined as follows:
where σjk represents the number of the shortest paths between node j and node k. σjk(i) is the number of the shortest paths between node j and node k pass through node i. The area under the curve (the integral over the sparsity range), which is used for subsequent statistical analyses, were further calculated for each network metric of each participant.
Statistical Analysis
The group difference in age and time intervals between rTMS and subsequent MRI scan were measured by one-way analysis of variance (ANOVA). The between-group difference of sex ratio was measured using the chi-square test. For two global network metrics (local efficiency and global efficiency) and three nodal centrality metrics (degree, efficiency, and betweenness), two-way repeated measures ANOVA was performed for each metric with three levels (HF, LF, and SHAM groups) as the between-subject factor and two levels (before and after TMS) as the within-subject factor by using SPSS (Statistical Product and Service Solutions, IBM, United States) software. For each network metric, Bonferroni corrections (p < 0.05) were applied for multiple comparisons. Post hoc comparisons were subsequently performed in those global and nodal metrics with significant interactions (stimulation frequency × MR scanning session) to compare rTMS effects in each group and group differences before or after rTMS application.
For any node showing significant rTMS-related alterations in nodal metrics affected by the rTMS, we subsequently examined functional connectivity (FC) patterns and local activity. For FC, the Pearson’s correlation coefficients between the average time courses of each node and the other 28 ROIs within the SMN were calculated and converted to z-values by Fisher’s r-to-z transformation. To characterize the local activity, the amplitude of low-frequency fluctuation (ALFF) of each node was calculated (Zang et al., 2007). The differences in FC and ALFF values of each node before and after rTMS application were inferred using paired t-tests. A Pearson correlation analysis was also performed to assess the associations between differences in FC or ALFF values and differences in nodal metrics of each node before and after rTMS.
Results
Demographic Characteristics
No adverse effects of TMS was reported by any of participants. No significant differences were found in age (HF, 24 ± 2.56 years; LF, 22.8 ± 3.10 years; SHAM, 22.4 ± 2.16 years; F(2,12) = 1.496, p = 0.236), sex ratio (HF, 7 females; LF, 7 females; SHAM, 6 females; χ2 = 0.18, p = 0.914), and time intervals (between rTMS and the subsequent MRI scan) (HF, 13.93 ± 4.30 min; LF, 14.67 ± 5.01 min; SHAM, 12.40 ± 5.18 min; F(2,12) = 0.855, p = 0.433) among the three groups.
Global Organization of the Functional Sensorimotor Network
Relative to the matched random networks, the SMN showed small-world organization with normalized local efficiency () > 1 (HF = 1.78 ± 1.08; LF = 1.65 ± 0.73; SHAM = 1.65 ± 0.81) and normalized global efficiency () ≈ 1 (HF = 0.90 ± 0.08; LF = 0.91 ± 0.08; SHAM = 0.91 ± 0.08) (Figure 2). These findings suggested that the SMN had a high-efficiency network organization with small-world architectures. Nevertheless, no significant main effects of stimulation frequency (HF, LF, SHAM) and MR scanning session (before and after rTMS) and their interaction were observed in these global metrics.
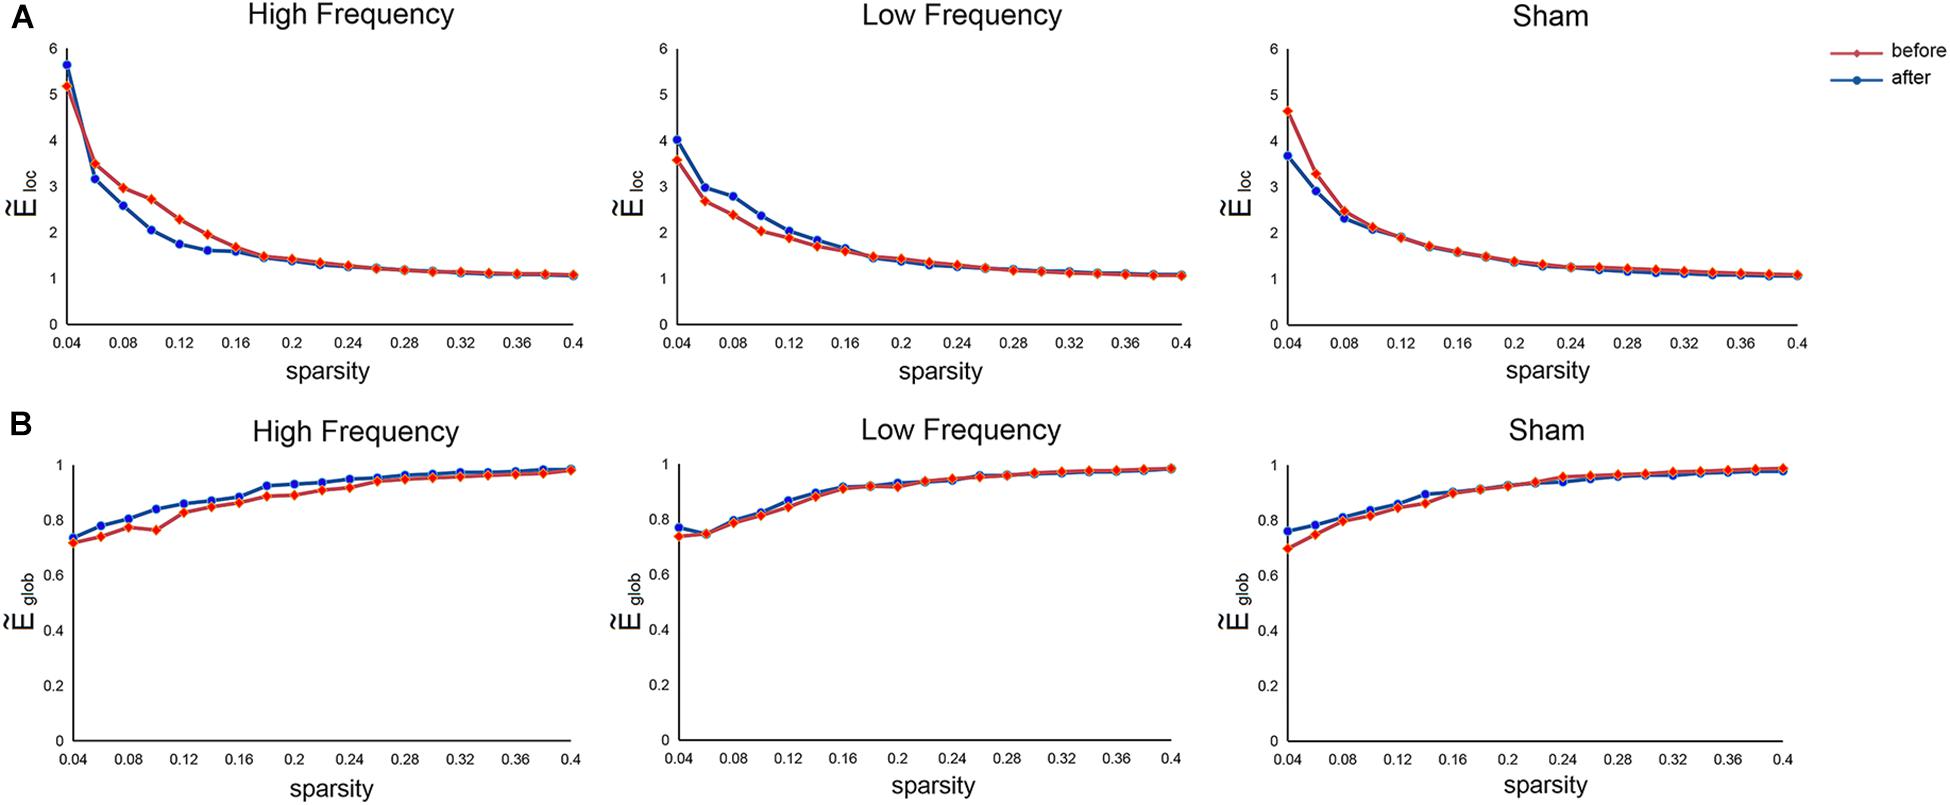
Figure 2. Mean normalized local efficiency (A) and mean normalized global efficiency (B) of the sensorimotor network before and after rTMS. , normalized local efficiency; , normalized global efficiency.
Local Nodal Characteristics of the Functional Sensorimotor Network
Repeated measures ANOVA showed no main effects of stimulation frequency and MR scanning session in nodal centrality metrics (betweenness centrality, degree centrality, and nodal efficiency), while significant interactions were observed in the left paracentral lobule (PCL) (F(2,42) = 3.501, p = 0.039) and right SMA (F(2,42) = 3.756, p = 0.032) for betweenness centrality and in the left PCL (F(2,42) = 3.546, p = 0.038) for degree centrality.
Post hoc comparisons subsequently showed that, compared with the nodal centrality measures before stimulation, stimulation decreased betweenness centrality (p = 0.007, Bonferroni corrected) and degree centrality (p = 0.001, Bonferroni corrected) in the left PCL in the LF group, while the right SMA exhibited decreased betweenness centrality in the HF group (p = 0.043, Bonferroni corrected) (Table 2 and Figure 3).
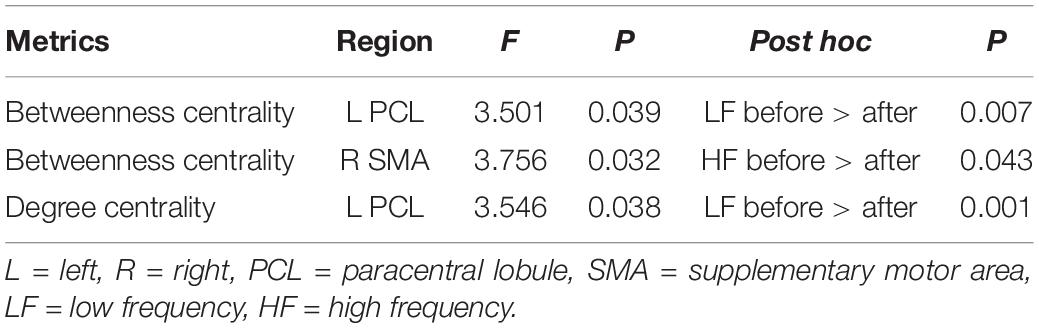
Table 2. The significant interaction effect in nodal topological metrics.
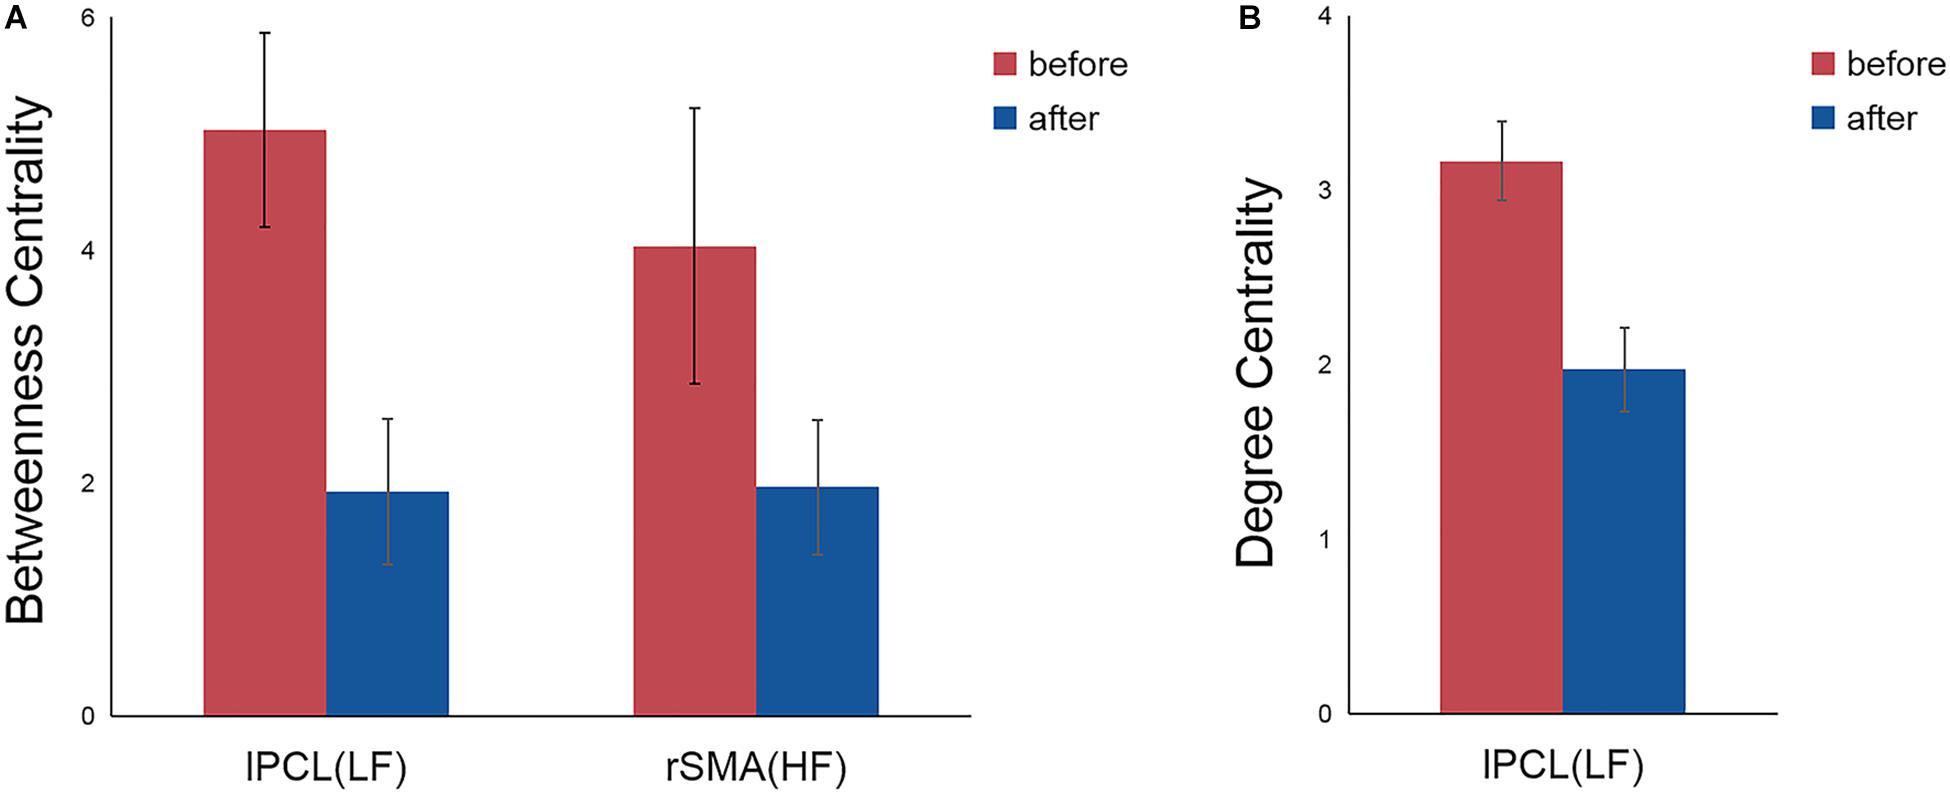
Figure 3. Significant differences in nodal betweenness centrality (A) and nodal degree centrality (B) before and after rTMS. Error bars indicate standard errors. lPCL, left paracentral lobule; rSMA, right supplementary motor area; LF, low-frequency group; HF, high-frequency group.
For the left PCL and the right SMA, we further investigated the alterations of their FC patterns and ALFF values before and after application of different frequency rTMS. We found significantly decreased FC between the left PCL and left M1 (p = 0.006) in the LF group and significantly increased FC between the right SMA and right precentral gyrus (PreCG) (p = 0.004) in the HF group (Figure 4). However, there was no significant correlation between FC alterations and nodal centrality reductions in the left PCL and right SMA. No significant differences in ALFF of the left PCL and right SMA were observed before and after rTMS, while the differences in ALFF positively correlated with the differences in degree centrality in the left PCL before and after rTMS in the LF group (r = 0.5926, p = 0.0199) (Figure 5). That is, the more the ALFF values in the left PCL decreased, the more the degree centrality in the left PCL decreased.
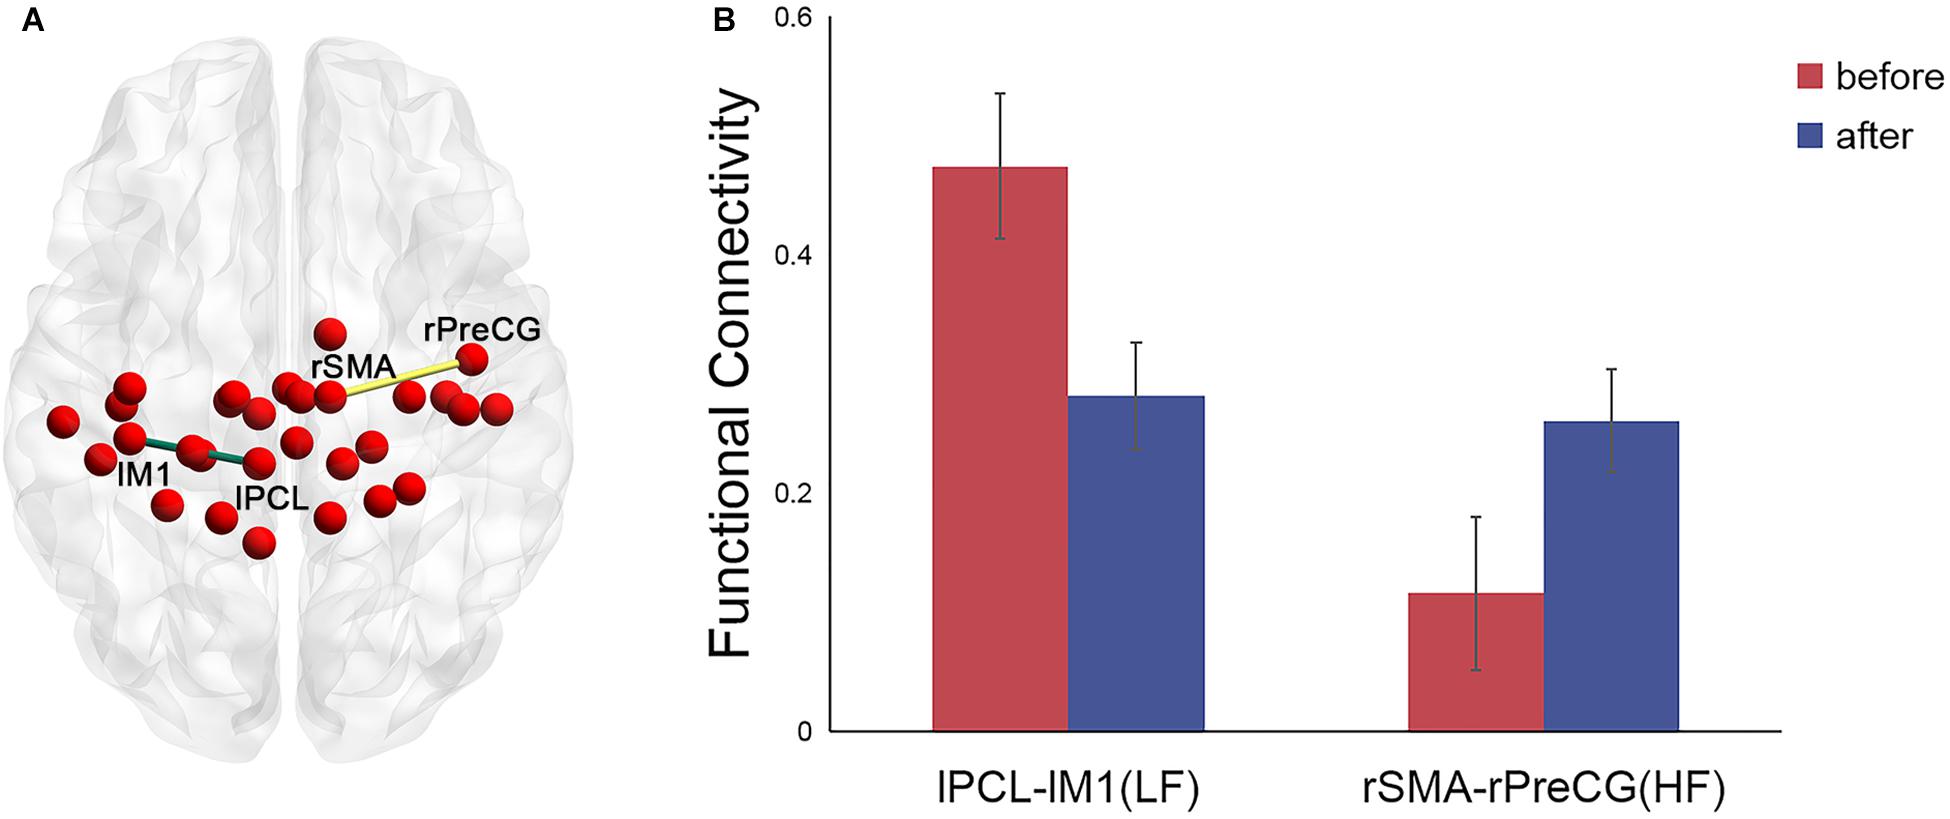
Figure 4. Significant differences in the functional connectivity (FC) patterns in the left PCL and right SMA in the functional sensorimotor network before and after rTMS. (A) Nodes with significantly changed FC were visualized in surface space; (B) FC between the left PCL and left M1 in the LF group and FC between the right SMA and right precentral gyrus in the HF group. Error bars indicate standard errors. lPCL, left paracentral lobule; lM1, left primary motor cortex; rSMA, right supplementary motor area; rPreCG, right precentral gyrus; LF, low-frequency group; HF, high-frequency group.
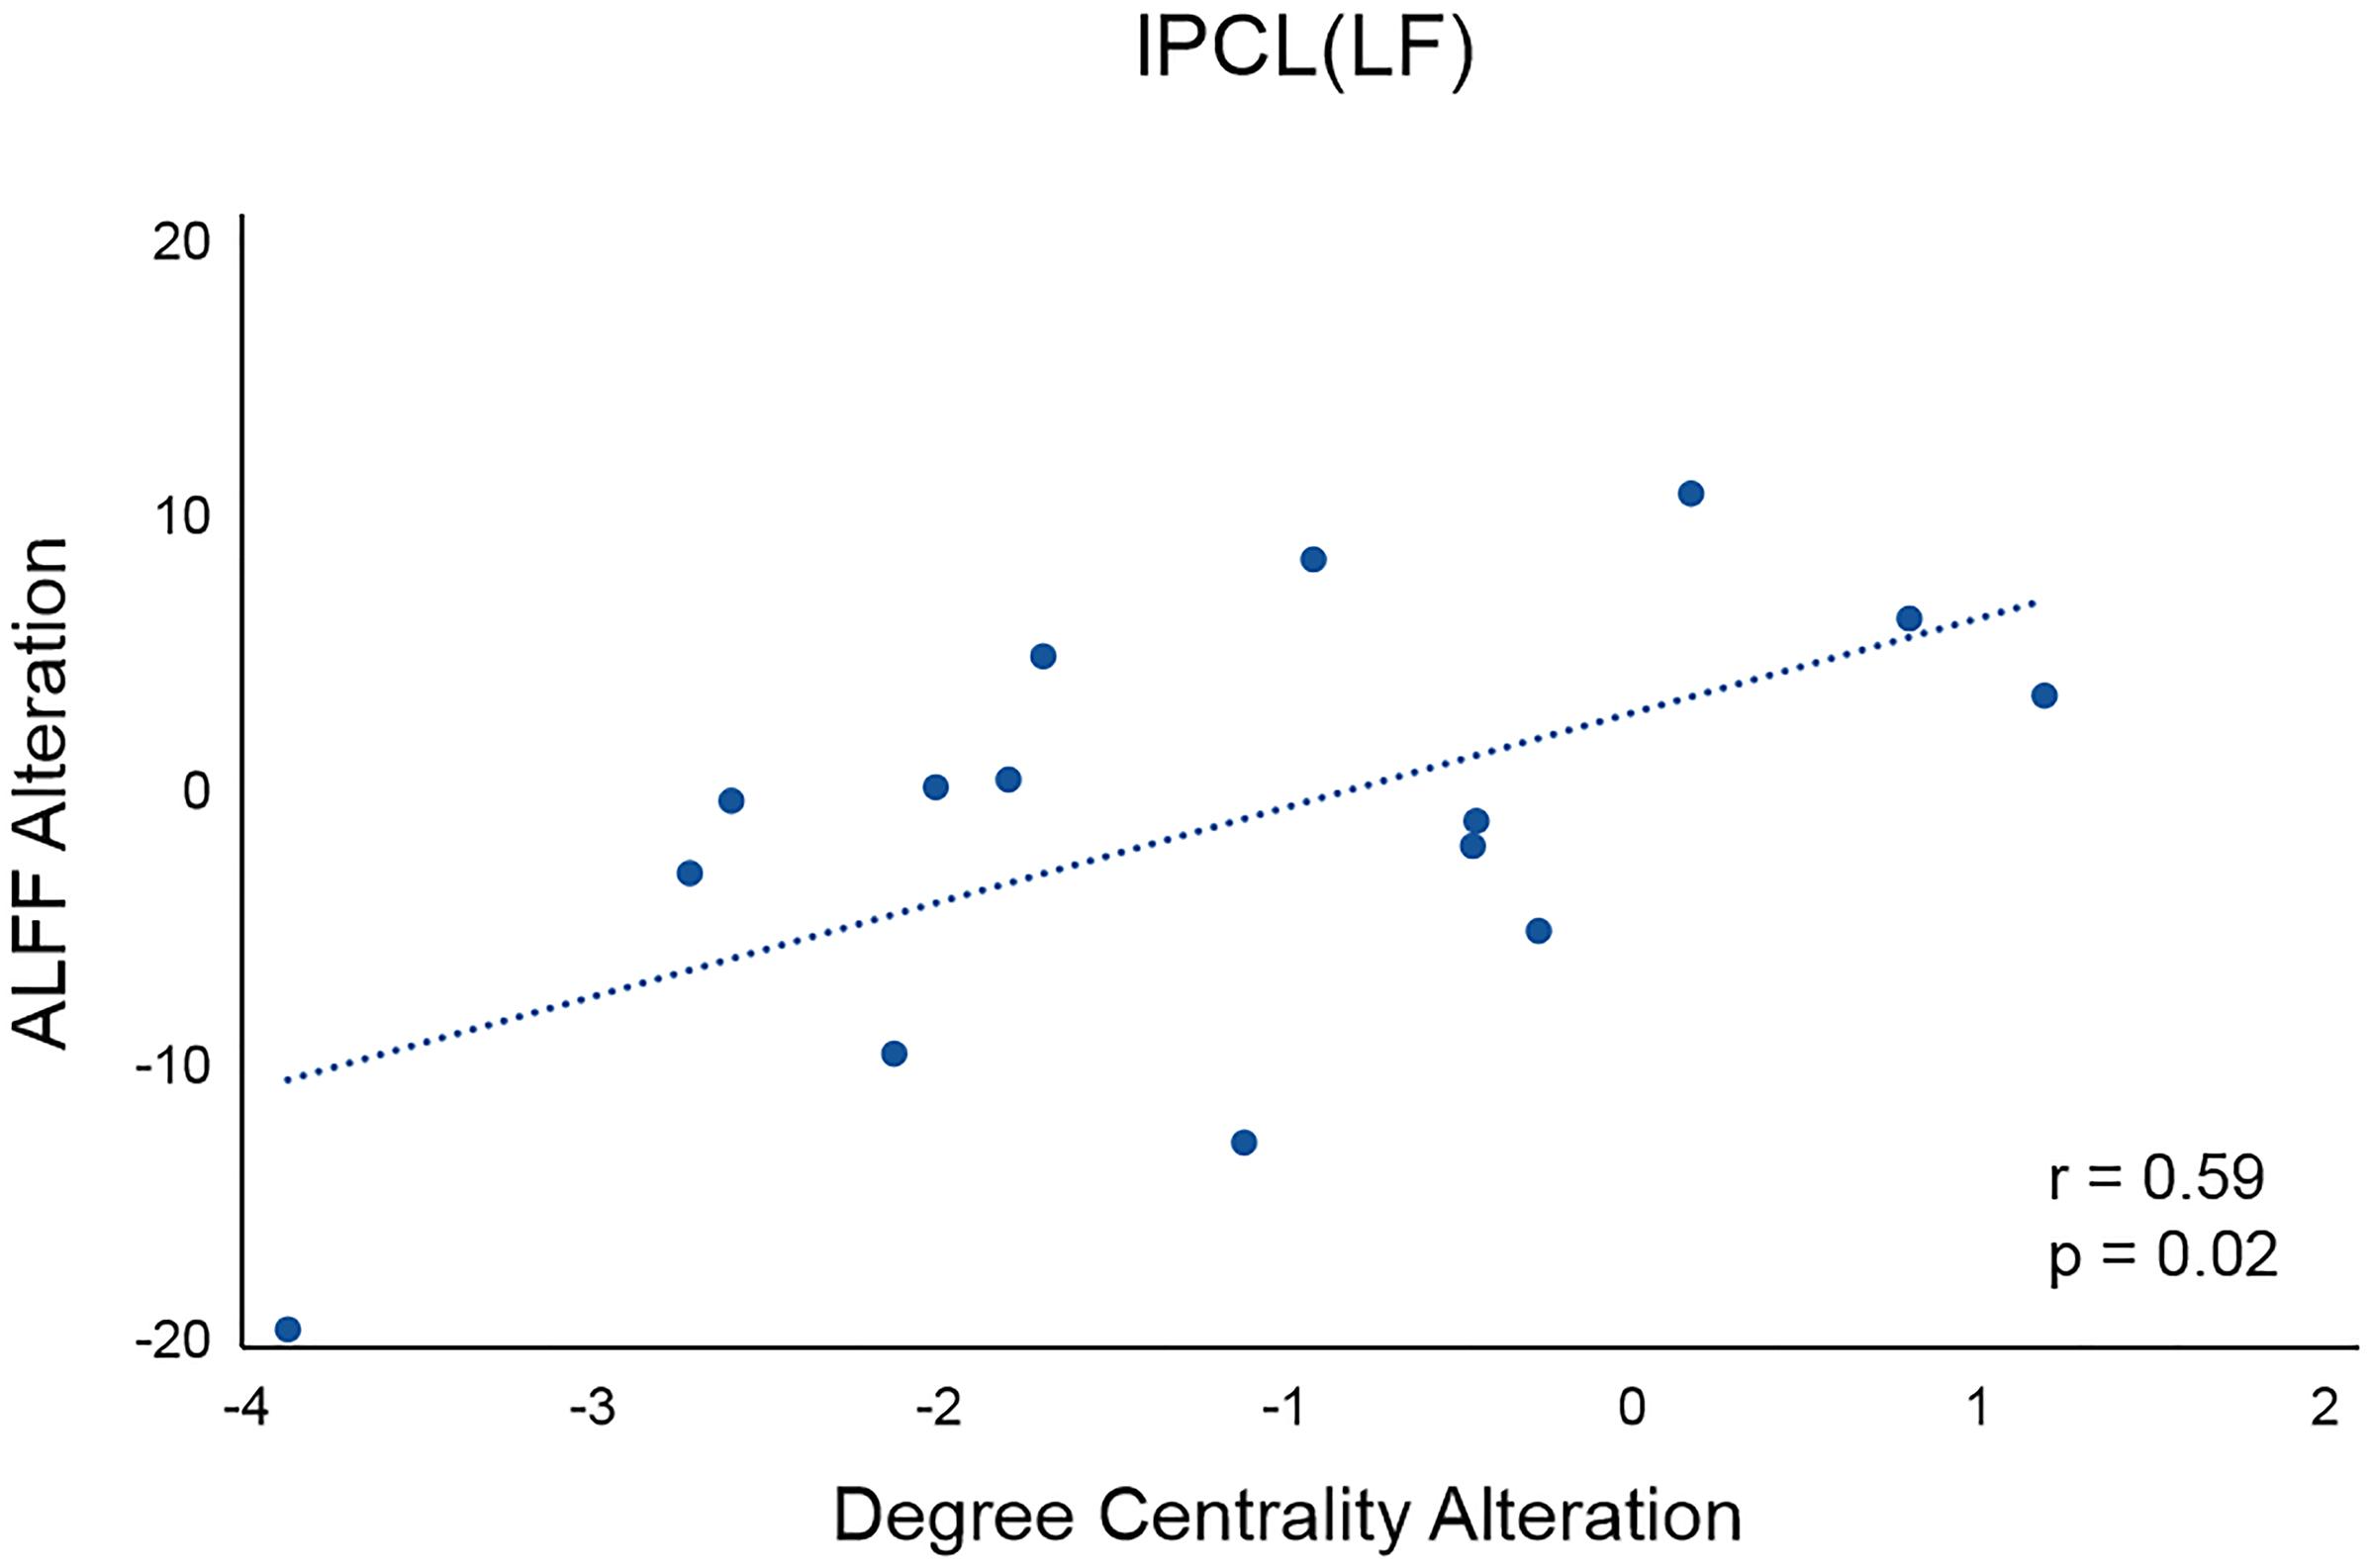
Figure 5. Correlation between the differences in ALFF and the differences in degree centrality in the left PCL before and after rTMS in the LF group. lPCL, left paracentral lobule; LF, low-frequency group.
Discussion
In this study, we employed resting-state fMRI to investigate the topological alterations in functional SMN after application of different frequencies of rTMS over M1. We found that, compared with the network metrics before stimulation, the left PCL showed decreased nodal degree and betweenness centrality when applying low-frequency rTMS over the left M1, while the right SMA exhibited reduced nodal betweenness centrality after stimulation with high-frequency rTMS. Moreover, rTMS-related alterations in nodal metrics might have been attributable to the changes in connectivity patterns and local activity of the affected nodes. Overall, these findings provide evidence that rTMS may affect the topological organizations of functional SMN, which may help to elucidate the mechanisms justifying the application of rTMS in the treatment of patients with motor dysfunctions.
The human brain is a complex, interconnected network that continuously integrates information across distributed brain regions (Wang et al., 2013). Previous studies have demonstrated that the human brain networks exhibited several topological configurations, such as small-worldness, an efficient model to support within- and between-module information transfer (Bassett and Bullmore, 2017; Liao et al., 2017). Here, we observed small-world organizations of functional SMN in all participants before and after application of rTMS over the left M1, indicating an optimal balance between global integration and local specialization within the SMN. However, quantitative comparisons of network efficiency revealed no significant differences among the three groups before and after stimulation, which may suggest the preservation of an optimal wiring layout in the SMN after application of different frequency rTMS. Notably, no significant effect of rTMS on network efficiency may be a consequence of short stimulation time; that is, there was only one rTMS session for each participant. Future studies are needed to further explore whether multiple stimulation sessions may induce alterations in network efficiency.
At a nodal level, the three nodal centrality metrics quantifies the importance of a node in a network. Nodes with high centrality can be categorized as network hubs (Sporns et al., 2007; Buckner et al., 2009). In this study, rTMS-related decreases in centrality were mainly observed in two regions, the left PCL and right SMA, which may indicate that these two regions had dropped influence on the flow of information in the SMN.
In our study, compared to the nodal metrics before stimulation, decreased nodal degree and betweenness centrality in the left PCL, ipsilateral to the stimulation side, were observed after low-frequency rTMS. Specifically, decreased degree centrality was positively associated with decreased ALFF in the left PCL. These findings were consistent with the inhibitory effect of low-frequency rTMS on ipsilateral cortical excitability (Khedr et al., 2009; Corti et al., 2012; Du et al., 2018). The PCL, a U-shaped convolution on the medial hemispheric surface, connects medial portions of the precentral and postcentral gyrus and is involved in motor control and sensory innervations of the limbs (Johns, 2014). Therefore, we suspected that the reduced nodal degree and betweenness centrality in the left PCL may be relevant to reduced abilities in motor control and sensation, which is supported by decreased FC between the left PCL and left M1 after stimulation in the LF group. Low-frequency rTMS has been commonly applied over contralesional M1 in the treatment of stroke patients with motor dysfunction to suppress the excitability of unaffected hemisphere (Khedr et al., 2009; Corti et al., 2012; Du et al., 2018). The results suggested that the PCL may be a key structure for low-frequency rTMS to suppress the activity in the unaffected hemisphere. Thus, it is important to clarify the roles played by the PCL when using low-frequency rTMS for the treatment of stroke patients.
High-frequency rTMS has been shown to increase cortical excitability in the ipsilateral hemisphere (Peinemann et al., 2004; Pascual-Leone et al., 2005; Khedr et al., 2009; Corti et al., 2012; Du et al., 2018). However, in our study, the right SMA, contralateral to the stimulation site, showed decreased betweenness centrality after high-frequency rTMS. Thus, we propose that the high-frequency rTMS may inhibit the activity in the contralateral hemisphere. The SMA locates in front of PCL (Johns, 2014) and projects to both ipsilateral and contralateral and primary motor cortices (Pandya and Vignolo, 1971; Muakkassa and Strick, 1979). Recent fMRI studies have shown that the interhemispheric connections of the SMA played an important role in coordinating bimanual movements (Stanák et al., 2003; Seitz et al., 2004), especially in mediating intended actions and suppressing unintended movements. The SMA has a suppressive influence over contralateral M1 to prevent motor execution (Grefkes et al., 2008; Kasess et al., 2008). Previous studies in one patient with restricted lesion within the SMA also showed the automatic suppression of motor plans by the SMA (Nachev et al., 2007; Sumner et al., 2007). The results in our study implied that the decreased centrality in the right SMA may have reduced the inhibitory effect on the left M1, which means increased excitability on the stimulated side. Notably, no significant differences in FC between right SMA and left M1 before and after rTMS were observed, and thus, the reduced suppressive effect of the right SMA on the stimulated side after application of high-frequency rTMS needs to be elucidated in future studies.
Repetitive TMS is a non-invasive technique that could induce sustained influence on brain plasticity (Rounis et al., 2005; Yoo et al., 2008). However, the effect of rTMS depends on various factors, such as the frequency, intensity of stimulation, and the number of delivered stimuli. Generally, high-frequency rTMS tend to induce excitation of the motor network, while low-frequency rTMS can produce the inhibitory effect on cortical excitability. 1 Hz was the most commonly used when applying low-frequency rTMS (Corti et al., 2012; Hsu et al., 2012). Regarding the high-frequency rTMS, different frequency rates has been adopted in previous studies, such as 3 Hz, 5 Hz, 10 Hz (Chang et al., 2010; Emara et al., 2010; Khedr et al., 2010). However, it has been indicated that rTMS with higher-frequency rate was associated with increased electromyographic bursting and spread of excitation, which means higher risk of seizure (Lomarev et al., 2007). Moreover, Khedr et al. (2010) compared the long-term effect of 3 and 10 Hz rTMS on recovery of motor function in stroke patients and found that rTMS at 3 Hz seemed to produce greater changes in strength and clinical rating scales although not reached significant level. In this case, 3 Hz which adopted in our study may be a safer choice for high frequency stimulation, especially for the patients with motor dysfunctions. As the preliminary study for applying rTMS in the treatment of stroke patients, our study defined high-frequency as >1 Hz and low-frequency as ≤1 Hz which was also consistent with previous systematic review (Corti et al., 2012) and meta-analysis (Hsu et al., 2012). However, given that high-frequency rTMS at different frequency rates may induce different degree of impacts on brain’s plasticity (Khedr et al., 2010), it is important for future studies to examine the similarities and differences in their effects among these frequency rates. The intensity of rTMS has also been suggested as a critical factor of its effects. Previous studies demonstrated that suprathreshold (above RMT) rTMS at low frequency (1 Hz) could induce lasting inhibitory effect on cortical excitability (Chen et al., 1997; Muellbacher et al., 2000), and subthreshold (below RMT) stimulation at low frequency (1 Hz) could also decrease cortical excitability though with weaker aftereffects when compared with suprathreshold stimulation (Siebner et al., 1999; Touge et al., 2001; Sommer et al., 2002). Suprathreshold high-frequency rTMS tend to increase the corticospinal excitability (Pascual-Leone et al., 1994; Wu et al., 2000), while high-frequency rTMS with subthreshold intensity has been shown to induce different effects on cortical excitability: facilitatory (Maeda et al., 2000a, b) or inhibitory effects (Peinemann et al., 2000; Di Lazzaro et al., 2002; Todd et al., 2006). One possible explanation for this discrepancy is short period of stimulation (in other words, the small number of stimuli delivered), which has been proven to be an important factor of rTMS effects. Prolonged period (≥900 stimuli) of high-frequency rTMS at subthreshold intensities could increase overall cortical excitability (Touge et al., 2001; Quartarone et al., 2005). For example, Quartarone et al. (2005) showed 5 Hz rTMS with 90% RMT and 1500 stimuli provoked an overall increase in corticospinal excitability. Accordingly, 1500 stimuli delivered with subthreshold intensity (90% RMT) at high frequency in our study should induce the similar faciliatory effect on motor cortical excitability. However, our study only explored the effect of rTMS with subthreshold intensity, which is unable to reveal the alterations induced by rTMS with suprathreshold intensity. Future studies applying rTMS with both suprathreshold and subthreshold at different frequencies may help clarify their influence on the topological organizations of SMN.
There are several limitations in our study that need to be addressed. First, the stimulation time of rTMS may have been too short to detect topological alterations in the SMN. As the application of rTMS in the treatment of patients always lasts several weeks, future studies with longer stimulation time are required to examine the effects of rTMS on SMN. Second, we failed to collect behavioral data in this study, and thus cannot examine behavioral alterations in motor function. Future studies with behavioral data collected before and after rTMS can help clarify this issue. Finally, recent evidence indicated that increasing the acquisition time (>13 min) could bring better reliability of rs-fMRI connectivity analyses (Birn et al., 2013). Future studies utilizing longer scanning time for rs-fMRI data acquisition may help test the reliability of our results.
Data Availability Statement
The datasets generated for this study are available on request to the corresponding author.
Ethics Statement
The studies involving human participants were reviewed and approved by the Ethics Committee of the Center for Cognition and Brain Disorders at Hangzhou Normal University. The patients/participants provided their written informed consent to participate in this study.
Author Contributions
WW and TZ contributed equally to this work as co-first author, who performed all data analysis and wrote the manuscript. XW and LL contributed the collection of MRI data and application of rTMS. QZ contributed the manuscript revision. YL contributed the conception of the study and manuscript revision. All authors read and approved the submitted version.
Funding
This work was supported by grants from the National Key R&D Program of China (No. 2017YFC1310000), the National Natural Science Foundation of China (Nos. 81771911 and 81301210), and China’s National Strategic Basic Research Program (“973”) grant (2015CB856400).
Conflict of Interest
The authors declare that the research was conducted in the absence of any commercial or financial relationships that could be construed as a potential conflict of interest.
Footnotes
References
Achard, S., and Bullmore, E. (2007). Efficiency and cost of economical brain functional networks. PLoS Comput. Biol. 3:e17. doi: 10.1371/journal.pcbi.0030017
Achard, S., Salvador, R., Whitcher, B., Suckling, J., and Bullmore, E. D. (2006). A resilient, low-frequency, small-world human brain functional network with highly connected association cortical hubs. J. Neurosci. 26, 63–72. doi: 10.1523/jneurosci.3874-05.2006
Barch, D. M. (2013). Brain network interactions in health and disease. Trends Cogn. Sci. 17, 603–605. doi: 10.1016/j.tics.2013.09.004
Bassett, D. S., and Bullmore, E. T. (2009). Human brain networks in health and disease. Curr. Opin. Neurol. 22, 340–347. doi: 10.1097/wco.0b013e32832d93dd
Bassett, D. S., and Bullmore, E. T. (2017). Small-world brain networks revisited. Neuroscientist 23, 499–516. doi: 10.1177/1073858416667720
Bestmann, S., Baudewig, J., Siebner, H. R., Rothwell, J. C., and Frahm, J. (2003). Subthreshold high-frequency TMS of human primary motor cortex modulates interconnected frontal motor areas as detected by interleaved fMRI-TMS. Neuroimage 20, 1685–1696. doi: 10.1016/j.neuroimage.2003.07.028
Bestmann, S., Baudewig, J., Siebner, H. R., Rothwell, J. C., and Frahm, J. (2004). Functional MRI of the immediate impact of transcranial magnetic stimulation on cortical and subcortical motor circuits. Eur. J. Neurosci. 19, 1950–1962. doi: 10.1111/j.1460-9568.2004.03277.x
Birn, R. M., Molloy, E. K., Patriat, R., Parker, T., Meier, T. B., Kirk, G. R., et al. (2013). The effect of scan length on the reliability of resting-state fMRI connectivity estimates. Neuroimage 83, 550–558. doi: 10.1016/j.neuroimage.2013.05.099
Biswal, B., Zerrin Yetkin, F., Haughton, V. M., and Hyde, J. S. (1995). Functional connectivity in the motor cortex of resting human brain using echo-planar MRI. Magn. Reson. Med. 34, 537–541. doi: 10.1002/mrm.1910340409
Buckner, R. L., Sepulcre, J., Talukdar, T., Krienen, F. M., Liu, H., Hedden, T., et al. (2009). Cortical hubs revealed by intrinsic functional connectivity: mapping, assessment of stability, and relation to Alzheimer’s disease. J. Neurosci. 29, 1860–1873. doi: 10.1523/jneurosci.5062-08.2009
Bullmore, E., and Sporns, O. (2009). Complex brain networks: graph theoretical analysis of structural and functional systems. Nat. Rev. Neurosci. 10, 186–198. doi: 10.1038/nrn2575
Cárdenas-Morales, L., Volz, L. J., Michely, J., Rehme, A. K., Pool, E.-M., Nettekoven, C., et al. (2013). Network connectivity and individual responses to brain stimulation in the human motor system. Cereb. Cortex 24, 1697–1707. doi: 10.1093/cercor/bht023
Chang, W. H., Kim, Y. H., Bang, O. Y., Kim, S. T., and Lee, P. K. W. (2010). Long-term effects of rTMS on motor recovery in patients after subacute stroke. J. Rehabil. Med. 42, 758–764. doi: 10.2340/16501977-0590
Chen, R., Classen, J., Gerloff, C., Celnik, P., Wassermann, E. M., Hallett, M., et al. (1997). Depression of motor cortex excitability by low-frequency transcranial magnetic stimulation. Neurology 48, 1398–1403. doi: 10.1212/wnl.48.5.1398
Corti, M., Patten, C., and Triggs, W. (2012). Repetitive transcranial magnetic stimulation of motor cortex after stroke: a focused review. Am. J. Phys. Med. Rehabil. 91, 254–270. doi: 10.1097/phm.0b013e318228bf0c
Craddock, R. C., Jbabdi, S., Yan, C.-G., Vogelstein, J. T., Castellanos, F. X., Di Martino, A., et al. (2013). Imaging human connectomes at the macroscale. Nat. Methods 10, 524–539. doi: 10.1038/nmeth.2482
Di Lazzaro, V., Oliviero, A., Mazzone, P., Pilato, F., Saturno, E., Dileone, M., et al. (2002). Short-term reduction of intracortical inhibition in the human motor cortex induced by repetitive transcranial magnetic stimulation. Exp. Brain Res. 147, 108–113. doi: 10.1007/s00221-002-1223-5
Du, J., Yang, F., Hu, J., Hu, J., Xu, Q., Cong, N., et al. (2018). Effects of high- and low-frequency repetitive transcranial magnetic stimulation on motor recovery in early stroke patients: evidence from a randomized controlled trial with clinical, neurophysiological and functional imaging assessments. Neuroimage Clin. 21:101620. doi: 10.1016/j.nicl.2018.101620
Emara, T. H., Moustafa, R. R., Elnahas, N. M., Elganzoury, A. M., Abdo, T. A., Mohamed, S. A., et al. (2010). Repetitive transcranial magnetic stimulation at 1 Hz and 5 Hz produces sustained improvement in motor function and disability after ischaemic stroke. Eur. J. Neurol. 17, 1203–1209. doi: 10.1111/j.1468-1331.2010.03000.x
Fox, M. D., Buckner, R. L., White, M. P., Greicius, M. D., and Pascual-Leone, A. (2012). Efficacy of transcranial magnetic stimulation targets for depression is related to intrinsic functional connectivity with the subgenual cingulate. Biol. Psychiatry 72, 595–603. doi: 10.1016/j.biopsych.2012.04.028
Fox, M. D., Zhang, D., Snyder, A. Z., and Raichle, M. E. (2009). The global signal and observed anticorrelated resting state brain networks. J. Neurophysiol. 101, 3270–3283. doi: 10.1152/jn.90777.2008
Friston, K. J., Williams, S., Howard, R., Frackowiak, R. S. J., and Turner, R. (1996). Movement-Related effects in fMRI time-series. Magn. Reson. Med. 35, 346–355. doi: 10.1002/mrm.1910350312
González-García, N., Armony, J. L., Soto, J., Trejo, D., Alegría, M. A., and Drucker-Colín, R. (2011). Effects of rTMS on Parkinson’s disease: a longitudinal fMRI study. J. Neurol. 258, 1268–1280. doi: 10.1007/s00415-011-5923-2
Grefkes, C., Eickhoff, S. B., Nowak, D. A., Dafotakis, M., and Fink, G. R. (2008). Dynamic intra- and interhemispheric interactions during unilateral and bilateral hand movements assessed with fMRI and DCM. Neuroimage 41, 1382–1394. doi: 10.1016/j.neuroimage.2008.03.048
Hallett, M. (2007). Transcranial magnetic stimulation: a primer. Neuron 55, 187–199. doi: 10.1016/j.neuron.2007.06.026
Hallquist, M. N., Hwang, K., and Luna, B. (2013). The nuisance of nuisance regression: spectral misspecification in a common approach to resting-state fMRI preprocessing reintroduces noise and obscures functional connectivity. Neuroimage 82, 208–225. doi: 10.1016/j.neuroimage.2013.05.116
He, Y., and Evans, A. (2010). Graph theoretical modeling of brain connectivity. Curr. Opin. Neurol. 23, 341–350. doi: 10.1097/wco.0b013e32833aa567
Hsu, W. Y., Cheng, C. H., Liao, K. K., Lee, I. H., and Lin, Y. Y. (2012). Effects of repetitive transcranial magnetic stimulation on motor functions in patients with stroke: a meta-analysis. Stroke 43, 1849–1857. doi: 10.3760/cma.j.issn.0376-2491.2017.47.012
Kasess, C. H., Windischberger, C., Cunnington, R., Lanzenberger, R., Pezawas, L., and Moser, E. (2008). The suppressive influence of SMA on M1 in motor imagery revealed by fMRI and dynamic causal modeling. Neuroimage 40, 828–837. doi: 10.1016/j.neuroimage.2007.11.040
Khedr, E. M., Abdel-Fadeil, M. R., Farghali, A., and Qaid, M. (2009). Role of 1 and 3 Hz repetitive transcranial magnetic stimulation on motor function recovery after acute ischaemic stroke. Eur. J. Neurol. 16, 1323–1330. doi: 10.1111/j.1468-1331.2009.02746.x
Khedr, E. M., Etraby, A. E., Hemeda, M., Nasef, A. M., and Razek, A. A. E. (2010). Long-term effect of repetitive transcranial magnetic stimulation on motor function recovery after acute ischemic stroke. Acta Neurol. Scand. 121, 30–37. doi: 10.1111/j.1600-0404.2009.01195.x
Latora, V., and Marchiori, M. (2001). Efficient behavior of small-world networks. Phys. Rev. Lett. 87:198701. doi: 10.1103/physrevlett.87.198701
Liao, X., Vasilakos, A. V., and He, Y. (2017). Small-world human brain networks: perspectives and challenges. Neurosci. Biobehav. Rev. 77, 286–300. doi: 10.1016/j.neubiorev.2017.03.018
Lomarev, M. P., Kanchana, S., Bara-Jimenez, W., Iyer, M., Wassermann, E. M., and Hallett, M. (2006). Placebo-controlled study of rTMS for the treatment of Parkinson’s disease. Mov. Disord. 21, 325–331. doi: 10.1002/mds.20713
Lomarev, M. P., Kim, D. Y., Richardson, S. P., Voller, B., and Hallett, M. (2007). Safety study of high-frequency transcranial magnetic stimulation in patients with chronic stroke. Clin. Neurophysiol. 118, 2072–2075. doi: 10.1016/j.clinph.2007.06.016
Lv, Y., Han, X., Song, Y., Han, Y., Zhou, C., Zhou, D., et al. (2019). Toward neuroimaging-based network biomarkers for transient ischemic attack. Hum. Brain Mapp. 40, 3347–3361. doi: 10.1002/hbm.24602
Maeda, F., Keenan, J. P., Tormos, J. M., Topka, H., and Pascual-Leone, A. (2000a). Interindividual variability of the modulatory effects of repetitive transcranial magnetic stimulation on cortical excitability. Exp. Brain Res. 133, 425–430. doi: 10.1007/s002210000432
Maeda, F., Keenan, J. P., Tormos, J. M., Topka, H., and Pascual-Leone, A. (2000b). Modulation of corticospinal excitability by repetitive transcranial magnetic stimulation. Clin. Neurophysiol. 111, 800–805. doi: 10.1016/s1388-2457(99)00323-5
Maslov, S., and Sneppen, K. (2002). Specificity and stability in topology of protein networks. Science 296, 910–913. doi: 10.1126/science.1065103
Milo, R., Shen-Orr, S., Itzkovitz, S., Kashtan, N., Chklovskii, D., and Alon, U. (2002). Network motifs: simple building blocks of complex networks. Science 298, 824–827. doi: 10.1126/science.298.5594.824
Muakkassa, K. F., and Strick, P. L. (1979). Frontal lobe inputs to primate motor cortex: evidence for four somatotopically organized “premotor” areas. Brain Res. 177, 176–182. doi: 10.1016/0006-8993(79)90928-4
Muellbacher, W., Ziemann, U., Boroojerdi, B., and Hallett, M. (2000). Effects of low-frequency transcranial magnetic stimulation on motor excitability and basic motor behavior. Clin. Neurophysiol. 111, 1002–1007. doi: 10.1016/s1388-2457(00)00284-4
Murphy, K., Birn, R. M., Handwerker, D. A., Jones, T. B., and Bandettini, P. A. (2009). The impact of global signal regression on resting state correlations: are anti-correlated networks introduced? Neuroimage 44, 893–905. doi: 10.1016/j.neuroimage.2008.09.036
Nachev, P., Wydell, H., O’Neill, K., Husain, M., and Kennard, C. (2007). The role of the pre-supplementary motor area in the control of action. Neuroimage 36, T155–T163. doi: 10.1016/j.neuroimage.2007.03.034
Pandya, D. N., and Vignolo, L. A. (1971). Intra-and interhemispheric projections of the precentral, premotor and arcuate areas in the rhesus monkey. Brain Res. 26, 217–233. doi: 10.1016/0006-8993(71)90215-0
Park, C., Chang, W. H., Yoo, W. K., Shin, Y. I., Kim, S. T., and Kim, Y. H. (2014). Brain topological correlates of motor performance changes after repetitive transcranial magnetic stimulation. Brain Connect. 4, 265–272. doi: 10.1089/brain.2013.0187
Pascual-Leone, A., Amedi, A., Fregni, F., and Merabet, L. B. (2005). The plastic human brain cortex. Annu. Rev. Neurosci. 28, 377–401. doi: 10.1146/annurev.neuro.27.070203.144216
Pascual-Leone, A., Valls-Solé, J., Wassermann, E. M., and Hallett, M. (1994). Responses to rapid-rate transcranial magnetic stimulation of the human motor cortex. Brain 117, 847–858. doi: 10.1093/brain/117.4.847
Paus, T., Jech, R., Thompson, C. J., Comeau, R., Peters, T., and Evans, A. C. (1997). Transcranial magnetic stimulation during positron emission tomography: a new method for studying connectivity of the human cerebral cortex. J. Neurosci. 17, 3178–3184. doi: 10.1523/jneurosci.17-09-03178.1997
Peinemann, A., Lehner, C., Mentschel, C., Münchau, A., Conrad, B., and Siebner, H. R. (2000). Subthreshold 5-Hz repetitive transcranial magnetic stimulation of the human primary motor cortex reduces intracortical paired-pulse inhibition. Neurosci. Lett. 296, 21–24. doi: 10.1016/S0304-3940(00)01616-5
Peinemann, A., Reimer, B., Löer, C., Quartarone, A., Münchau, A., Conrad, B., et al. (2004). Long-lasting increase in corticospinal excitability after 1800 pulses of subthreshold 5 Hz repetitive TMS to the primary motor cortex. Clin. Neurophysiol. 115, 1519–1526. doi: 10.1016/j.clinph.2004.02.005
Power, J. D., Cohen, A. L., Nelson, S. M., Wig, G. S., Barnes, K. A., Church, J. A., et al. (2011). Functional network organization of the human brain. Neuron 72, 665–678. doi: 10.1016/j.neuron.2011.09.006
Quartarone, A., Bagnato, S., Rizzo, V., Morgante, F., Sant’Angelo, A., Battaglia, F., et al. (2005). Distinct changes in cortical and spinal excitability following high-frequency repetitive TMS to the human motor cortex. Exp. Brain Res. 161, 114–124. doi: 10.1007/s00221-004-2052-5
Rossini, P. M., Barker, A. T., Berardelli, A., Caramia, M. D., Caruso, G., Cracco, R. Q., et al. (1994). Non-invasive electrical and magnetic stimulation of the brain, spinal cord and roots: basic principles and procedures for routine clinical application. Report of an IFCN committee. Electroencephalogr. Clin. Neurophysiol. 91, 79–92. doi: 10.1016/0013-4694(94)90029-9
Rothwell, J. C., Hallett, M., Berardelli, A., Eisen, A., Rossini, P., and Paulus, W. (1999). Magnetic stimulation: motor evoked potentials. Electroencephalogr. Clin. Neurophysiol. Suppl. 52, 97–103.
Rounis, E., Lee, L., Siebner, H. R., Rowe, J. B., Friston, K. J., Rothwell, J. C., et al. (2005). Frequency specific changes in regional cerebral blood flow and motor system connectivity following rTMS to the primary motor cortex. Neuroimage 26, 164–176. doi: 10.1016/j.neuroimage.2005.01.037
Salinas, F. S., Franklin, C., Narayana, S., Szabó, C. Á, and Fox, P. T. (2016). Repetitive transcranial magnetic stimulation educes frequency-specific causal relationships in the motor network. Brain Stimul. 9, 406–414. doi: 10.1016/j.brs.2016.02.006
Salinas, F. S., Narayana, S., Zhang, W., Fox, P. T., and Szabó, C. Á (2013). Repetitive transcranial magnetic stimulation elicits rate-dependent brain network responses in non-human primates. Brain Stimul. 6, 777–787. doi: 10.1016/j.brs.2013.03.002
Salinas, F. S., Szabó, C. Á, Zhang, W., Jones, L., Leland, M. M., Wey, H. Y., et al. (2011). Functional neuroimaging of the baboon during concurrent image-guided transcranial magnetic stimulation. Neuroimage 57, 1393–1401. doi: 10.1016/j.neuroimage.2011.05.065
Seitz, R. J., Kleiser, R., Bütefisch, C. M., Jörgens, S., Neuhaus, O., Hartung, H. P., et al. (2004). Bimanual recoupling by visual cueing in callosal disconnection. Neurocase 10, 316–325. doi: 10.1080/13554790490505373
Siebner, H. R., Tormos, J. M., Ceballos-Baumann, A. O., Auer, C., Catala, M. D., Conrad, B., et al. (1999). Low-frequency repetitive transcranial magnetic stimulation of the motor cortex in writer’s cramp. Neurology 52, 529–529. doi: 10.1212/WNL.52.3.529
Sommer, M., Lang, N., Tergau, F., and Paulus, W. (2002). Neuronal tissue polarization induced by repetitive transcranial magnetic stimulation? Neuroreport 13, 809–811. doi: 10.1097/00001756-200205070-00015
Sporns, O. (2014). Contributions and challenges for network models in cognitive neuroscience. Nat. Neurosci. 17, 652–660. doi: 10.1038/nn.3690
Sporns, O., Honey, C. J., and Kötter, R. (2007). Identification and Classification of Hubs in Brain Networks. PLoS One 2:e1049. doi: 10.1371/journal.pone.0001049
Stanák, A., Cohen, E. R., Seidler, R. D., Duong, T. Q., and Kim, S. G. (2003). The size of corpus callosum correlates with functional activation of medial motor corical areas in bimanual and unimanual movements. Cereb. Cortex 13, 475–485. doi: 10.1093/cercor/13.5.475
Sumner, P., Nachev, P., Morris, P., Peters, A. M., Jackson, S. R., Kennard, C., et al. (2007). Human medial frontal cortex mediates unconscious inhibition of voluntary action. Neuron 54, 697–711. doi: 10.1016/j.neuron.2007.05.016
Todd, G., Flavel, S. C., and Ridding, M. C. (2006). Low-intensity repetitive transcranial magnetic stimulation decreases motor cortical excitability in humans. J. Appl. Physiol. 101, 500–505. doi: 10.1152/japplphysiol.01399.2005
Touge, T., Gerschlager, W., Brown, P., and Rothwell, J. C. (2001). Are the after-effects of low-frequency rTMS on motor cortex excitability due to changes in the efficacy of cortical synapses? Clin. Neurophysiol. 112, 2138–2145. doi: 10.1016/s1388-2457(01)00651-4
van den Heuvel, M. P., and Sporns, O. (2013). Network hubs in the human brain. Trends Cogn. Sci. 17, 683–696. doi: 10.1016/j.tics.2013.09.012
Wang, J., Wang, L., Zang, Y., Yang, H., Tang, H., Gong, Q., et al. (2009). Parcellation-dependent small-world brain functional networks: a resting-state fMRI study. Hum. Brain Mapp. 30, 1511–1523. doi: 10.1002/hbm.20623
Wang, J., Wang, X., Xia, M., Liao, X., Evans, A., and He, Y. (2015). GRETNA: a graph theoretical network analysis toolbox for imaging connectomics. Front. Hum. Neurosci. 9:386. doi: 10.3389/fnhum.2015.00386
Wang, J., Zuo, X., Dai, Z., Xia, M., Zhao, Z., Zhao, X., et al. (2013). Disrupted functional brain connectome in individuals at risk for Alzheimer’s disease. Biol. Psychiatry 73, 472–481. doi: 10.1016/j.biopsych.2012.03.026
Wang, J. H., Zuo, X. N., Gohel, S., Milham, M. P., Biswal, B. B., and He, Y. (2011). Graph theoretical analysis of functional brain networks: test-retest evaluation on short-and long-term resting-state functional MRI data. PloS One 6:e21976. doi: 10.1371/journal.pone.0021976
Wang, L., Yu, C., Chen, H., Qin, W., He, Y., Fan, F., et al. (2010). Dynamic functional reorganization of the motor execution network after stroke. Brain 133, 1224–1238. doi: 10.1093/brain/awq043
Wassermann, E. M. (1998). Risk and safety of repetitive transcranial magnetic stimulation: report and suggested guidelines from the International workshop on the safety of repetitive transcranial magnetic stimulation. Electroencephalogr. Clin. Neurophysiol. 108, 1–16. doi: 10.1016/S0168-5597(97)00096-8
Watts, D. J., and Strogatz, S. H. (1998). Collective dynamics of ‘small-world’ networks. Nature 393, 440–442. doi: 10.1038/30918
Weissenbacher, A., Kasess, C., Gerstl, F., Lanzenberger, R., Moser, E., and Windischberger, C. (2009). Correlations and anticorrelations in resting-state functional connectivity MRI: a quantitative comparison of preprocessing strategies. Neuroimage 47, 1408–1416. doi: 10.1016/j.neuroimage.2009.05.005
Wu, T., Sommer, M., Tergau, F., and Paulus, W. (2000). Lasting influence of repetitive transcranial magnetic stimulation on intracortical excitability in human subjects. Neurosci. Lett. 287, 37–40. doi: 10.1016/s0304-3940(00)01132-0
Xia, M., Wang, J., and He, Y. (2013). BrainNet viewer: a network visualization tool for human brain connectomics. PLoS One 8:e68910. doi: 10.1371/journal.pone.0068910
Yoo, W. K., You, S. H., Ko, M.-H., Tae Kim, S., Park, C., Park, J.-W., et al. (2008). High frequency rTMS modulation of the sensorimotor networks: behavioral changes and fMRI correlates. Neuroimage 39, 1886–1895. doi: 10.1016/j.neuroimage.2007.10.035
Zang, Y.-F., He, Y., Zhou, C.-Z., Cao, Q.-J., Sui, M.-Q., Liang, M., et al. (2007). Altered baseline brain activity in children with ADHD revealed by resting-state functional MRI. Brain Dev. 29, 83–91. doi: 10.1016/j.braindev.2006.07.002
Keywords: rTMS (repetitive transcranial magnetic stimulation), resting-state functional MRI, graph theory, sensorimotor network (SMN), primary motor cortex (M1)
Citation: Wei W, Zhu T, Wang X, Li L, Zou Q and Lv Y(2019) Altered Topological Organization in the Sensorimotor Network After Application of Different Frequency rTMS. Front. Neurosci. 13:1377. doi: 10.3389/fnins.2019.01377
Received: 12 July 2019; Accepted: 05 December 2019;
Published: 19 December 2019.
Edited by:
Jennifer L. Robinson, Auburn University, United StatesReviewed by:
Shalini Narayana, University of Tennessee Health Science Center (UTHSC), United StatesFelipe Santiago Salinas, The University of Texas Health Science Center at San Antonio, United States
Copyright © 2019 Wei, Zhu, Wang, Li, Zou and Lv. This is an open-access article distributed under the terms of the Creative Commons Attribution License (CC BY). The use, distribution or reproduction in other forums is permitted, provided the original author(s) and the copyright owner(s) are credited and that the original publication in this journal is cited, in accordance with accepted academic practice. No use, distribution or reproduction is permitted which does not comply with these terms.
*Correspondence: Yating Lv, bHZ5YXRpbmcxOTgyNDdAZ21haWwuY29t
†These authors have contributed equally to this work and share first authorship