- 1Aix Marseille Univ, CNRS, CRMBM, Marseille, France
- 2APHM, Hôpital de la Timone, Referral Centre for Neuromuscular Diseases and ALS, Marseille, France
- 3APHM, Hôpital de la Timone, CEMEREM, Marseille, France
- 4Aix Marseille Univ, INSERM, GMGF, Marseille, France
Background: Amyotrophic lateral sclerosis (ALS) is a relentlessly progressive neurodegenerative disorder. Diffusion magnetic resonance imagining (MRI) studies have consistently showed widespread alterations in both motor and non-motor brain regions. However, connectomics and graph theory based approaches have shown inconsistent results. Hub-centered lesion patterns and their impact on local and large-scale brain networks remain to be established. The objective of this work is to characterize topological properties of structural brain connectivity in ALS using an array of local, global and hub-based network metrics.
Materials and Methods: Magnetic resonance imagining data were acquired from 25 patients with ALS and 26 age-matched healthy controls. Structural network graphs were constructed from diffusion tensor MRI. Network-based statistics (NBS) and graph theory metrics were used to compare structural networks without a priori regions of interest.
Results: Patients with ALS exhibited global network alterations with decreased global efficiency (Eglob) (p = 0.03) and a trend of reduced whole brain mean degree (p = 0.05) compared to controls. Six nodes showed significantly decreased mean degree in ALS: left postcentral gyrus, left interparietal and transverse parietal sulcus, left calcarine sulcus, left occipital temporal medial and lingual sulcus, right precentral gyrus and right frontal inferior sulcus (p < 0.01). Hub distribution was comparable between the two groups. There was no selective hub vulnerability or topological reorganization centered on these regions as the hub disruption index (κ) was not significant for the relevant metrics (degree, local efficiency and betweenness centrality). Using NBS, we identified an impaired motor subnetwork of 11 nodes and 10 edges centered on the precentral and the paracentral nodes (p < 0.01). Significant clinical correlations were identified between degree in the frontal area and the disease progression rate of ALS patients (p < 0.01).
Conclusion: Our study provides evidence that alterations of structural connectivity in ALS are primarily driven by node degree and white matter tract degeneration within an extended network around the precentral and the paracentral areas without hub-centered reorganization.
Introduction
Amyotrophic lateral sclerosis (ALS) is a neurodegenerative motor neuron disorder characterized by progressive upper and lower motor neuron degeneration, leading to severe motor disability and death due to respiratory failure within few years (Kiernan et al., 2011). While the etiology of ALS remains elusive, ALS is now widely regarded as a multisystem disorder with considerable extra-motor involvement (Al-Chalabi et al., 2016; Christidi et al., 2018). Neuroimaging studies in ALS have consistently captured clinico-radiological correlations in the central nervous system (Cirillo et al., 2012; Bede and Hardiman, 2014).
Structural changes are relatively difficult to ascertain in ALS with conventional, clinical magnetic resonance imagining (MRI) sequences, therefore research studies rely on quantitative techniques, such as diffusion tensor imaging (DTI; Grolez et al., 2016), cortical thickness mapping (Schuster et al., 2017; Consonni et al., 2019) or MRI spectroscopy (Kalra, 2019). DTI studies have highlighted fractional anisotropy (FA) reductions in both motor and extra-motor regions (Foerster et al., 2013) and FA proved to be a sensitive DTI metric for both diagnostic (Tang et al., 2015; Bede et al., 2017) and progression modeling (Menke et al., 2012; Müller et al., 2016). Tractography studies in ALS readily detect white matter tract degeneration principally in the corticospinal tracts (Agosta et al., 2010). These studies have described anatomical patterns of white matter degeneration, but the impact of focal white matter changes on brain network integrity has not been fully characterized to date (Bede, 2017).
Structural connectivity studies based on graph theory offer a valuable tool to analyze the topological organization of cerebral networks and elucidate how different brain regions relate to each other (Bullmore and Sporns, 2009). In connectomics, cortical and subcortical brain regions can be parcellated in nodes with white matter tracts between them representing the edges of a mathematical graph. The human connectome has been extensively studied with graph theory in physiological and pathological contexts and it exhibits non-random features such as the presence of highly connected regions, named hubs (Achard, 2006). Connectivity hubs of the human brain support integrative processing and adaptive behaviors with high metabolic demands and represent vulnerable foci of neurodegeneration (Buckner et al., 2009; van den Heuvel et al., 2013; Proudfoot et al., 2019).
In ALS, few structural connectivity studies have reported both motor (Verstraete et al., 2011) and extra-motor node impairment (Verstraete et al., 2014; Buchanan et al., 2015; Dimond et al., 2017) and corticobasal connectivity is seldom evaluated specifically (Bede et al., 2018). However, due to methodological differences, the findings of these studies are inconsistent; some authors have described decreased (Dimond et al., 2017), while others reported preserved global efficiency (Buchanan et al., 2015). While many brain disorders, such as Alzheimer disease (Buckner et al., 2009; Verstraete et al., 2011) or schizophrenia (Rubinov and Bullmore, 2013) exhibit a hub-centered pattern, this finding is not evident in ALS connectivity studies (Crossley et al., 2014). It is still not clear if the clinical manifestations of ALS are primarily driven by white matter degeneration or by hub topology alterations.
Accordingly, the main objective of this prospective MRI study, is the characterization of structural connectivity in ALS using graph theory methods at different scales: global, local (nodal) and network analysis using statistical methods such as the Network-based Statistics (NBS; Zalesky et al., 2010) allowing us to analyze both cortical and white matter integrity.
Materials and Methods
Ethics
This prospective imaging study was approved by the regional Ethics Committee (Sud Mediterranee I). All subjects provided informed consent in accordance with the principles of the Declaration of Helsinki.
Participants
Twenty-five consecutive patients with ALS, diagnosed according to the revised El Escorial criteria (Brooks et al., 2000), were recruited from the ALS Center of Marseille University Hospital, France. Comorbid neurological conditions or coexisting frontotemporal dementia (FTD; Rascovsky et al., 2011) were considered as exclusion criteria. Twenty-six healthy volunteers were also recruited as radiological controls. Healthy controls had no history of prior head injuries, neurological or psychiatric diagnoses and had a normal clinical examination.
Clinical Evaluation
All ALS patients underwent a standardized clinical examination on the day of the MRI. The recorded demographic and clinical parameters included: disease duration, site of onset, revised ALS functional rating scale (ALSFRS-R) scores (Cedarbaum et al., 1999) and disease progression rate defined as (48-ALSFRS-R)/disease duration (months).
MRI Acquisition
Magnetic resonance imagining data were acquired on a 3T MAGNETOM Verio system (Siemens, Erlangen, Germany) using a 32-channel phased-array 1H head coil. The protocol included a high-resolution 1H T1-weighted (T1w) 3D-Magnetization-Prepared Rapid Acquisition Gradient-Echo (MPRAGE) sequence (TE/TR/TI = 3/2300/0.9 ms, 160 slices, resolution of 1 × 1 × 1 mm3, acquisition time = 6 min), and a single shot echo-planar imaging DTI sequence (64 encoding directions, b = 1000 s/mm2 and b0, TE = 95 ms, TR = 10700 ms, slice thickness 2 mm, 60 contiguous slices, resolution of 2 × 2 mm2, acquisition time = 12 min). A T2-weighted 3D-Fluid-Attenuated Inversion Recovery (FLAIR) sequence (TE/TR/TI = 395/5000/1800 ms, 160 slices, 1 × 1 × 1 mm3 spatial resolution, acquisition time = 6 min) was also performed in both patients and controls and systematically reviewed to ensure the absence of vasculopathic white matter abnormalities which may affect focal diffusivity parameters.
Image Processing (Figure 1)
Anatomical Cortical and Subcortical Parcellation
Cortical and subcortical brain regions of each subject were parcellated using the Freesurfer software1 (v5.0) with the Destrieux atlas, based on the T1w MPRAGE images to obtain 164 regions of interest (Destrieux et al., 2010). Subcortical regions included the thalamus, caudate nucleus, putamen, pallidum, hippocampus, amygdala, nucleus accumbens and ventral diencephalon.
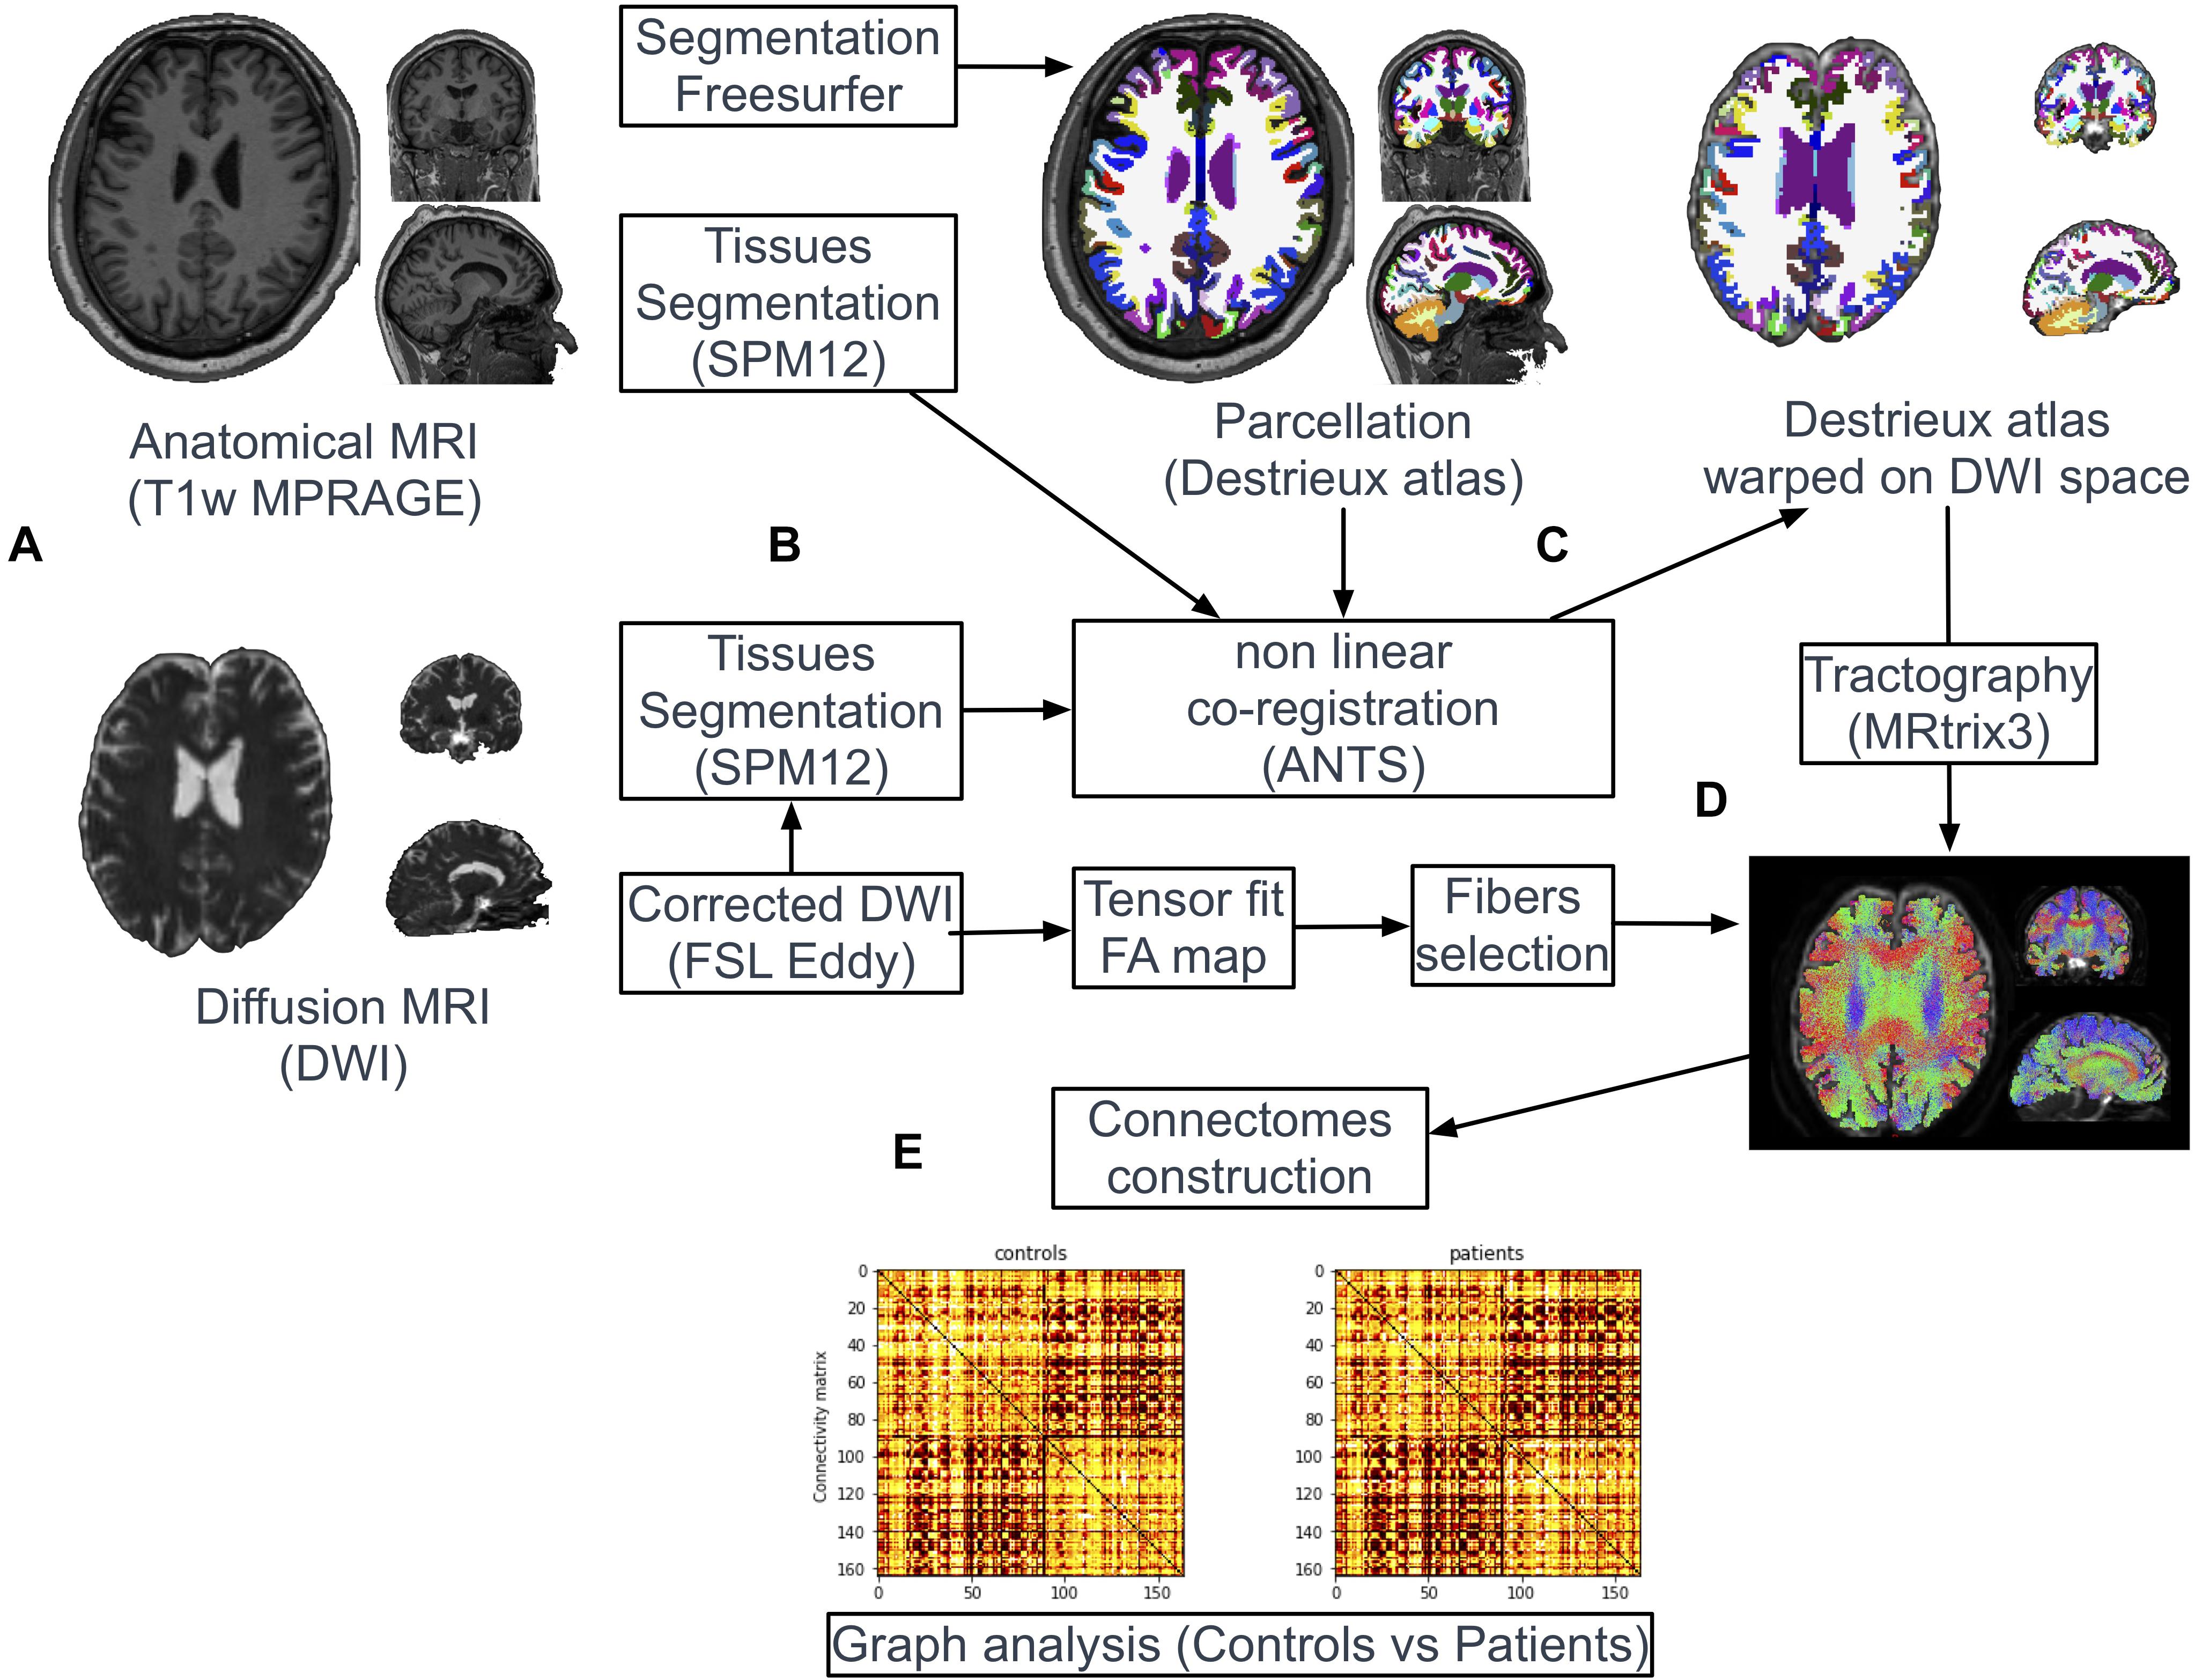
Figure 1. Pipeline of image processing and graph analysis. T1w and diffusion MRI sequences were acquired from all patients and controls (A). Following automatic parcellation of the structural images into cortical and subcortical regions (B), the two set of images were non-linearly co-registered (C). White matter tracts were reconstructed based on diffusion data using the probabilistic algorithm of MRtrix (D). Individual brain network maps were generated using nodes and white matter connections resulting in a FA-weighted connectivity matrix for each subject. Graph analyses were performed on the FA-based connectivity matrix (E).
Co-registration Between T1w Images and Diffusion Images
Tissues-type segmentation was performed based on T1w and b0 diffusion images using the Statistical Parameters Mapping software2 (SPM12) to extract cerebrospinal fluid (CSF) maps (Figure 1B). T1w and b0 CSF maps were used as source and target images, respectively, to estimate geometric distortions with a non-linear registration procedure (Syn Model of ANTs library (Avants et al., 2008; Figure 1C). The resulting deformation map obtained from this co-registration was applied on the parcellation mask (Destrieux labels). Nearest neighbor interpolation was applied on the mask to keep the integer values of the original labels.
Diffusion Image Preprocessing
Each diffusion dataset was aligned to its b0 image using affine registration to correct for head movement and Eddy-currents using FSL3 (version 5.0.8, FMRIB Software Library, Destrieux et al., 2010).
Tractography and Connectomes Construction
White matter tracts were reconstructed adopting a whole-brain probabilistic fibertracking approach using MRtrix4 (Brain Research Institute, Melbourne, Australia). The method has been previously presented in detailed (Besson et al., 2014). A combined bi-hemispheric white matter mask was 1 mm dilated and defined as the region of interest (ROI) for the tracking algorithm (Figure 1D). One million fibers were then generated from all voxels included in this ROI with a probabilistic tracking algorithm [tckgen command, FOD model (Behrens et al., 2003)]. The algorithm generated one million fibers with a minimum length of 20 mm. Default tracking parameters included a minimum radius of curvature of 1 mm, a FOD cutoff of 0.1 and a step size of 0.2 mm. Finally, FA values were interpolated at each point of the fibers and the FA-based connectivity matrix (size 164 × 164) were generated from all streamlines and the parcellation mask (164 labels) previously warped in the diffusion dataset space (tck2connectome command, MRtrix) (Figure 1E).
Network Construction and Graph Theory Based Analysis
We modeled the structural undirected brain network of each participant using the reconstructed white matter tracts and the parcellated brain regions obtained in the previous steps (Bullmore and Sporns, 2009). Each region was used to define a node of a network graph. Edges were determined by tractography streamlines connecting any pair of nodes. An edge was considered present between two nodes if a streamline was generated with start and end points in each region. Network metrics were computed using the Brain Connectivity Toolbox (Rubinov and Bullmore, 2013). We investigated measures of global network architecture of each subject with global efficiency and mean degree. Local structural alterations were evaluated based on local efficiency, degree and betweenness centrality of each region.
As defined by Rubinov and Sporns (2010), global efficiency (Eglob) is the average inverse shortest path length in a network and is inversely related to the characteristic path length. It is a metric of functional integration that reflects on the brain’s ability for specialized processing across distributed brain areas. Node degree is defined as the number of edges connected to the node and is a fundamental basic network measure to assess the central role of a brain region among a network.
Mean degree of the whole network was also computed and defined for one subject as the mean of each node degree of this subject. Betweenness centrality (BC) is the fraction of all shortest paths in the network that pass-through a given node. The local efficiency (Eloc) is the global efficiency computed on the neighborhood of the nodes.
Hub Analysis
In connectomics, hubs are described as highly connected nodes with topological centrality and a critical role in integrative processes and adaptive behaviors. Hubs are typically defined as nodes with the highest degree, i.e., a degree one standard deviation higher than the average degree of all nodes in the studied population (van den Heuvel and Sporns, 2011; Llufriu et al., 2017).
To assess if the topologic reorganization was more prevalent in hubs, we also calculated the hub disruption index, κ, as defined by Achard (Achard, 2006). κ index is the gradient of a straight line, plotting the mean value at each node in the healthy controls group (x-axis) versus the difference between patient and control groups at each node, for any given metric (y-axis). For example, a negative κ index, crossing the zero line on the y-axis, reveals a trend for high-value regions in controls to decrease in the studied subject, and low-value nodes to increase.
Network Based Statistics
Considering a 164-node network, 26732 network connections can theoretically be generated. As a result, standard statistical tests for nodal analyses may be underpowered after correcting for multiple comparisons. Accordingly, we used the NBS approach to identify impaired subnetworks in patients compared to controls. The NBS methodology improves the statistical power by controlling for type I error (Zalesky et al., 2010). The NBS network was computed using the parameters detailed in a previous ALS study (Verstraete et al., 2011) permitting the identification of an altered network derived from the FA-based connectome. The mean FA of each tract of this isolated subnetwork was calculated for each subject and the total FA sum (NBS FA sum) was compared between the two groups.
Statistical Analyses
Statistical analyses were performed using JMP 9.0.1, SAS Institute Inc (JMP®, Version 9. SAS Institute Inc., Cary, NC, 1989–2019). Group characteristics were compared using the non-parametric Kruskal-Wallis test for age and Chi-squared test for gender and handedness. Differences in global connectivity between patient and control groups were assessed using pairwise non-parametric Wilcoxon signed-rank tests for multiple comparisons with uncorrected p < 0.05 being considered statistically significant. For each node, group differences in the mean degree, Eloc, and Eglob were also explored with non-parametric Wilcoxon tests (p < 0.05).
At the nodal scale, we used two thresholds to study differences between patients and controls: a first p = 0.05/164 = 0.0003 threshold corresponding to Bonferroni corrections applied with 164 brain regions, and a p exploratory threshold 1/n (p < 0.006) (Ridley et al., 2015).
The connectivity metrics with significant differences between patients and controls were then correlated with clinical parameters including ALSFRS-R score and disease progression rate, using a Spearman Rank test with multiple corrections. A p < 0.0125 for global metrics (Eglob and mean degree) and a p < 0.004 for local metrics (6 nodes with significant connectivity differences between patients and controls) were considered statistically significant.
Results
Demographic and Clinical Parameters
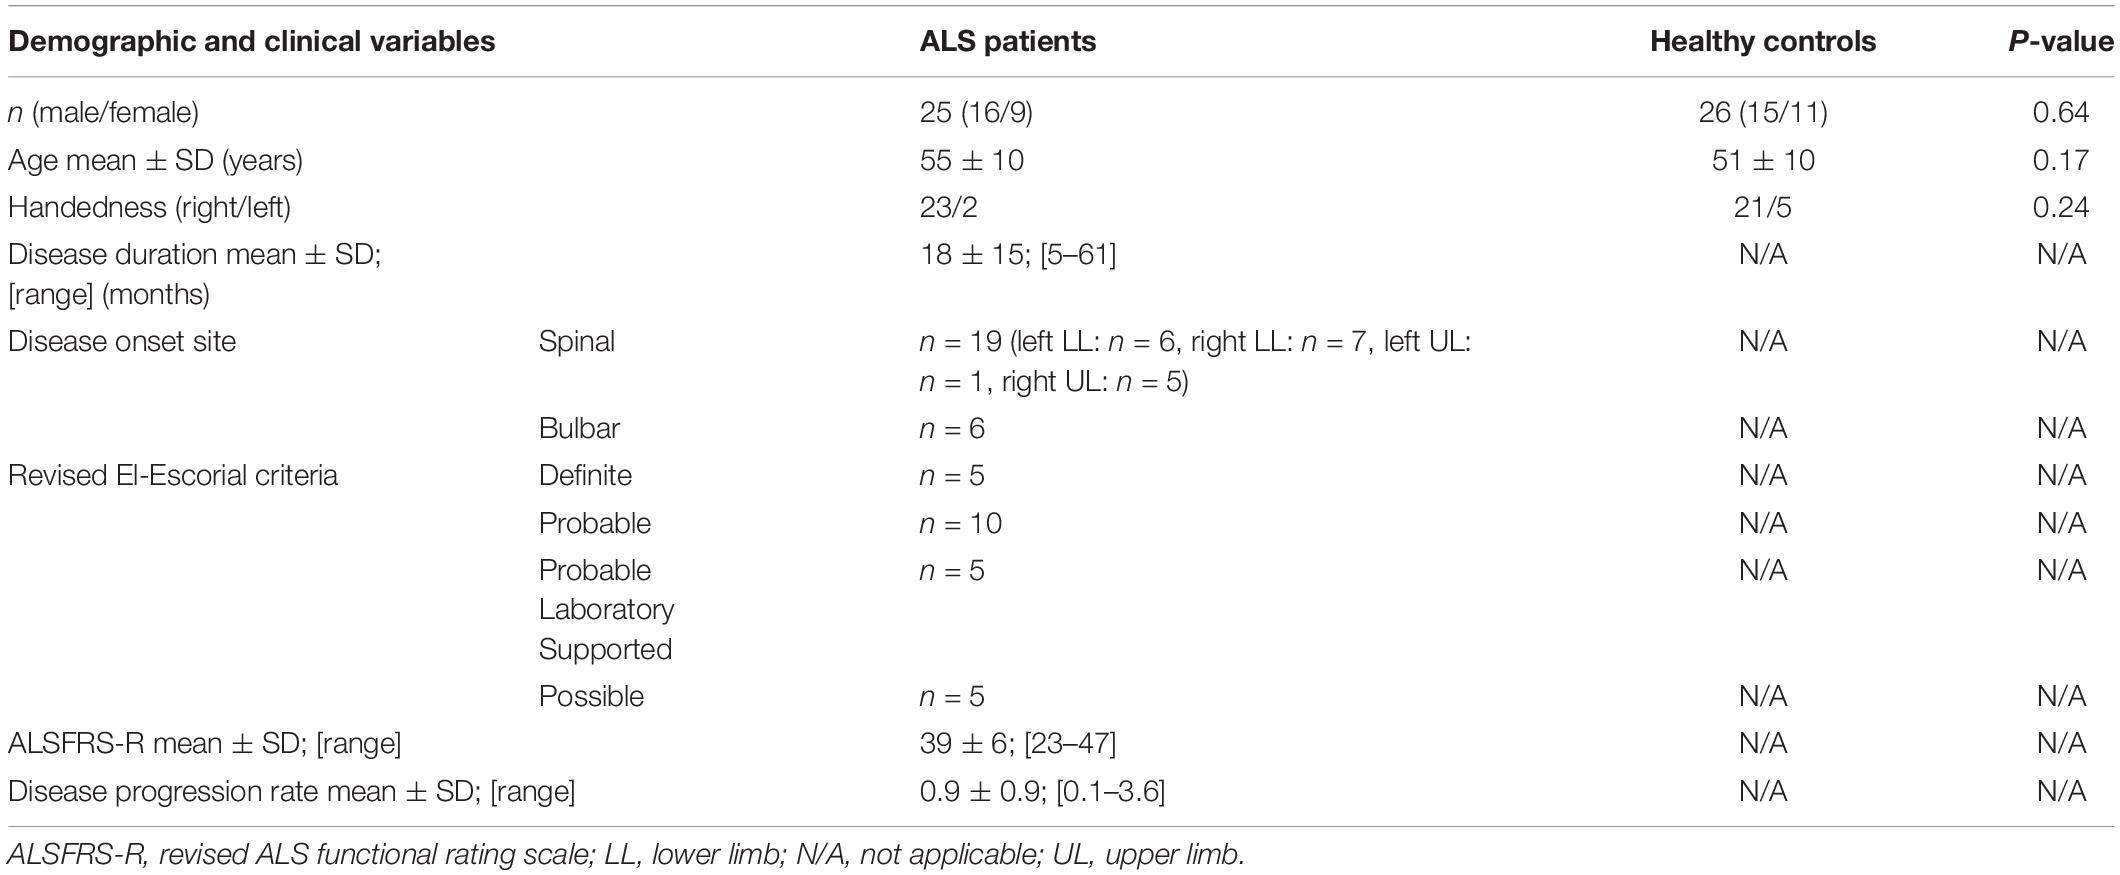
The demographic and clinical profile of the participants is presented in Table 1. Twenty-five patients with ALS (mean age 55; SD 10 years; 16 males and 9 females, 2 left-handed) and 26 healthy controls (mean age 51; SD 10 years; 15 males and 11 females, 5 left-handed) were included. There was no statistical difference in age (p = 0.17), gender (p = 0.64) and handedness (p = 0.24) between the study groups. The mean ALSFRS-R score in the ALS cohort was 39 ± 6.
Global Metrics
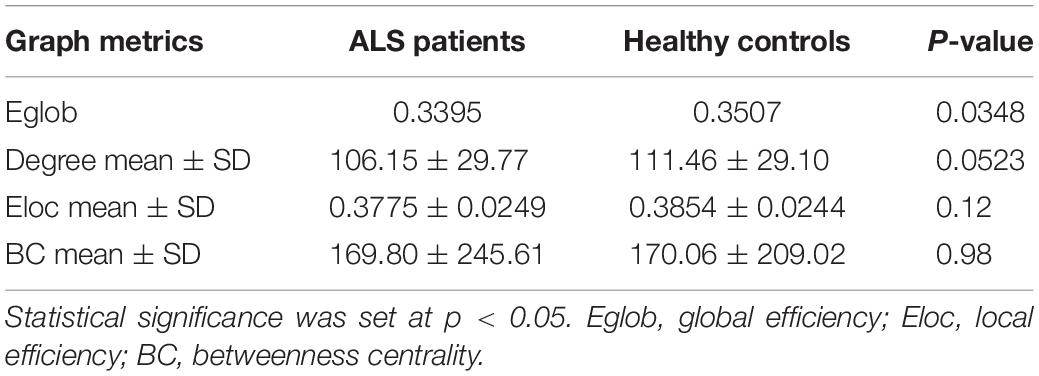
Global network analyses are presented in Table 2. Compared to controls, ALS patients showed a significant decrease in Eglob (0.3395 vs. 0.3507, p = 0.0348). A trend of reduced mean degree of the whole brain was found in ALS patients (106.15 vs. 111.46, p = 0.0523).
Nodal Analysis
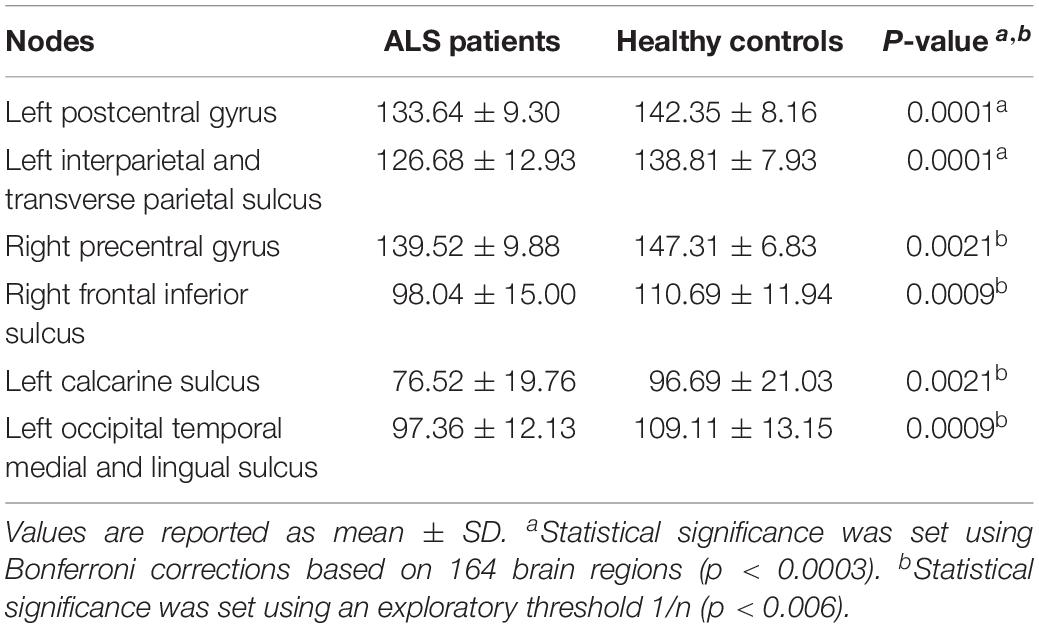
Using the Bonferroni corrected threshold, we found a significant decrease in ALS patients for the left postcentral gyrus (p < 0.0001) and for the left interparietal and transverse parietal sulcus (p < 0.0001) mean degree. No significant differences were identified in Eloc or BC in any nodes at this threshold. Furthermore, using the exploratory threshold, we found a significant decrease in the mean degree of the left calcarine sulcus (p = 0.0021), the left occipital temporal medial and lingual sulcus (p = 0.0009), the right precentral gyrus (p = 0.0021) and the right frontal inferior sulcus (p = 0.0009) (Figure 2C and Table 3).
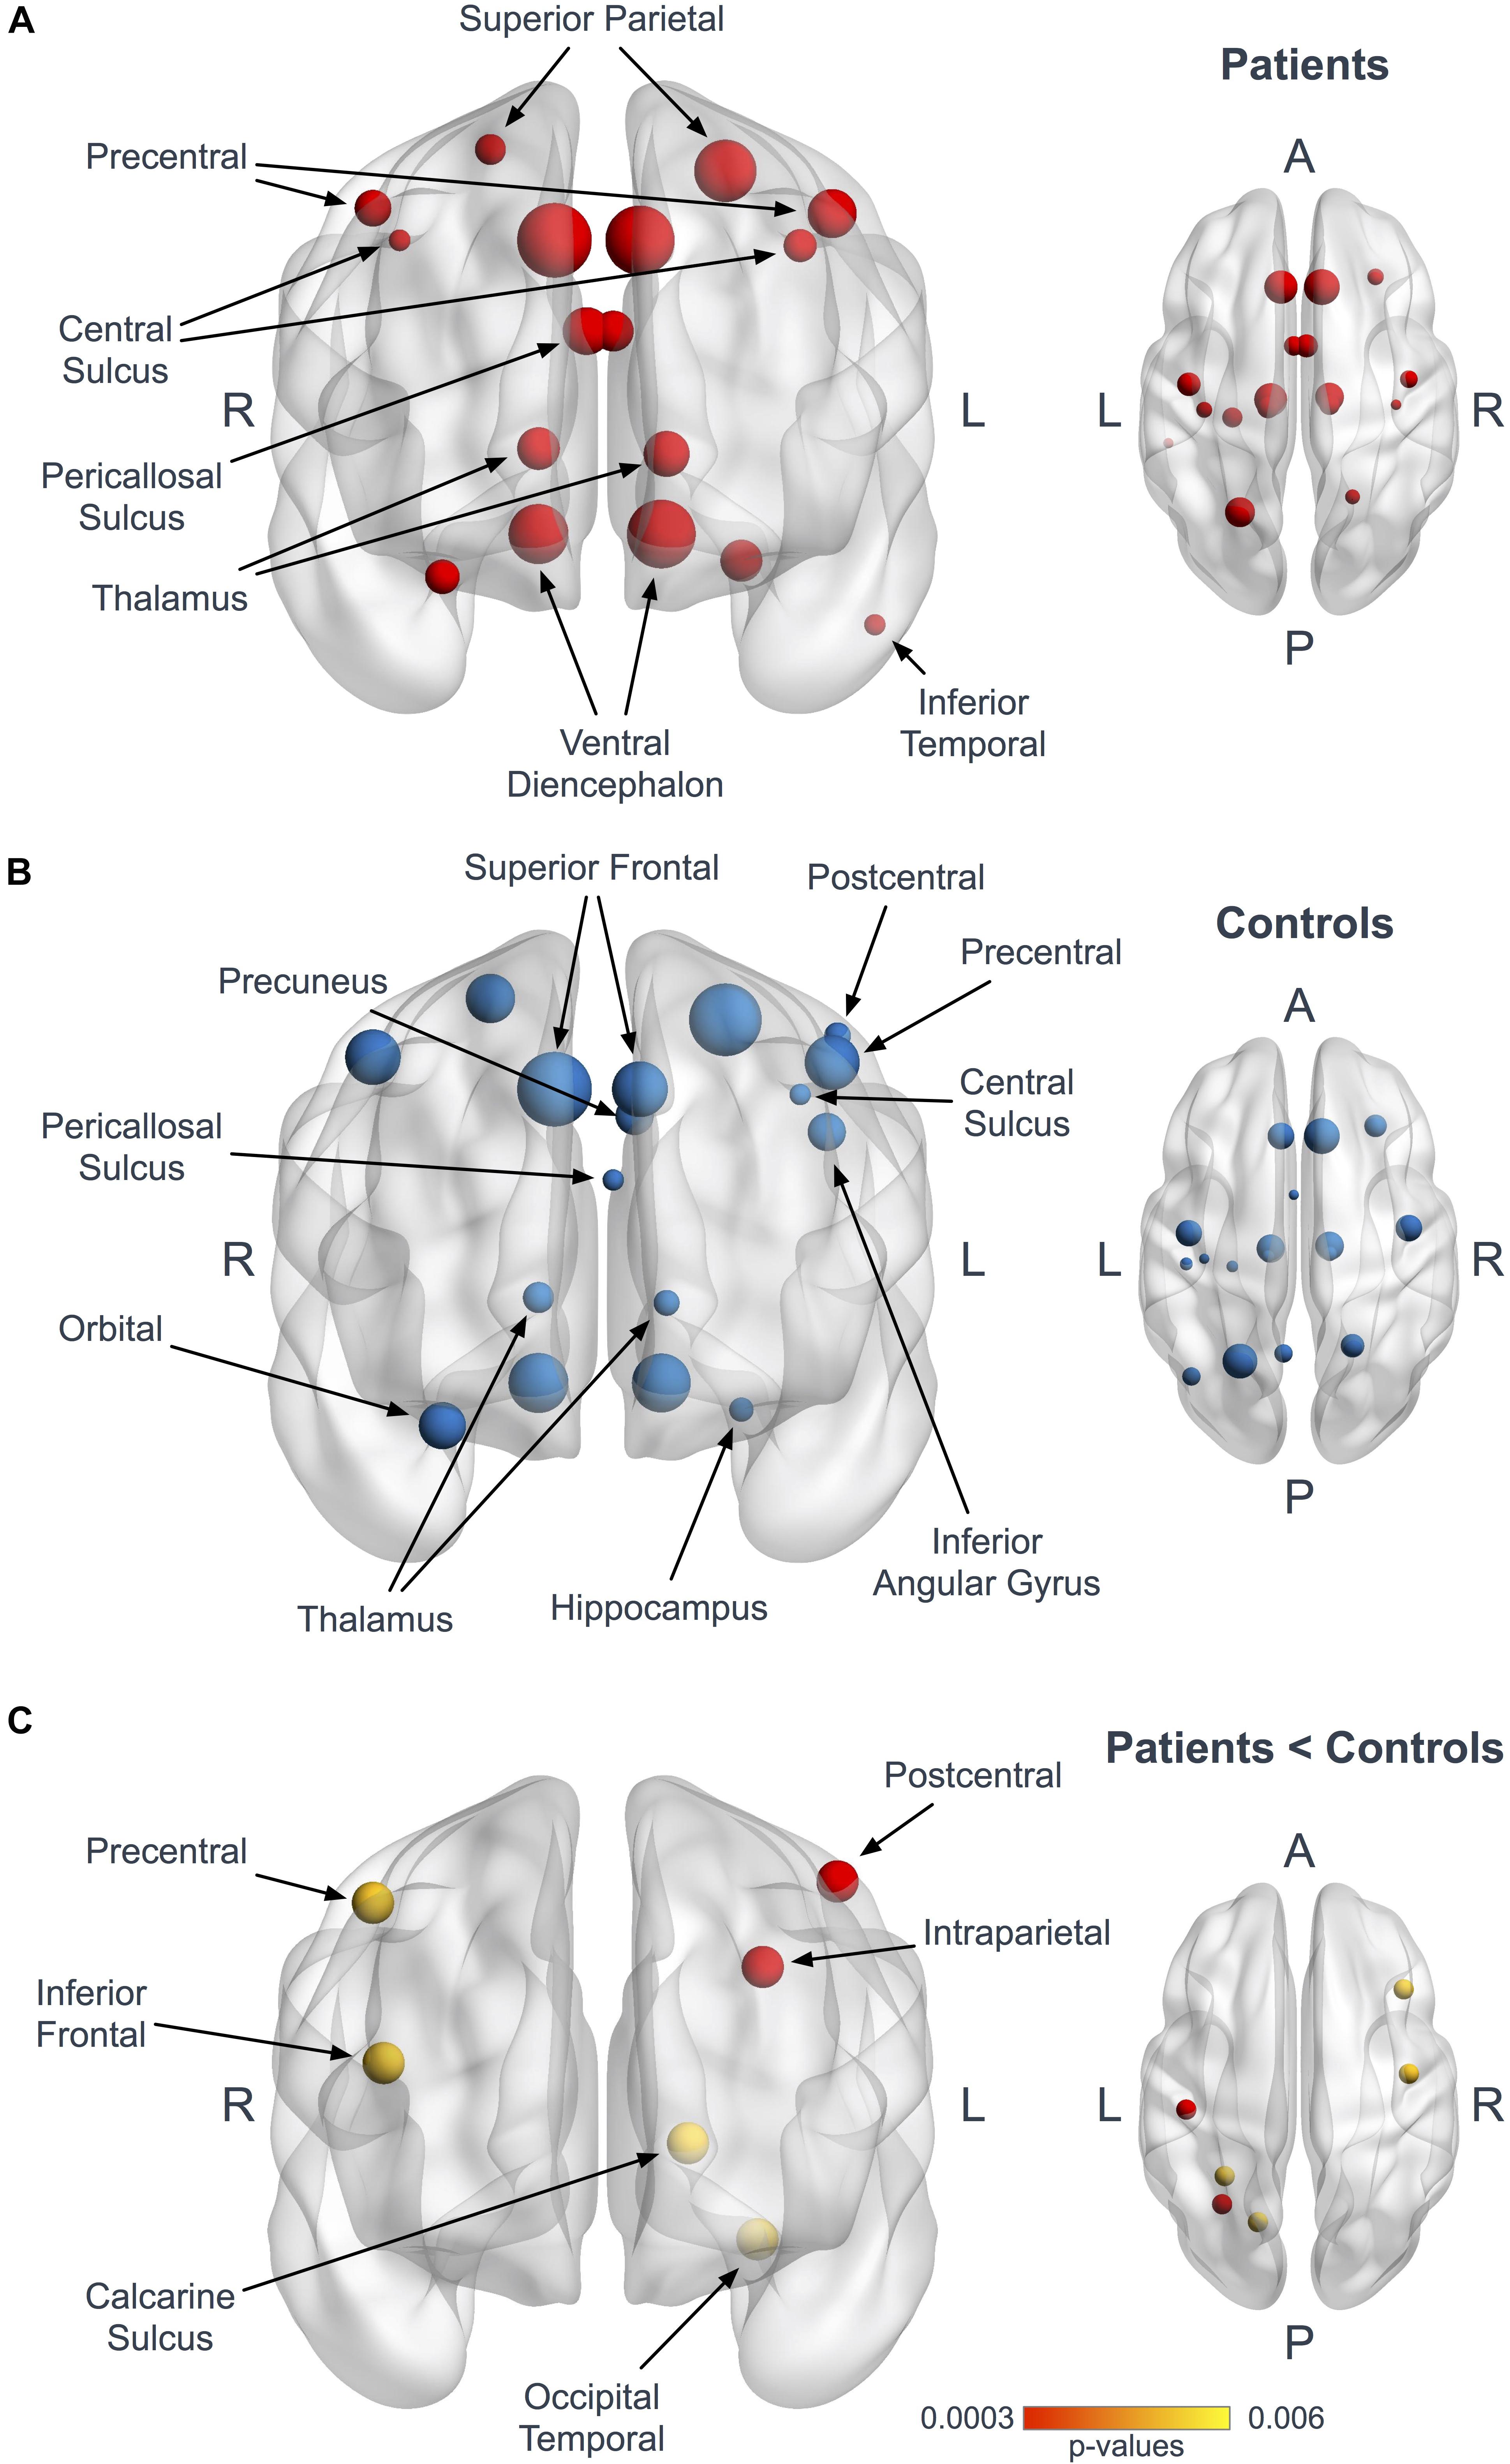
Figure 2. Hubs in ALS patients and controls. Panels (A,B) represent coronal and axial views illustrating the hubs in patients (A, red) and controls (B, blue). The size of the nodes is proportional to their degree values. Panel (C) shows the 6 nodes with significantly reduced mean degree in patients at the Bonferroni corrected threshold (red, p < 0.0003) and at the 1/n exploratory threshold (yellow, p < 0.006).
Hub Analysis
Seventeen regions among 164 were defined as hubs both in patients and controls. The results are illustrated in Figure 2. Three hubs in controls were not identified as hubs in ALS patients: the left precuneus, the left parietal inferior angular gyrus and the left postcentral gyrus (Figure 3), but regarding the hub disruption index, no significant differences were found in κ-Eloc (p = 0.1270), κ-BC (p = 0.6511) or κ-degree (p = 0.6647) (Figure 4).
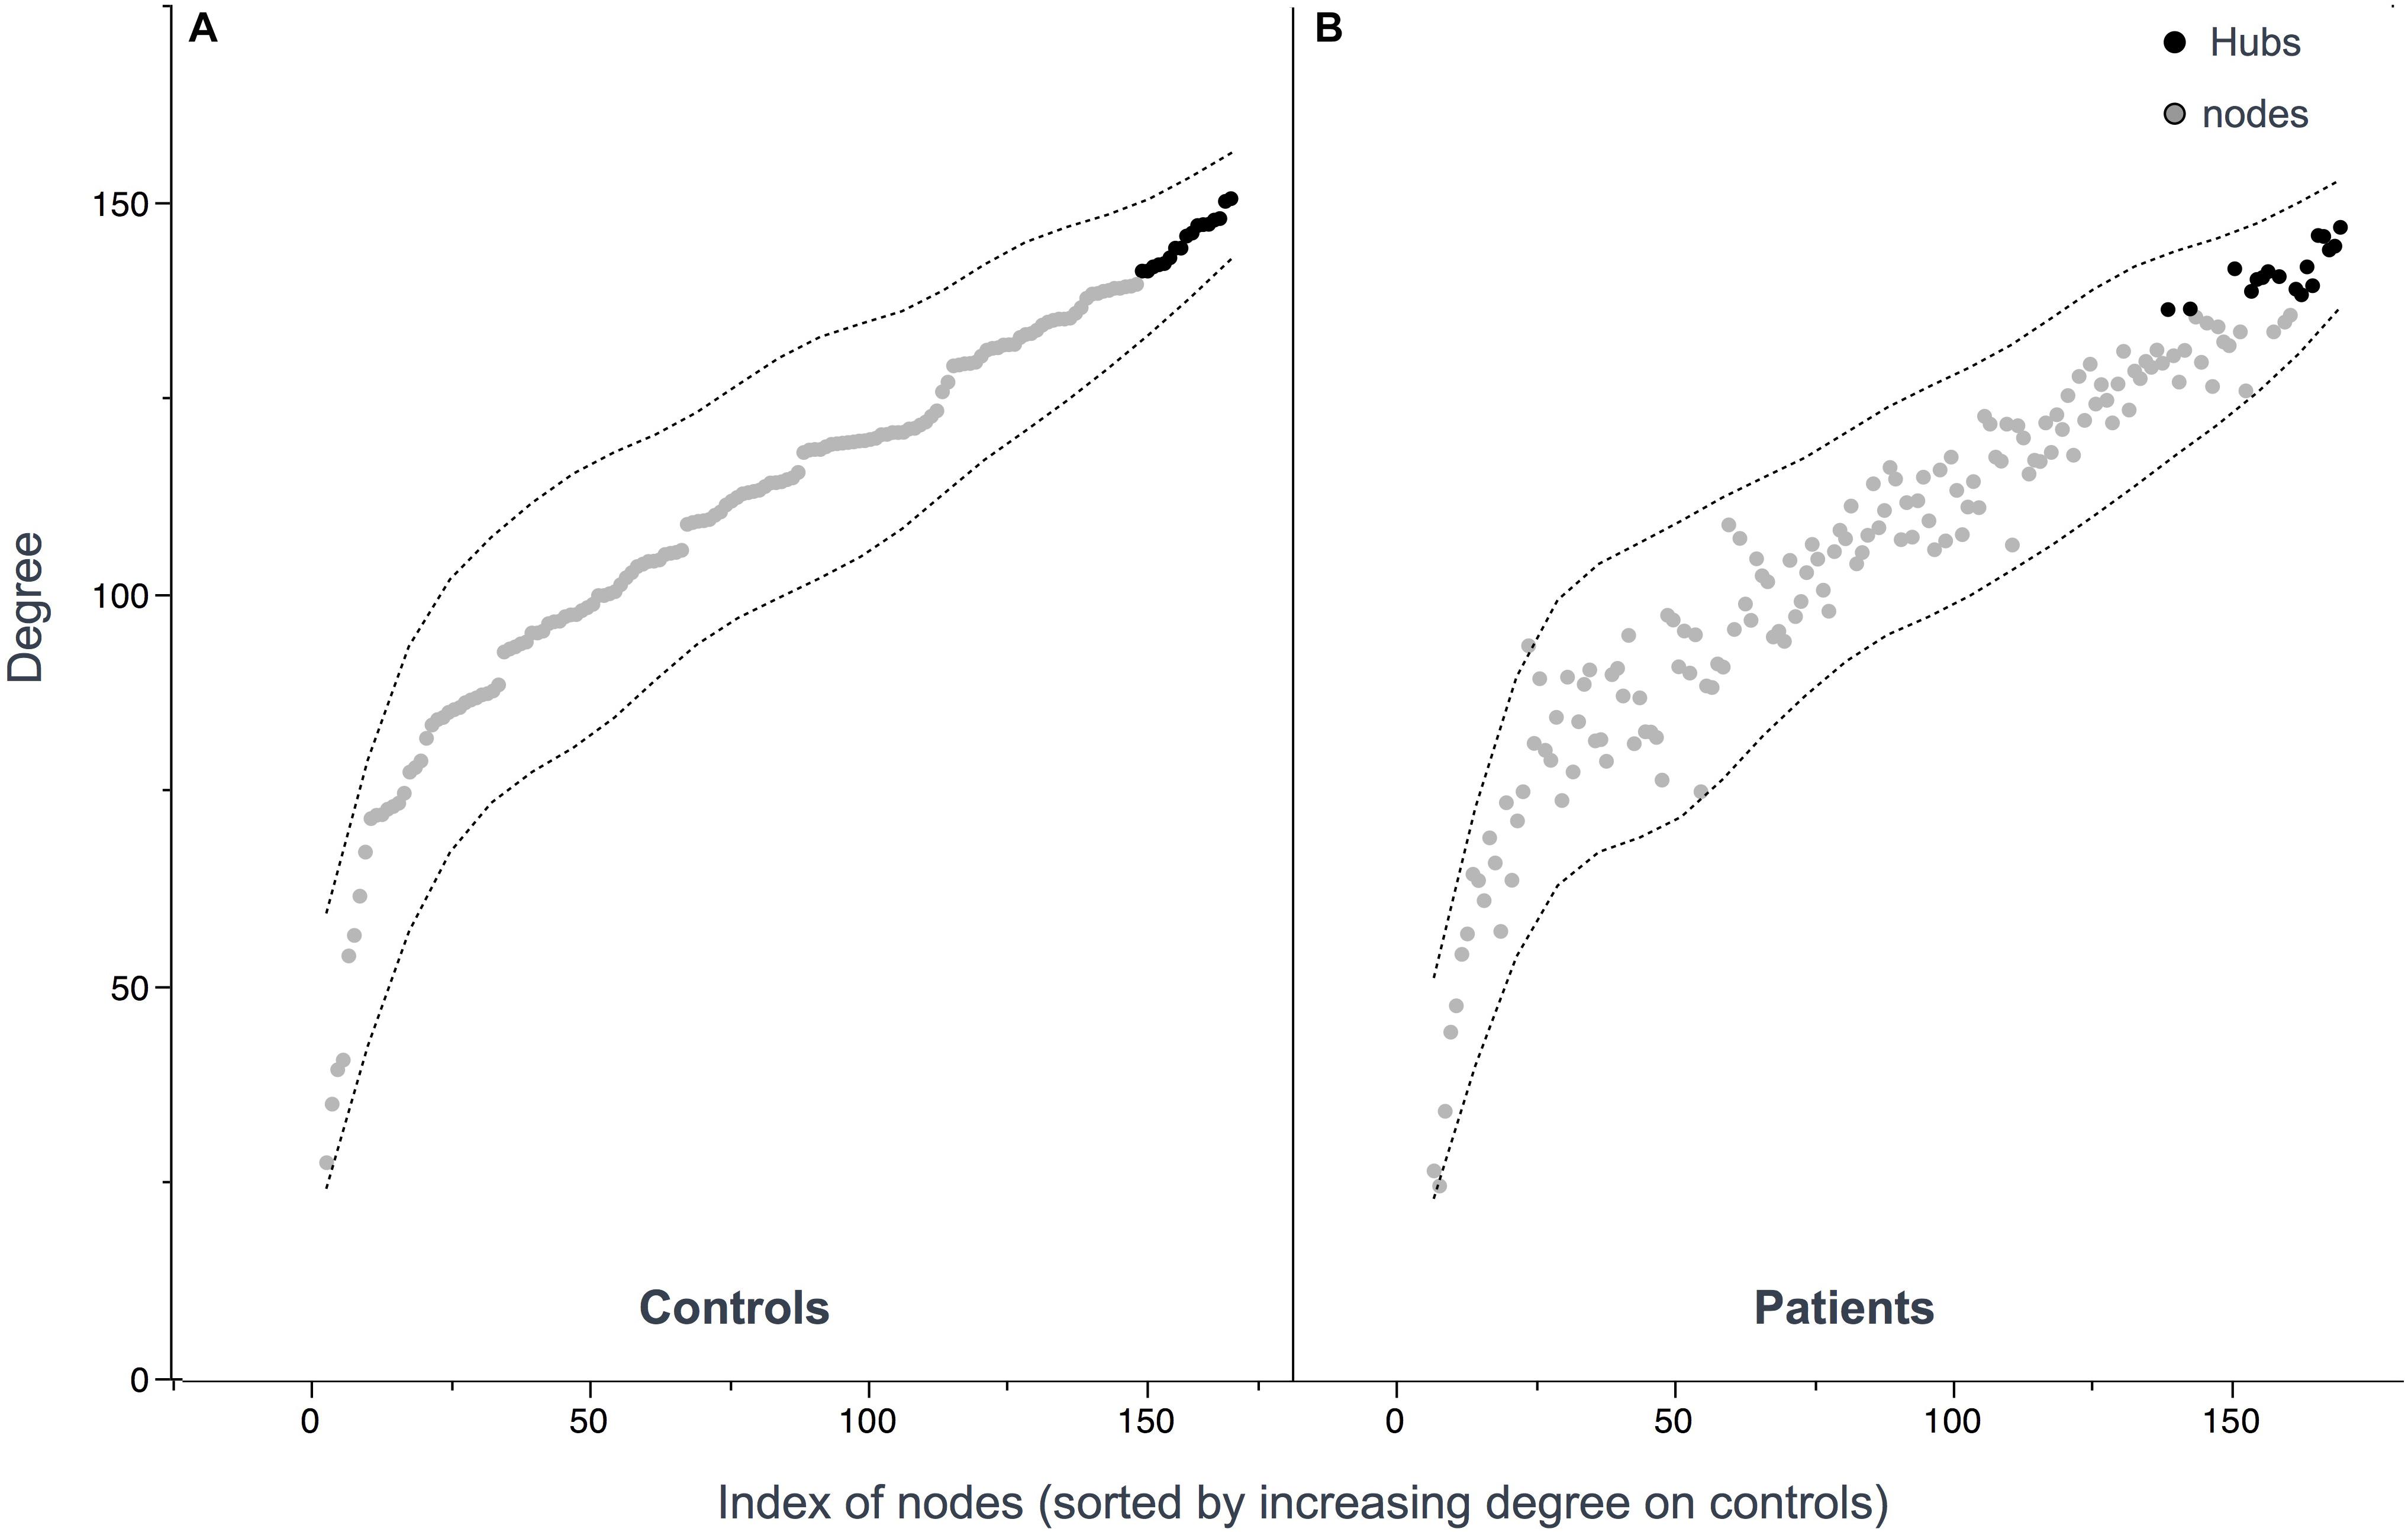
Figure 3. Hub distribution patterns among controls (A) and patients (B). Hubs were defined as nodes with a degree one standard deviation higher than the average node degree. 17 hubs were identified in patients and 17 hubs in controls. Nodes (A,B) are sorted out by increasing values of degree in controls showing similar distribution.
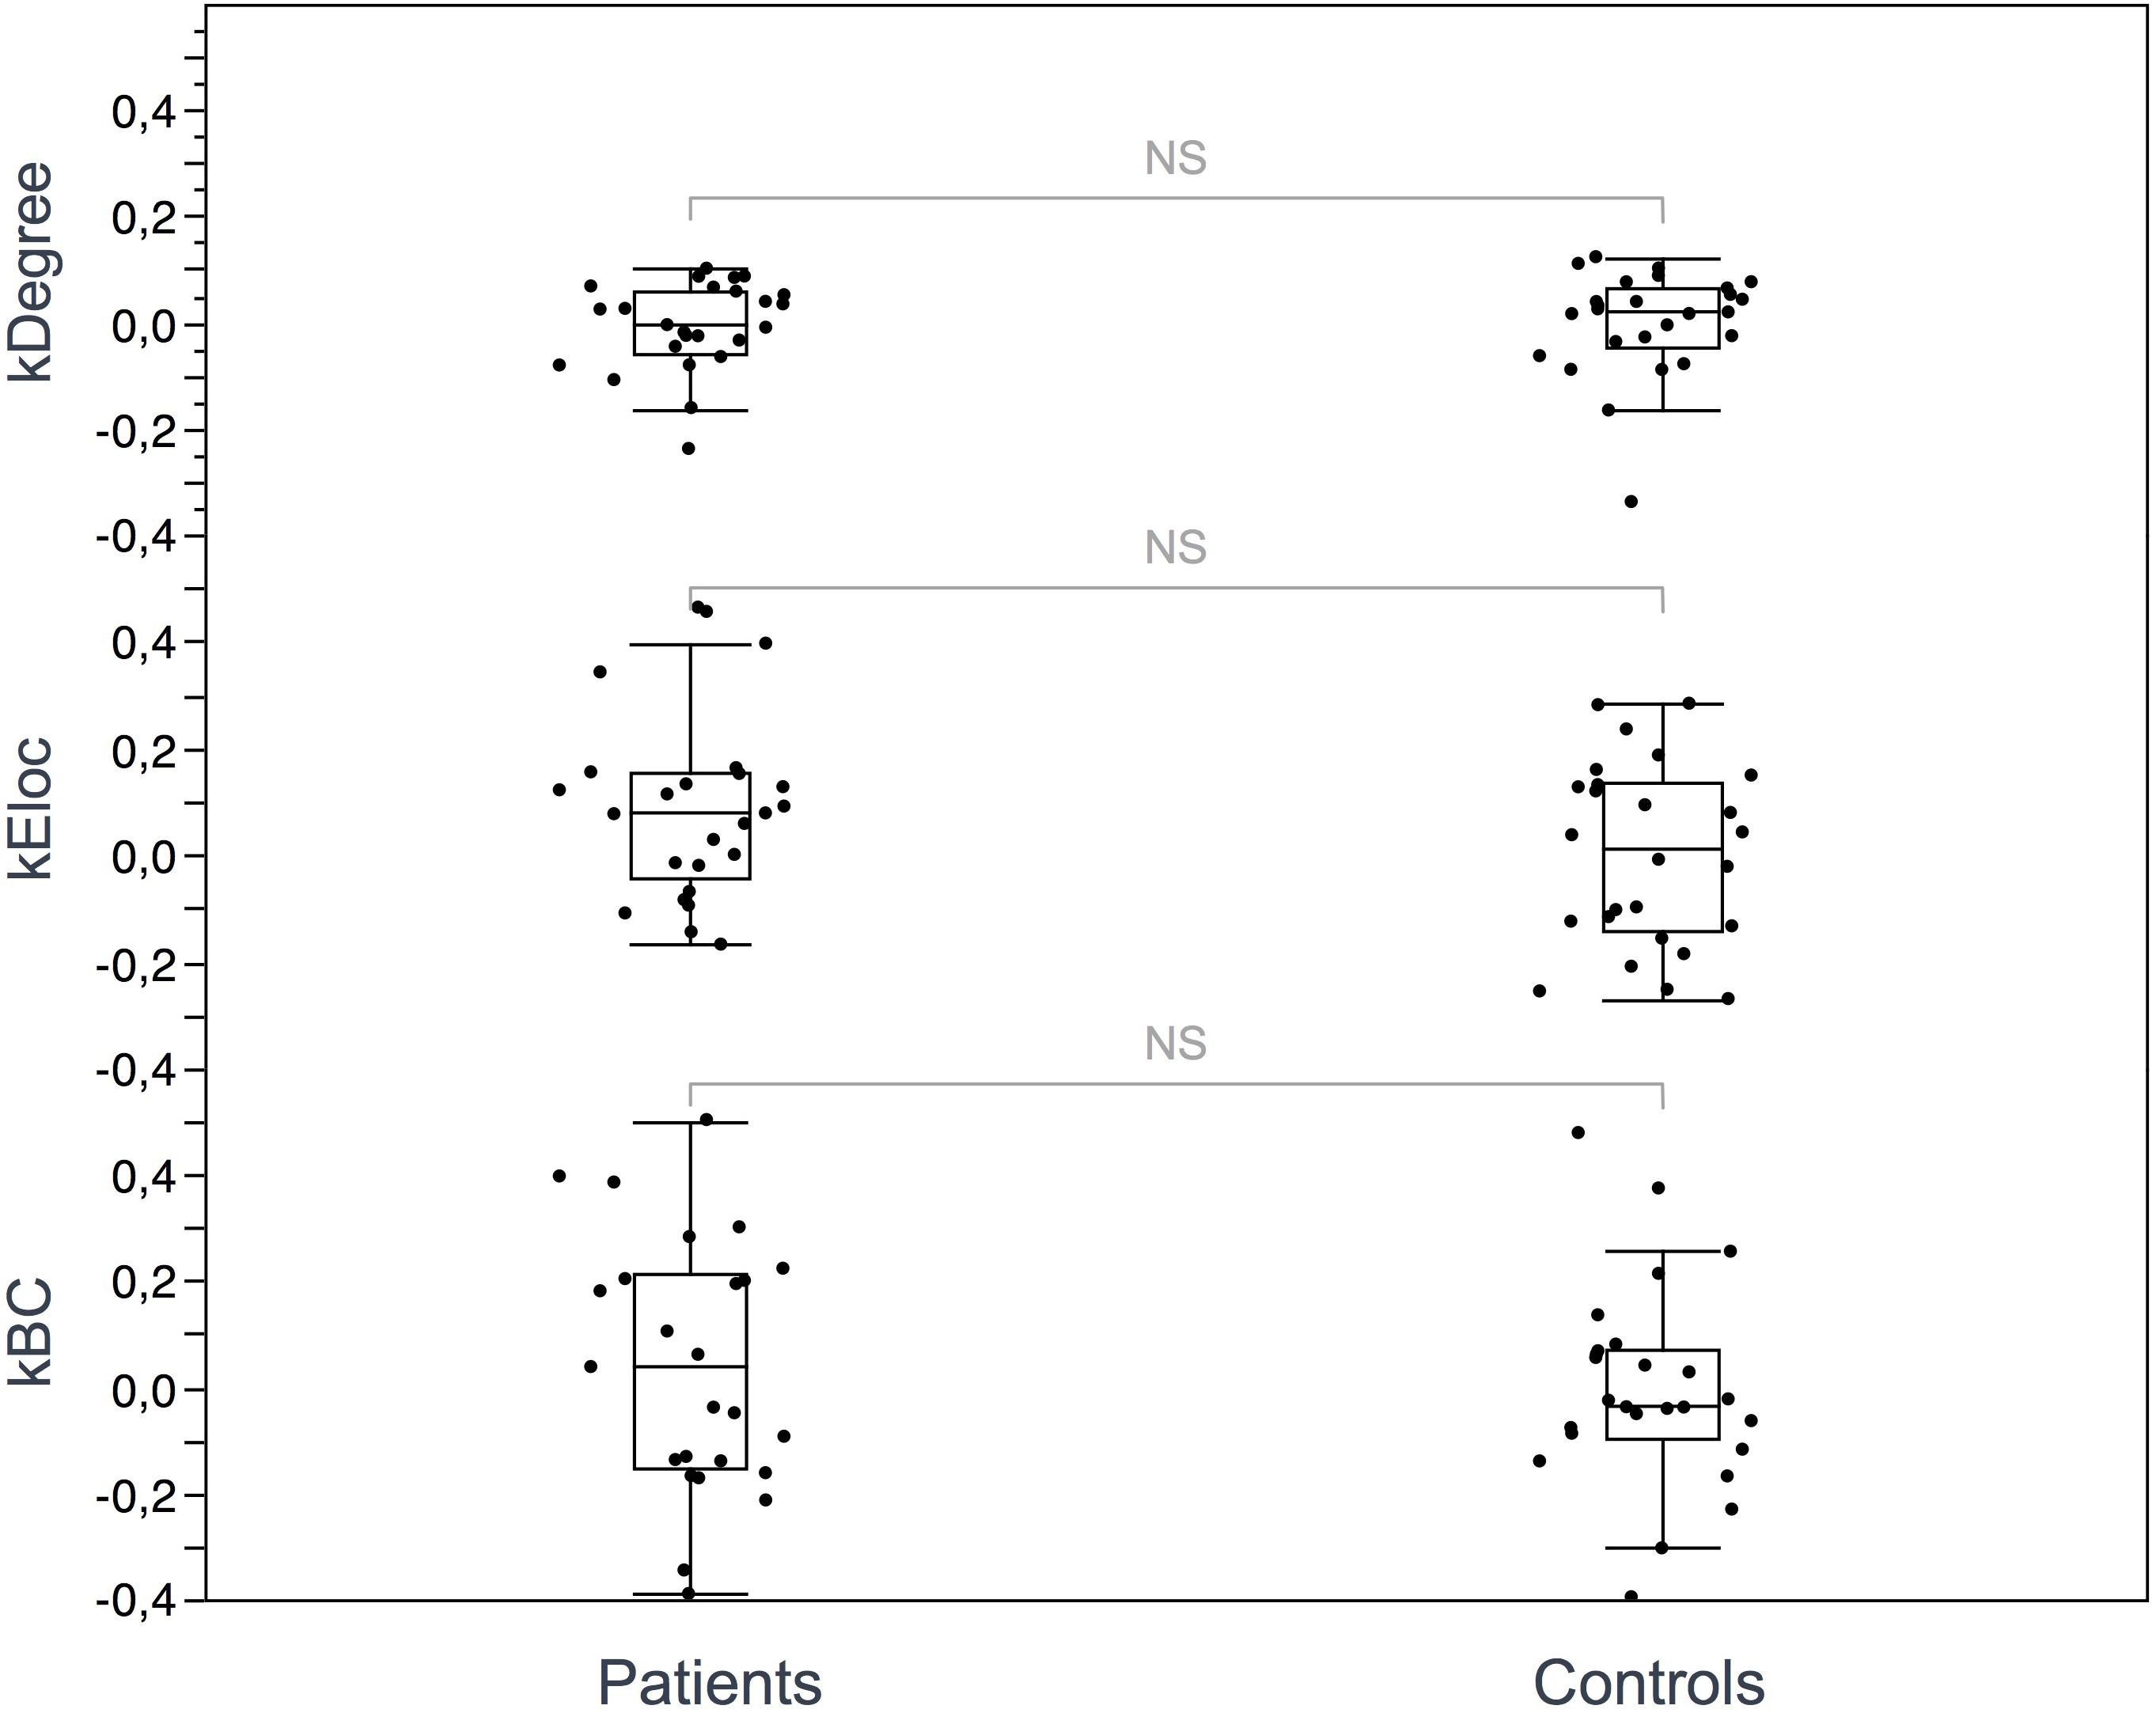
Figure 4. Hub disruption index. The box plots show the κ index of each subject for 3 metrics: κ-degree, κ-Eloc, κ-BC. No significant differences were identified between ALS patients and controls. Differences were considered significant at p < 0.05 for each metric.
Network-Based Statistics
Network-based statistics highlighted a subnetwork (11 nodes, 10 edges) of impaired connectivity in the ALS group (p = 0.015) (Figure 5). This network included the left precentral gyrus, the left paracentral gyrus, the left caudate nucleus, the left suborbital sulcus, the left inferior temporal sulcus, the left cingulate marginal gyrus, the right middle frontal gyrus, the right pallidum, the right accumbens area, the right anterior cingulate gyrus and sulcus and the right inferior superior parietal gyrus. The total FA sum of the edges in this subnetwork (NBS FA sum) was significantly reduced in ALS compared to controls (p < 0.0001).
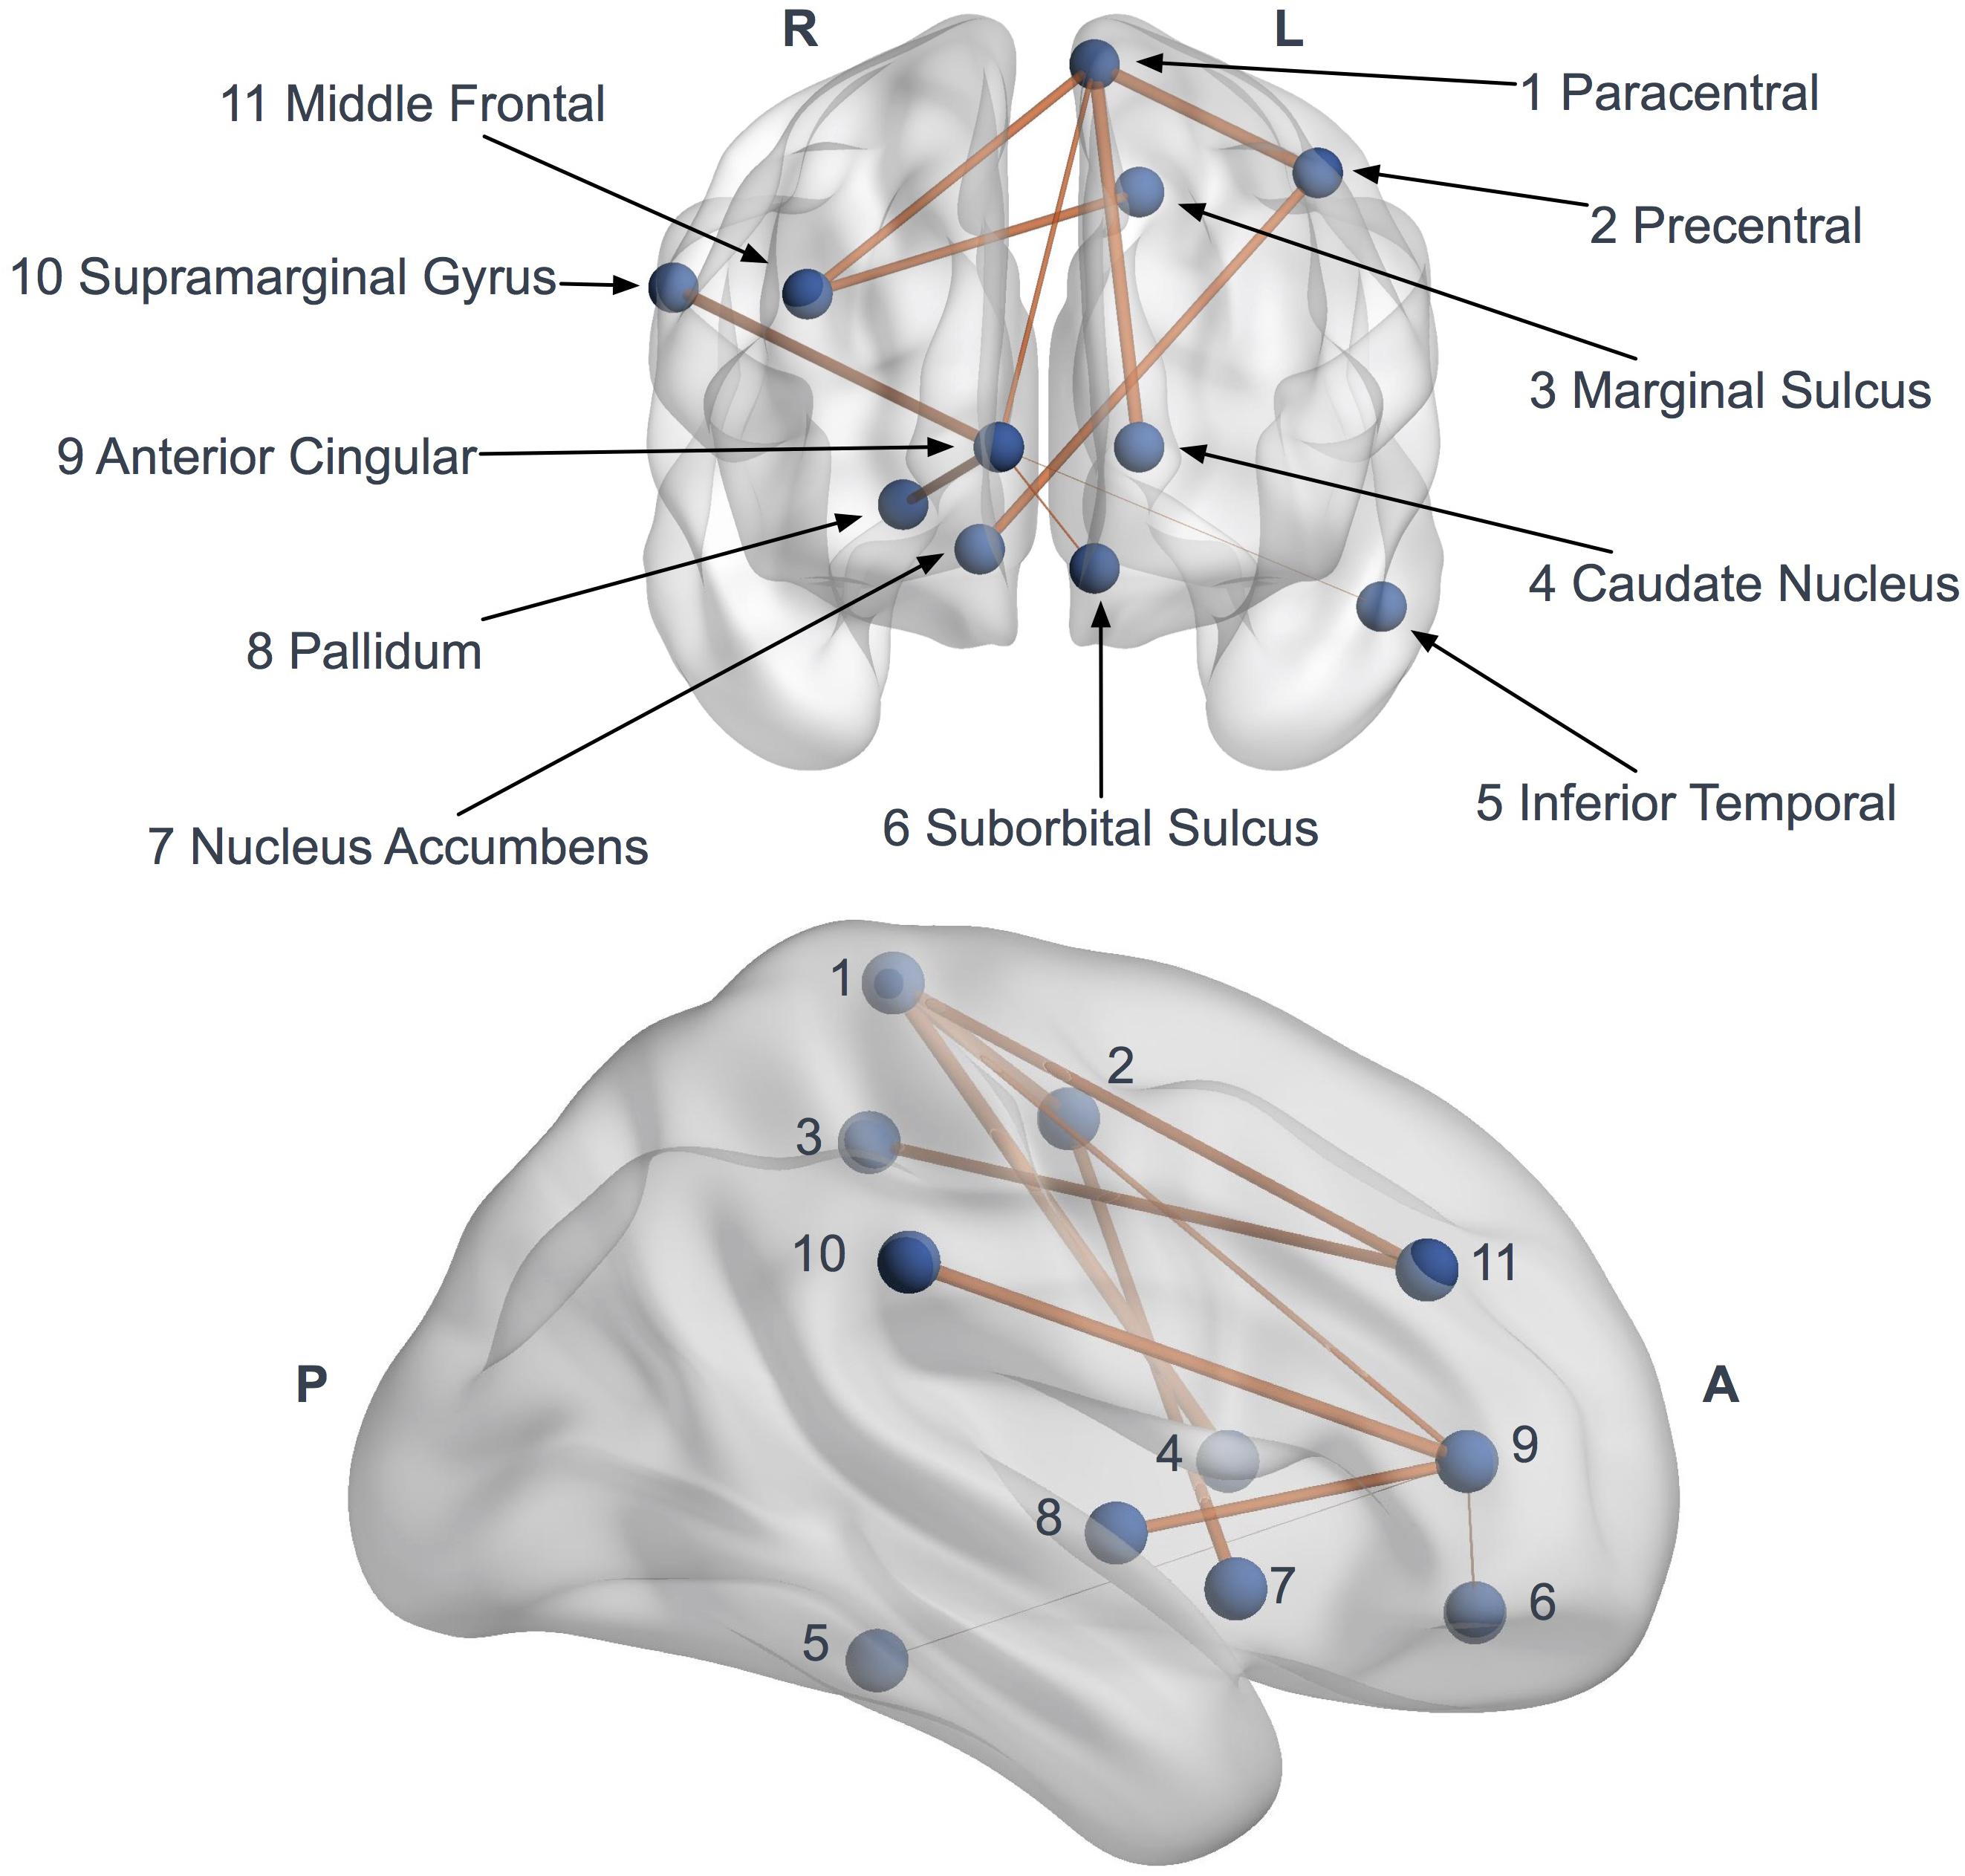
Figure 5. Network based statistics (NBS) impaired subnetwork. Coronal and sagittal views of impaired subnetwork nodes and interconnections identified by NBS (11 nodes and 10 edges). Edge diameter is based on the FA reduction (the larger connections are the more affected, with significant FA reduction).
Correlation Between Connectivity Metrics and Clinical Parameters
Among the six nodes identified in the Nodal Analysis results section, degree in the right frontal inferior sulcus was correlated with the disease progression rate (p = 0.0089, rho = −0.5396) and a trend of association was also identified with ALSFRS-R scores (p = 0.0456, rho = 0.4033).
No significant correlations were found between the other nodes and ALSFRS-R score or disease progression rate. There were no significant associations between Eglob and ALSFRS-R score or disease progression rate.
Discussion
This study provides evidence of disease-specific structural connectivity changes in ALS. We report global efficiency reductions in structural networks in ALS characterized by a significant decrease in Eglob and a trend of mean degree reduction. The use of the graph theory enables a topological study of the entire cerebral network, without targeting a priori regions of interest. Our results are in line with the reports of decreased of Eglob in previous studies (Zhang et al., 2019). Our findings also support the notion of widespread, multisystem, multi-network degeneration in ALS which has been conceived based on other structural (Keil et al., 2012; Menke et al., 2012; Bede et al., 2016; Müller et al., 2016) and functional methods (Agosta et al., 2011; Douaud et al., 2011; Geevasinga et al., 2017; Dukic et al., 2019; Nasseroleslami et al., 2019). Reduced global connectivity underpins the impaired integration of multiple cerebral circuits in ALS, which may be driven by long-range connectivity changes (He et al., 2009). Previous structural connectivity studies did not capture significant reductions in global parameters (Verstraete et al., 2011; Buchanan et al., 2015) which may be explained by differences in post processing pipelines which were used to generate structural connectomes (deterministic fiber tracking algorithm, number of tracts or different parcellation atlas).
At a local scale, we evaluated parcellated brain regions with multiple metrics (Eloc, degree and betweenness centrality) to determine if the global disturbances were due to the alteration of specific nodes. Nodal analysis demonstrated a significant reduction of degree in 6 out of 164 regions in ALS patients. These six nodes are located in pathognomonic brain regions closely associated with ALS. Precentral and frontal structural degeneration is a hallmark feature of ALS confirmed by a multitude of cortical gray and subcortical white matter studies (Kasper et al., 2014; Schuster et al., 2016; Mazón et al., 2018). The intraparietal sulcus is part of the supplementary motor areas which is also affected in ALS based on both functional and structural studies (Abidi et al., 2019). The involvement of the temporal lingual sulcus may be the substrate of the spectrum of cognitive changes observed in ALS (Abrahams et al., 2004; Phukan et al., 2007). Intrahemispheric connectivity alterations and the degeneration of the sensorimotor network have also been previously reported in ALS by studies demonstrating widespread pre- and postcentral FA reductions (Rose et al., 2012).
To explore internodal interactions, we used NBS (Zalesky et al., 2010). This tool permits the integrated analysis of a subgroup of nodes that belongs to a single altered network. In our study, we identified an impaired subnetwork centered on motor nodes: precentral, paracentral and frontal gyri. This subnetwork is comparable to the ones described in previous studies (Verstraete et al., 2011; Buchanan et al., 2015). Our finding of parietal and temporal lobe involvement is in line with recently proposed pathological staging systems (Brettschneider et al., 2013), and longitudinal connectivity studies (Verstraete et al., 2014).
Interestingly, no major topological reorganization of hubs was evidenced in ALS in the present study. The human connectome is known to follow characteristic topological patterns based on hubs, defined by a subnetwork of highly connected nodes with a high number of tracts playing a central role in the brain’s structural architecture. Due to their anatomical position and their high metabolic demands, these regions are considered particularly vulnerable in many neurological and psychiatric disorders (Buckner et al., 2009; Sharma et al., 2011; Rubinov and Bullmore, 2013; Gollo et al., 2018). Previous studies have shown that the selective hub degeneration occurs in a disease-specific pattern in several neurological and psychiatric conditions such as Alzheimer’s disease or schizophrenia (Crossley et al., 2014). Hub pathology in ALS, however, has not been specifically investigated to date and no graph theory based structural studies have been performed to evaluate the distribution of hubs and the extent to which they are reorganized in ALS patients relative to controls. We showed here that both the number and the distribution of hubs are similar between patients and controls. To our knowledge, this first use of the hub disruption index in ALS demonstrating the absence of hub reorganization, suggests that disease propagation in ALS does not follow hub-based patterns. Despite motor network changes evidenced by the NBS analysis, the precentral nodes kept their hub properties. Impairment of the global efficiency seems to be related to local structural abnormalities rather than a complex compensatory hub reorganization as reported in other disorders such as multiple sclerosis and epilepsy (Ridley et al., 2015; Faivre et al., 2016; Tur et al., 2018).
Noteworthy, we found associations between structural connectivity metrics and clinical parameters, such as disease progression rate and ALSFRS-R score. Correlations between brain imaging metrics and clinical parameters are often difficult to establish in ALS (Chipika et al., 2019) because motor disability is not merely due to upper but also lower motor neuron degeneration and the considerable clinical heterogeneity of the disease precludes direct clinico-radiological associations (Verstraete et al., 2015). It is therefore not surprising that no direct correlations were identified between clinical parameters and global connectivity measures. Node degree and their white matter integrity indexes seem to better explain the clinical deficits observed in ALS.
This study is not without limitations. The sample size of our ALS cohort is relatively limited which did not allow the phenotypic stratification of ALS patients into subgroups. Nonetheless, our study presents compelling evidence that graph-analyses and connectomics provide meaningful non-invasive insights into the degenerative changes of ALS. Furthermore, genetic information was not available for all patients which is a limitation as certain ALS genotypes may be associated with specific white matter alterations and more extensive network impairment (Menke et al., 2016; Floeter and Gendron, 2018). The lack of standardized cognitive evaluation is another limitation given the evidence of phenotype-specific morphometric changes along the ALS-FTD continuum (Omer et al., 2017). Future studies should therefore include ALS-FTD patients and ALS patients with behavioral and executive dysfunction to characterize the connectivity signature of these cognitive phenotypes. An additional limitation is the significantly higher proportion of male ALS patients in the present study. Given the evidence of gender-associated developmental and radiological features in ALS and healthy populations (Menzler et al., 2011; Vivekananda et al., 2011; Bede et al., 2014), future connectivity studies should seek to recruit gender-balanced cohorts.
Conclusion
In conclusion, our structural connectivity study highlights a diffuse, non-focal network impairment in ALS without selective hubs vulnerability or topological network reorganization. These results suggest that clinical manifestations in ALS could be more driven by tract degeneration than by hub topology alterations. Based on these observations, a prospective longitudinal study is required to characterize dynamic progressive connectivity changes. Recent imaging studies have shown evidence of considerable presymptomatic structural changes in ALS-associated mutation carriers (Schuster et al., 2015; Querin et al., 2019). A connectomic analysis of such cohorts could identify early network alterations in the most vulnerable circuits and provide invaluable insights on disease propagation.
Data Availability Statement
Anonymized datasets generated in this study may be available on request from the corresponding author, but are subject to institutional and EU data handling procedures.
Ethics Statement
The studies involving human participants were reviewed and approved by Sud Mediterranee I Ethics Committee. The patients/participants provided their written informed consent to participate in this study.
Author Contributions
All authors contributed scientifically to this manuscript. Clinical evaluations were performed by A-MG, AV, and SA. The methodological design was optimized by A-MG, MG, J-PR, and WZ. Image processing was undertaken by EF, AL, and BR. Data analyses were conducted by EF, A-MG, BR, J-PR, and WZ. The manuscript was drafted by EF, A-MG, and WZ. All co-authors have reviewed the manuscript for intellectual content.
Funding
This research was funded by APHM (AORC Junior 2014 program) and by ANR (grant ANR-15-CE19-0019-01). CRMBM is a laboratory member of the France Life Imaging network (grant ANR-11-INBS-0006).
Conflict of Interest
The authors declare that the research was conducted in the absence of any commercial or financial relationships that could be construed as a potential conflict of interest.
Acknowledgments
We thank L. Pini, C. Costes, P. Viout, and S. Confort-Gouny for their contribution to MRI data acquisition. We also thank H. Kribich, N. Mispeleare, and V. Gimenez for their logistical support.
Abbreviations
ALS:, amyotrophic lateral sclerosis; ALSFRS-R:, revised ALS functional rating scale; BC:, betweenness centrality; CSF:, cerebrospinal fluid; DTI:, diffusion tensor imaging; Eglob:, global efficiency; Eloc:, local efficiency; FA:, fractional anisotropy; FTD:, frontotemporal dementia; NBS:, network-based statistics; ROI:, region of interest.
Footnotes
- ^ http://surfer.nmr.mgh.harvard.edu
- ^ https://www.fil.ion.ucl.ac.uk/spm/software/spm12/
- ^ https://fsl.fmrib.ox.ac.uk
- ^ http://www.brain.org.au/software/
References
Abidi, M., Marco, G., Couillandre, A., Feron, M., Mseddi, E., Termoz, N., et al. (2019). Adaptive functional reorganization in amyotrophic lateral sclerosis: coexisting degenerative and compensatory changes. Eur. J. Neurol. doi: 10.1111/ene.14042 [Epub ahead of print].
Abrahams, S., Goldstein, L. H., Simmons, A., Brammer, M., Williams, S. C. R., Giampietro, V., et al. (2004). Word retrieval in amyotrophic lateral sclerosis: a functional magnetic resonance imaging study. Brain 127, 1507–1517. doi: 10.1093/brain/awh170
Achard, S. (2006). A resilient, low-frequency, small-world human brain functional network with highly connected association cortical hubs. J. Neurosci. 26, 63–72. doi: 10.1523/JNEUROSCI.3874-05.2006
Agosta, F., Pagani, E., Petrolini, M., Caputo, D., Perini, M., Prelle, A., et al. (2010). Assessment of white matter tract damage in patients with amyotrophic lateral sclerosis: a diffusion tensor MR imaging tractography study: fig 1. AJNR Am. J. Neuroradiol. 31, 1457–1461. doi: 10.3174/ajnr.A2105
Agosta, F., Valsasina, P., Absinta, M., Riva, N., Sala, S., Prelle, A., et al. (2011). Sensorimotor functional connectivity changes in amyotrophic lateral sclerosis. Cereb. Cortex 21, 2291–2298. doi: 10.1093/cercor/bhr002
Al-Chalabi, A., Hardiman, O., Kiernan, M. C., Chiò, A., Rix-Brooks, B., and van den Berg, L. H. (2016). Amyotrophic lateral sclerosis: moving towards a new classification system. Lancet Neurol. 15, 1182–1194. doi: 10.1016/S1474-4422(16)30199-5
Avants, B., Epstein, C., Grossman, M., and Gee, J. (2008). Symmetric diffeomorphic image registration with cross-correlation: evaluating automated labeling of elderly and neurodegenerative brain. Med. Image Anal. 12, 26–41. doi: 10.1016/j.media.2007.06.004
Bede, P. (2017). Deciphering neurodegeneration: a paradigm shift from focality to connectivity. Neurology 89, 1758–1759. doi: 10.1212/WNL.0000000000004582
Bede, P., Elamin, M., Byrne, S., and Hardiman, O. (2014). Sexual dimorphism in ALS: exploring gender-specific neuroimaging signatures. Amyotroph Lateral Scler Frontotemporal Degener 15, 235–243. doi: 10.3109/21678421.2013.865749
Bede, P., and Hardiman, O. (2014). Lessons of ALS imaging: pitfalls and future directions — a critical review. NeuroImage 4, 436–443. doi: 10.1016/j.nicl.2014.02.011
Bede, P., Iyer, P. M., Finegan, E., Omer, T., and Hardiman, O. (2017). Virtual brain biopsies in amyotrophic lateral sclerosis: diagnostic classification based on in vivo pathological patterns. NeuroImage 15, 653–658. doi: 10.1016/j.nicl.2017.06.010
Bede, P., Iyer, P. M., Schuster, C., Elamin, M., Mclaughlin, R. L., Kenna, K., et al. (2016). The selective anatomical vulnerability of ALS: ‘disease-defining’ and ‘disease-defying’ brain regions. Amyotroph. Lateral Scler. Frontotemporal Degener. 17, 561–570. doi: 10.3109/21678421.2016.1173702
Bede, P., Omer, T., Finegan, E., Chipika, R. H., Iyer, P. M., Doherty, M. A., et al. (2018). Connectivity-based characterisation of subcortical grey matter pathology in frontotemporal dementia and ALS: a multimodal neuroimaging study. Brain Imag. Behav. 12, 1696–1707. doi: 10.1007/s11682-018-9837-9
Behrens, T. E. J., Woolrich, M. W., Jenkinson, M., Johansen-Berg, H., Nunes, R. G., Clare, S., et al. (2003). Characterization and propagation of uncertainty in diffusion-weighted MR imaging. Magn. Reson. Med. 50, 1077–1088. doi: 10.1002/mrm.10609
Besson, P., Dinkelacker, V., Valabregue, R., Thivard, L., Leclerc, X., Baulac, M., et al. (2014). Structural connectivity differences in left and right temporal lobe epilepsy. NeuroImage 100, 135–144. doi: 10.1016/j.neuroimage.2014.04.071
Brettschneider, J., Del Tredici, K., Toledo, J. B., Robinson, J. L., Irwin, D. J., Grossman, M., et al. (2013). Stages of pTDP-43 pathology in amyotrophic lateral sclerosis: ALS Stages. Ann. Neurol. 74, 20–38. doi: 10.1002/ana.23937
Brooks, B. R., Miller, R. G., Swash, M., and Munsat, T. L. (2000). El Escorial revisited: revised criteria for the diagnosis of amyotrophic lateral sclerosis. Amyotroph. Lateral Scler. Other Motor Neuron Disord. 1, 293–299. doi: 10.1080/146608200300079536
Buchanan, C. R., Pettit, L. D., Storkey, A. J., Abrahams, S., and Bastin, M. E. (2015). Reduced structural connectivity within a prefrontal-motor-subcortical network in amyotrophic lateral sclerosis: reduced Structural Connectivity in ALS. J. Magn. Reson. Imag. 41, 1342–1352. doi: 10.1002/jmri.24695
Buckner, R. L., Sepulcre, J., Talukdar, T., Krienen, F. M., Liu, H., Hedden, T., et al. (2009). Cortical hubs revealed by intrinsic functional connectivity: mapping, assessment of stability, and relation to alzheimer’s disease. J. Neurosci. 29, 1860–1873. doi: 10.1523/JNEUROSCI.5062-08.2009
Bullmore, E., and Sporns, O. (2009). Complex brain networks: graph theoretical analysis of structural and functional systems. Nat. Rev. Neurosci. 10, 186–198. doi: 10.1038/nrn2575
Cedarbaum, J. M., Stambler, N., Malta, E., Fuller, C., Hilt, D., Thurmond, B., et al. (1999). The ALSFRS-R: a revised ALS functional rating scale that incorporates assessments of respiratory function. J. Neurol. Sci. 169, 13–21. doi: 10.1016/S0022-510X(99)00210-5
Chipika, R. H., Finegan, E., Li Hi Shing, S., Hardiman, O., and Bede, P. (2019). Tracking a fast-moving disease: longitudinal markers, monitoring, and clinical trial endpoints in ALS. Front. Neurol. 10:229. doi: 10.3389/fneur.2019.00229
Christidi, F., Karavasilis, E., Rentzos, M., Kelekis, N., Evdokimidis, I., and Bede, P. (2018). Clinical and radiological markers of extra-motor deficits in amyotrophic lateral sclerosis. Front. Neurol. 9:1005. doi: 10.3389/fneur.2018.01005
Cirillo, M., Esposito, F., Tedeschi, G., Caiazzo, G., Sagnelli, A., Piccirillo, G., et al. (2012). Widespread microstructural white matter involvement in amyotrophic lateral sclerosis: a whole-brain DTI study. AJNR Am. J. Neuroradiol. 33, 1102–1108. doi: 10.3174/ajnr.A2918
Consonni, M., Cappa, S. F., Dalla Bella, E., Contarino, V. E., and Lauria, G. (2019). Cortical correlates of behavioural change in amyotrophic lateral sclerosis. J. Neurol. Neurosurg. Psychiatry 90, 380–386. doi: 10.1136/jnnp-2018-318619
Crossley, N. A., Mechelli, A., Scott, J., Carletti, F., Fox, P. T., McGuire, P., et al. (2014). The hubs of the human connectome are generally implicated in the anatomy of brain disorders. Brain 137, 2382–2395. doi: 10.1093/brain/awu132
Destrieux, C., Fischl, B., Dale, A., and Halgren, E. (2010). Automatic parcellation of human cortical gyri and sulci using standard anatomical nomenclature. NeuroImage 53, 1–15. doi: 10.1016/j.neuroimage.2010.06.010
Dimond, D., Ishaque, A., Chenji, S., Mah, D., Chen, Z., Seres, P., et al. (2017). White matter structural network abnormalities underlie executive dysfunction in amyotrophic lateral sclerosis: structural disconnectivity and cognition in ALS. Hum. Brain Mapp. 38, 1249–1268. doi: 10.1002/hbm.23452
Douaud, G., Filippini, N., Knight, S., Talbot, K., and Turner, M. R. (2011). Integration of structural and functional magnetic resonance imaging in amyotrophic lateral sclerosis. Brain 134, 3470–3479. doi: 10.1093/brain/awr279
Dukic, S., McMackin, R., Buxo, T., Fasano, A., Chipika, R., Pinto-Grau, M., et al. (2019). Patterned functional network disruption in amyotrophic lateral sclerosis. Hum. Brain Mapp. doi: 10.1002/hbm.24740 [Epub ahead of print].
Faivre, A., Robinet, E., Guye, M., Rousseau, C., Maarouf, A., Le Troter, A., et al. (2016). Depletion of brain functional connectivity enhancement leads to disability progression in multiple sclerosis: a longitudinal resting-state fMRI study. Mult. Scler 22, 1695–1708. doi: 10.1177/1352458516628657
Floeter, M. K., and Gendron, T. F. (2018). Biomarkers for amyotrophic lateral sclerosis and frontotemporal dementia associated with hexanucleotide expansion mutations in C9orf72. Front. Neurol. 9:1063. doi: 10.3389/fneur.2018.01063
Foerster, B. R., Welsh, R. C., and Feldman, E. L. (2013). 25 years of neuroimaging in amyotrophic lateral sclerosis. Nat. Rev. Neurol. 9, 513–524. doi: 10.1038/nrneurol.2013.153
Geevasinga, N., Korgaonkar, M. S., Menon, P., Van den Bos, M., Gomes, L., Foster, S., et al. (2017). Brain functional connectome abnormalities in amyotrophic lateral sclerosis are associated with disability and cortical hyperexcitability. Eur. J. Neurol. 24, 1507–1517. doi: 10.1111/ene.13461
Gollo, L. L., Roberts, J. A., Cropley, V. L., Di Biase, M. A., Pantelis, C., Zalesky, A., et al. (2018). Fragility and volatility of structural hubs in the human connectome. Nat. Neurosci. 21, 1107–1116. doi: 10.1038/s41593-018-0188-z
Grolez, G., Moreau, C., Danel-Brunaud, V., Delmaire, C., Lopes, R., Pradat, P. F., et al. (2016). The value of magnetic resonance imaging as a biomarker for amyotrophic lateral sclerosis: a systematic review. BMC Neurol. 16:155. doi: 10.1186/s12883-016-0672-6
He, Y., Dagher, A., Chen, Z., Charil, A., Zijdenbos, A., Worsley, K., et al. (2009). Impaired small-world efficiency in structural cortical networks in multiple sclerosis associated with white matter lesion load. Brain 132, 3366–3379. doi: 10.1093/brain/awp089
Kalra, S. (2019). Magnetic resonance spectroscopy in ALS. Front. Neurol. 10:482. doi: 10.3389/fneur.2019.00482
Kasper, E., Schuster, C., Machts, J., Kaufmann, J., Bittner, D., Vielhaber, S., et al. (2014). Microstructural white matter changes underlying cognitive and behavioural impairment in ALS – an in vivo study using DTI. PLoS One 9:e114543. doi: 10.1371/journal.pone.0114543
Keil, C., Prell, T., Peschel, T., Hartung, V., Dengler, R., and Grosskreutz, J. (2012). Longitudinal diffusion tensor imaging in amyotrophic lateral sclerosis. BMC Neurosci. 13:141. doi: 10.1186/1471-2202-13-141
Kiernan, M. C., Vucic, S., Cheah, B. C., Turner, M. R., Eisen, A., Hardiman, O., et al. (2011). Amyotrophic lateral sclerosis. Lancet 377, 942–955. doi: 10.1016/S0140-6736(10)61156-7
Llufriu, S., Martinez-Heras, E., Solana, E., Sola-Valls, N., Sepulveda, M., Blanco, Y., et al. (2017). Structural networks involved in attention and executive functions in multiple sclerosis. NeuroImage 13, 288–296. doi: 10.1016/j.nicl.2016.11.026
Mazón, M., Vázquez Costa, J. F., Ten-Esteve, A., and Martí-Bonmatí, L. (2018). Imaging biomarkers for the diagnosis and prognosis of neurodegenerative diseases. example of amyotrophic lateral sclerosis. Front. Neurosci. 12:784. doi: 10.3389/fnins.2018.00784
Menke, R. A. L., Abraham, I., Thiel, C. S., Filippini, N., Knight, S., Talbot, K., et al. (2012). Fractional anisotropy in the posterior limb of the internal capsule and prognosis in amyotrophic lateral sclerosis. Arch. Neurol. 69:1493. doi: 10.1001/archneurol.2012.1122
Menke, R. A. L., Proudfoot, M., Wuu, J., Andersen, P. M., Talbot, K., Benatar, M., et al. (2016). Increased functional connectivity common to symptomatic amyotrophic lateral sclerosis and those at genetic risk. J. Neurol. Neurosurg. Psychiatry 87, 580–588. doi: 10.1136/jnnp-2015-311945
Menzler, K., Belke, M., Wehrmann, E., Krakow, K., Lengler, U., Jansen, A., et al. (2011). Men and women are different: diffusion tensor imaging reveals sexual dimorphism in the microstructure of the thalamus, corpus callosum and cingulum. Neuroimage 54, 2557–2562. doi: 10.1016/j.neuroimage.2010.11.029
Müller, H.-P., Turner, M. R., Grosskreutz, J., Abrahams, S., Bede, P., Govind, V., et al. (2016). A large-scale multicentre cerebral diffusion tensor imaging study in amyotrophic lateral sclerosis. J. Neurol. Neurosurg. Psychiatry 87, 570–579. doi: 10.1136/jnnp-2015-311952
Nasseroleslami, B., Dukic, S., Broderick, M., Mohr, K., Schuster, C., Gavin, B., et al. (2019). Characteristic increases in EEG connectivity correlate with changes of structural MRI in amyotrophic lateral sclerosis. Cereb. Cortex 29, 27–41. doi: 10.1093/cercor/bhx301
Omer, T., Finegan, E., Hutchinson, S., Doherty, M., Vajda, A., McLaughlin, R. L., et al. (2017). Neuroimaging patterns along the ALS-FTD spectrum: a multiparametric imaging study. Amyotrop. Lateral Scler. Frontotemporal Degener. 18, 611–623. doi: 10.1080/21678421.2017.1332077
Phukan, J., Pender, N. P., and Hardiman, O. (2007). Cognitive impairment in amyotrophic lateral sclerosis. Lancet Neurol. 6, 994–1003. doi: 10.1016/S1474-4422(07)70265-X
Proudfoot, M., Bede, P., and Turner, M. R. (2019). Imaging cerebral activity in amyotrophic lateral sclerosis. Front. Neurol. 9:1148. doi: 10.3389/fneur.2018.01148
Querin, G., Bede, P., El Mendili, M. M., Li, M., Pélégrini-Issac, M., Rinaldi, D., et al. (2019). Presymptomatic spinal cord pathology in c9orf72 mutation carriers: a longitudinal neuroimaging study. Ann. Neurol. 86, 158–167. doi: 10.1002/ana.25520
Rascovsky, K., Hodges, J. R., Knopman, D., Mendez, M. F., Kramer, J. H., Neuhaus, J., et al. (2011). Sensitivity of revised diagnostic criteria for the behavioural variant of frontotemporal dementia. Brain 134, 2456–2477. doi: 10.1093/brain/awr179
Ridley, B. G. Y., Rousseau, C., Wirsich, J., Le Troter, A., Soulier, E., Confort-Gouny, S., et al. (2015). Nodal approach reveals differential impact of lateralized focal epilepsies on hub reorganization. NeuroImage 118, 39–48. doi: 10.1016/j.neuroimage.2015.05.096
Rose, S., Pannek, K., Bell, C., Baumann, F., Hutchinson, N., Coulthard, A., et al. (2012). Direct evidence of intra- and interhemispheric corticomotor network degeneration in amyotrophic lateral sclerosis: an automated MRI structural connectivity study. NeuroImage 59, 2661–2669. doi: 10.1016/j.neuroimage.2011.08.054
Rubinov, M., and Bullmore, E. (2013). Schizophrenia and abnormal brain network hubs. Dialog. Clin. Neurosci. 15, 339–349.
Rubinov, M., and Sporns, O. (2010). Complex network measures of brain connectivity: uses and interpretations. NeuroImage 52, 1059–1069. doi: 10.1016/j.neuroimage.2009.10.003
Schuster, C., Elamin, M., Hardiman, O., and Bede, P. (2015). Presymptomatic and longitudinal neuroimaging in neurodegeneration—from snapshots to motion picture: a systematic review. J. Neurol. Neurosurg. Psychiatry 86, 1089–1096. doi: 10.1136/jnnp-2014-309888
Schuster, C., Elamin, M., Hardiman, O., and Bede, P. (2016). The segmental diffusivity profile of amyotrophic lateral sclerosis associated white matter degeneration. Eur. J. Neurol. 23, 1361–1371. doi: 10.1111/ene.13038
Schuster, C., Hardiman, O., and Bede, P. (2017). Survival prediction in amyotrophic lateral sclerosis based on MRI measures and clinical characteristics. BMC Neurol. 17:73. doi: 10.1186/s12883-017-0854-x
Sharma, K. R., Saigal, G., Maudsley, A. A., and Govind, V. (2011). 1H MRS of basal ganglia and thalamus in amyotrophic lateral sclerosis. NMR Biomed. 24, 1270–1276. doi: 10.1002/nbm.1687
Tang, M., Chen, X., Zhou, Q., Liu, B., Liu, Y., Liu, S., et al. (2015). Quantitative assessment of amyotrophic lateral sclerosis with diffusion tensor imaging in 3.0T magnetic resonance. Int. J. Clin. Exp. Med. 8, 8295–8303.
Tur, C., Eshaghi, A., Altmann, D. R., Jenkins, T. M., Prados, F., Grussu, F., et al. (2018). Structural cortical network reorganization associated with early conversion to multiple sclerosis. Sci. Rep. 8:10715. doi: 10.1038/s41598-018-29017-1
van den Heuvel, M. P., and Sporns, O. (2011). Rich-club organization of the human connectome. J. Neurosci. 31, 15775–15786. doi: 10.1523/JNEUROSCI.3539-11.2011
van den Heuvel, M. P., Sporns, O., Collin, G., Scheewe, T., Mandl, R. C. W., Cahn, W., et al. (2013). Abnormal rich club organization and functional brain dynamics in schizophrenia. JAMA Psychiatry 70:783. doi: 10.1001/jamapsychiatry.2013.1328
Verstraete, E., Turner, M. R., Grosskreutz, J., Filippi, M., and Benatar, M. (2015). Mind the gap: the mismatch between clinical and imaging metrics in ALS. Amyotrop. Lateral Scler. Frontotemporal Degener. 16, 524–529. doi: 10.3109/21678421.2015.1051989
Verstraete, E., Veldink, J. H., Mandl, R. C. W., van den Berg, L. H., and van den Heuvel, M. P. (2011). Impaired structural motor connectome in amyotrophic lateral sclerosis. PLoS One 6:e24239. doi: 10.1371/journal.pone.0024239
Verstraete, E., Veldink, J. H., van den Berg, L. H., and van den Heuvel, M. P. (2014). Structural brain network imaging shows expanding disconnection of the motor system in amyotrophic lateral sclerosis: expanding motor disconnection in ALS. Hum. Brain Mapp. 35, 1351–1361. doi: 10.1002/hbm.22258
Vivekananda, U., Manjalay, Z.-R., Ganesalingam, J., Simms, J., Shaw, C. E., Leigh, P. N., et al. (2011). Low index-to-ring finger length ratio in sporadic ALS supports prenatally defined motor neuronal vulnerability. J. Neurol. Neurosurg. Psychiatry 82, 635–637. doi: 10.1136/jnnp.2010.237412
Zalesky, A., Fornito, A., and Bullmore, E. T. (2010). Network-based statistic: identifying differences in brain networks. NeuroImage 53, 1197–1207. doi: 10.1016/j.neuroimage.2010.06.041
Keywords: ALS, MRI, connectivity, DTI, hub, graph theory
Citation: Fortanier E, Grapperon A-M, Le Troter A, Verschueren A, Ridley B, Guye M, Attarian S, Ranjeva J-P and Zaaraoui W (2019) Structural Connectivity Alterations in Amyotrophic Lateral Sclerosis: A Graph Theory Based Imaging Study. Front. Neurosci. 13:1044. doi: 10.3389/fnins.2019.01044
Received: 05 September 2019; Accepted: 17 September 2019;
Published: 02 October 2019.
Edited by:
Peter Bede, Trinity College Dublin, IrelandReviewed by:
Foteini Christidi, National and Kapodistrian University of Athens, GreeceEfstratios Karavasilis, National and Kapodistrian University of Athens, Greece
Copyright © 2019 Fortanier, Grapperon, Le Troter, Verschueren, Ridley, Guye, Attarian, Ranjeva and Zaaraoui. This is an open-access article distributed under the terms of the Creative Commons Attribution License (CC BY). The use, distribution or reproduction in other forums is permitted, provided the original author(s) and the copyright owner(s) are credited and that the original publication in this journal is cited, in accordance with accepted academic practice. No use, distribution or reproduction is permitted which does not comply with these terms.
*Correspondence: Aude-Marie Grapperon, YXVkZS1tYXJpZS5ncmFwcGVyb25AYXAtaG0uZnI=
 Etienne Fortanier1,2,3
 Aude-Marie Grapperon
 Jean-Philippe Ranjeva
 Wafaa Zaaraoui