Theta Oscillations Alternate With High Amplitude Neocortical Population Within Synchronized States
 Erin Munro Krull
 Shuzo Sakata
 Taro Toyoizumi
- 1RIKEN Center for Brain Science, Tokyo, Japan
- 2Beloit College, Beloit, WI, United States
- 3Strathclyde Institute of Pharmacy and Biomedical Sciences, University of Strathclyde, Glasgow, United Kingdom
A Corrigendum on
Theta Oscillations Alternate With High Amplitude Neocortical Population Within Synchronized States
by Munro Krull, E., Sakata, S., and Toyoizumi, T. (2019). Front. Neurosci. 13:316. doi: 10.3389/fnins.2019.00316
In the original article, there was a mistake in the legend for Figure 6 as published. In panels B and C, the average over all means is highlighted instead of the means for example experiments in panel A. The correct legend appears below.
Figure 6 | Neocortical activity differs depending on BL5- vs. THETA-dominant states. (A) CSD (color, mA/mm3) and spiking activity (black asterisks) from example anesthetized and unanesthetized experiments seen in previous figures. UP state onsets are marked by solid black lines, while DOWN state onsets are marked by dashed lines. (B) Top plot shows density of UP state amplitude and UP state amplitude peak location for individual experiments, along with the mean with respect to φ. Density is normalized for each φ bin, and the mean for a φ bin is calculated only if there are ≥ 30 points. We only included synchronized data points. Lower plots show the mean for all experiments, with highlighted results for the average over all experiment means. UP peak location is centered along the mean location for each experiment (UP location minus UP location mean). (C) Top left plot shows average spectrogram values over φ for the same example experiments as above, along with the mean peak frequency over φ. Other plots show means for all experiments, with highlighted results for the example experiment.
In the original article, there was also a mistake in Supplementary Table 3 as published. There is an error in UP Depth Anes. SUB Mean, Peak Frequency (<2.5 Hz) Unanes. BL5 Mean, and Peak Frequency Width (>2.5 Hz) Unanes. Test Statistic. The corrected Supplementary Table 3 appears below.
SUPPLEMENTARY TABLE 3
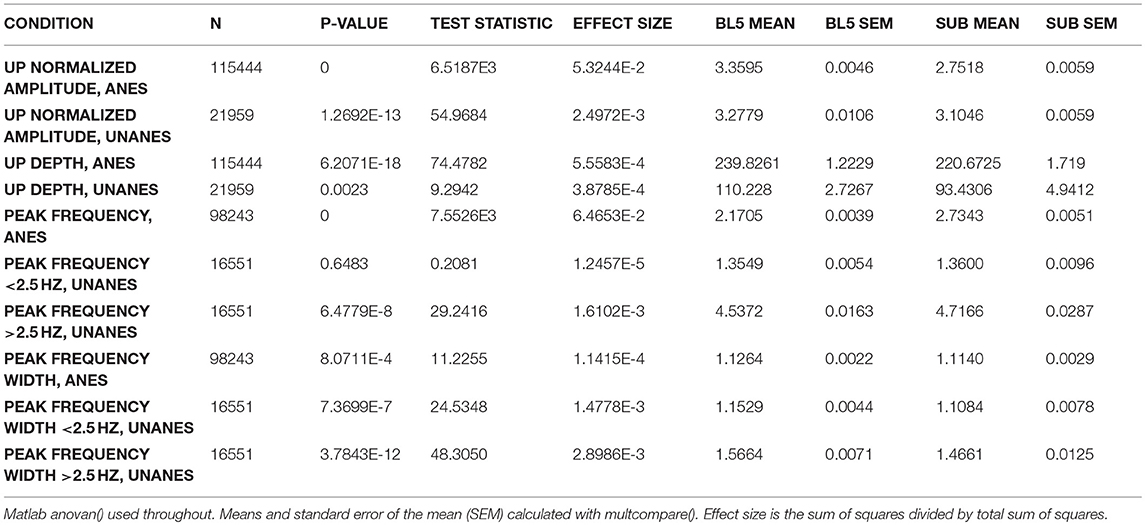
Supplementary Table 3. Statistical tests accompanying results in Figure 5.
The authors apologize for this error and state that this does not change the scientific conclusions of the article in any way. The original article has been updated.
Keywords: synchronized state, independent component analysis, theta oscillation, non-REM, slow oscillation, delta oscillation, cortical state
Citation: Munro Krull E, Sakata S and Toyoizumi T (2019) Corrigendum: Theta Oscillations Alternate With High Amplitude Neocortical Population Within Synchronized States. Front. Neurosci. 13:631. doi: 10.3389/fnins.2019.00631
Received: 22 May 2019; Accepted: 31 May 2019;
Published: 25 June 2019.
Edited by:
Ritchie Edward Brown, VA Boston Healthcare System, United StatesReviewed by:
Adrien Peyrache, McGill University, CanadaCopyright © 2019 Munro Krull, Sakata and Toyoizumi. This is an open-access article distributed under the terms of the Creative Commons Attribution License (CC BY). The use, distribution or reproduction in other forums is permitted, provided the original author(s) and the copyright owner(s) are credited and that the original publication in this journal is cited, in accordance with accepted academic practice. No use, distribution or reproduction is permitted which does not comply with these terms.
*Correspondence: Erin Munro Krull, ecmun2002@yahoo.com