 Zheshan Guo
 Zhouyan Feng
 Yang Wang
 Xuefeng Wei
94% of researchers rate our articles as excellent or good
Learn more about the work of our research integrity team to safeguard the quality of each article we publish.
Find out more
ORIGINAL RESEARCH article
Front. Neurosci. , 22 November 2018
Sec. Neural Technology
Volume 12 - 2018 | https://doi.org/10.3389/fnins.2018.00858
This article is part of the Research Topic Neural Electroceuticals: Interfacing with the Nervous System with Electrical Stimulation View all 42 articles
Deep brain stimulation (DBS) has been successfully used in treating neural disorders in brain, such as Parkinson’s disease and epilepsy. However, the precise mechanisms of DBS remain unclear. Regular DBS therapy utilizes high-frequency stimulation (HFS) of electrical pulses. Among all of neuronal elements, axons are mostly inclined to be activated by electrical pulses. Therefore, the response of axons may play an important role in DBS treatment. To study the axonal responses during HFS, we developed a computational model of myelinated axon to simulate sequences of action potentials generated in single and multiple axons (an axon bundle) by stimulations. The stimulations are applied extracellularly by a point source of current pulses with a frequency of 50–200 Hz. Additionally, our model takes into account the accumulation of potassium ions in the peri-axonal spaces. Results show that the increase of extracellular potassium generates intermittent depolarization block in the axons during HFS. Under the state of alternate block and recovery, axons fire action potentials at a rate far lower than the frequency of stimulation pulses. In addition, the degree of axonal block is highly related to the distance between the axons and the stimulation point. The differences in the degree of block for individual axons in a bundle result in desynchronized firing among the axons. Stimulations with higher frequency and/or greater intensity can induce axonal block faster and increase the desynchronization effect on axonal firing. Presumably, the desynchronized axonal activity induced by HFS could generate asynchronous activity in the population of target neurons downstream thereby suppressing over-synchronized firing of neurons in pathological conditions. The desynchronization effect generated by intermittent activation of axons may be crucial for DBS therapy. The present study provides new insights into the mechanisms of DBS, which is significant for advancing the application of DBS.
Deep brain stimulation (DBS) is an effective clinical treatment for diseases of motor nervous system, such as Parkinson’s disease, essential tremors, and dystonia (Mehanna and Lai, 2013; Cury et al., 2017). It also exhibits potentials in treating epilepsy and other mental illness such as depression and obsession (Bergey, 2013; Blomstedt et al., 2013; Narang et al., 2016). However, the precise mechanisms of DBS action are still under debate.
Normally, DBS therapy is performed with continuous stimulation of electrical pulses. The efficacy of DBS is strongly related to the frequency of pulses, which is adjusted for optimal outcome of individual patient. The frequency range of effective stimulation in clinic is 90–200 Hz (commonly around 130 Hz), hence the stimulation is called high-frequency stimulation (HFS) (Birdno and Grill, 2008; Eusebio et al., 2011; Zhong et al., 2011; McConnell et al., 2012).
Both HFS and lesion therapy are found to produce similar effects on the relief of symptoms, thus HFS is originally assumed to inhibit the neuronal activity of stimulated areas in brain (Boraud et al., 1996; Anderson, 2006). For example, HFS activates axon terminals connecting inhibitory synapses, thus enhances the release of inhibitory neurotransmitters thereby inhibiting the activity of postsynaptic neurons (Johnson and McIntyre, 2008; Deniau et al., 2010; Chiken and Nambu, 2013). However, some research showed a contrary effect that HFS could facilitate the action potential firing of target neurons (Reese et al., 2011; Cleary et al., 2013). A recent hypothesis claims that desynchronization is more noteworthy than excitability change (Medeiros Dde and Moraes, 2014). Since over-synchronized activity of neurons is a pathological feature for many brain disorders such as Parkinson’s disease and epilepsy (Hammond et al., 2007; Jiruska et al., 2013), the role of HFS might be to decrease the synchronization among neurons (Deniau et al., 2010; Medeiros Dde and Moraes, 2014; Feng et al., 2017). However, it is not clear how HFS generates desynchronization.
Electrical pulses delivered from stimulating electrode are applied simultaneously on different elements of surrounding neurons, among which axon membrane is most inclined to be activated. Action potential may initiate at axon, even if soma locates closer to the stimulating electrode (Ranck, 1975; Nowak and Bullier, 1998; McIntyre and Grill, 1999). Therefore, the response of axon may play an important role in the action of DBS (Chomiak and Hu, 2007; Udupa and Chen, 2015). Some research showed that continuous HFS could generate depolarization block on axons, making axons fail to fire an action potential following every stimulating pulse (Jensen and Durand, 2009; Zheng et al., 2011; Feng et al., 2013, 2014). This depolarization block of axons may be an important mechanism underlying the desynchronization effect of HFS.
Previous studies suggest that accumulation of K+ in peri-axonal sub-myelin space during HFS contributes to the depolarization block of axons (Bellinger et al., 2008; Zheng et al., 2011). We hypothesize here that the depolarization block could be intermittent because of the fluctuation of sub-myelin K+ concentration during HFS thereby causing the axons to fire action potentials at a rate far lower than the frequency of stimulation pulses. Under this situation, the axonal firing generated within an axon bundle would be asynchronous thereby desynchronizing neuronal activity in the downstream projecting area.
To verify this hypothesis, we developed a computational model to simulate thin myelinated axons in brain and to study the effects of HFS on single and multiple axons (an axon bundle). Since current techniques of in vivo experiments do not allow intracellular recordings of multiple thin axons simultaneously to trace their reactions, this modeling study is significant for unraveling the desynchronization mechanism of axonal role in DBS.
To investigate the responses of axons to HFS, we utilized a computational model of thin myelinated axon in the central nervous system using NEURON v7.4. The axonal model was modified from a previous model (Bellinger et al., 2008). Bellinger’s model was adapted from motor nerve fibers (McIntyre and Grill, 2002; McIntyre et al., 2004). To simulate more closely the responses of brain neurons to HFS, we replaced the kinetic equations of ionic channels with those from axons of pyramidal neurons of brain (Bianchi et al., 2012) and altered other parameters such as axonal diameters, lengths of internode parts, and number of myelin lamella accordingly. Details of the model are described below, including the structures and parameter settings, the accumulation of extracellular K+, the administration of stimulation by a point source of current pulses extracellularly, as well as signal recording and analyzing.
The myelinated axon consists of 21 nodes of Ranvier (abbreviated as Node) and 20 internode parts (Figure 1). The outer diameter of the myelin sheath is set to 1 μm to simulate the thin axons of brain neurons (Wang et al., 2008). Thus, the internode length is set to 100 μm according to the ratio of axon diameter to internode length of 1:100 (Frijns et al., 1994). In this case, the total length of the axon is ∼2 mm. Additionally, according to the linear relationship between the thickness of myelin sheath and axon diameter (Schröder, 1972), the number of myelin lamellae is set to 15 layers. The morphological parameters of different parts of the axon model are listed in Table 1.
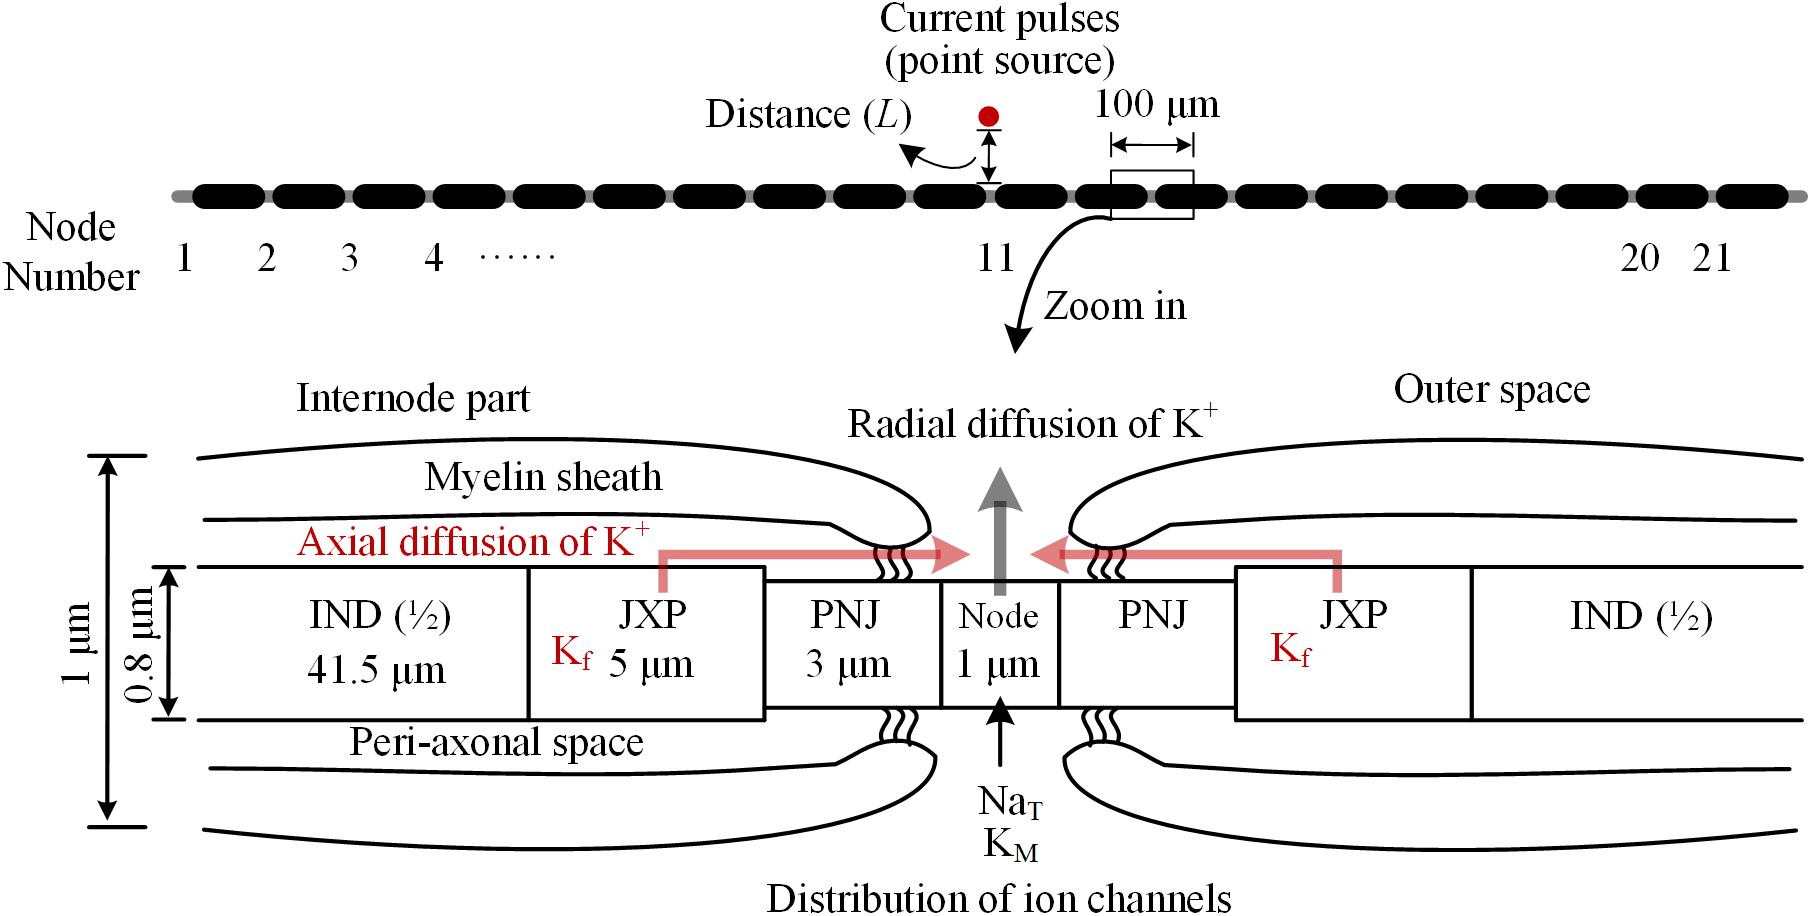
FIGURE 1. Schematic diagram of the model for thin myelinated axon, including structures, dimensions, and distributions of ionic channels. Top: Overview of the entire axon with 21 nodes of Ranvier (Node) and 20 internode parts. Bottom: Magnified view of a nodal region with the three sections surrounding each node: paranodal junction (PNJ), juxtaparanodes (JXP), and internode (IND). Axial and radial diffusion of K+ are shown by pink and gray arrow-lines, respectively.
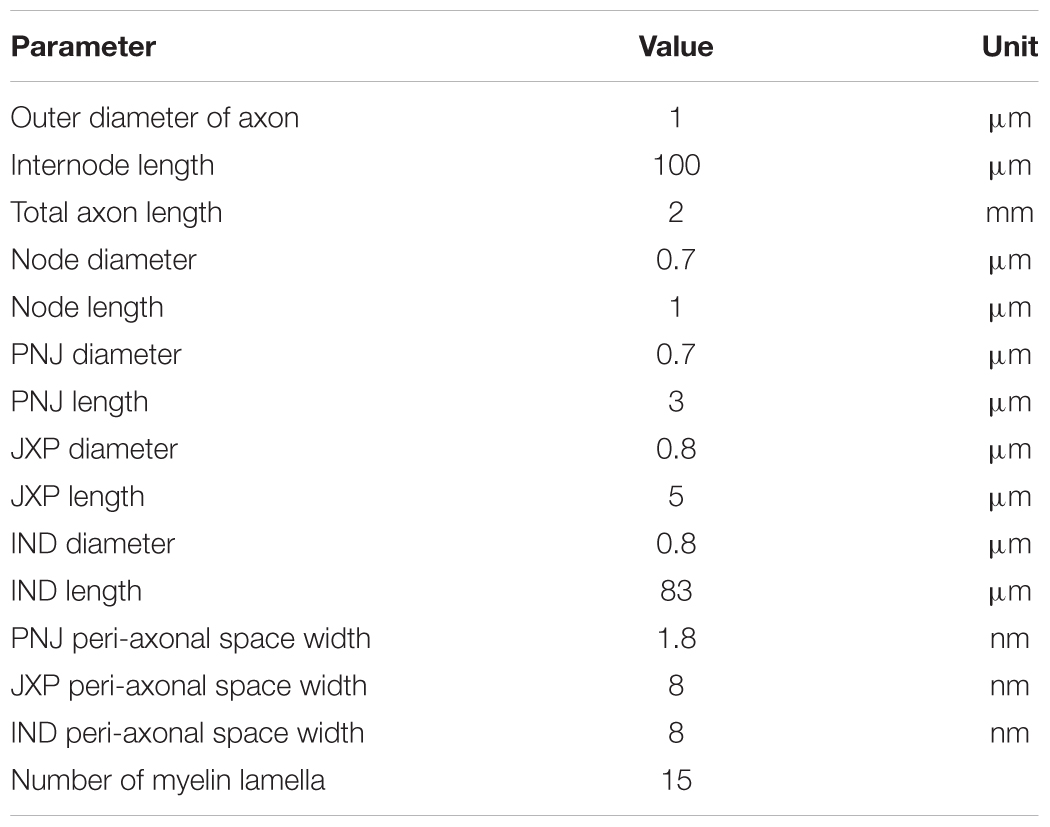
TABLE 1. Morphological parameters of the axon model.
As shown in Figure 1, inside the myelin sheath, each internode part is divided into two halves, each with three sections: a paranodal junction (PNJ), a juxtaparanode (JXP), and ½ internode (IND), from either side to the middle (Bellinger et al., 2008; Rasband and Peles, 2016). Therefore, each internode part contains two PNJ, two JXP, and one IND. These sections differ in both length and diameter. Particularly, IND is far longer than PNJ and JXP. “Peri-axonal space” refers to the space between axon membrane and surrounding myelin sheath, and its width changes along the internode parts (see Table 1).
The axon contains both passive and active electrical features (Table 2). The parameters of passive features include: resistivity for the axoplasm (ρa); capacitance (cm), leakage conductance (gLk), and leakage reversal potential (ELk) for the axon membrane; capacitance (cmy) and conductance (gmy) for the myelin. Resting potential of the axon membrane is set to -66 mV (Staff et al., 2000). The sodium (Na+) reversal potential is set to a fixed value 45 mV (Bianchi et al., 2012), whereas the potassium (K+) reversal potential varies with the changes of extracellular K+ concentration during HFS. The initial value of K+ reversal potential is -95 mV calculated by Nernst equation based on the initial K+ concentrations inside and outside the axon membrane (Table 3).
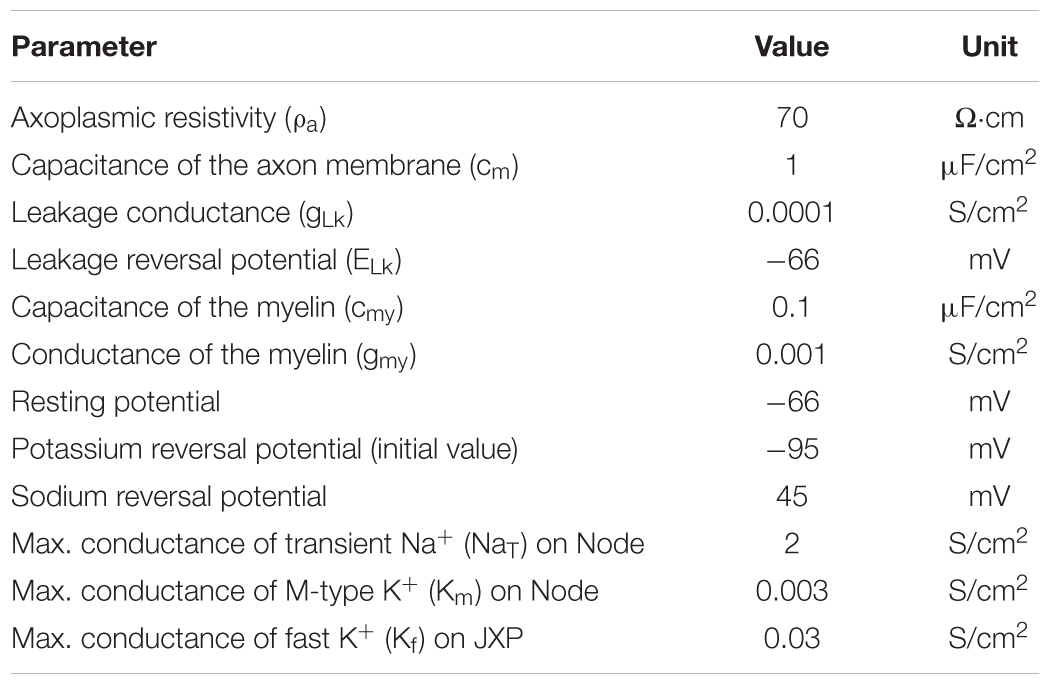
TABLE 2. Electrical parameters of the axon model.

TABLE 3. Parameters for modeling dynamics of K+ concentration.
The parameters of active features include the values of maximum conductance for three types of voltage-gated ionic channels: transient Na+ channel (NaT) and M-type K+ channel (KM) distributed on Node membrane; fast K+ channel (Kf) distributed on JXP membrane (Table 2 and Figure 1).
At node membrane, the NaT channels mainly correspond to an integration of sodium channel isoforms of Nav1.1 and Nav1.6 (Caldwell et al., 2000; Duflocq et al., 2008). The kinetic equation of NaT channels is adopted from literature (Bianchi et al., 2012), which was modified from the work with experimental results (Migliore et al., 1999). The maximum conductance of NaT is set to 2 S/cm2 according to the range of maximum Na+ conductance 1.3 ∼ 2.6 S/cm2, i.e., 1000 ∼ 2000 channels/μm2 and 13 pS/channel (Scholz et al., 1993; Waxman and Ritchie, 1993). The KM channels represent KCNQ isoforms (Kv7.2/7.3) (Devaux, 2004; Schwarz et al., 2006). The kinetic equation and maximum conductance of KM are adopted from literature (Bianchi et al., 2012). At JXP membrane, the Kf channel has been commonly used in computation modeling (Schwarz et al., 1995; McIntyre et al., 2004; Bellinger et al., 2008) to represent the ionic current of potassium corresponding to an integration of Kv isoforms such as Kv1.1 and Kv1.2 (Wang et al., 1993; Rasband and Trimmer, 2001; Rasband and Peles, 2016). The kinetic equation of Kf is adopted from previous models (McIntyre et al., 2004), and its maximum conductance is set to 0.03 S/cm2 (Bellinger et al., 2008). The three types of voltage-gated channels are dominant for generation and conduction of action potentials in myelinated brain axons (Rasband and Peles, 2016; Nelson and Jenkins, 2017).
Our axon model also takes into account NaK pumps and K+ diffusion as previous report (Bellinger et al., 2008). The concentration of K+ inside the axon membrane is set to constant 106 mM, and K+ concentration outside of the axon membrane ([K+]o) is initially set to 3 mM (Table 3). The K+ inside the membrane can only outflow through the K+ channels on the Node and JXP membranes. The outflowing K+ on the Node diffuses to the outer space radially. The outflowing K+ on the JXP can first flow into the peri-axon space, then diffuse axially to the outside of the Node and finally diffuse into outer space radially (Figure 1).
Both axial and radial diffusions of K+ follow the Fick’s law:
where J is the diffusion flux; D is the diffusion coefficient 1.85 μm2/ms; A is the cross section area of the diffusion zone; [K+]o is extracellular K+ concentration; x is the diffusion distance. Based on the data in Table 1, the axial area of the peri-axon space outside IND, JXP, and PNJ are 0.02, 0.02, and 0.004 μm2, respectively; the radial area of Node surface is 2.2 μm2, much larger than the axial area of peri-axon space (Table 3).
[K+]o is also regulated by NaK pump, which pumps out three Na+ and pumps in two K+ per ATP hydrolyzed. Assuming the NaK pumps are distributed evenly on the entire axon membrane, the ionic current (INaK) of NaK pump per unit area is (Bellinger et al., 2008):
where V is the membrane potential; [Na+]i is intracellular Na+ concentration; INaKmax is the maximum transport current per unit area; KmK and KmNa are the equilibrium binding constants of K+ and Na+, respectively (Table 3).
The parameter values of formulae (1) and (2) are listed in Table 3. The two formulae were used to simulate the dynamic changes of the K+ concentrations outside axon membrane.
Electrical stimulation is a sequence of monophasic current pulses with pulse width of 0.1 ms, pulse intensity of -0.1 to -0.5 mA, pulse frequency of 50, 130, or 200 Hz, and stimulation duration of 1 min.
Extracellular point source of stimulation is located above the 11th node of Ranvier (Node11), which is the center of axon (Figure 1). The extracellular potential (φ) at a specific part on the axon membrane generated by the stimulation point is:
where σ is the extracellular conductivity, which is set to 0.286 S/m; I is the pulse intensity of stimulations; r is the distance between the stimulation point, and the specific part of the axon.
An effective action potential induced by stimulation is defined as one that can spread to both axon ends successfully. Because the action potentials induced at the central node (Node11) can spread in both orthodromic and antidromic directions equally, the numbers of effective action potentials during stimulation periods are counted only at one end node (Node1) to evaluate the axonal conduction. Also, the membrane potential of the central Node11 together with the [K+]o in the peri-axonal space of the neighboring JXP are recorded to investigate the relation between accumulated K+ and HFS-induced action potentials.
Additionally, an index called “induction ratio” of axonal action potentials was used to evaluate the degree of intermittent depolarization block induced by the stimulations. The value of the index, represented as percentage, was defined as the reciprocal of the number of stimulation pulses in between two successive evoked action potentials. For example, if a second action potential is evoked following three successive pulses, that is, two of the pulses fail to induce effective action potential; then the induction ratio is 33%.
To study the integrate responses of multiple axons to HFS, 11 identical axons are spaced in parallel at an interval of 10 μm in a simplified model of axon bundle. The stimulation point is located at the same plane as the axons, above the axon center (Node11) of the topmost axon with a distance of 20 μm. Thus, the distances (L) from the stimulation point to the central nodes (Node11) of the 11 axons are in a range of 20–120 μm. Percentage ratio of effective action potentials in the 11 axons induced by each pulse is calculated, which is defined as “synchronization ratio.” If all of the 11 axons are activated by a pulse synchronously, the synchronization ratio is 100%. The curve of synchronization ratio is smoothed by sliding average of every 10 data points.
Our simulation results showed dynamics of the axonal responses to the pulses of HFS. For example, when a 130 Hz HFS was applied 50 μm above the central node (Node11) of axon (Figures 2A,B), the initial four pulses could all induce action potentials, which propagated to the end of axon (Node1) (Figures 2A,C). However, the fifth pulse only caused a change of potential on the Node11 membrane during the pulse and did not induce an action potential following the pulse (see the red arrow in Figure 2C). During the HFS, the induction ratio of action potentials gradually decreased from 100% to a steady value of 25% after 1.5 s of stimulation and maintained to the end of 1-min stimulation (Figure 2D), indicating that only one of every four pulses induces an action potential, intermittently.
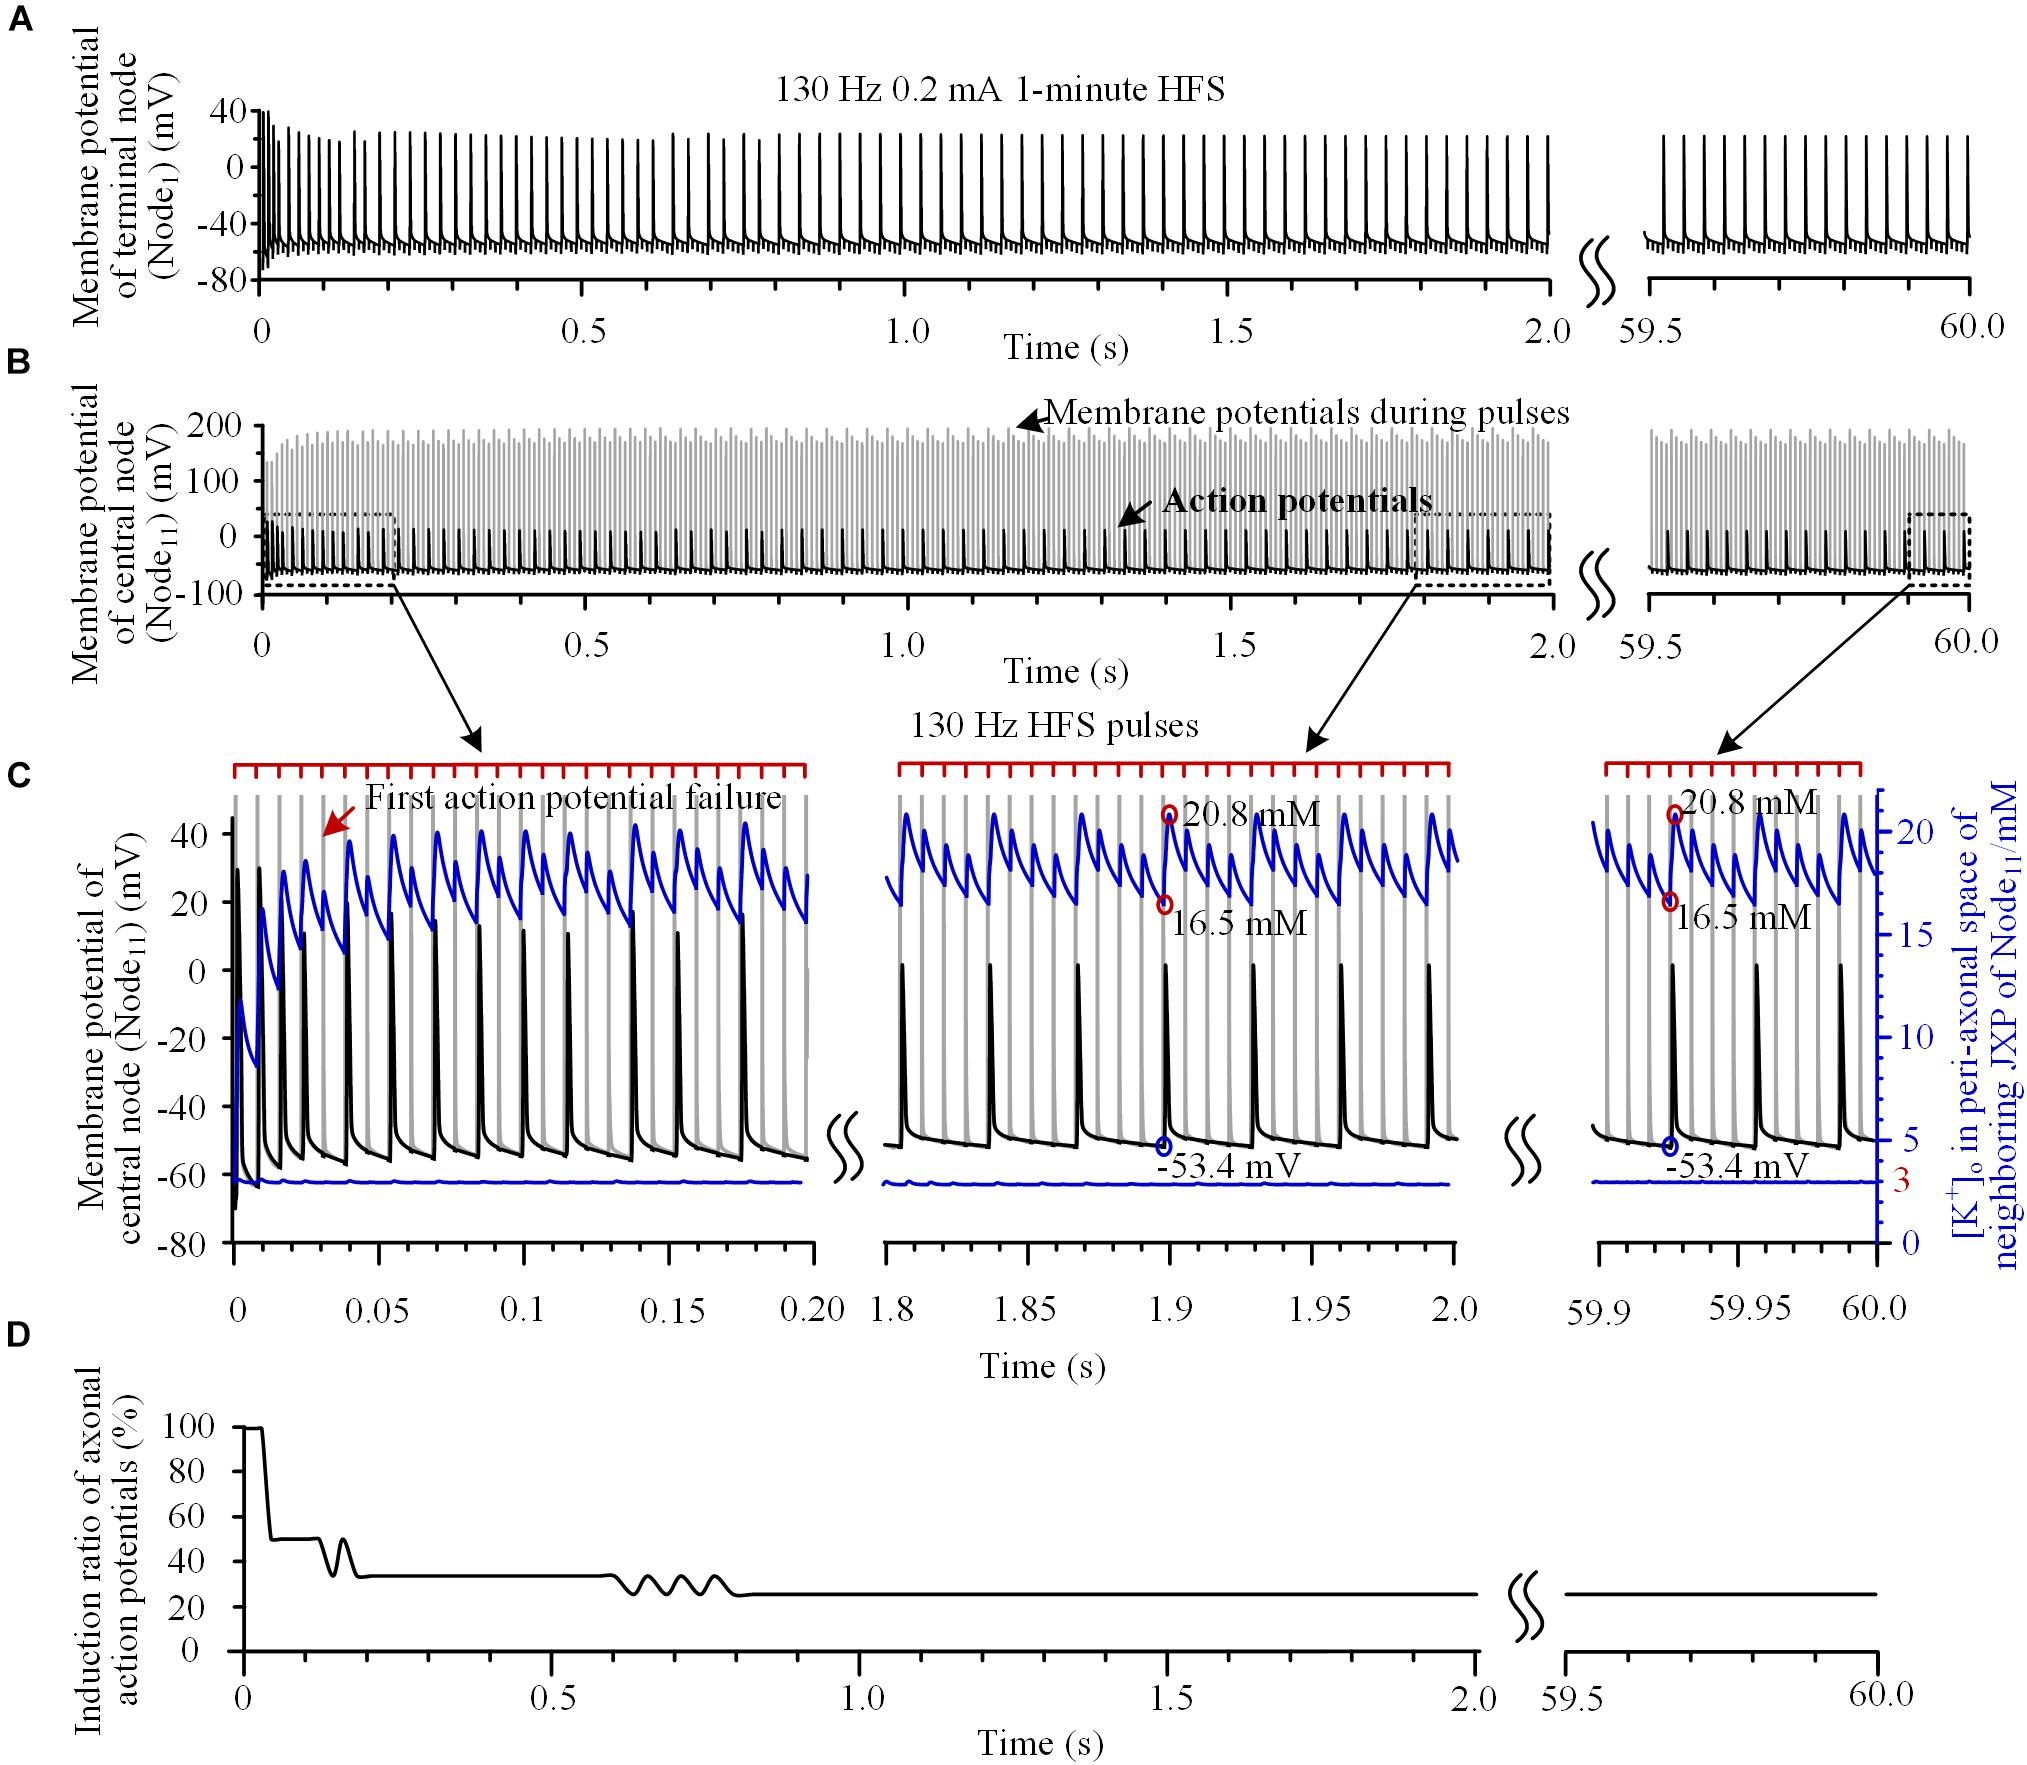
FIGURE 2. Action potentials and [K+]o induced by high-frequency stimulation (HFS). (A,B) Membrane potentials recorded simultaneously at the end node (Node1) and the central node (Node11) during a 1-min train of 130 Hz pulse stimulation with 0.2 mA intensity. For clarity, recordings in 2.0 ∼ 59.5 s are omitted. (C) Magnified plots of membrane potentials at Node11 (black curves), [K+]o at Node11 (blue curves below) and [K+]o in the peri-axonal space of neighboring JXP (blue curves up) during the first 0.2 s, middle 1.8 ∼ 2.0 s and last 0.1 s of the 1-min HFS. Cathodic monophasic pulses of extracellular HFS are represented by the tick marks on the red lines above. The gray curves in (B,C) represent changes of membrane potentials induced by pulses at Node11. These large potentials are trimmed in the enlarged plots in (C). (D) Change of induction ratio of axonal action potentials by pulses of HFS.
To test the hypothesis that the intermittent block of axon results from the fluctuation of sub-myelin [K+]o during HFS, we monitored [K+]o within the peri-axon space of JXP next to the central node (Node11). During the initial four pulses of HFS, the [K+]o increased rapidly from baseline 3 mM to over 14 mM (see the blue curve and right coordinate in Figure 2C). After the induction ratio of action potentials became stable (∼1.5 s after the onset of HFS), [K+]o fluctuated with lower and upper limits of 16.5 and 20.8 mM, respectively. The outflow of K+ during each action potential caused a large jump in [K+]o between the two concentration limits (circled in red on the blue curve in Figure 2C). A pulse that did not induce an action potential also caused a small increase in [K+]o due to an elevation of membrane potential. Because of the persistent effects of NaK pump and ion diffusion that remove K+ from the peri-axon space, [K+]o gradually decreased in a saw-toothed fashion in the intervals of action potentials and in the intervals of pulses. The changes of [K+]o were also steady after ∼1.5 s of stimulation accompanying the stabilization of induction ratio of action potentials. Since the axonal activity changed from transient to steady state after ∼1.5 s of stimulation, we only provide the data of first 2-s stimulation in the subsequent results.
The increase of [K+]o elevated the basic membrane potential of Node11 from -66 mV up to above -53.4 mV. When the [K+]o intermittently fell below 16.5 mM and the membrane potential fell below -53.4 mV, an action potential could be induced again (circled by blue on the black curve in Figure 2C). Nevertheless, the [K+]o immediately outside Node11 stayed at ∼3 mM during the entire HFS (Figure 2C, the blue line below). Therefore, the membrane depolarization caused by the increase of [K+]o within the peri-axon space of JXP might be the reason why the axon failed to fire an action potential following each stimulation pulse.
To verify this hypothesis, the mechanism of K+ accumulation outside the axon membrane was removed, i.e., the [K+]o was fixed at 3 mM. Then, during the same 130 Hz stimulation, every pulse could induce an action potential at Node11 (Figures 3A,B) that spread to the axon ends.
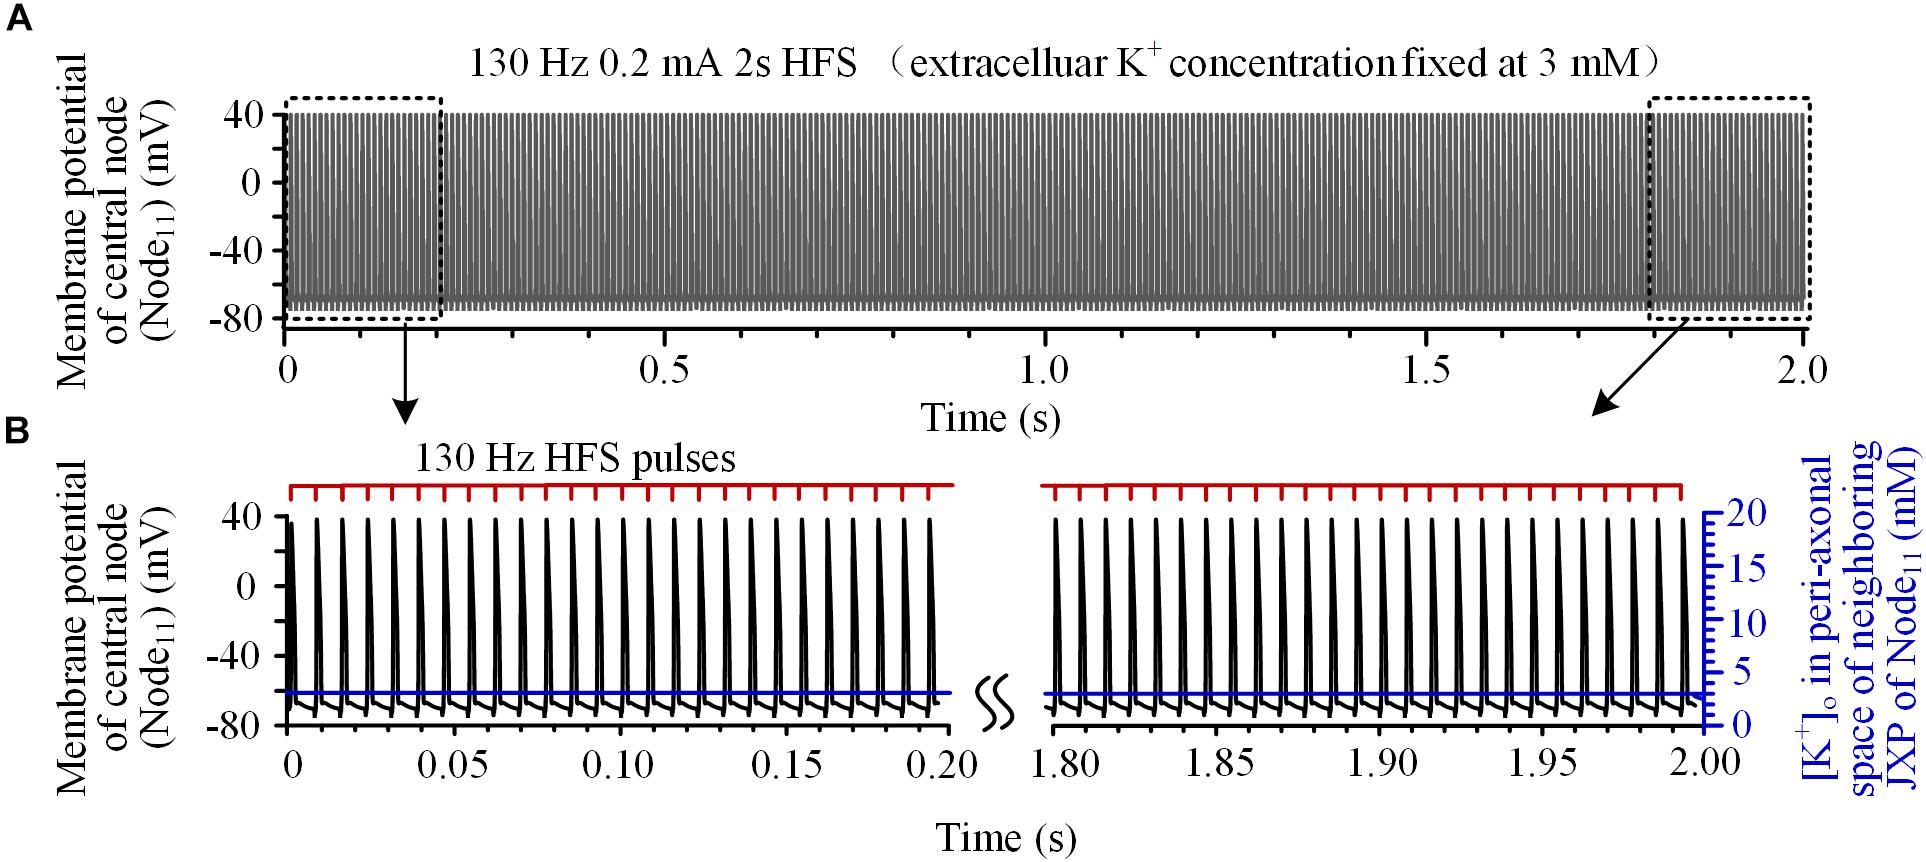
FIGURE 3. Axonal responses during high-frequency stimulation (HFS) when the extracellular K+ concentration was fixed at 3 mM: (A) Action potentials induced by 130 Hz pulses during 2-s HFS. (B) Membrane potential at Node11 (black curves) and [K+]o in the peri-axonal space of neighboring JXP (blue curves) during the first and last 0.2 s of the 2-s HFS shown in (A). Every stimulation pulse induces an action potential.
These results indicate that the fluctuation of [K+]o induced by HFS causes intermittent block and intermittent recovery in axons, which results in a firing rate of axonal action potentials far lower than the pulse frequency of HFS. For multiple axons, their action potentials might be induced by different pulses thereby resulting in misalignment in time and asynchronous firing of action potentials. We next test the hypothesis by simulating the responses of multiple axons to HFS.
To investigate the integrated activity induced on multiple axons located at various distances from a stimulation point, we analyzed the responses of an axon bundle composed of 11 axons to HFS. Due to the different distances of axons to the stimulation point, the degree of axonal block was different for individual axons (Figure 4A). Axons closer to the stimulation point had lower induction ratios of effective action potentials. During a HFS train of 130 Hz with 0.2 mA intensity, after ∼1.5 s stimulation, the steady-state values of induction ratio were ∼14% for the axon with the shortest distance of 20 μm and ∼50% for the axon with the longest distance of 120 μm (Figure 4B).
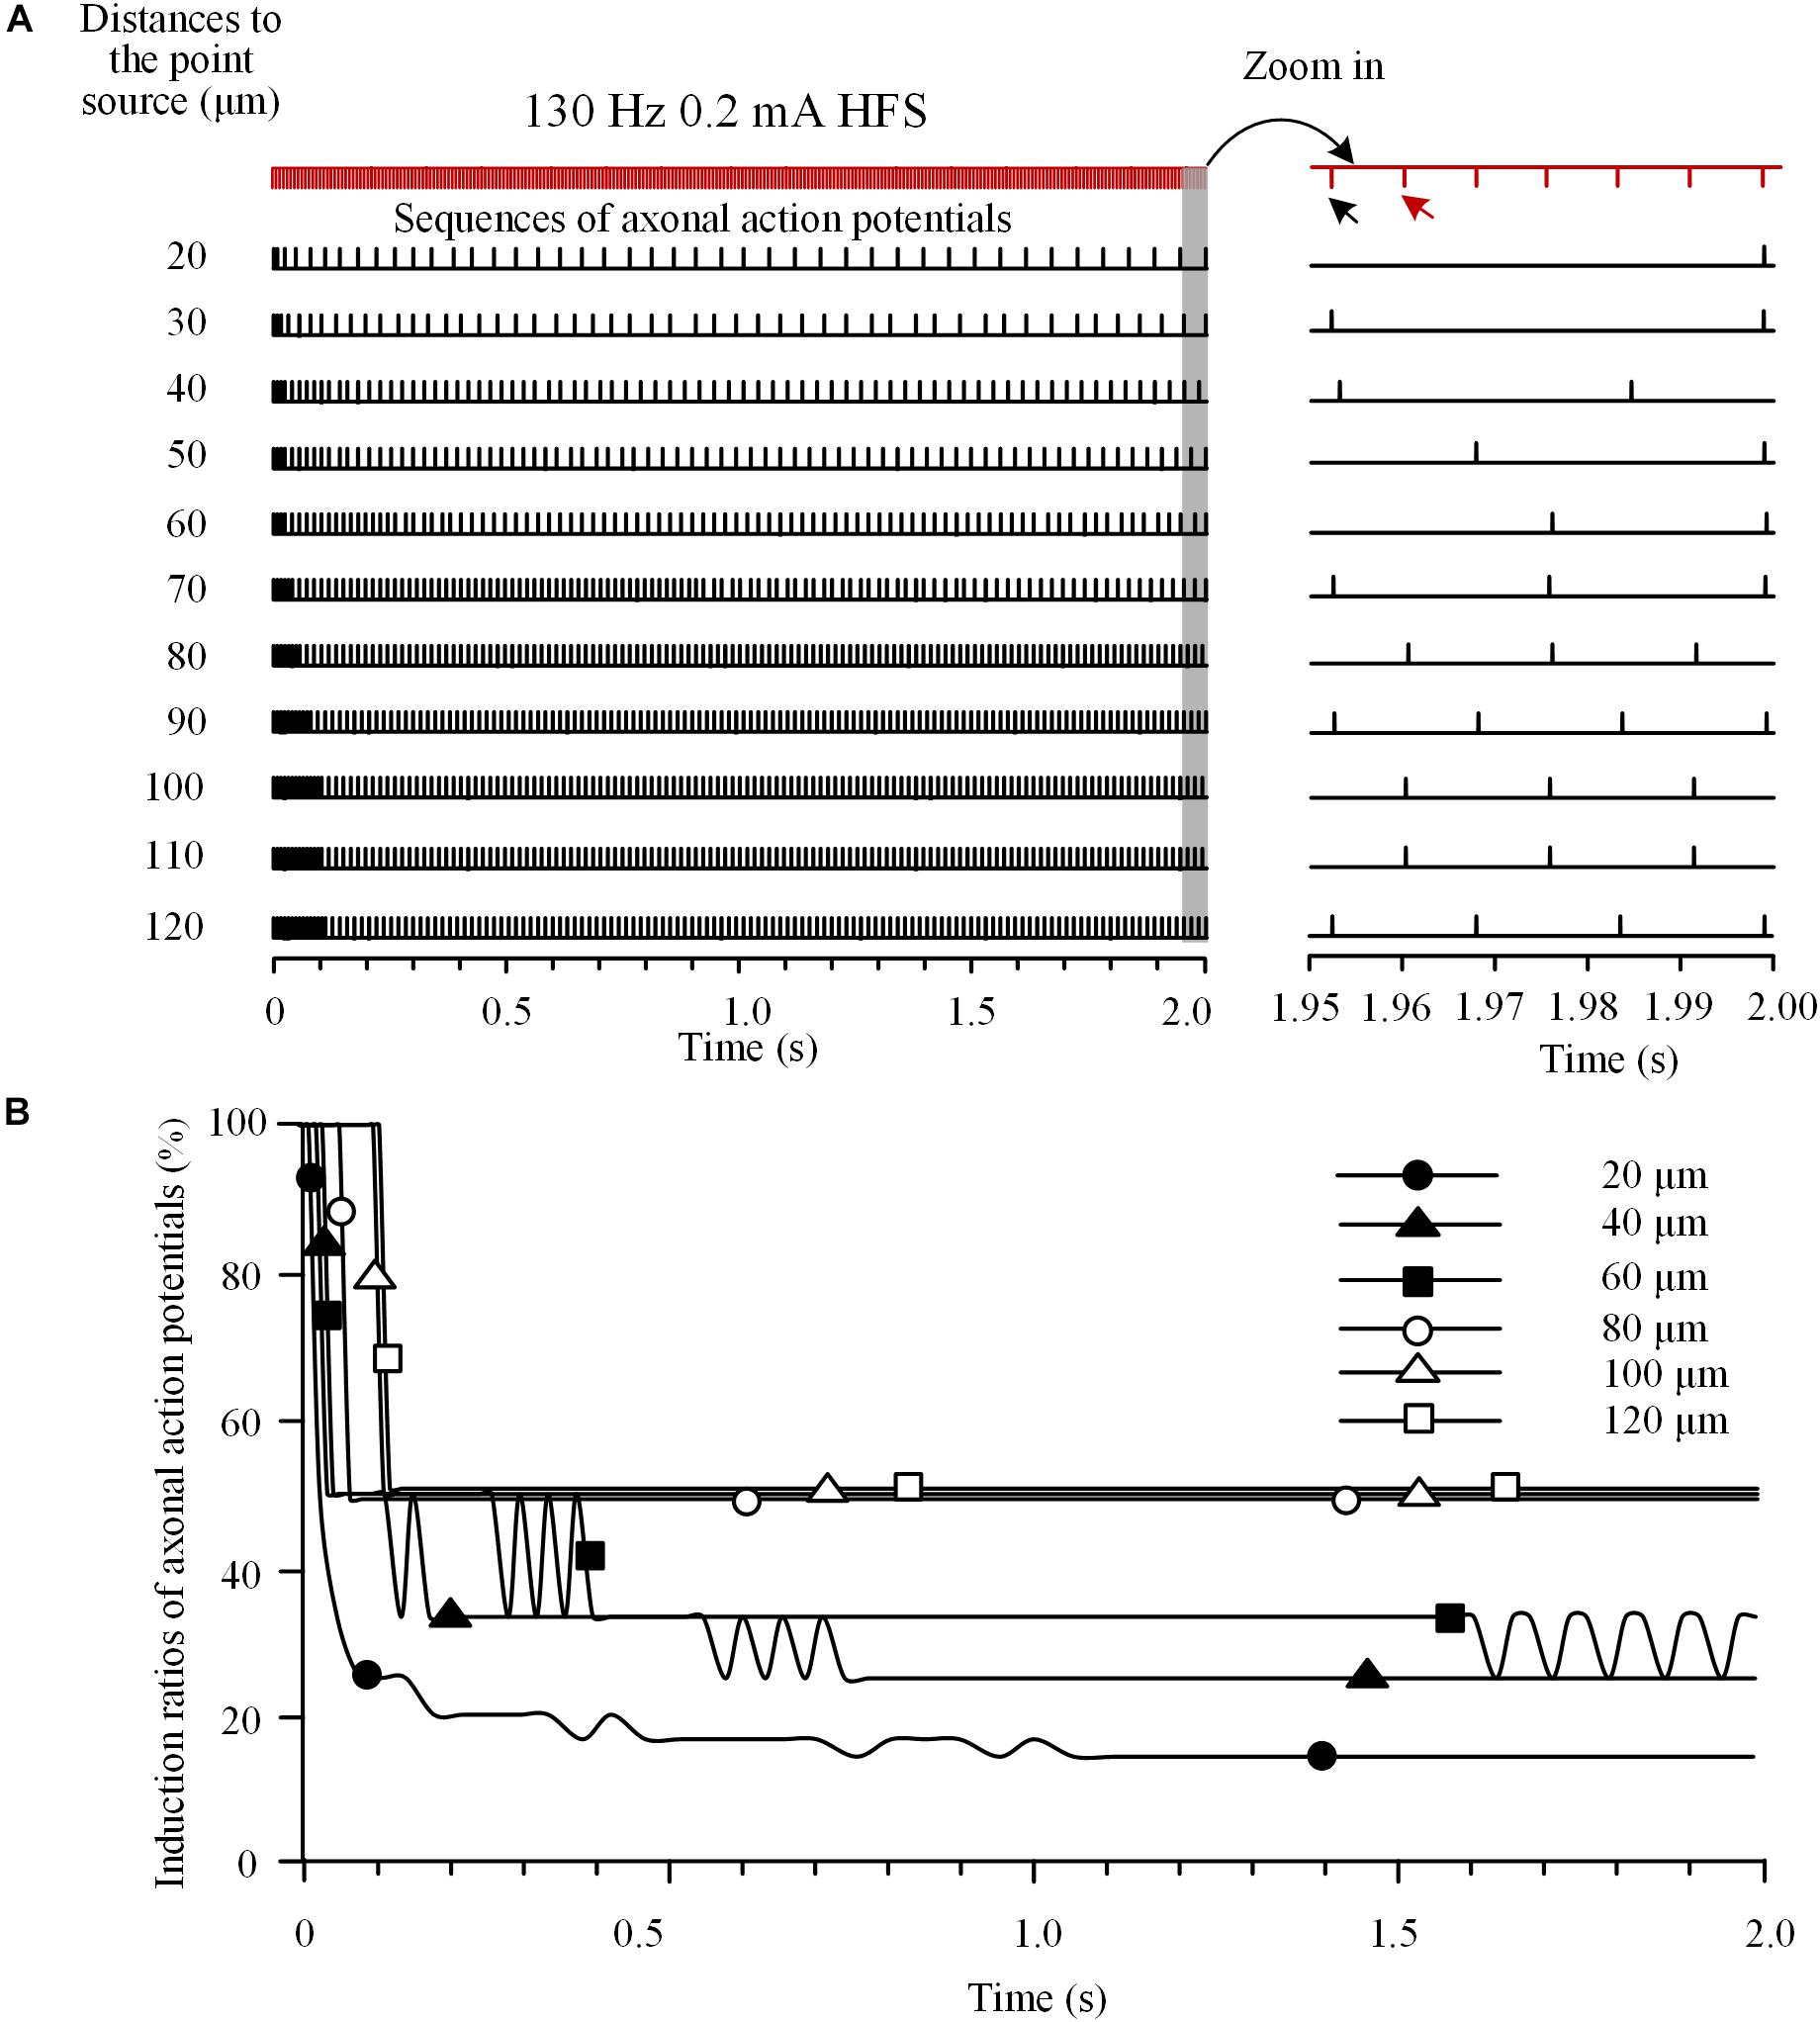
FIGURE 4. Responses of a bundle of axons to high-frequency stimulation (HFS). (A) Sequences of action potentials generated by 130 Hz HFS (0.2 mA) in 11 axons with different distances to the point source of stimulation. Axonal responses to the last seven pulses at the end of 2-s HFS are expanded at right. (B) Changes of induction ratios of action potentials for the six axons with distances of 20, 40, 60, 80, 100, and 120 μm to the stimulation source during HFS.
The differences of block degrees would cause differences in firing time of the multiple axons responding to stimulation pulses thereby resulting in asynchronous firing of action potentials during HFS. For example, during the last seven pulses of HFS period (Figure 4A right), the first of the seven pulses (indicated by the black arrow) induced action potentials only on axons at 30, 40, 70, 90, and 120 μm distances, while the next pulse (indicated by the red arrow) induced action potentials only on axons at 80, 100, and 110 μm. Therefore, the two pulses induced asynchronous action potentials in different axons.
The number of axons activated by each pulse decreased rapidly at the beginning of HFS (Figure 5). The initial pulses could induce action potentials simultaneously in all 11 axons, and thereby the synchronization ratio of action potentials was 100%. After that, the synchronization ratio decreased and was down to a steady value of ∼36% after 1.5 s stimulation.
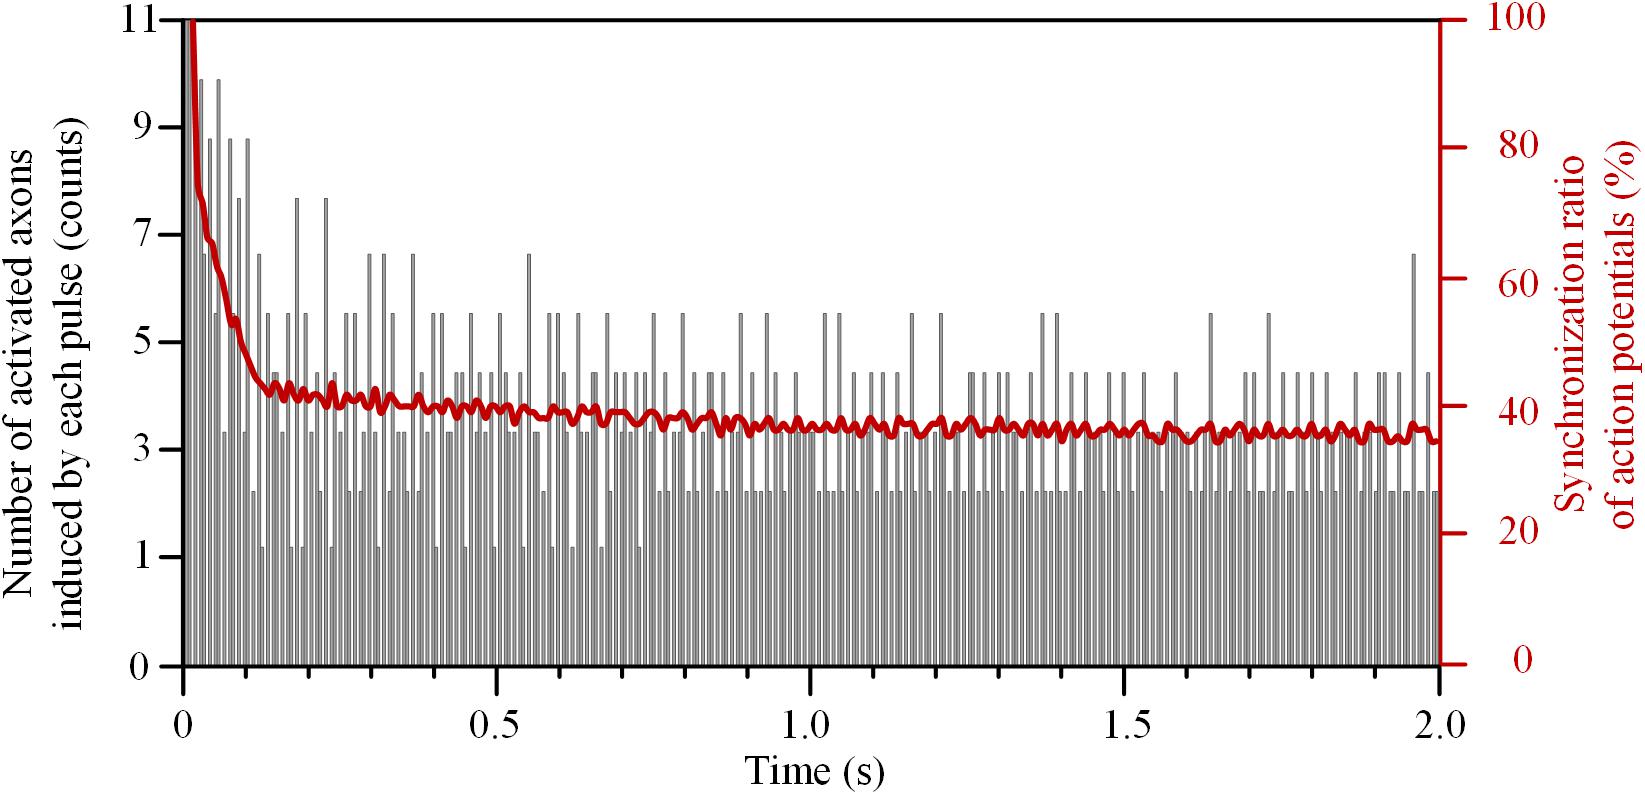
FIGURE 5. Synchronization ratio of action potentials generated in a bundle of 11 axons during high-frequency stimulation.
These results indicate that HFS could cause various degrees of depolarization block to the axons within a bundle, which decreased the synchronization of the overall firing of action potentials. However, the activation of axons was related to not only the distance from the stimulation point, but also the frequency and intensity of the stimulation. Therefore, we next examined the changes of synchronization ratios of multiple axons by stimulations of various frequencies and intensities.
With a fixed stimulation intensity of 0.3 mA, HFS at different frequencies of 50, 130, and 200 Hz decreased the synchronization ratio of the 11 axons with different speeds (Figure 6A). For a lower frequency of 50 Hz, the synchronization ratio decreased slowly to ∼90% at 0.2 s and stabilized at ∼88% after 1.5 s. For higher frequencies of 130 and 200 Hz, the synchronization ratios decreased more rapidly, to ∼38 and ∼23% at 0.2 s, and stabilized at ∼28 and ∼10% after 1.5 s, respectively. These results indicate that the higher the HFS frequency, the faster the actions of axons desynchronized and the lower synchronization ratios at steady state.
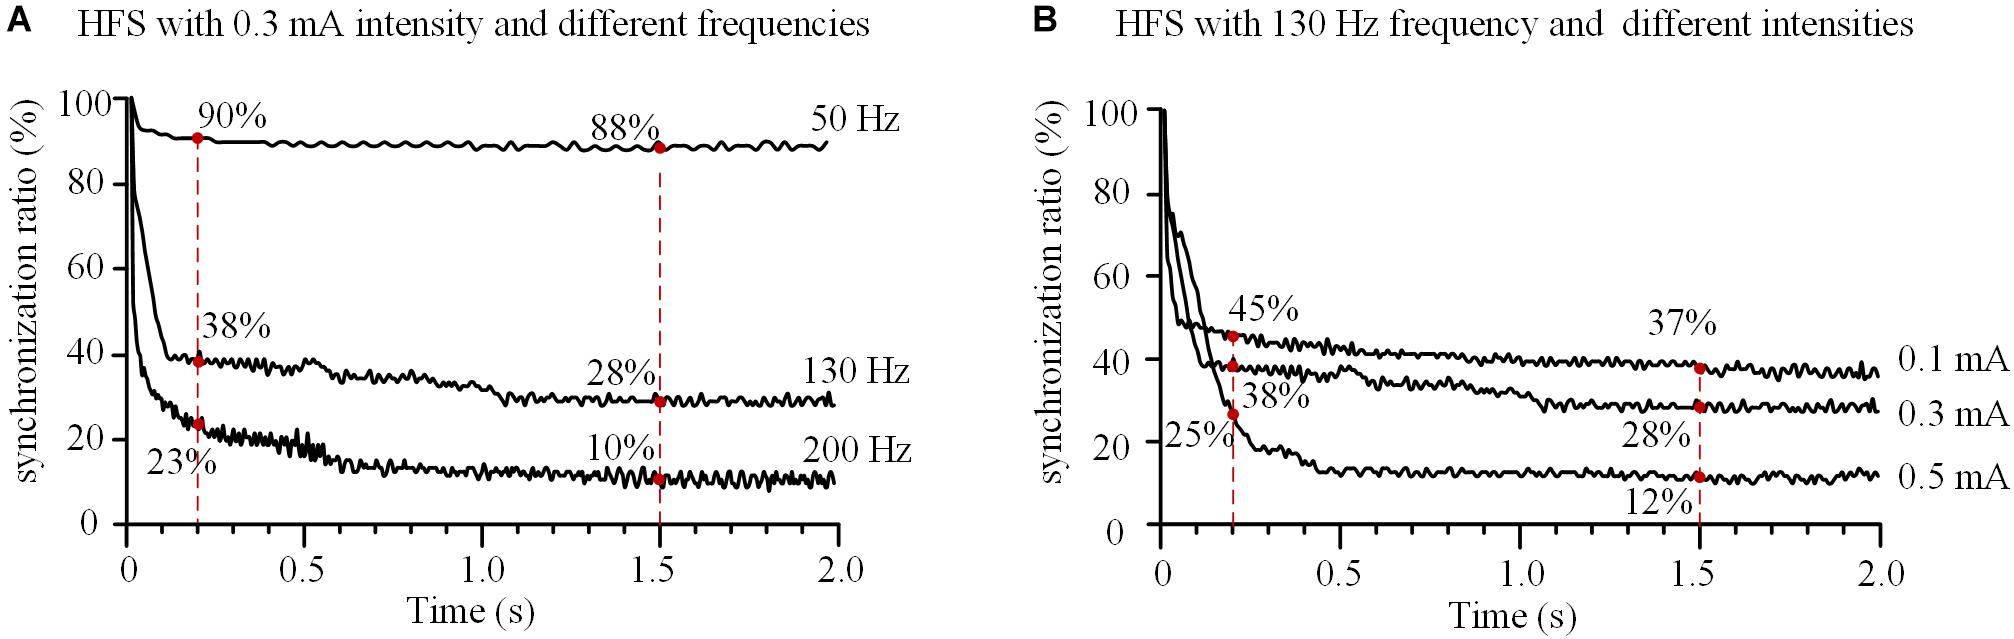
FIGURE 6. Effects of frequency and intensity of high-frequency stimulation (HFS) on the synchronization of action potential firing of an axonal bundle. (A) Changes of the synchronization ratios during HFS with different frequencies at a fixed intensity (0.3 mA). (B) Changes of the synchronization ratios during HFS with different intensities at a fixed frequency (130 Hz).
With a fixed stimulation frequency of 130 Hz, HFS at different stimulation intensities of 0.1, 0.3, and 0.5 mA decreased the synchronization ratio of the axons in the assumed bundle to different degrees (Figure 6B). At 0.2 s, the synchronization ratios decreased to ∼45, ∼38, and ∼25%, respectively; after 1.5 s, they stabilized at ∼37, ∼28, and ∼12%, respectively, for the three stimulation intensities. These results indicate that the greater the stimulation intensity, the more desynchronized the action potentials of axons and the deeper the degree of axonal block.
In the present study, we utilized a computational model to investigate the responses of thin myelinated axons in brain to high-frequency pulse stimulation (HFS). The major findings are (1) the accumulation of K+ in the peri-axon space during HFS can cause intermittent depolarization block in axons and result in a firing rate of action potentials in axons far lower than the stimulation frequency; (2) the HFS-induced intermittent block can generate asynchronous firing of action potentials in multiple axons within a bundle; (3) differences in frequency and intensity of HFS generate different degrees of the axonal block and of the asynchronous activity thereby resulting in different modulation effects of HFS. Possible mechanisms of these findings and their implications are discussed below.
In-vitro studies on central nerves have shown that repeated stimulation can elevate [K+]o thereby resulting in a decreased speed of axonal conduction until final block of the conduction. Artificially increasing [K+]o can also generate axonal block (Förstl et al., 1982; Poolos et al., 1987). The simulation results of our study are consistent with those previous studies. Nevertheless, we further reveal an intermittent feature of the axonal block.
The stimulation-induced depolarization and action potentials are generated mainly in the Ranvier nodes, not in the internode parts, because of the high impedance of myelinated membrane of internodes and the sole distribution region of Na+ channel in the nodes (Figure 1). In contrast, the K+ accumulation is generated in the internode parts (Figure 2C), not immediately outside the nodes, because of the small peri-axon space around axon membrane of internodes and the dense distribution of K+ channel in the JXP section (Debanne et al., 2011). Due to a fast diffusion of K+ outside the Ranvier nodes (imitating the K+ buffering effect of nearby glial cells), our simulation results show that the [K+]o at nodes stays at ∼3 mM (Figure 2C), and does not change obviously. Nevertheless, the accumulated [K+]o around JXP sections and the excitation of nearby nodes can still interact with each other by the spread of potential changes along axonal membrane.
With the interaction, the HFS-induced depolarization of nodes can increase [K+]o of JXP repeatedly following each stimulation pulse; whereas the increased [K+]o in turn can cause persistent depolarization of axonal membrane by decreasing the Nernst potential of K+. A substantial depolarization may lead to depolarization block via the inactivation of sodium channels on the node and prevent the node from continuously generating action potential following each pulse of HFS (Hille, 2001; Qian et al., 2014; Kameneva et al., 2016). K+ accumulation in JXP sections is counteracted by K+ clearance via mechanisms of NaK pump and K+ diffusion. An action potential can be re-induced by a stimulation pulse when [K+]o returns to an adequately low level (Figure 2C), which generates intermittent block and recovery of axonal activity.
Previous experimental studies have shown that HFS can induce partial block of axonal conduction, but not complete (Jensen and Durand, 2009; Zheng et al., 2011). Based on extracellular recording of population spikes from multiple axons under HFS, two possible mechanisms might underlie the partial block: (1) a part of the axons are completely blocked and the rest are not; (2) each axon produces intermittent block. Previous simulation study has suggested that the mechanism for axonal depolarization block is the former (Bellinger et al., 2008). If it was true that a part of the axons were completely blocked, the downstream projecting neurons would respond in two opposite scenario: either remain silent, or fire at a frequency close to the stimulation. However, the results of in vivo animal experiments suggest otherwise; the firing frequency of downstream neurons increase during HFS, but much lower than the stimulation frequency (Feng et al., 2017). Moreover, completely blocking of axon fibers requires stimulation frequencies up to thousands of Hertz (Kilgore and Bhadra, 2014; Couto and Grill, 2016), and the frequencies below 200 Hz used in clinical DBS are unlikely to produce complete axonal block. Therefore, the intermittent axonal block mechanism presented in this paper provides a more reasonable explanation for the experimental observations.
Our simulation results on an axon bundle indicate that intermittent block of individual axons can cause asynchronous firing of the entire axon bundle (Figures 4, 5). Axons at various distances from the stimulation point experience various degrees of depolarization block. Upon intermittent recovery from the block, these axons fire action potentials at different rates and different timings thereby generating asynchronous firing.
HFS-induced desynchronization has important implication to the mechanisms of DBS therapy, because synchronized firing is related to pathological conditions of many brain disorders. In movement disorders such as Parkinson’s disease, there is an increase in synchronization of neuronal activity in the basal ganglia and thalamus (Birdno and Grill, 2008; Gale et al., 2008). In epilepsy, populations of neurons fire excessively and synchronously at the onset of seizures (Lopes da Silva et al., 2003; Shiri et al., 2016). HFS could induce asynchronous firing of target neurons to replace the pathological synchronous activity in Parkinson’s disease (Cleary et al., 2013; Udupa and Chen, 2015), or suppress hyper-synchronous epileptiform activity (Good et al., 2009; Medeiros Dde and Moraes, 2014). Previous experimental study has proposed an intermittent block of axonal excitation as a possible mechanism for the generation of desynchronization by HFS (Feng et al., 2017). However, the underling mechanism of intermittent block has not been determined.
To our knowledge, this is the first simulation study addressing the intermittent block of axons and the desynchronization effect induced by HFS by incorporating the mechanism of submyelin K+ accumulation from the scale of axonal ultrastructure. Although the effect of extracellular K+ accumulation on axonal block was previously simulated in a modeling study (Bellinger et al., 2008), the simulation only presented a complete block of axon, not intermittent block. Therefore, it cannot explain the desynchronization mechanism of HFS.
Moreover, the present study shows that within the DBS frequency range (50–200 Hz), as the stimulation frequency increases, the desynchronization speed of axon bundle accelerates at the initial phase of stimulation and the steady-state level of synchronization ratio decreases (Figure 6A). This is consistent with the observations of frequency-dependent axonal block induced by HFS in animal experiments (Jensen and Durand, 2009; Feng et al., 2013, 2014). It is well reported that the efficacy of DBS is dependent on the frequency of stimulation, with effective frequency >90 Hz (Birdno and Grill, 2008; Zhong et al., 2011; McConnell et al., 2012). The results of our simulation study suggest that at a higher stimulation frequency, DBS could replace the pathological synchronization of target neuronal populations with more asynchronous activity thereby treating the diseases. This may underline the mechanism of the frequency-dependent efficacy of DBS.
One of the limitations of the present study is the use of monophasic (cathodic) stimulation pulses, not biphasic pulses. Clinic DBS commonly uses asymmetrical biphasic pulses, each consisting a cathodic phase, an inter-pulse delay, and a charge-balancing anodic phase (Butson and McIntyre, 2007). The cathodic phase exerts activation effects; whereas the anodic second phase aims to balance the charge for the safety of DBS. The anodic phase is designed to have longer pulse width yet smaller amplitude in order to minimize its hyperpolarization effect, therefore it would not arrest the activation generated by the cathodic first phase. To simplify the simulation, the anodic phase was not included in the simulated pulses because of its small effects on activation. Further studies with biphasic pulses are needed to mimick the stimulations more consistent with the clinic situation.
Another limitation of the study is that the extracellular potential generated by the point source of stimulation was calculated based on homogeneous conductivity (equation 3), whereas the true extracellular volume conductor is highly heterogeneous. The heterogeneity may alter the location of largest potential change along the axon, thereby moving the position of action potential initiation to other nodes, not exactly the central node (i.e., Node11 in our simulation). However, no matter which node is first activated, the subsequent propagation of action potential and the reaction inside the axon would be similar because the high impedance of myelin sheath would prevent the extracellular stimulation from acting on the structures under the myelin sheath (Figure 1). It was the reaction of underneath structures (e.g., potassium accumulation) that determined the generation of intermittent block. Therefore, similar conclusions would be obtained with heterogeneous extracellular volume conductor. Nevertheless, a more realistic model accounting for heterogeneity may improve the fidelity of the model predictions.
The present study shows that the accumulation of potassium ions in the peri-axon space during high HFS can induce intermittent block of axons, which causes asynchronous firing of action potential in an axon bundle. This desynchronized firing of axons could presumably generate asynchronous activity in the projected neurons downstream, thereby suppressing the pathological synchronization of target nuclei. The results provide important insights into the therapeutic mechanisms of DBS, which may lead to the development of novel DBS strategies and the extension of the DBS applications.
ZF and ZG designed the study. ZG, YW, and XW contributed to the model modification. ZG performed the simulation. ZF and ZG interpreted the results. ZG drafted the manuscript. ZF, XW, and YW revised the manuscript critically. All authors gave final approval of the submission.
This work was supported by the National Natural Science Foundation of China (No. 30970753).
The authors declare that the research was conducted in the absence of any commercial or financial relationships that could be construed as a potential conflict of interest.
Anderson, T. R. (2006). Selective attenuation of afferent synaptic transmission as a mechanism of thalamic deep brain stimulation-induced tremor arrest. J. Neurosci. 26, 841–850. doi: 10.1523/JNEUROSCI.3523-05.2006
Bellinger, S. C., Miyazawa, G., and Steinmetz, P. N. (2008). Submyelin potassium accumulation may functionally block subsets of local axons during deep brain stimulation: a modeling study. J. Neural Eng. 5, 263–274. doi: 10.1088/1741-2560/5/3/001
Bergey, G. K. (2013). Neurostimulation in the treatment of epilepsy. Exp. Neurol. 244, 87–95. doi: 10.1016/j.expneurol.2013.04.004
Bianchi, D., Marasco, A., Limongiello, A., Marchetti, C., Marie, H., Tirozzi, B., et al. (2012). On the mechanisms underlying the depolarization block in the spiking dynamics of CA1 pyramidal neurons. J. Comput. Neurosci. 33, 207–225. doi: 10.1007/s10827-012-0383-y
Birdno, M. J., and Grill, W. M. (2008). Mechanisms of deep brain stimulation in movement disorders as revealed by changes in stimulus frequency. Neurotherapeutics 5, 14–25. doi: 10.1016/j.nurt.2007.10.067
Blomstedt, P., Sjöberg, R. L., Hansson, M., Bodlund, O., and Hariz, M. I. (2013). Deep brain stimulation in the treatment of obsessive-compulsive disorder. World Neurosurg. 80, e245–e253. doi: 10.1016/j.wneu.2012.10.006
Boraud, T., Bezard, E., Bioulac, B., and Gross, C. (1996). High frequency stimulation of the internal Globus Pallidus (GPi) simultaneously improves parkinsonian symptoms and reduces the firing frequency of GPi neurons in the MPTP-treated monkey. Neurosci. Lett. 215, 17–20. doi: 10.1016/S0304-3940(96)12943-8
Butson, C. R., and McIntyre, C. C. (2007). Differences among implanted pulse generator waveforms cause variations in the neural response to deep brain stimulation. Clin. Neurophysiol. 118, 1889–1894. doi: 10.1016/j.clinph.2007.05.061
Caldwell, J. H., Schaller, K. L., Lasher, R. S., Peles, E., and Levinson, S. R. (2000). Sodium channel Nav1.6 is localized at nodes of Ranvier, dendrites, and synapses. Proc. Natl. Acad. Sci. U.S.A. 97, 5616–5620. doi: 10.1073/pnas.090034797
Chiken, S., and Nambu, A. (2013). High-frequency pallidal stimulation disrupts information flow through the pallidum by GABAergic inhibition. J. Neurosci. 33, 2268–2280. doi: 10.1523/JNEUROSCI.4144-11.2013
Chomiak, T., and Hu, B. (2007). Axonal and somatic filtering of antidromically evoked cortical excitation by simulated deep brain stimulation in rat brain. J. Physiol. 579, 403–412. doi: 10.1113/jphysiol.2006.124057
Cleary, D. R., Raslan, A. M., Rubin, J. E., Bahgat, D., Viswanathan, A., Heinricher, M. M., et al. (2013). Deep brain stimulation entrains local neuronal firing in human globus pallidus internus. J. Neurophysiol. 109, 978–987. doi: 10.1152/jn.00420.2012
Couto, J., and Grill, W. M. (2016). Kilohertz frequency deep brain stimulation is ineffective at regularizing the firing of model thalamic neurons. Front. Comput. Neurosci. 10:22. doi: 10.3389/fncom.2016.00022
Cury, R. G., Fraix, V., Castrioto, A., Pérez Fernández, M. A., Krack, P., Chabardes, S., et al. (2017). Thalamic deep brain stimulation for tremor in Parkinson disease, essential tremor, and dystonia. Neurology 89, 1416–1423. doi: 10.1212/WNL.0000000000004295
Debanne, D., Campanac, E., Bialowas, A., Carlier, E., and Alcaraz, G. (2011). Axon physiology. Physiol. Rev. 91, 555–602. doi: 10.1152/physrev.00048.2009
Deniau, J.-M., Degos, B., Bosch, C., and Maurice, N. (2010). Deep brain stimulation mechanisms: beyond the concept of local functional inhibition. Eur. J. Neurosci. 32, 1080–1091. doi: 10.1111/j.1460-9568.2010.07413.x
Devaux, J. J. (2004). KCNQ2 is a nodal K+ channel. J. Neurosci. 24, 1236–1244. doi: 10.1523/JNEUROSCI.4512-03.2004
Duflocq, A., Le Bras, B., Bullier, E., Couraud, F., and Davenne, M. (2008). Nav1.1 is predominantly expressed in nodes of Ranvier and axon initial segments. Mol. Cell. Neurosci. 39, 180–192. doi: 10.1016/j.mcn.2008.06.008
Eusebio, A., Thevathasan, W., Doyle Gaynor, L., Pogosyan, A., Bye, E., Foltynie, T., et al. (2011). Deep brain stimulation can suppress pathological synchronisation in parkinsonian patients. J. Neurol. Neurosurg. Psychiatry 82, 569–573. doi: 10.1136/jnnp.2010.217489
Feng, Z., Wang, Z., Guo, Z., Zhou, W., Cai, Z., and Durand, D. M. (2017). High frequency stimulation of afferent fibers generates asynchronous firing in the downstream neurons in hippocampus through partial block of axonal conduction. Brain Res. 1661, 67–78. doi: 10.1016/j.brainres.2017.02.008
Feng, Z., Yu, Y., Guo, Z., Cao, J., and Durand, D. M. (2014). High frequency stimulation extends the refractory period and generates axonal block in the rat hippocampus. Brain Stimul. 7, 680–689. doi: 10.1016/j.brs.2014.03.011
Feng, Z., Zheng, X., Yu, Y., and Durand, D. M. (2013). Functional disconnection of axonal fibers generated by high frequency stimulation in the hippocampal CA1 region in-vivo. Brain Res. 1509, 32–42. doi: 10.1016/j.brainres.2013.02.048
Förstl, J., Galvan, M., and ten Bruggencate, G. (1982). Extracellular K+ concentration during electrical stimulation of rat isolated sympathetic ganglia, vagus and optic nerves. Neuroscience 7, 3221–3229. doi: 10.1016/0306-4522(82)90244-5
Frijns, J. H. M., Mooij, J., and ten Kate, J. H. (1994). A quantitative approach to modeling mammalia myelinated nerve fibers for electrical prostheis design. IEEE Trans. Biomed. Eng. 41, 556–566. doi: 10.1109/10.293243
Gale, J. T., Amirnovin, R., Williams, Z. M., Flaherty, A. W., and Eskandar, E. N. (2008). From symphony to cacophony: pathophysiology of the human basal ganglia in Parkinson disease. Neurosci. Biobehav. Rev. 32, 378–387. doi: 10.1016/j.neubiorev.2006.11.005
Good, L. B., Sabesan, S., Marsh, S. T., Tsakalis, K., Treiman, D., and Iasemidis, L. (2009). Control of synchronization of brain dynamics leads to control of epileptic seizures in rodents. Int. J. Neural Syst. 19, 173–196. doi: 10.1142/S0129065709001951
Hammond, C., Bergman, H., and Brown, P. (2007). Pathological synchronization in Parkinson’s disease: networks, models and treatments. Trends Neurosci. 30, 357–364. doi: 10.1016/j.tins.2007.05.004
Jensen, A. L., and Durand, D. M. (2009). High frequency stimulation can block axonal conduction. Exp. Neurol. 220, 57–70. doi: 10.1016/j.expneurol.2009.07.023
Jiruska, P., de Curtis, M., Jefferys, J. G. R., Schevon, C. A., Schiff, S. J., and Schindler, K. (2013). Synchronization and desynchronization in epilepsy: controversies and hypotheses. J. Physiol. 591, 787–797. doi: 10.1113/jphysiol.2012.239590
Johnson, M. D., and McIntyre, C. C. (2008). Quantifying the neural elements activated and inhibited by globus pallidus deep brain stimulation. J. Neurophysiol. 100, 2549–2563. doi: 10.1152/jn.90372.2008
Kameneva, T., Maturana, M. I., Hadjinicolaou, A. E., Cloherty, S. L., Ibbotson, M. R., Grayden, D. B., et al. (2016). Retinal ganglion cells: mechanisms underlying depolarization block and differential responses to high frequency electrical stimulation of ON and OFF cells. J. Neural Eng. 13:16017. doi: 10.1088/1741-2560/13/1/016017
Kilgore, K. L., and Bhadra, N. (2014). Reversible nerve conduction block using kilohertz frequency alternating current. Neuromodulation Technol. Neural Interface 17, 242–255. doi: 10.1111/ner.12100
Lopes da Silva, F., Blanes, W., Kalitzin, S. N., Parra, J., Suffczynski, P., and Velis, D. N. (2003). Epilepsies as dynamical diseases of brain systems: basic models of the transition between normal and epileptic activity. Epilepsia 44(Suppl. 1), 72–83. doi: 10.1111/j.0013-9580.2003.12005.x
McConnell, G. C., So, R. Q., Hilliard, J. D., Lopomo, P., and Grill, W. M. (2012). Effective deep brain stimulation suppresses low-frequency network oscillations in the basal ganglia by regularizing neural firing patterns. J. Neurosci. 32, 15657–15668. doi: 10.1523/JNEUROSCI.2824-12.2012
McIntyre, C. C., and Grill, W. M. (1999). Excitation of central nervous system neurons by nonuniform electric fields. Biophys. J. 76, 878–888. doi: 10.1016/S0006-3495(99)77251-6
McIntyre, C. C., and Grill, W. M. (2002). Extracellular stimulation of central neurons: influence of stimulus waveform and frequency on neuronal output. J. Neurophysiol. 88, 1592–1604. doi: 10.1152/jn.2002.88.4.1592
McIntyre, C. C., Grill, W. M., Sherman, D. L., and Thakor, N. V. (2004). Cellular effects of deep brain stimulation: model-based analysis of activation and inhibition. J. Neurophysiol. 91, 1457–1469. doi: 10.1152/jn.00989.2003
Medeiros Dde, C., and Moraes, M. F. D. (2014). Focus on desynchronization rather than excitability: a new strategy for intraencephalic electrical stimulation. Epilepsy Behav. 38, 32–36. doi: 10.1016/j.yebeh.2013.12.034
Mehanna, R., and Lai, E. C. (2013). Deep brain stimulation in Parkinson’s disease. Transl. Neurodegener. 2, 1–10. doi: 10.1186/2047-9158-2-22
Migliore, M., Hoffman, D. A., Magee, J. C., and Johnston, D. (1999). Role of an A-type K+ conductance in the back-propagation of action potentials in the dendrites of hippocampal pyramidal neurons. J. Comput. Neurosci. 7, 5–15. doi: 10.1023/A:1008906225285
Narang, P., Retzlaff, A., Brar, K., and Lippmann, S. (2016). Deep brain stimulation for treatment-refractory depression. South. Med. J. 109, 700–703. doi: 10.14423/SMJ.0000000000000554
Nelson, A. D., and Jenkins, P. M. (2017). Axonal membranes and their domains: assembly and function of the axon initial segment and node of Ranvier. Front. Cell. Neurosci. 11:136. doi: 10.3389/fncel.2017.00136
Nowak, L. G., and Bullier, J. (1998). Axons, but not cell bodies, are activated by electrical stimulation in cortical gray matter. Exp. Brain Res. 118, 489–500. doi: 10.1007/s002210050305
Poolos, N. P., Mauk, M. D., and Kocsis, J. D. (1987). Activity-evoked increases in extracellular potassium modulate presynaptic excitability in the CA1 region of the hippocampus. J. Neurophysiol. 58, 404–416. doi: 10.1152/jn.1987.58.2.404
Qian, K., Yu, N., Tucker, K. R., Levitan, E. S., and Canavier, C. C. (2014). Mathematical analysis of depolarization block mediated by slow inactivation of fast sodium channels in midbrain dopamine neurons. J. Neurophysiol. 112, 2779–2790. doi: 10.1152/jn.00578.2014
Ranck, J. B. (1975). Which elements are excited in electrical stimulation of mammalian central nervous system: a review. Brain Res. 98, 417–440. doi: 10.1016/0006-8993(75)90364-9
Rasband, M. N., and Peles, E. (2016). The nodes of Ranvier: molecular assembly and maintenance. Cold Spring Harb. Perspect. Biol. 8, 1–15. doi: 10.1101/cshperspect.a020495
Rasband, M. N., and Trimmer, J. S. (2001). Subunit composition and novel localization of K+ channels in spinal cord. J. Comp. Neurol. 429, 166–176. doi: 10.1002/1096-9861(20000101)429:1<166::AID-CNE13>3.0.CO;2-Y
Reese, R., Leblois, A., Steigerwald, F., Pötter-Nerger, M., Herzog, J., Mehdorn, H. M., et al. (2011). Subthalamic deep brain stimulation increases pallidal firing rate and regularity. Exp. Neurol. 229, 517–521. doi: 10.1016/j.expneurol.2011.01.020
Scholz, A., Reid, G., Vogel, W., and Bostock, H. (1993). Ion channels in human axons. J. Neurophysiol. 70, 1274–1279. doi: 10.1152/jn.1993.70.3.1274
Schröder, J. M. (1972). Altered ratio between axon diameter and myelin sheath thickness in regenerated nerve fibers. Brain Res. 45, 49–65. doi: 10.1016/0006-8993(72)90215-6
Schwarz, J. R., Glassmeier, G., Cooper, E. C., Kao, T. C., Nodera, H., Tabuena, D., et al. (2006). KCNQ channels mediate IKs, a slow K+ current regulating excitability in the rat node of Ranvier. J. Physiol. 573, 17–34. doi: 10.1113/jphysiol.2006.106815
Schwarz, J. R., Reid, G., and Bostock, H. (1995). Action potentials and membrane currents in the human node of Ranvier. Pflugers Arch. Eur. J. Physiol. 430, 283–292. doi: 10.1007/BF00374660
Shiri, Z., Manseau, F., Lévesque, M., Williams, S., and Avoli, M. (2016). Activation of specific neuronal networks leads to different seizure onset types. Ann. Neurol. 79, 354–365. doi: 10.1002/ana.24570
Staff, N. P., Jung, H. Y., Thiagarajan, T., Yao, M., and Spruston, N. (2000). Resting and active properties of pyramidal neurons in subiculum and CA1 of rat hippocampus. J. Neurophysiol. 84, 2398–2408. doi: 10.1016/0959-4388(93)90214-j
Udupa, K., and Chen, R. (2015). The mechanisms of action of deep brain stimulation and ideas for the future development. Prog. Neurobiol. 133, 27–49. doi: 10.1016/j.pneurobio.2015.08.001
Wang, H., Kunkel, D. D., Martin, T. M., Schwartzkroin, P. A., and Tempel, B. L. (1993). Heteromultimeric K+ channels in terminal and juxtaparanodal regions of neurons. Nature 365, 75–79. doi: 10.1038/365075a0
Wang, S. S.-H., Shultz, J. R., Burish, M. J., Harrison, K. H., Hof, P. R., Towns, L. C., et al. (2008). Functional trade-offs in white matter axonal scaling. J. Neurosci. 28, 4047–4056. doi: 10.1523/JNEUROSCI.5559-05.2008
Waxman, S. G., and Ritchie, J. M. (1993). Molecular dissection of the myelinated axon. Ann. Neurol. 33, 121–136. doi: 10.1002/ana.410330202
Zheng, F., Lammert, K., Nixdorf-Bergweiler, B. E., Steigerwald, F., Volkmann, J., and Alzheimer, C. (2011). Axonal failure during high frequency stimulation of rat subthalamic nucleus. J. Physiol. 589, 2781–2793. doi: 10.1113/jphysiol.2011.205807
Keywords: high-frequency stimulation, potassium accumulation, axonal block, desynchronization, model of myelinated axon
Citation: Guo Z, Feng Z, Wang Y and Wei X (2018) Simulation Study of Intermittent Axonal Block and Desynchronization Effect Induced by High-Frequency Stimulation of Electrical Pulses. Front. Neurosci. 12:858. doi: 10.3389/fnins.2018.00858
Received: 04 May 2018; Accepted: 02 November 2018;
Published: 22 November 2018.
Edited by:
Mikhail Lebedev, Duke University, United StatesReviewed by:
Constance Hammond, Institut National de la Santé et de la Recherche Médicale (INSERM), FranceCopyright © 2018 Guo, Feng, Wang and Wei. This is an open-access article distributed under the terms of the Creative Commons Attribution License (CC BY). The use, distribution or reproduction in other forums is permitted, provided the original author(s) and the copyright owner(s) are credited and that the original publication in this journal is cited, in accordance with accepted academic practice. No use, distribution or reproduction is permitted which does not comply with these terms.
*Correspondence: Zhouyan Feng, ZmVuZ3pob3V5YW5AMTM5LmNvbQ==
Disclaimer: All claims expressed in this article are solely those of the authors and do not necessarily represent those of their affiliated organizations, or those of the publisher, the editors and the reviewers. Any product that may be evaluated in this article or claim that may be made by its manufacturer is not guaranteed or endorsed by the publisher.
Research integrity at Frontiers
Learn more about the work of our research integrity team to safeguard the quality of each article we publish.