- 1 Department of Physiology and Pharmacology, Wake Forest University, Winston Salem, NC, USA
- 2 Department of Neurobiology, Duke University, Durham, NC, USA
- 3 Department of Anatomy and Neurobiology, The University of Tennessee Health Science Center, Memphis, TN, USA
Although reward probability is an important factor that shapes animal’s behavior, it is not well understood how the brain translates reward expectation into the vigor of movement [reaction time (RT) and speed]. To address this question, we trained two monkeys in a RT task that required wrist movements in response to vibrotactile and visual stimuli, with a variable reward schedule. Correct performance was rewarded in 75% of the trials. Monkeys were certain that they would be rewarded only in the trials immediately following withheld rewards. In these trials, the animals responded sooner and moved faster. Single-unit recordings from the dorsal striatum revealed modulations in neural firing that reflected changes in movement vigor. First, in the trials with certain rewards, striatal neurons modulated their firing rates earlier. Second, magnitudes of changes in neuronal firing rates depended on whether or not monkeys were certain about the reward. Third, these modulations depended on the sensory modality of the cue (visual vs. vibratory) and/or movement direction (flexions vs. extensions). We conclude that dorsal striatum may be a part of the mechanism responsible for the modulation of movement vigor in response to changes of reward predictability.
Introduction
The primate fronto-striatal system, which plays an important role in temporal coordination of goal-directed behavior, consists of a network of neuronal circuits that integrate spatial and timing information for behavioral purpose (Alexander and Crutcher, 1990; Hoshi and Tanji, 2000; Staddon 2001; Miller and Phelps, 2010). Previous studies have demonstrated that pre-movement firing in fronto-parietal cortex and basal ganglia mediates preparation and initiation of both sensory guided and self-initiated movements (Horak and Anderson, 1984; Gardiner and Nelson, 1992; Romo et al., 1992; Turner and Anderson, 1997; Lee and Assad, 2003; Churchland et al., 2006a; Tsujimoto et al., 2010). In particular, it has been suggested that basal ganglia modulate motor performance (“dynamics” or “movement vigor”) under the effect of motivational factors quantified as context-specific cost/reward functions (for review see Hayden et al., 2008; Turner and Desmurget, 2010). Motor planning involves programming of the direction of movement, the kinematics, and the goal of movement (Kalaska and Crammond, 1995; McCoy and Platt, 2005; Platt and Huettel, 2008; for review Opris and Bruce, 2005). Motor areas of the brain also specify movement vigor which is overtly represented by the reaction time (RT) and the speed with which a movement is performed. The choice of these behavioral parameters is mediated by the activation of midbrain’s dopaminergic projections to fronto-parietal cortex and dorsal striatum that track successful and erroneous behaviors and the contingencies between the behaviors and rewards (Romo and Schultz, 1990; Gaspar et al., 1992; Kiyatkin and Rebec, 1996; Fiorillo et al., 2003).
Although reward probability is an important factor in shaping animal’s behavior (Herrnstein, 1961; Sugrue et al., 2004), it is not well understood how the cortico-striatal circuits translate reward probability into the vigor of movement. We hypothesized that the dorsal striatum (Putamen and Caudate Nucleus) of primates is part of the system that modulates the movement vigor (i.e., RT and speed), depending on the probability of the expected reward. This hypothesis is supported by the finding that changes in dorsal striatal activity occur shortly after go-cues and clearly earlier than the movements (100–200 ms before movements). Therefore, it is possible that changes in reward expectation are processed by the neostriatum (NS), which biases both motor planning and preparation (Mirenowicz and Schultz, 1994; Shidara et al., 1998; Lauwereyns et al., 2002; Simmons and Richmond, 2008). Dorsal striatum may be responsible for enhancing movement vigor when rewards are certain and decreasing the vigor when rewards become uncertain (Seideman et al., 1998; Ditterich, 2006; Wittmann et al., 2008; Van der Meer and Redish, 2009; Machens et al., 2010).
To elucidate NS modulations that putatively mediate the translation of reward probability into the changes of movement vigor, we trained two rhesus monkeys in a RT task in which they produced wrist flexions or extensions in response to vibratory and visually cues (Lebedev and Nelson, 1999). Trial outcome was made uncertain by rewarding the monkeys for correct performance only in 75% of the trials. Monkeys were uncertain about an upcoming reward in all trials except for the trials that immediately followed withheld rewards. In these trials the monkeys were certain about the outcome because they were always rewarded. Given these trial to trial changes in reward probability, we determined if the activity of dorsal striatal neurons that was associated with motor preparation, varied as a function of reward expectation and whether it was correlated with changes in movement timing and wrist kinematics.
Materials and Methods
Experimental Apparatus and Behavioral Paradigm
Two adult male rhesus monkeys (Macaca mulatta: E, N) were trained to make wrist flexion and extension movements in response to vibratory or visual go-cues (Lebedev and Nelson, 1995, 1999; Liu et al., 2008). The monkeys were cared for in accordance with the National Research Council Guide for the Care and Use of Laboratory Animals. Experimental protocols were approved by the Animal Care and Use Committee of The University of Tennessee Health Science Center, Memphis. Detailed descriptions of the experimental apparatus have been provided elsewhere (Lebedev and Nelson, 1995, 1999; Liu et al., 2005). A brief description is provided below.
Experimental apparatus
Each monkey sat in an acrylic monkey chair, with its right palm on a movable plate. One end of the plate was attached to the axle of a brushless D.C. torque motor (Colburn and Evarts, 1978). A load of 0.07 Nm was applied to the plate. The load assisted wrist extensions and opposed wrist flexions. Feedback of current wrist position was provided by a visual display consisting of 31 light-emitting diodes (LEDs), located 35 cm in front of the animal. The middle, red LED corresponded to a centered wrist position. Yellow LEDs above and below the middle LED indicate successive angular deviations of 1°. Two instructional LED were located in the upper left corner of the visual display. When the first, red LED was illuminated at the start of a trial, it indicated that extension movements should be made; otherwise flexions were required. When the second, green LED was illuminated, it informed the monkey that the go-cue for that trial would be palmar vibration; otherwise, the go-cue was the illumination of one of two LEDs which were each 5° from the center. Neuronal activity was triggered by vibratory cues at 57 Hz or by visual go-cues.
Behavioral task
The behavioral paradigm is illustrated schematically in Figure 1A. Monkeys made vibratory and visually cued wrist flexion and extension movements after holding a steady position during an instructed delay period lasting 0.5–2.0 s. Wrist movements were guided by either vibratory cues (VIB-trials) or visual cues (VIS-trials). For vibratory stimulus (VIB) trials, movements were triggered by vibration to the monkey’s palm. For the visual stimulus (VIS) trials, movements were initiated by the appearance of a visual target that indicated the movement endpoint. Trials began when the monkey centered the plate. Each task trial had three basic phases: the instructed delay phase, reaction phase (partition of RT is shown in Figure 1B) and movement phase. Correct performance in the task was rewarded pseudo-randomly in only 75% of the trials, with the unrewarded trials never being imposed sequentially.
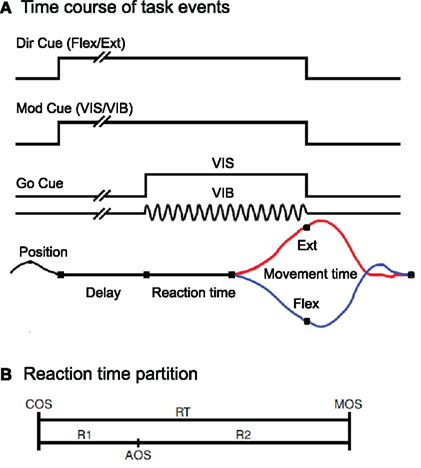
Figure 1. (A) Schematic description of the behavioral paradigm. The direction cue was given by a red LED that was illuminated during extension trials, but not during flexion trials. The modality cue was a green LED that was illuminated during vibratory cued trials but not during visually cued trials. The onset of instructional cues was coincident with the onset of the hold period. They remained lit until the end of the trial, coincident with reward delivery. Go-cues that signaled the monkeys could initiate wrist movements were presented after a variable time delay of 0.5, 1.0, 1.5, or 2.0 s (pseudo-randomized). (B) Divisions of the reaction time (RT) interval. RT has been split into two intervals: R1, the latency from cue onset (COS) to pre-movement activity onset (AOS), and R2, the time from AOS until movement onset (MOS).
Our pseudo-random reward schedule used the following types of trials: (i) unrewarded trials, (ii) trials immediately following the unrewarded ones called after trials (“A” trials), and (iii) rewarded trials, for which the current and the preceding trial were rewarded, called regular (R) trials). We grouped individual trials by the number of previously rewarded trials that preceded each trial in the group, as well as, by the direction of the movement made in that trial. In some instances there were trials in which the animal failed to perform properly (i.e., made a movement in the wrong direction). These error trials are conceptually different from the A trials since rewards were withheld because of incorrect performance rather than arbitrarily. These were marked separately in the data stream, not being under consideration here. For analyses of sequential effects, we required that each group from the records of a neuron have at least four valid trials. If any single group of records had fewer than four trials, the data from that group were not included in the analyses.
Reward probability
The probability of reward was not indicated to the animal except via prior experience. The key manipulation in the task was to distinguish between “certain” rewards that occurred only in trials following withheld rewards (25% of trials), and the “uncertain” rewards occurring in the subsequent 50% of the trials. In Figure 2A we show two blocks of trials with unrewarded (U) and rewarded (“A” being the first rewarded trial and R the subsequent rewards) trials. The unrewarded U trial acts as a cue indicating a certain reward, coded as “A” trial. In order to properly address the temporal aspect of movement planning under certain vs. uncertain reward, trials were re-coded to reflect the number of previously rewarded trials that occurred, in sequence, prior to the trial in question. Trials belonging to these groups had been preceded by none, one, two, or three previously rewarded trials in sequence (“A,” S-1, S-2, or S-3). The next trial groups in the sequence usually contain less than four trials, that are not enough to be considered for statistical analyses Thus, as it is shown in Figure 2B (depicting the probability of reward in each group), reward was certain in group “A,” and uncertain in the groups S-1 to S-3 (with reward uncertainty increasing as trials advanced from group S-1 to S-3).
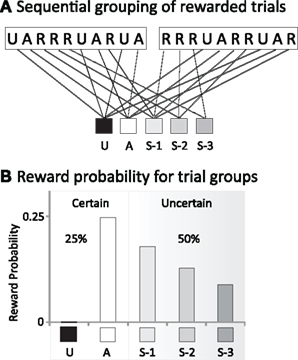
Figure 2. (A) Sequential grouping of rewarded trials. Each block of 10 trials contained rewarded (R) and unrewarded (U) trials and rewarded trials (with A being the first rewarded trial following the no-reward trial). Trials are grouped based the number of previously rewarded. Trials belonging to these groups had been preceded by none, one, two, or three previously rewarded trials in sequence (A, S-1, S-2, or S-3). (B) Reward probability for trial groups. Trials are split in certain rewarded trials (A group) and uncertain rewarded trials (S-1, S-2, and S-3). The gray shadow suggests the progression from certain (white) to uncertain (gray) rewards.
Electrophysiological Recordings and Histology
Once an animal reached a stable daily performance level (∼2000 rewarded trials per experimental session), it was prepared for recording. A stainless steel recording chamber was surgically implanted over the skull to allow for extracellular recordings of the activity of basal ganglia neurons by using platinum–iridium microelectrodes with impedances of 1–2 MΩ (see Gardiner and Nelson, 1992; Liu et al., 2008). Transdural penetrations began no sooner than 1 week after the chamber implantation. In each recording session, a microelectrode was lowered into the striatum and the activity of single units was amplified, discriminated, and stored in a computer by conventional means (Lebedev and Nelson, 1995; Liu et al., 2008). Neuronal receptive fields (RFs) were examined by lightly touching punctuate skin surfaces, manipulating joints, and palpating muscles. On the last recording day, electrolytic lesions were made to mark some recording locations by passing 10 μA of current for 10–20 s. These lesions provided references for the histological reconstruction of the recording sites. The animal was then deeply anesthetized with sodium pentobarbital and transcardially perfused with 10% buffered formol-saline. The brain was removed from the skull, and cut on a freezing microtome into 50 μm thick coronal sections. Histological sections of the basal ganglia were stained for Nissl substance. Recording sites were reconstructed based on the depth of each electrode penetration and its location with respect to the marking lesions.
Data Analysis
Neuronal activity data, recorded on-line (Lebedev and Nelson, 1995, 1996, 1999), were processed by off-line analysis programs and displayed as rasters, peri-event histograms (PEH), cumulative sum plots (CUSUM), and traces of position, aligned on the task events. The changes of neuronal activity associated with wrist movement were analyzed using PEHs and raster displays. In addition, the CUSUM plots (see, e.g., Lebedev and Nelson, 1995) in which mean firing rates are given by the plot’s slopes, illustrate the onset of significant increase in discharge before movement onset (MOS). The baseline activity (Bkg) of each recorded neuron was calculated as its mean firing rate during the 250 ms prior to the presentation of cues, while the animal held his wrist in a centered position. The first change in the CUSUM of more than 3 SDs, lasting for at least 40 ms, was designated as the activity onset (Onset or AOS). The total number of spikes occurring from AOS until MOS divided by the interval divided by the number of trials was designated as the cell’s pre-movement response (Resp). The period between AOS and MOS is the pre-movement time (R2) defined in Figure 1B. The time between the presentations of go-cue (Cue onsets, COS) and MOS represents the RT and the time between MOS and movement offset (MOF) is defined as the movement time (MT). Both MOS and MOF were determined from the position traces during movement as the times of significant changes in the wrist position, matching the wrist velocity onset or offset, respectively.
Results
Database
A total of 236 neurons were recorded, of these 149 (∼63%) were selected for further analysis, because each neuron: (i) had pre-movement activity (PMA) changes following the vibratory or visual go-cue onset and prior to MOS, (ii) had a PMA firing rate that was at least 3 SDs different from the baseline firing rate, and (iii) was held long enough to record at least 25 trials for each movement direction. Of these, 99/149 (∼66%) also had a complete set of recordings during visually cued trials. Of the selected NS neurons, 104/149 (∼70%) neurons were located in Putamen, 20/149 (∼13%) in the Caudate Nucleus, 18/149 (∼12%) in the cellular bridges in between these structures and 7/149 neurons were localized in the nearby regions. The total number of neostriatal cells categorized by the cue modality to which they responded (vibratory, VIB; visual, VIS), movement direction (flexions, Flex, extensions, Ext) and reward sequence (A, S-1, S-2, S-3) is shown in Table 1.
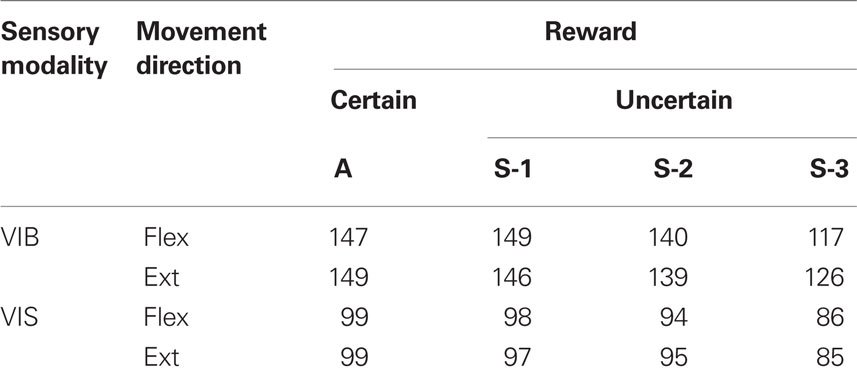
Table 1. Neurons having sufficient trials for timing and activity analyses as a function of reward (un)certainty.
Neostriatal Cell Firing for Certain and Uncertain Rewards
A significant proportion of neurons in dorsal striatum modulated their firing during this task. Figure 3A shows an example of a striatal neuron with increased modulations in trials with certain rewards (“A” trials). This neuron was recorded from the cellular bridge between caudate and putamen. Pre-movement firing is illustrated for vibratory cued trials. The PETHs and spike rasters are aligned on MOS. COS are indicated by blue dots, and reward delivery by red dots. Wrist flexion trials with certain rewards (“A” trials) and the subsequent trials with uncertain rewards (S-1 to S-3) are shown. The PEHs indicate that this neuron’s activity was modulated during both the RT epoch (from COS to MOS) and during movements. Wrist trajectories are shown in Figure 3B. It can be seen that in “A” trials the monkey initiated flexions earlier and moved faster and that the activity of the illustrated neuron was higher during these trials.
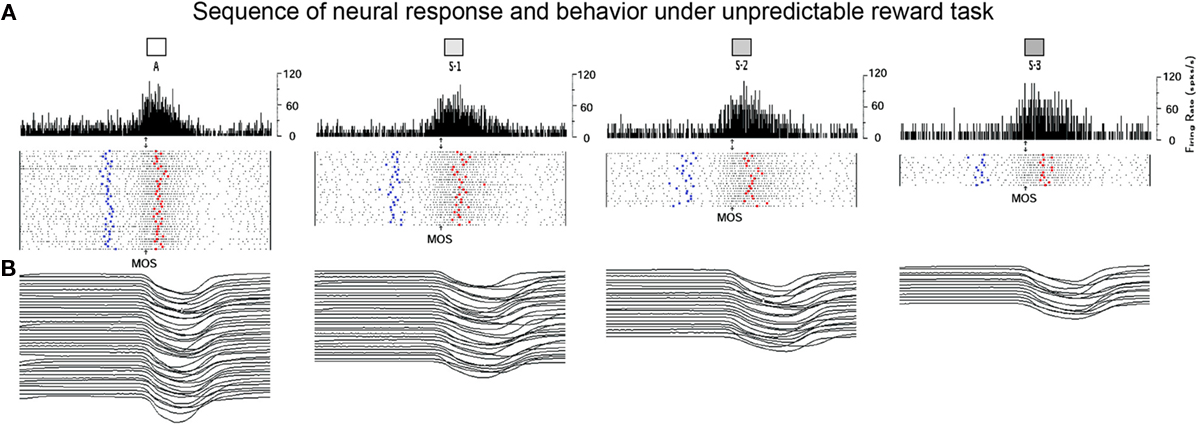
Figure 3. Example of dorsal striatal cell recorded under unpredicted reward schedule. (A) Each peri-event histogram illustrates neuronal activity expressed as mean firing rate (in spikes/s), together with raster displays aligned on MOS. The left panel display the NS activity during certain reward trials and the next panels represent the activity during uncertain reward trials. In the raster display, rows represent individual trials, dots represent single spikes, while the left and right bold dots represent vibratory cue onset and reward delivery, respectively. Bin width was equal to 5 ms. (B) Wrist position traces for each flexion trial are presented at the bottom of each panel.
Modulation of pre-movement activity by reward uncertainty
It has been suggested that reward probability biases neural activity by altering either the rate or the duration of cell firing (Lauwereyns et al., 2002). Figure 4 illustrates these features for our experiment. Average RT was the shortest for “A” trials, and as the RT “rubber-band” (Renoult et al., 2006) got shorter, so did the timing of the illustrated striatal neuron. For the illustrated striatal neuron, the duration of PMA (i.e., the interval between activity onset, AOS, and MOS) decreased, from 147, 139, and 157 ms in S-1, S-2, and S-3 trials, respectively, to 102 ms in “A” trials. Thus, the change in movement vigor manifested itself as change in RT and wrist velocity and accompanying changes in the timing of a striatal neuron’s activity. Note also that the slope of rate change in the striatal neuron increased in “A” trials (compare with similar findings in Lebedev et al., 2008). When the reward was certain, RT shortened, wrist velocity increased, the duration of striatal pre-movement firing contracted and the slope of pre-movement modulation increased in the striatum.
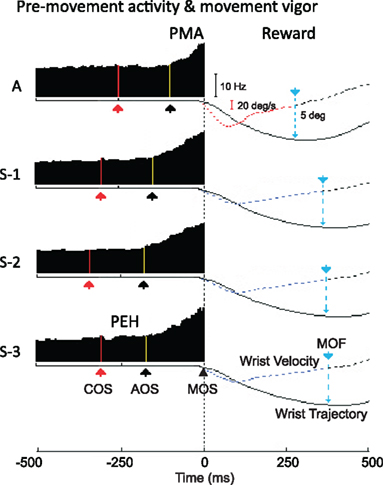
Figure 4. Movement plans as a function of the probability of expected reward. Smoothed peri-event histograms (on the left), aligned on movement onset, represent the pre-movement activity epochs (from the yellow line-corresponding to activity onset to MOS) as a function of reward probability (with the certain reward A on top and the sequence of uncertain rewards S-1 to S-3 following bellow). On the right we show hand position trajectories and movement velocity profiles (averaged across trials) that depict the vigor of movements when reward is certain (top traces) and when reward becomes uncertain (bottom). Abbreviations: MOS, movement onset; AOS, activity onset; COS, cue onset; and MOF, movement offset.
Changes in activity onset time
We observed several types of neuronal modulations. To describe these types of neuronal patterns, neuronal responses of each cell were sorted by activity onset time (see Figure 1B) and grouped into three categories: short, normal and long latencies. In Figure 5 we compared pre-movement and baseline firing of each latency group for certain (“A” trials) and uncertain rewards (S-1 trials). The short latency group responded with higher pre-movement firing rate (Resp) under VIB and VIS conditions (p < 0.01 for “short” latency and p < 0.05 for “normal” latencies; post hoc test), while the “long” latency group responds with a lower mean firing rate. The baseline firing (Bkg) increased slightly (p < 0.05, post hoc test) in “normal” latency group, compared to the other two groups. For visual cues, the short latency group “A” trials had higher pre-movement firing rate (by ∼5 spk/s) during flexion trials than the S-1 trials (p < 0.01; post hoc test) but not for vibratory cues. These results indicate that modulations in NS neurons reflected changes in movement vigor, as well as movement direction and cue type.
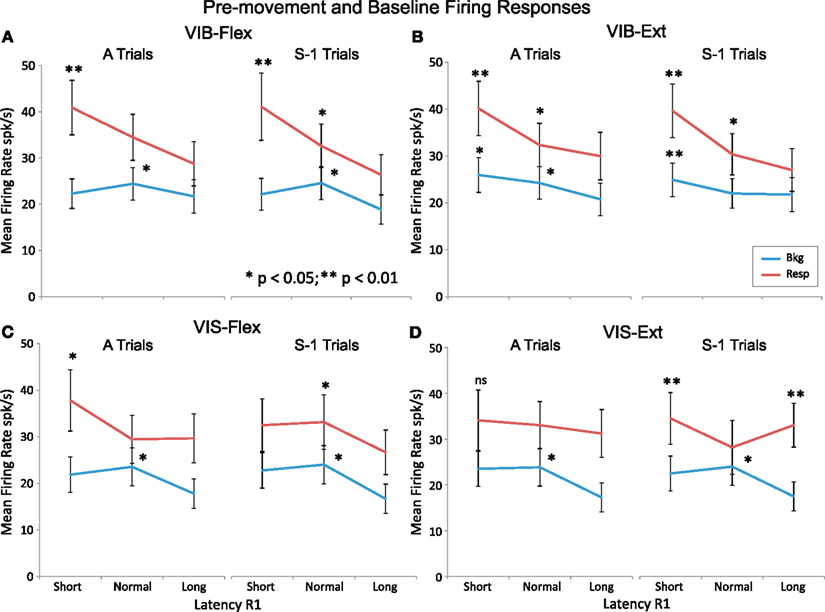
Figure 5. Pre-movement firing activity as a function of onset time. Mean firing rate for pre-movement activity and baseline are compared between certain reward “A” trials and uncertain reward S-1 trials under vibratory cues [(A) VIB–Flex and (B) VIB–Ext] and visual cues [(C) VIS–Flex and (D) VIS–Ext]. Pre-movement activity (Resp) and baseline (Bkg) are in red and blue color lines, respectively. The abscissa category “latency R1” is split into three unequal time intervals: short, normal, and long containing equal neuron numbers. The ordinate is showing the mean firing rate in spikes per second (spk/s) for each category group. Asterisks (*p < 0.05, **p < 0.01) indicate significant differences in mean firing rates for A vs. S-1 trials.
Modulation of activity timing by reward uncertainty
To quantify pre-movement timing at the population level for trials with certain and uncertain rewards, we partitioned the RT period (see Figure 1B) into latency (R1) and pre-movement epochs (R2; see Table 2).
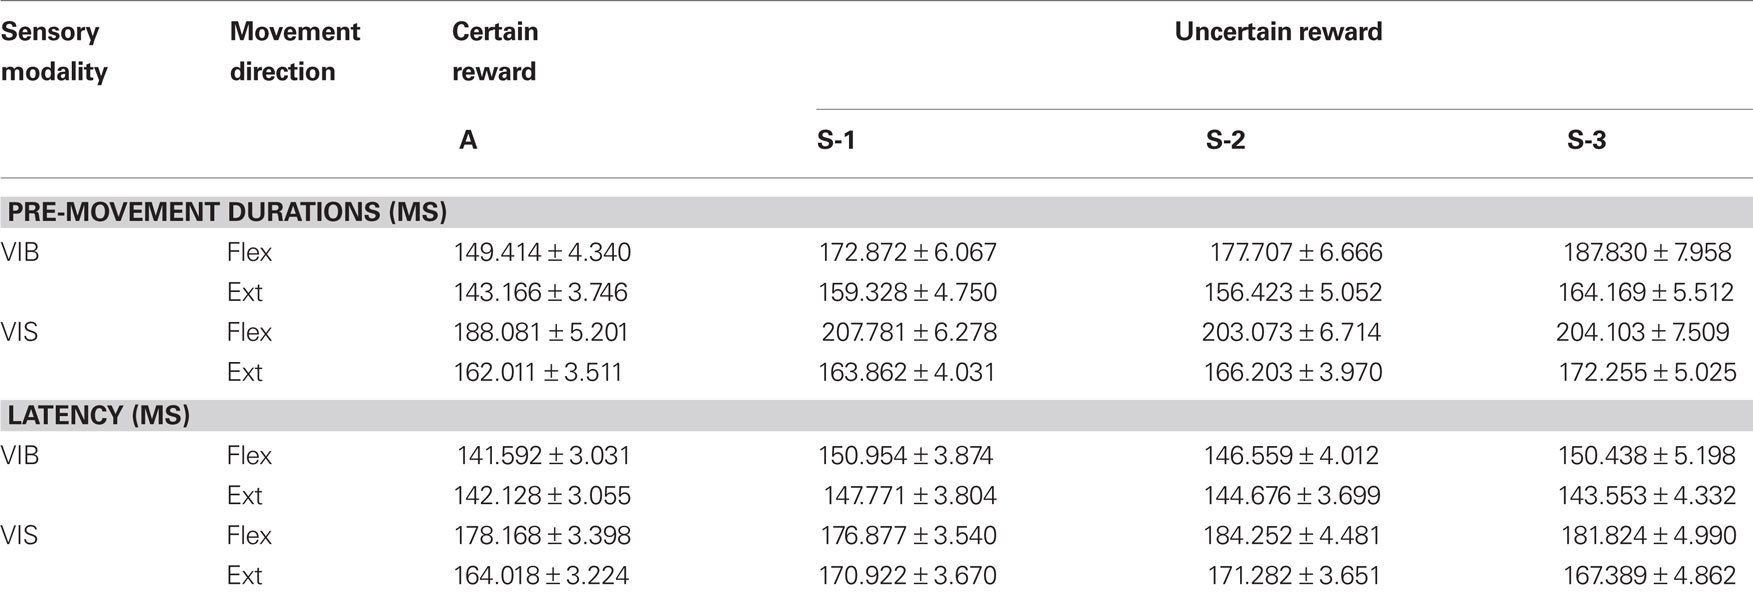
Table 2. Activity onset timing. The reaction time interval was divided into R1, which was the time from go-stimulus onset to significant activity change, and R2 (the pre-movement epoch) form activity change until MOS.
Pre-movement activity duration. Pre-movement durations, R2s, increased significantly with the increase in the number of consecutively rewarded trials in vibratory cued trials (Figures 6A,B), for both flexion and extension movements (for all conditions p < 0.001; post hoc test, except for A vs. S-2 extensions the level of significance was p < 0.01, post hoc test). R2s increased less with the increase in the number of consecutively rewarded trials for visually cued trials (Figures 6C,D), but significantly (p < 0.05; post hoc test) for flexions and for “A” vs. S-3 extension movements (see Table 2). The general trend in PMA following withheld rewards was that the duration of pre-movement time became shorter when reward was certain (“A” trials), and longer when reward was uncertain (in the subsequent trials S-1 to S-3). Moreover, we found increased slopes of rate changes in “A” trials (p < 0.01, post hoc test). Thus, changes in reward probability caused both changes in characteristics of behavior (RT and movement speed) and in NS modulations.
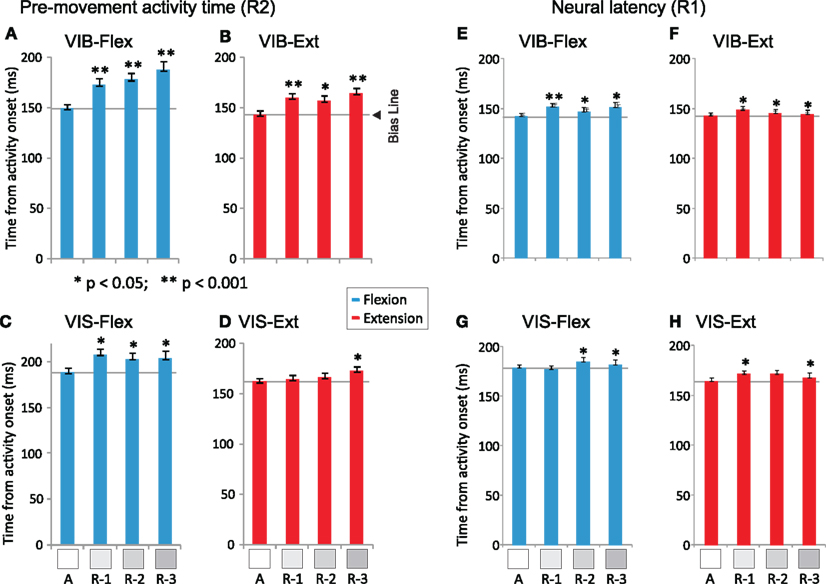
Figure 6. Latency and pre-movement activity durations as a function of reward sequence. Left: Pre-movement durations (mean ± SEM) are plotted for vibratory cues [(A) flexions sequence trials and (B) extensions). Similarly, R2s for visual cues [(C) flexions and (D) extensions). Right: Neural latencies R1s (mean ± SEM) are plotted for vibratory cues [(E) flexions and (F) extensions) and for visual cues [(G) flexions and (H) extensions]. The horizontal gray lines represent the temporal bias reference lines [Bias Line in (B)]. Temporal selection bias (Bias) is represented on the Time axis in panel b together with the key events: activity onset (AOS) and movement onset (MOS). Numerical values of R1s and R2s are shown in Table 2. Asterisks (*p < 0.05, **p < 0.001) indicate significant differences in mean pre-movement times for A vs. S-1, S-2, and S-3 trials.
Neural latency. The time epoch in the PETH from cue onset to the onset of firing modulation is called here “neural latency” and corresponds to R1 in Figure 1B. R1s increased slightly with the increase in the number of consecutively rewarded trials in vibratory cued trials (Figures 6E,F), for both flexion and extension movements (for all conditions, p < 0.05, post hoc test, except for “A” vs. S-1 flexions in which the level of significance was p < 0.001). Under visual cues (Figures 6G,H), R1s increased with the increase in the number of consecutively rewarded trials for several conditions (p < 0.05; post hoc test for “A” vs. S-2 and S-3, flexions and also for “A” vs. S-1 and S-3 extensions; see Table 2). This suggests that reward uncertainty mediated a “rubber-band” temporal effect (Renoult et al., 2006) for the RT period: when RTs increased, R1s and R2s increased, as well.
Comparison of pre-movement modulations across modality
The parameters of movements and neuronal modulations in the striatum depended on the sensory modality of the go-cue (VIB vs. VIS go-cues). Comparisons of pre-movement times R2s between visual and vibratory cues showed significantly longer R2s (∼20–40 ms) for flexions cued by visual VIS stimuli (“A” trials: p < 0.001, unpaired two-tails t-test; S-1, S-2, and S-3 trials: p < 0.01, post hoc test) than those cued by VIB stimulation. Also, R2s for extension were slightly longer (∼5–20 ms) when cued by VIS stimuli (“A” trials, p < 0.001, unpaired two-tails t-test and p < 0.01, post hoc test; S-1, S-2, and S-3 trials: p < 0.01, post hoc test) compared to vibratory VIB cues.
On the other hand, comparisons of R1s across sensory modality showed significantly longer latencies for flexions (VIB vs. VIS cues; “A” to S-3 conditions: p < 0.001, unpaired two-tails t-test; “A” and S-1 trials: p < 0.01, post hoc test) and extensions under vibratory cues (“A” to S-3 conditions: p < 0.001, unpaired two-tails t-test) compared to visual cues. Thus, the temporal bias caused by the changes in reward probability varied differentially with the sensory modality, occurring faster for visual cues than for vibratory stimuli.
The modality effect was reflected also by the monkeys’ behavior in the error trials. The animals made more than four error trials per session (required to be considered for analysis) in 46/198 (23%) visual sessions and in 139/296 (47%) sessions. Of these, flexion trials errors occurred in 94/247 (38%) sessions and extension trial errors in 91/247 (37%) sessions. Thus, animals were more than twice likely to make errors in VIB-trials in which the vibratory cue did not provide a directional instruction than in VIS-trials in which the visual cue clearly indicated such instruction.
Wrist movement velocity varies with reward uncertainty
The changes in wrist velocity with reward probability are shown in Figures 7A–D that depicts the distribution of mean wrist movement velocities across reward conditions. Wrist movements were performed with higher velocities in trials with certain rewards (“A” trials) than in trials with uncertain rewards (S-1 to S-3 trials) for all modalities and directions (p < 0.05; unpaired two-tails t-test, post hoc test). Across modalities (VIS vs. VIB) wrist Flex velocities (Figures 7A,C) were slower with ∼2–4°/s than for Ext velocities (Figures 7B,D; p < 0.001; unpaired two-tails t-test, post hoc test).
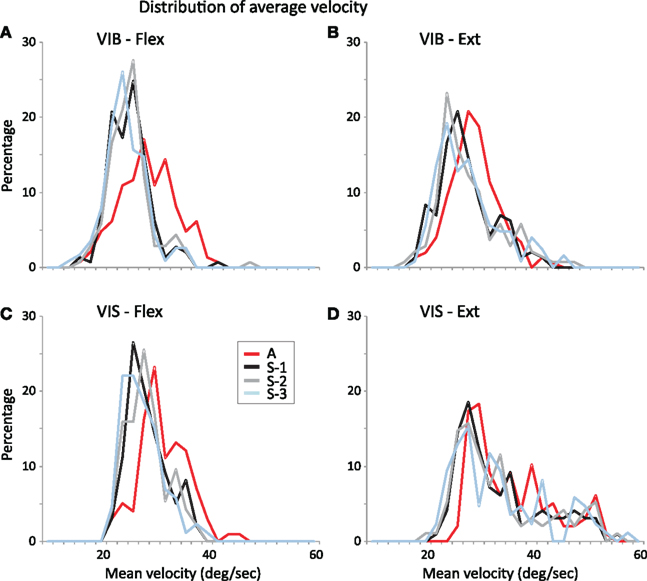
Figure 7. Distribution of mean wrist velocity across reward probabilities. Mean wrist velocity are compared under vibratory cues [(A) VIB–Flex and (B) VIB–Ext] and visual cues [(C) VIS–Flex and (D) VIS–Ext]. Movements were performed with higher velocities under certain rewards (A trials) than under uncertain rewards (S-1 to S-3 trials).
Correlation between pre-movement time and wrist velocity
Pre-movement changes in duration were correlated with RTs, MTs, and hand wrist velocity (Figures 8 and 9).
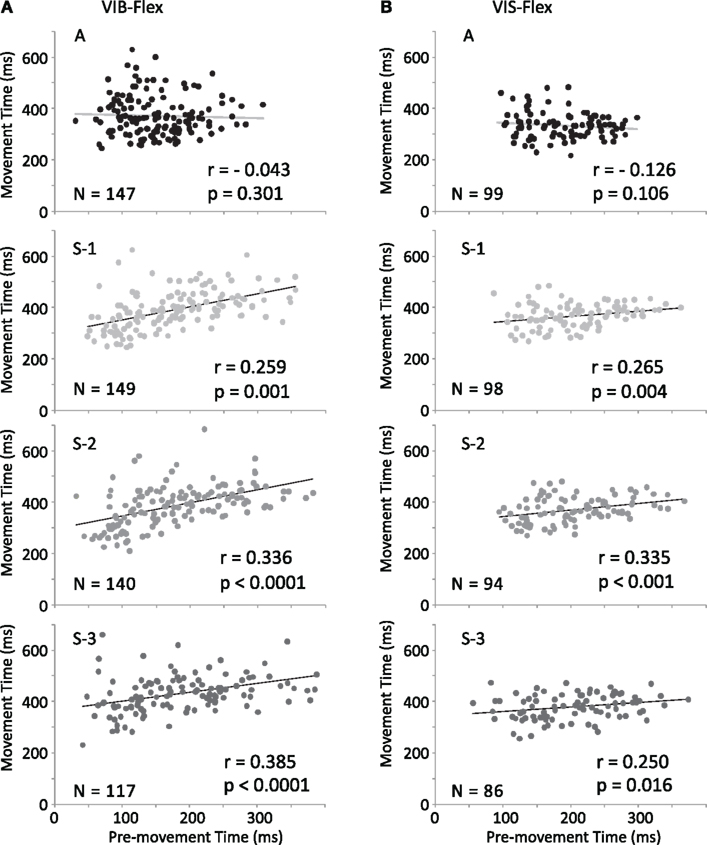
Figure 8. Correlation between movement and pre-movement times. Comparison of Pearson correlation coefficients are shown for vibratory cues [(A) VIB Flex] and for visual cues [(B) VIS Flex]. Pearson correlation coefficients are statistically significant for S-1 to S-3 trials (p < 0.05) and not significant for A trials.
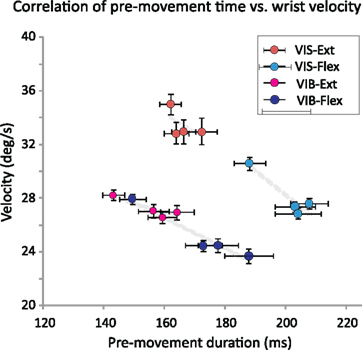
Figure 9. Correlation between mean wrist velocity and pre-movement time across sensory modality and movement directions. Scatter plot of mean wrist velocity vs. pre-movement activity duration for vibratory cues (violet) VIB–Flex and (pink) VIB–Ext) and visual cues (blue) VIS–Flex and (red) VIS–Ext) shows a consistent trend across movement direction and sensory modalities under reward uncertainty.
Correlation between reaction time and pre-movement activity duration. As shown in Figure 6, both components of the RT: latency R1 and pre-movement duration R2 show a clear dependency on reward probability which followed the previously reported “rubber-band” relationship (Renoult et al., 2006). These changes in neural timing were found for both VIB and VIS stimuli. Pearson correlations of R2s with RTs varied between r = 0.52 and 0.87 with significant p-values (p < 0.001; two-tailed). The correlation coefficients for R1s vs. RTs were slightly lower (between r = 0.22 and 0.67) and the p-values also significant (p < 0.01; two-tailed).
Correlation between movement time and pre-movement activity duration. To examine whether PMA duration was correlated with movement parameters, we calculated Pearson correlation coefficients between these two variables. Figure 8A shows a linear dependence of Flex MTs on R2s under VIB cues reflected in the correlation coefficients r = 0.259 for S-1, r = 0.336 for S-2, r = 0.385 for S-3. Similarly under VIS cues (Figure 8B), the coefficients values were r = 0.265 for S-1, r = 0.335 for S-2, r = 0.250 for S-3. Pearson’s coefficients were statistically significant for S-1 to S-3 trials (p < 0.05) in both modalities (VIB and VIS), but not significant for “A” trials in which R2s were more stable.
Correlation between mean wrist velocity and pre-movement time across sensory modality and movement direction. We found a consistent correlation between wrist velocity and pre-movement time in NS neurons across sensory modalities and movement directions (shown in Figure 9) and clustered within the same modality/direction category. This relationship was noticeable when Pearson correlation between pre-movement duration and average wrist movement velocity (Figure 9) were examined across reward groups (n = 4) under both VIB and VIS cued flexions (r = −0.999, p = 0.001; two-tailed). Extension movements performed under VIB cues (r = −0.989, p = 0.011), and VIS cues (r = −0.991, p = 0.009) revealed this effect. Thus, in a consistent manner, average wrist velocity decreased in cohort with the increase in the pre-movement duration across modalities.
Variability in movement planning induced by reward unpredictability
The coefficient of variation (CV) represents the ratio between SD and the mean. We compared the degree of variability in neural/behavioral measures (latency, PMA time, RT, and MT) between certain and uncertain rewards. Figure 10A shows a sequence of spike rasters indicating the increase in variability of event timing as a function of reward uncertainty. The CVs in Figure 10B indicate that variability in pre-movement time (R2) tended to be higher than that in latency (R1) and MT. Such increase in CVs may be explained by variations in reward unpredictability.
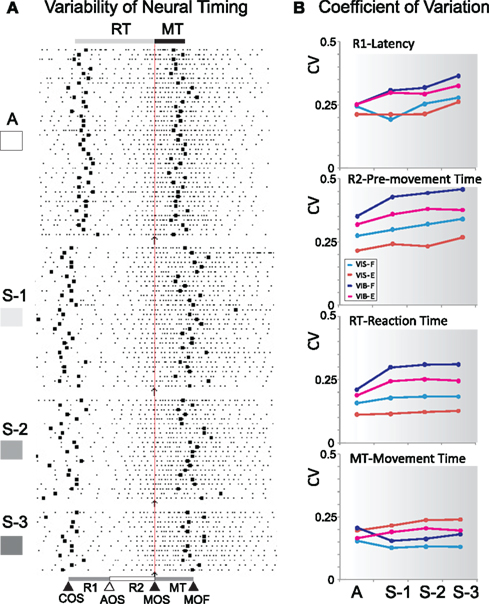
Figure 10. Variability under reward uncertainty. (A) Example of a sequence raster with event timing variability. Events relevant to the task are: cue onset (COS), significant activity onset (AOS), movement onset (MOS) and movement offset (MOF). (B) Coefficients of variation (CVs). CVs for latency (R1), pre-movement time (R2), reaction time (RT), and movement time are plotted as a function reward sequence for both flexions (F) and extensions (E) cued by vibratory (VIB) and visual (VIS) cues.
Discussion
In the present study we recorded the activity of neostriatal neurons in two rhesus monkeys performing wrist movements in a pseudo-random reward task. We analyzed the PMA and behavioral data under three conditions: (a) certain vs. uncertain rewards, (b) vibratory vs. visual go-cues, and (c) flexion vs. extension movements. Our results show that both PMA of most dorsal striatal neurons and wrist movement parameters changed as a function of reward contingency (results published in abstract form, Nelson et al. 1996, 1997).
Pre-movement modulations in dorsal striatal neurons have been hypothesized to be related to movement planning (Alexander and Crutcher, 1990; Hoshi and Tanji, 2000; Hori et al., 2009). In our experiments, the magnitude of pre-movement firing did not change substantially across reward conditions, likely because monkeys produced movement of similar amplitude. What changed instead were the RTs, the onsets of the modulation in the firing rates of dorsal striatal neurons and the slopes of their rate changes. These changes in neural timing also manifested themselves as alterations of neural latency and pre-movement time, in agreement with Mirenowicz and Schultz (1994) and Blazquez et al. (2002). Thus, reward probability affected both bottom up sensory processing reflected by neural latency and the top down flow of information through the basal ganglia-thalamo-cortical loops expressed as pre-movement time, rate, and rate slope.
Unpredictable Reward and the Action/Movement Plan
Does reward expectation modulate the temporal and kinematic parameters represented by a movement plan? It is well documented that reward schedule is a key factor in the shaping of animal’s behavior (Herrnstein, 1961; Staddon 2001; Sugrue et al., 2004). According to Herrnstein’s matching rule, an animal’s choice optimizes reinforcement probability, so that the choice matches the probability of reinforcement (Herrnstein, 1961; Sugrue et al., 2004; Lau and Glimcher, 2008; Platt and Huettel, 2008). To modulate the timing of a movement plan the brain evaluates the utility of each option and selects the most valuable action (Seideman et al., 1998; Schall, 2003; Samejima et al., 2005; Maimon and Assad, 2006; O’Shea et al., 2007; Pasquereau et al., 2007; Hori et al., 2009), by activating neuronal circuits in fronto-parietal cortex, striatum, and the subcortical regions in the brain (Simmons and Richmond, 2008; Opris et al., 2009; Hikosaka and Isoda, 2010; Tsujimoto et al., 2010; Turner and Desmurget, 2010).
Our results show changes in pre-movement firing (Figure 5) and timing (Figure 6) in dorsal striatum with reward expectation, suggesting that NS is involved in the modulation of movement vigor (Mirenowicz and Schultz, 1994; Blazquez et al., 2002; Turner and Desmurget, 2010). Manipulations of reward probability produced both types of changes (in motor parameters and in neuronal modulations) in our experiments. When reward was uncertain MOS shifted in time (away from COS) and movement was initiated after a delay of ∼30–60 ms (depending on sensory modality and movement direction; Figure 6). Conversely, when reward becomes certain wrist movements were initiated sooner. The velocity of wrist movements increased when reward was certain and decreased when reward became uncertain, showing evidence for a role of reward contingency in movement “vigor” modulation (Figures 4 and 7). These changes in movement parameters were linked to changes in dorsal striatal activity as a function of reward probability. Our results show that changes in PMA and movement velocity were correlated (Figure 9). Thus, such correlation provides evidence for a linkage between movement vigor and the optimization (discounting) of action-based reward value in time (Shadmehr et al., 2010).
Role of Basal Ganglia Activity in Movement Vigor and Temporal Bias
Horak and Anderson (1984) and more recently Turner and Desmurget (2010) have suggested that basal ganglia influence the “vigor” of movements.
Relationship to movement vigor
It is reasonable to suggest that when a monkey is expecting a reward it becomes more “excited” and moves more quickly toward the goal than when the reward becomes uncertain. An uncertain reward, on the other hand, will only reduce animal’s vigor. Dorsal striatum likely has a role in the modulation of movement vigor, as suggested by the study showing that it mediates cortical signals necessary for behavioral switching (Hikosaka and Isoda, 2010). Thus, dorsal striatal circuits may modulate movement vigor through a switch that is related to the reward mechanism and differentially biases movements (Ding and Hikosaka, 2007). Therefore, based on the pre-movement timing, dorsal striatum cells may modulate movement vigor before the pallidal cells do (Horak and Anderson, 1984; Turner and Desmurget, 2010).
Temporal bias
We define temporal bias as a temporal shift in movement initiation with respect to the cue onset. Such bias may have a role in the “proactive timing of action” (Maimon and Assad, 2006). Our data (Figures 5A–D) show a temporal bias in the pre-movement timing as a function of reward expectation. When the reward was certain, a temporal shift in MOS caused the movement to occur sooner, and when it was uncertain the MOS came later. Consequently, the velocity of movement became faster in trials with certain rewards or slower when the reward was uncertain. Changes in temporal bias and accompanying changes in striatal activity that we observed here are somewhat analogous to the well-known modulations of behavioral choices and selections by caudate-putamen and other components of the basal ganglia-thalamo-cortical loops that act as switches between the representations of many behavioral degrees of freedom (Redgrave et al., 1999; Salinas et al., 2000; Kimura et al., 2003; Schall, 2003; O’Shea et al., 2007). The difference between the selection and temporal bias is that selection involves choosing between discrete options whereas the temporal bias represents a continuous modulation of motor preparation.
Analogies between Temporal Bias and Covert Choice
Consistent with the free choice hypothesis, a decision mechanism may select an option based on (i) reward value, (ii) knowledge from previous experience, and (iii) the accumulation of sensory evidence (for review see Schall, 2003; Opris and Bruce, 2005; Padoa-Schioppa and Assad, 2006; Beck et al., 2008; Platt and Huettel, 2008). In our experiment there are faster or slower movements and certain vs. uncertain rewards, with the certain reward having a higher value than the uncertain one. Also, the previous “no-reward” trial acts as a cue indicating a certain reward in the current trial, thus providing the prior information. Since reward availability/probability is not indicated by an instruction cue, no sensory accumulation occurs and the choice is covert.
Comparison with Other Studies
Previously, Lauwereyns et al. (2002) identified neurons in the primate Caudate Nucleus that create a spatially selective “response bias.” Their response bias was associated to the spatial location of the visual target. In our case the bias signal (triggered by the uncertainty of reward) is associated to the temporal dimension because it affects the onset of movement initiation and the velocity of wrist movements (Seideman et al., 1998; Frederick et al., 2002; Ditterich, 2006; Machens et al., 2010). Looking from the value of the action perspective (Samejima et al., 2005; Lau and Glimcher, 2008; Hori et al., 2009) a certain reward has a higher value and it is likely to activate the selection circuitry of faster movements, while an uncertain reward carries a lower value and will activate the circuitry for slower movements (Samejima et al., 2005; O’Shea et al., 2007; Shadmehr et al., 2010). The difference in timing between fast and slow pre-movement times is 30–60 ms, but long enough for a decision to take place (Schall, 2003; Stanford et al., 2010).
Another aspect of movement planning under uncertain reward deals with pre-movement variability (Figure 10). Movements are planned such that their variability gets minimized (Harris and Wolpert, 1998; Mohr and Nagel, 2010). Churchland et al. (2006b) argues that variability in arm movements originates mostly in central movement planning. In our experiments, the sources of variability for RTs, especially of pre-movement times (as shown in Figure 10B) are coming from changes in reward probability. These results support the idea that reward contingency contributes to the variability in movement planning and in wrist movement trajectories.
Relevance to Neuroeconomics
Our study is relevant to the neuroeconomics field for the dissociation of movement planning (“vigor” and temporal bias) in dorsal striatum under certain vs. uncertain rewards. A vigorous (forceful) movement can be viewed as a “valuable investment,” being engaged only when the monkey is sure about a trial’s outcome. Indeed, fast movements are somewhat more expensive since they involve more muscle contraction, probably more brain and energy resources. In other cases the monkey moves slowly, because the animal has “invested” less in that action (Kim et al., 2008; Shadmehr et al., 2010).
Action planning and choice under uncertain conditions are risky and difficult since no plan of action is available to the decision maker for a specific outcome (Kim et al., 2008; Platt and Huettel, 2008). From our results emerges a clear clue that an increase in reward uncertainty delays a plan for action, while a switch from uncertain to certain rewards speeds up the plan to act. In fact, this is another pointer to neuroeconomics, based on the fact that velocity of wrist movements increased when reward was certain and decreased when reward became uncertain. This provides evidence for optimization vs. discounting of action in time based on reward value (Shadmehr et al., 2010).
In conclusion, our results show several important features of a motor planning mechanism depending on reward contingency, providing evidence for a neural substrate of movement ”vigor” planning in dorsal striatum. First, in the trials with certain rewards, striatal neurons modulated their firing rates earlier. Second, pre-movement changes in firing rate timing are correlated with the MTs and wrist movement velocity. Third, these modulations depended on the sensory modality of the cue (visual vs. vibratory) and/or movement direction (flexions vs. extensions). Finally, the motor planning mechanism in dorsal striatum may be responsible for the modulation of movement “vigor” according to reward contingency.
Conflict of Interest Statement
The authors declare that the research was conducted in the absence of any commercial or financial relationships that could be construed as a potential conflict of interest.
Acknowledgments
The authors wish to thank John M. Denton who assisted during the gathering of data that was presented in this manuscript, to John E. R. Staddon, D. James Surmeier, and Charles J. Wilson for detailed comments on versions of this manuscript and to Michael Platt and Scott Huettel for insightful discussions. We would also like to thank the two reviewers for their insightful suggestions. This work was supported by NIH Program Project Grant NS26473, and conducted under the auspices of a project thereof under the direction of Randall J. Nelson.
References
Alexander, G. E., and Crutcher, M. D. (1990). Preparation for movement: neural representations of intended direction in three motor areas of the monkey. J. Neurophysiol. 64, 133–150.
Beck, J. M., Ma, W. J., Kiani, R., Hanks, T., Churchland, A. K., Roitman, J., Shadlen, M. N., Latham, P. E., and Pouget, A. (2008). Probabilistic population codes for Bayesian decision making. Neuron 60, 1142–1152.
Blazquez, P. M., Fujii, N., Kojima, J., and Graybiel, A. M. (2002). A network representation of response probability in the striatum. Neuron 33, 973–982.
Churchland, M. M., Santhanam, G., and Shenoy, K. V. (2006a). Preparatory activity in premotor and motor cortex reflects the speed of the upcoming reach. J. Neurophysiol. 96, 3130–3146.
Churchland, M. M., Afshar, A., and Shenoy, K. V. (2006b). A central source of movement variability. Neuron 52, 1085–1096.
Colburn, T. R., and Evarts, E. V. (1978). “Long-loop adjustments during intended movements: use of brushless D.C. torque motors in studies of neuromuscular function,” in Progress in Clinical Neurophysiology, Vol. 4, ed. J. E. Desmedt (New York: Karger), 153–166.
Ding, L., and Hikosaka, O. (2007). Temporal development of asymmetric reward-induced bias in macaques. J. Neurophysiol. 97, 57–61.
Fiorillo, C. D., Tobler, P. N., and Schultz, W. (2003). Discrete coding of reward probability and uncertainty by dopamine neurons. Science 299, 1898–1902.
Frederick, S., Loewenstein, G., and O’Donoghue, T. (2002). Time discounting and time preference: a critical review. J. Econ. Lit. 40, 351–401.
Harris, C. M., and Wolpert, D. M. (1998). Signal-dependent noise determines motor planning. Nature 394, 780–784.
Herrnstein, R. J. (1961). Relative and absolute strength of response as a function of frequency of reinforcement. J. Exp. Anal. Behav. 4, 267–272.
Gardiner, T. W., and Nelson, R. J. (1992). Striatal neuronal activity during the initiation of hand movements made in response to visual and vibratory cues. Exp. Brain Res. 92, 15–26.
Gaspar, P., Stepniewska, I., and Kaas, J. H. (1992). Topography and collateralization of the dopaminergic projections to motor and lateral prefrontal cortex in owl monkeys. J. Comp. Neurol. 325, 1–21.
Hayden, B. Y., Nair, A., McCoy, A. N., and Platt, M. L. (2008). Posterior cingulate cortex mediates outcome-contingent allocation of behavior. Neuron 60, 19–25.
Hikosaka, O., and Isoda, M. (2010). Switching from automatic to controlled behavior: cortico-basal ganglia mechanisms. Trends Cogn. Sci. (Regul. Ed.) 14, 154–161.
Horak, F. B., and Anderson, M. E. (1984). Influence of globus pallidus on arm movements in monkeys. II. Effects of stimulation. J. Neurophysiol. 52, 305–322.
Hori, Y., Minamimoto, T., and Kimura, M. (2009). Neuronal encoding of reward value and direction of actions in the primate putamen. J. Neurophysiol. 102, 3530–3543.
Hoshi, E., and Tanji, J. (2000). Integration of target and body-part information in the premotor cortex when planning action. Nature 408, 466–470.
Kalaska, J. F., and Crammond, D. J. (1995). Deciding not to GO: neuronal correlates of response selection in a GO/NOGO task in primate premotor and parietal cortex. Cereb. Cortex 5, 410–428.
Kim, S., Hwang, J., and Lee, D. (2008). Prefrontal coding of temporally discounted values during intertemporal choice. Neuron 59, 161–172.
Kimura, M., Yamada, H., and Matsumoto, N. (2003). Tonically active neurons in the striatum encode motivational contexts of action. Brain Dev. 25(Suppl. 1), S20–S23.
Kiyatkin, E. A., and Rebec, G. V. (1996). Dopaminergic modulation of glutamate-induced excitations of neurons in the neostriatum and nucleus accumbens of awake unrestrained rats. J. Neurophysiol. 75, 142–152.
Lau, B., and Glimcher, P. W. (2008). Value representations in the primate striatum during matching behavior. Neuron 58, 451–463.
Lauwereyns, J., Watanabe, K., Coe, B., and Hikosaka, O. (2002). A neural correlate of response bias in monkey caudate nucleus. Nature 418, 413–417.
Lebedev, M. A., and Nelson, R. J. (1995). Rhythmically firing, 20-50 Hz neurons in monkey primary somatosensory cortex: activity patterns during initiation of vibratory-cued hand movements. J. Comp. Neurosci. 2, 313–334.
Lebedev, M. A., and Nelson, R. J. (1996). High-frequency vibratory sensitive neurons in monkey primary somatosensory cortex: entrained and nonentrained responses to vibration during the performance of vibratory-cued hand movements. Exp. Brain Res. 111, 313–325.
Lebedev, M. A., and Nelson, R. J. (1999). Rhythmically firing neostriatal neurons in monkey: activity patterns during reaction-time hand movements. J. Neurophysiol. 82, 1832–1842.
Lebedev, M. A., O’Doherty, J. E., and Nicolelis, M. A. (2008). Decoding of temporal intervals from cortical ensemble activity. J. Neurophysiol. 99, 166–186.
Lee, H., and Assad, J. (2003). Putaminal activity for simple reactions or self-timed movements. J. Neurophysiol. 89, 2528–2537.
Liu, Y., Denton, J. M., and Nelson, R. J. (2005). Neuronal activity in primary motor cortex differs when monkeys perform somatosensory and visually guided wrist movements. Exp. Brain Res. 167, 571–586.
Liu, Y., Denton, J. M., and Nelson, R. J. (2008). Monkey primary somatosensory cortical activity during the early reaction time period differs with cues that guide movements. Exp. Brain Res. 187, 349–358.
Machens, C. K., Romo, R., and Brody, C. D. (2010). Functional, but not anatomical, separation of “What”and “When” in prefrontal cortex. J. Neurosci. 30, 350–360.
Maimon, G., and Assad, J. A. (2006). A cognitive signal for the proactive timing of action in macaque LIP. Nat. Neurosci. 9, 948–955.
McCoy, A. N., and Platt, M. L. (2005). Expectations and outcomes: decision-making in the primate brain. J. Comp. Physiol. A Neuroethol. Sens. Neural. Behav. Physiol. 191, 201–211.
Miller, E. K., and Phelps, E. A. (2010). Preface: current opinion in neurobiology-cognitive neuroscience, editorial overview. Curr. Opin. Neurobiol. 20, 1–2.
Mirenowicz, J., and Schultz, W. (1994). Importance of unpredictability for reward responses in primate dopamine neurons. J. Neurophysiol. 72, 1024–1027.
Mohr, P. N., and Nagel, I. E. (2010). Variability in brain activity as an individual difference measure in neuroscience? J. Neurosci. 30, 7755–7757.
Nelson, R. J., Lebedev, M. A., Opris, I., and Denton, J. M. (1996). Neostriatal neuronal activity becomes better related to movements when conditions become unpredictable. Soc. Neurosci. Abstr. 22, 1085.
Nelson, R. J., Opris, I., and Denton, J. M. (1997). Effects of the number of consecutive rewarded trials on subsequent movement related activity of neostriatal and sensorimotor cortical neurons. Soc. Neurosci. Abstr. 23, 464.
Opris, I., and Bruce, C. J. (2005). Neural circuitry of judgment and decision mechanisms. Brain Res. Rev. 48, 509–528.
Opris, I., Hampson, R. E., and Deadwyler, S. A. (2009). The encoding of cocaine vs. natural rewards in the striatum of nonhuman primates: categories with different activations. Neuroscience 163, 40–54.
O’Shea, J., Sebastian, C., Boorman, E. D., Johansen-Berg, H., and Rushworth, M. F. (2007). Functional specificity of human premotor-motor cortical interactions during action selection. Eur. J. Neurosci. 26, 2085–2095.
Padoa-Schioppa, C., and Assad, J. A. (2006). Neurons in the orbitofrontal cortex encode economic value. Nature 441, 223–226.
Pasquereau, B., Nadjar, A., Arkadir, D., Bezard, E., Goillandeau, M., Bioulac, B., Gross, C. E., and Boraud, T. (2007). Shaping of motor responses by incentive values through the basal ganglia. J. Neurosci. 27, 1176–1183.
Platt, M. L., and Huettel, S. A. (2008). Risky business: the neuroeconomics of decision making under uncertainty. Nat. Neurosci. 11, 398–403.
Redgrave, P., Prescott, T. J., and Gurney, K. (1999). The basal ganglia: a vertebrate solution to the selection problem. Neuroscience 89, 1009–1023.
Renoult, L., Roux, S., and Riehle, A. (2006). Time is a rubber band: neuronal activity in monkey motor cortex in relation to time estimation. Eur. J. Neurosci. 23, 3098–3108.
Romo, R., Scarnati, E., and Schultz, W. (1992). Role of primate basal ganglia and frontal cortex in the internal generation of movements. Exp. Brain Res. 91, 385–395.
Romo, R., and Schultz, W. (1990). Dopamine neurons of the monkey midbrain: Contingencies of responses to active touch during self-initiated arm movements. J. Neurophysiol. 63, 592–606.
Salinas, E., Opris, I., Zainos, A., Hernandez, A., and Romo, R. (2000). “Motor and non-motor roles of the cortico-basal ganglia circuitry,” in Brain Dynamics and the Striatal Complex, eds R. Miller and J. Wickens (Amsterdam: Harwood Acad.), 237–255.
Samejima, K., Ueda, Y., Doya, K., and Kimura, M. (2005). Representation of action-specific reward values in the striatum. Science 310, 1337–13340.
Schall, J. D. (2003). Neural correlates of decision processes: neural and mental chronometry. Curr. Opin. Neurobiol. 13, 182–186.
Seideman, E., Zohary, E., and Newsome, W. T. (1998). Temporal gating of neural signals during performance on a visual discrimination task. Nature 394, 72–75.
Shadmehr, R., Orban de Xivry, J.-J., Xu-Wilson, M., and Shih, T.-Y. (2010). Temporal discounting of reward and the cost of time in motor control. J. Neurosci. 30, 10507–10516.
Shidara, M., Aigner, T. G., and Richmond, B. J. (1998). Neuronal signals in the monkey ventral striatum related to progress through a predictable series of trials. J. Neurosci. 18, 2613–2625.
Simmons, J. M., and Richmond, B. J. (2008). Dynamic changes in representations of preceding and upcoming reward in monkey orbitofrontal cortex. Cereb. Cortex 18, 93–103.
Staddon, J. E. R. (2001). Adaptive Dynamics: The Theoretical Analysis of Behavior. Cambridge, MA: MIT/Bradford.
Stanford, T. R., Shankar, S., Massoglia, D. P., Costello, G. M., and Salinas, E. (2010). Perceptual decision making in less than 30 milliseconds. Nat. Neurosci. 13, 379–85.
Sugrue, L. P., Corrado, G. S., and Newsome, W. T. (2004). Matching behavior and the representation of value in the parietal cortex. Science 304, 1782–1787.
Tsujimoto, S., Genovesio, A., and Wise, S. P. (2010). Evaluating self-generated decisions in frontal pole cortex of monkeys. Nat. Neurosci. 13, 120–126.
Turner, R. S., and Anderson, M. E. (1997). Pallidal discharge related to the kinematics of reaching movements in two dimensions. J. Neurophysiol. 77, 1051–1074.
Turner, R. S., and Desmurget, M. (2010). Basal ganglia contributions to motor control: a vigorous tutor. Curr. Opin. Neurobiol. 20, 704–716.
Van der Meer, A., and Redish, D. A. (2009). Covert expectation-of-reward in rat ventral striatum at decision points. Front. Integr. Neurosci. 3:1. doi: 10.3389/neuro.07.001.2009
Keywords: basal ganglia, primate neostriatum, movement planning, decision making, reward, uncertainty, hand movements, movement vigor
Citation: Opris I, Lebedev M and Nelson RJ (2011) Motor planning under unpredictable reward: modulations of movement vigor and primate striatum activity. Front. Neurosci. 5:61. doi: 10.3389/fnins.2011.00061
Received: 13 December 2010; Accepted: 14 April 2011;
Published online: 09 May 2011.
Edited by:
Daeyeol Lee, Yale University School of Medicine, USAReviewed by:
Paul Cisek, University of Montreal, CanadaSoyoun Kim, Yale University School of Medicine, USA
Copyright: © 2011 Opris, Lebedev and Nelson. This is an open-access article subject to a non-exclusive license between the authors and Frontiers Media SA, which permits use, distribution and reproduction in other forums, provided the original authors and source are credited and other Frontiers conditions are complied with.
*Correspondence: Ioan Opris, Department of Physiology and Pharmacology, Wake Forest University, Winston Salem, NC 27157, USA. e-mail:aW9vcHJpc0B3ZnVibWMuZWR1


