 Ping He
 Xiaohua Xu
 Han Zhang
 Gang Li2
 Jingxin Nie
 Pew-Thian Yap
 Dinggang Shen
- 1Department of Computer Science, Yangzhou University, Yangzhou, China
- 2Department of Radiology and BRIC, University of North Carolina, Chapel Hill, NC, United States
- 3School of Psychology, South China Normal University, Guangzhou, China
- 4Department of Brain and Cognitive Engineering, Korea University, Seoul, South Korea
Recent advances in MRI have made it easier to collect data for studying human structural and functional connectivity networks. Computational methods can reveal complex spatiotemporal dynamics of the human developing brain. In this paper, we propose a Developmental Meta-network Decomposition (DMD) method to decompose a series of developmental networks into a set of Developmental Meta-networks (DMs), which reveal the underlying changes in connectivity over development. DMD circumvents the limitations of traditional static network decomposition methods by providing a novel exploratory approach to capture the spatiotemporal dynamics of developmental networks. We apply this method to structural correlation networks of cortical thickness across subjects at 3–20 years of age, and identify four DMs that smoothly evolve over three stages, i.e., 3–6, 7–12, and 13–20 years of age. We analyze and highlight the characteristic connections of each DM in relation to brain development.
1. Introduction
Understanding normal brain development is critical for basic developmental neuroscience. Recent advances in MRI have made it easier to collect data for studying human structural and functional connectivity networks. For example, the multi-site NIH MRI Study of Normal Brain Development has collected developmental structural MRI of over a thousand of children, ranging from infancy to young adulthood. The rich spatial and temporal information afforded in such datasets calls for sophisticated computational methods to capture the dynamic changes in brain connectivity during the course of development.
To date, most developmental studies are mainly focused on charting network characteristics, such as small-world properties, global efficiency, local efficiency, and etc. (Menon, 2013; Olde Dubbelink et al., 2013; Wu et al., 2013; Hadley et al., 2016). They treat the developmental networks as a group of static networks and compute their network characteristics independently. Alternatively, community detection algorithms are used to investigate the temporal evolution of modular organization (Mucha et al., 2009; Betzel and Bassett, 2017). The detected modules are recognized as sets of brain regions that perform specific cognitive functions.
To study temporal changes in brain connectivity, various matrix decomposition methods, especially principal component analysis (PCA), independent component analysis (ICA), and non-negative matrix factorization (NMF) have been applied to developmental structural and functional networks to identify the intrinsic components (Ghanbari et al., 2014; Sotiras et al., 2017) or connectivity states (Leonardi et al., 2013; Calhoun et al., 2014; Miller et al., 2016). Compared with other matrix decomposition methods, NMF is featured with its non-negativity constraint imposed on the elements of the decomposed factor matrices. This constraint leads to a parts-based representation (Lee and Seung, 1999), thus making the decomposition results more interpretable. During brain development, brain connectivity may evolve through different stages. Accordingly, the intrinsic connectivity components, which we refer to as meta-networks, may also develop across different stages. In this paper, we call such evolving intrinsic component as developmental meta-networks (DMs) and propose an approach for Developmental Meta-network Decomposition (DMD). DMD decomposes the developmental networks into a set of temporally smooth DMs that capture the underlying connectivity patterns across developmental stages to adapt to the cognitive development. DMD not only automatically identifies the developmental stages and the number of DMs, but also uncovers the evolution of DMs. In this study, we apply DMD to developmental networks constructed based on inter-regional cortical thickness correlation across subjects for age spanning 3–20 years.
2. Materials and Methods
2.1. Datasets and Construction of Blue Developmental Networks
This study uses the Pediatric MRI Data Repository1 released by the NIH MRI Study of Normal Brain Development (Evans, 2006), which is a multi-site developmental study with the objective to collect developmental data for investigating brain maturation in connection with behavioural and cognitive development in normal populations (Evans, 2006; Waber et al., 2007). We adopt 951 scans from 445 subjects of 3 to 20 years of age (Figure S1). The age in years are obtained by subtracting the date of birth from the date of visit. Each subject is scanned in two or more MRI sessions over a five-to-six-year period.
For each participant, a three-dimensional sagittal T1-weighted image was acquired using a 1.5 T scanner with 1 mm isotropic resolution. Each image was skull stripped to remove non-cerebral tissues (Smith, 2002), corrected for intensity inhomogeneity, and segmented into gray matter (GM), white matter (WM), and cerebrospinal fluid (CSF) (Zhang et al., 2001). FSL 4.3 were used to perform brain extraction (BET) and tissue segmentation (FAST). To ensure the image processing quality, we visually checked the brain extraction and segmentation results for each subjects less than 5 years old. Different parameters were tried until the segmentation result were acceptable. Inner and outer cortical surfaces were reconstructed by a deformable surface method (Li et al., 2012). With the automated anatomical labelling (AAL) template (Tzourio-Mazoyer et al., 2002), each cortical surface was parcellated into 78 regions of interest (ROIs) (see Table S1) based on a non-linear hybrid volumetric/surface registration method (Liu et al., 2004).
Cortical thickness was measured between the reconstructed inner and outer cortical surfaces using the shortest distance in the native space at each vertex (Liu et al., 2008). Regional cortical thickness was defined as the average thickness of all vertices within an ROI. We removed the effects of multiple confounding variables, including gender and overall mean cortical thickness, via linear regression analysis for each cortical region at each age (He et al., 2007). The regression residuals were taken as the corrected cortical thickness values.
The details of networks construction based on cortical thickness is described in Nie et al. (2013). An inter-regional cortical thickness correlation network was built for each time point by computing the pairwise Pearson's correlation coefficient of cortical properties across subjects. Take age 3 for example, there were 45 unique subjects, then each ROI was represented by a cortical thickness vector of length 45. By computing the Pearson's correlation coefficient between each pair of ROI vectors, we built a 78 × 78 inter-regional correlation network for age 3. We used the absolute values of the correlation matrices as in other studies (Khundrakpam et al., 2013). In the network matrix, a zero entry represents absence of connection, whereas a positive entry indicates the strength of pairwise inter-regional correlation. In this way, we obtained the developmental networks composed of eighteen 78 × 78 symmetric non-negative networks of 3–20 years of age (Figure S2).
2.2. Developmental Meta-Network Decomposition (DMD)
DMD method is composed of three parts (see Figure 1): (i) identifying the developmental stages of the developmental networks; (ii) decomposing the developmental networks into a set of DMs and their trajectories; (iii) characterization of the different types of connections in DMs, i.e., stable and rapidly-changing connections.
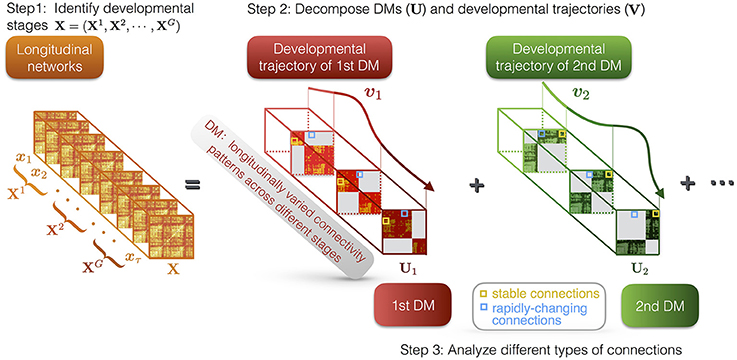
Figure 1. Illustration of DMD method. First, we identify G developmental stages of the longitudinal networks X, which are denoted as X1, X2, ⋯ , XG. Second, DMD decomposes the longitudinal networks into a set of DMs (U) and their developmental trajectories (V). For instance, U1 and U2 respectively represent the first and the second DM, while v1 and v2 represent their developmental trajectories. The DMs reveal the developmental connectivity patterns, while the developmental trajectories indicate the longitudinal contributions of the DMs. Each DM has different states at different stages. Third, we characterize different types of connections in DMs, i.e., stable and rapidly-changing connections.
2.2.1. Identifying Developmental Stages
The evolution of DMs is essentially caused by the change of developmental networks across different developmental stages. An ideal partition of developmental stages satifies that the networks in the same stage are close to each other, while the networks in different stages are significantly different from each other.
To achieve this aim, we use the method of consensus clustering (Ozdemir et al., 2015; Wu et al., 2015), which yields a stable and robust partition.
We run the sensitive k-means clustering algorithm on the vectorized developmental brain networks with different numbers of clusters. For each number of clusters, we record the clustering results for 100 runs with randomized seeds, and use the criterion of dispersion coefficient to evaluate the consistency of the clustering results (Brunet et al., 2004). The larger the dispersion coefficient, the more consistent the clustering results. The optimal partition of developmental stages is the one that leads to the largest dispersion coefficient in the finest granularity. In another word, if there are multiple partitions leading to the same highest dispersion coefficient, we prefer the one that reveals the most detailed developmental stages of the age-related networks.
2.2.2. Developmental Meta-Network Decomposition
Let X = [x1 x2 ⋯ xτ] be the developmental non-negative networks, where represents the vectorized network at the ith time point, M is the number of connections in each network (i.e., 78 × 77/2 in this study due to the symmetry of network), τ is the number of time points. Assume that the τ developmental networks consist of G developmental stages, let (∀t ∈ [1, G]) denote the tth developmental stage, then X can be reorganized as X = [X1 X2 ⋯ XG]. Our aim is to decompose a set of DMs (denoted as U) and their developmental trajectories (denoted as V) from X. Note that we allow each DM to evolve across different stages, instead of remaining unchanged through development.
We start from considering the decomposition of a single developmental stage Xt. It is an observation of the tth developmental stage that consists of two parts. One is the true developmental networks of the tth stage (), the other is the noise introduced during image acquisition, preprocessing and etc. To reduce the impact of noise, we perform decomposition on instead of observed Xt. We assume that can be represented as a linear combination of p DMs at the tth stage (Ut), whose contributions are indicated by their trajectories (Vt), i.e., . The combined objective function of true data recovery and DM decomposition is given in Equation (1).
The first term in Equation (1) minimizes the difference between and Xt, the second term penalizes the nuclear norm of , which implies the number of DMs. The orthogonal constraint UtT Ut = I avoids finding overlapped connectivity patterns. Besides, the non-negativity constraints on Ut and Vt facilitate their neurobiological interpretation as DMs and developmental trajectories. To simplify the formulation, we replace with the product of Ut and VtT in Equation (1) and have the following objective function.
Next, we take all the developmental stages into consideration. According to existing neural network models, nervous systems can change smoothly by slowly changing connectivity patterns and strength (Enquist and Ghirlanda, 2005). Inspired by that, we define the overall objective function as the sum of all the single-stage objective function plus a cross-stage smoothness regularization term .
where
In Equation (4), the first term of measures the temporal smoothness of U across different states, where WU(k, l) indicates the adjacency between the kth and lth developmental stages. The second term of measures the temporal smoothness of V across different time points, where WV(i, j) measures the adjacency between the ith and jth time points.
Since it has been proved that minimizing the nuclear norm of the product of two non-negative matrices is equivalent to minimizing half of their squared Frobenius norm (Srebro and Shraibman, 2005), we can replace the nuclear norm in Equation (3) with . Besides, notice that and , we can rewrite the objective function in the following form.
Therefore, we obtain the multiplicative updating rules for Ut and V as follows.
where is the mask matrix of Vt satisfying Vt =HtT V, eij is a 0/1 vector with the only positive element at the ij-th index, DV is the degree matrix of WV, ⊙ and the bar respectively denote element-wise product and division. The convergence proof of the multiplicative updating rules can be referred to that of non-negative matrix decomposition (Lee and Seung, 1999). To avoid local minimum, we adopt an initialization strategy on U and V similar to that of k-means algorithm, i.e., repeating multiple (100) times with random initializations and choosing the one with the least cost. The empirical convergence of DMD method is shown on Figure S3. The method is robust to a wide range of the regularization parameters (Figure S4).
The number of DMs is determined by maximizing Minimal Trajectory Distance (MTD), which computes the minimal distance between pairwise developmental trajectories. The larger MTD, The more separable the developmental trajectories, the more distinct and biologically significant the corresponding DMs.
2.2.3. Characterizing Different Types of Connections in DMs
On the basis of developmental meta-network decomposition, we characterize two types of connections in DMs, i.e., stable connections and rapidly-changing connections, for analysis.
The stable connections constitute the “bones” of DMs that keep unchanged through development, while their contributions in the developmental networks are indicated by the developmental trajectories. We select the stable connections with the least normalized divergence (e.g., top 2%) for each DM, and exclude those insignificant connections with average strength () less than a threshold (δr). Take the rth DM (denoted as Ur) for example,
Ω(Ur) in Equation (8) computes the normalized divergence of the connections in the the rth DM, where represents the tth state of Ur. The threshold δr is adaptively determined by the quadratic mean (or root mean square value) of Ur, where GM is the number of connections in Ur.
The rapidly-changing connections highlight the most important changes in the inter-regional coordination during brain development. We characterize this type of connections by taking into account of both DMs and their developmental trajectories. For each DM, we select the most significantly increased and decreased connections across adjacent stages by computing . Meanwhile, we calculate the stage contributions of each DM by averaging its within-stage trajectory, i.e., . The rapidly-changing connections are the ones with the same direction of change (↑ or ↓) in both DMs () and their stage contributions across adjacent stages (), thus indicating the changes in the developmental networks.
2.2.4. Reproducibility
To evaluate the reproducibility of DMD method, we use a split-half strategy, i.e., dividing the developmental networks into two halves with odd-numbered ages (3, 5, ⋯ , 19) and even-numbered ages (4, 6, ⋯ , 20). The reproducibility is quantified by computing similarity between the corresponding DMs (or developmental trajectories), which are independently decomposed from the two splits and matched using the Hungarian algorithm (Kuhn, 2005). We use the cosine similarity to measure the similarity between the matched DMs (or trajectories), as did in Lange et al. (2004). Since the two splits of developmental networks have a temporal gap of one year, cosine similarity is especially advantageous in the evaluation of trajectory reproducibility, because it is a judgment of orientation instead of magnitude.
3. Results
We apply DMD method to the developmental structural correlation networks and obtain four DMs, which evolve across three identified developmental stages, including ages 3–6, 7–12, and 13–20, respectively (Figure S5). For the identification of developmental stages and the DM number, please refer to the subsection Parameter Influence.
3.1. Stable and Rapidly-Changing Connections of DMs
We extract the stable connections of the four DMs (Figure 2A), whose contributions in the development are indicated by the developmental trajectories (Figure 2B). In the first DM, the stable connections exhibit an indirect connection pattern, which looks like “<>,” between the prefrontal and occipital areas through interlaying temporal regions. The trajectory of the first DM shows that the indirect connection pattern decreases quickly at first but then slows down after the age of 13. In comparison, the stable connections of the second and third DMs are characterized with the long direct connections between the prefrontal and occipital areas. The trajectories of these direct connections, after going through ups and downs, reach higher values at the age of 20 than at the age of 3 years. Combined together, they indicate the gradual replacement of the indirect connection pattern by the direct connection pattern from age 3 to 20 years. This is consistent with the development of functional network architecture, where regional interactions change from being predominantly anatomically local in children to interactions spanning longer cortical distances in young adults (Vogel et al., 2010). Besides, the stable connections of the fourth DM are composed of short-range connections and homologous connections between homotopic regions. Similar connections were also found as the most common and robust connections among different individuals (Hermundstad et al., 2013).
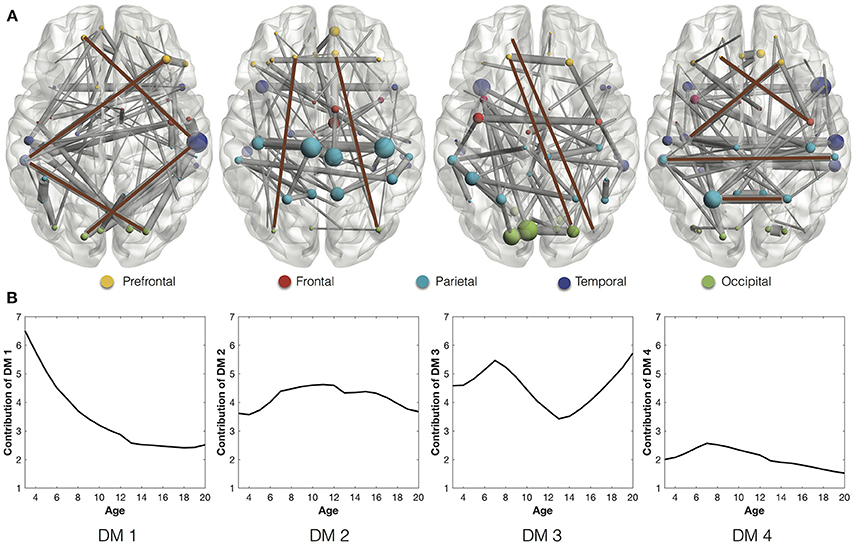
Figure 2. (A) Stable connections of the four DMs through development. The brown lines highlight the representative connections. Different ROIs are rendered with different colors according to their anatomical locations (Wang et al., 2007): prefrontal, frontal, parietal, temporal, and occipital. (B) The developmental trajectories of the four DMs. They reflect the contributions of the stable connections in the longitudinal networks.
On the other side, we study the rapidly-changing connections of DMs. Since the fourth DM is the most stable one with almost negligible change of connection strength (Figure 3A), we will focus on the rapidly-changing connections of the other three DMs. During the transition from the first developmental stage (ages 3–6) to the second (ages 7–12), the first DM shows both significantly decreased connection strength and stage contribution (Figures 3A,B). Its rapidly-weakened connections indicate the decrease of the frontal part of the indirect connection pattern (<>) between the prefrontal and temporal regions (Figure 3C). Meanwhile, the second DM shows both significantly increased connection strength and stage contribution. Its rapidly-enhanced connections highlight three hubs, ACG.R (right anterior cingulate gyrus) and bilateral MCG (middle cingulate gyrus). Since those regions are involved in emotion formation and processing (Bush et al., 2000; Hadland et al., 2003), their enhanced connections may indicate the emotional development after 7 years old. In fact, 7 years of age is indeed the critical time point when impulses of primitive emotion are subjugated to reason and internalized social control (Cole et al., 1994; Pierre Philippot, 2013).
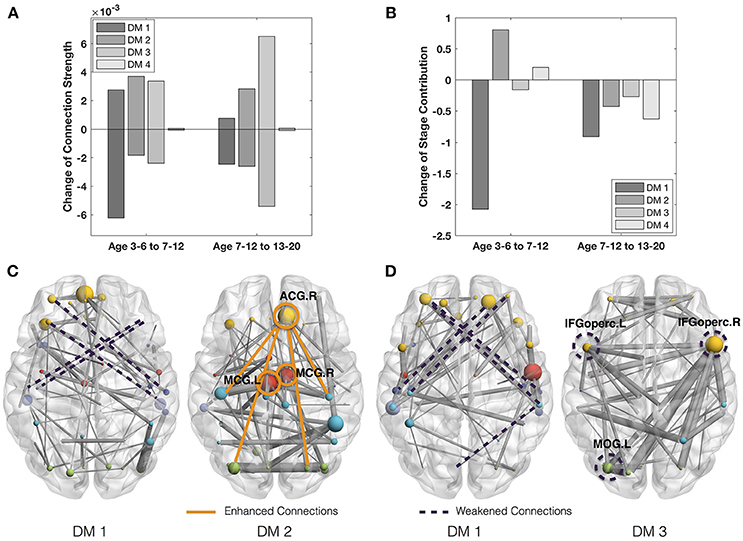
Figure 3. (A) Mean strength of the increase and decrease of the connection strength in the four DMs across adjacent states. (B) Change of the stage contributions by the four DMs across adjacent states. (C) Rapidly-changing connections from ages 3–6 to 7–12. (D) Rapidly-changing connections of DMs from ages 7–12 to 13–20.
In the transition from the second developmental stage (ages 7–12) to the third (ages 13–20), the first DM is still featured with decreased connection strength and decreased stage contribution (Figure 3D). Its rapidly-weakened connections demonstrate the continued decrease of the frontal part of the indirect connection pattern between the prefrontal and temporal regions. Meanwhile, the third DM shows the most significantly decreased connection strength and moderately decreased stage contribution. Its rapidly-weakened connections highlight three inter-connected hubs, including bilateral IFGoperc (opercular inferior frontal gyri) and MOG.L (left middle occipital gyrus). Since IFGoperc.L play a role in processing word phonology (Shaywitz et al., 1995) and IFGoperc.R is involved in visual and auditory spelling tasks (Booth et al., 2003), their weakened connections may indicate the decline of language development since 13 years old. This finding is consistent with Lenneberg's classic hypothesis about the age limitation (12–13 years) in the first language acquisition (Lenneberg, 1967) as well as Collier's studies that the first language acquisition is largely completed by the age of 12 (Collier, 1987, 1989).
To summarize, we have three major findings from the characteristic connections of DMs, which are validated in Figure S6.
1. The indirect connections between the prefrontal and occipital regions gradually, to some extent, get replaced by the direct connections from 3 to 20 years of age.
2. The connections with the emotion-related regions (ACG.R and bilateral MCG) are significantly increased from 6 to 12 years of age.
3. The connections with the language-related regions (IFGoperc.L and IFGoperc.R) are significantly decreased from 13 to 20 years of age.
3.2. Parameter Influence
We first study the influence of stage number on the quality of the developmental stage partition (Figure 4). With the increase of stage number (G), the developmental stage partition at first keeps very robust in consensus clustering, but then exhibits growing instability when G becomes larger than 3. Therefore, in this study we choose the most robust developmental stage partition in the finest granularity, i.e., three stages including 3–6, 7–12, and 13–20 years of age. Note that although we do not utilize any temporal information, the developmental stage partitions still group the networks at adjacent time points together, indicating the smooth change of the developmental networks.
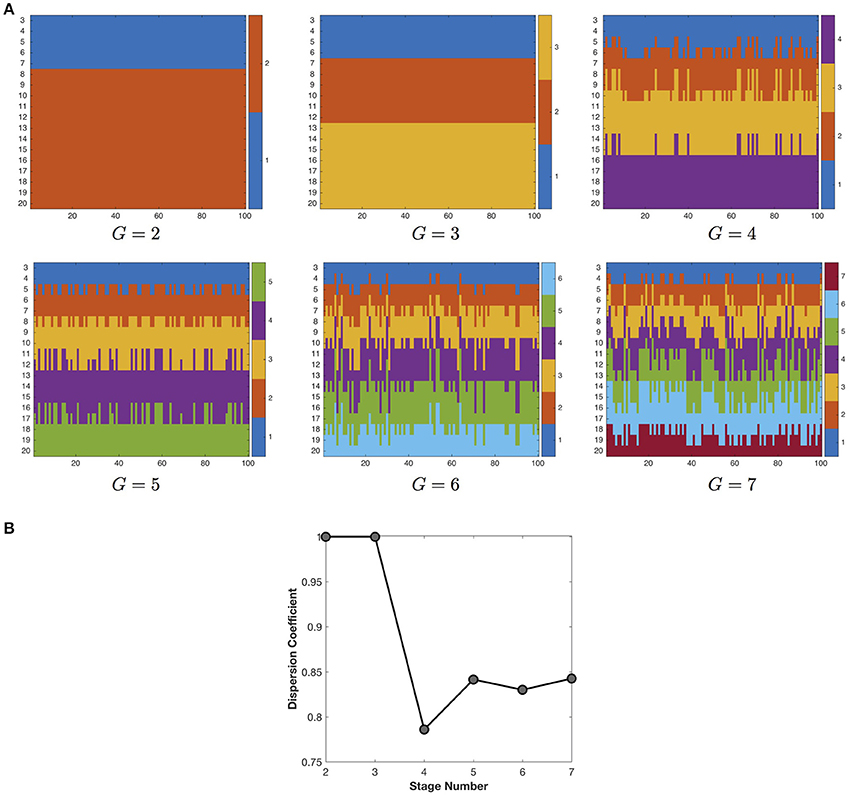
Figure 4. (A) The partition of developmental stages under different settings of stage number. Due to the space limit, we only show the partition results for 2–7 developmental stages. The X axis represents the 100 runs of k-means clustering algorithm, the Y axis represents the longitudinal networks at 3–20 years of age. The different colors indicate different stage assignment. (B) The influence of stage number on the quality (dispersion coefficient) of the developmental stage partition. The maximal dispersion coefficient 1 indicates the most robust partition of developmental stages.
Next we show the influence of the DM number on the separability of developmental trajectories (Figure 5). With the increase of the DM number, MTD at first gradually increases because more and more distinct DMs are separated from the average pattern (underfitting). When the DM number grows larger than four, MTD sharply drops off, then rises to a local maximum at seven DMs, which might indicate the existence of DM sub-patterns. After that, MTD continues to decline and finally reaches a very low value, because more and more insignificant DMs are separated from the dominant ones (overfitting). Therefore, in this study we choose four DMs that leads to the most distinct DMs with the most separable developmental trajectories.
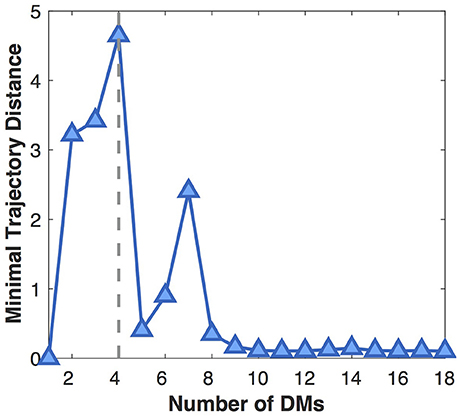
Figure 5. Influence of the DM number on the separability of developmental trajectories (MTD). The larger the MTD value, the more separable the developmental trajectories.
3.3. DMD Reproducibility
We also examine the reproducibility of DMs and their developmental trajectories under different settings of DM number (Figure 6). The reproducibility of DMs reaches maximum at the DM number of four (Figure 6A), while the reproducibility of developmental trajectories get slightly decreased with the increase of the DM number (Figure 6B). Therefore, in this study it is a reasonable choice to set the DM number as four.
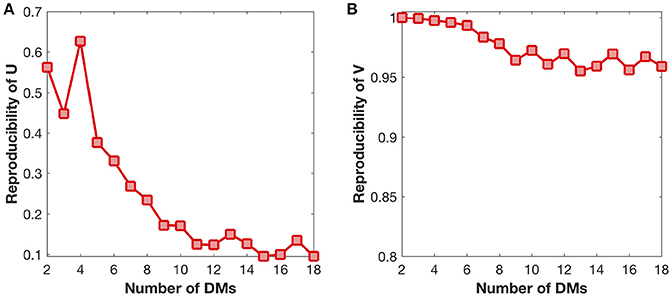
Figure 6. Reproducibility of DMs (U) and developmental trajectories (V) under different settings of DM number. (A) Reproducibility of DMs with the growth of DM number. (B) Reproducibility of developmental trajectories with the growth of DM number.
4. Discussion
We propose the DMD method to decompose developmental networks into a set of DMs and their developmental trajectories. One important advantage of our approach is that it goes beyond current static network decomposition strategies to capture dynamic temporal patterns of developmental networks. Moreover, it automatically identifies the partition of developmental stages as well as the number of DMs. Our analysis of normal developmental brain networks shows that the decomposed DMs contain not only stable connections but also rapidly-changing connections. Capturing variability in the connectivity patterns via DMs moves us closer to the clinic of the future.
DMD helps to find significant underlying changes in connectivity over development. For instance, the rapidly-changing connections of DMs reveal that (1) the connections with the emotion-related regions (ACG.R and bilateral MCG) are significantly increased after 7 years of age, and (2) the connections with the language-related regions (bilateral IFGoperc) are significantly decreased after 13 years of age. These findings are consistent with the existing behavioral studies that emotion control gets enhanced at the age of 7 years (Cole et al., 1994; Pierre Philippot, 2013) and the first language acquisition is largely completed by the age of 12 years (Lenneberg, 1967; Collier, 1987, 1989). Compared with previous studies, DMD provides more connectome details for the development neuroscience community.
DMD has many other applications. In the clinical domain, DMs allow in-depth comparison between normal and abnormal developmental networks, which are usually related to a certain type of disease. We can apply the normal DMs, which are decomposed from the normal developmental networks, to the abnormal developmental networks and obtain its abnormal developmental trajectories. By comparing the normal and abnormal developmental trajectories under the same DMs, we are able to identify when and how the abnormal trajectories deviate from the normal ones, thus providing insights into the underlying mechanism of the disease. For example, in this study the first three DMs show that the indirect connections between the prefrontal and occipital areas gradually get replaced by the direct connections with the growth of age. This indicates the increase of functional efficiency in the normal brain development (Achard and Bullmore, 2007; Vogel et al., 2010; Bullmore and Sporns, 2012), because direct neural connections are generally believed to use less time for signal transmission than the polysynaptic connections (Grossenbacher, 2001). Hence, if the abnormal trajectories of the first three DMs exhibit different trends from the normal ones, it implies the correlation between the disease and the functional efficiency development.
5. Limitations and Future Work
The current DMD method can only be applied to cross-sessional developmental networks, hence fail to fully utilize the longitudinal information of subjects. In our future work, we plan to extend the DMD method for early diagnosis of developmental disease of single subjects. This requires the application of DMD to within-subject, instead of across-subject, longitudinal networks. Although the data are progressively easier to collect based on Diffusion Tensor Imaging (DTI) or Functional MRI (fMRI), the main challenge lies in that different sets of DMs will be derived from different within-subject longitudinal networks. Therefore, it is necessary to extend DMD to decompose a representative set of DMs from multiple within-subject longitudinal networks. Then the representative set of DMs can be applied to single subjects for early disease diagnosis. We believe that DMD method will ultimately pave the way to much more refined representation and understanding of brain network development, diseases, and other longitudinal biological phenomena.
Ethics Statement
This study was carried out in accordance with the recommendations of Name of Guidelines, Name of Committee with written informed consent from all subjects. All subjects gave written informed consent in accordance with the Declaration of Helsinki. The protocol was approved by the Name of Committee.
Author Contributions
PH contributed to designing and analyzing the experiments, summarizing and visualizing the results, and writing the manuscript. XX contributed to developing and implementing the method, visualizing and analyzing the results. HZ, GL, and P-TY contributed to the critical revision of the manuscript and the discussion of the work. JN contributed to preparing the data and revising the manuscript. DS contributed to directing the whole project.
Funding
This work was supported in part by the Chinese National Natural Science Foundation under Grant Nos. 61402395, 61502412, 61379066, and 61300151, Natural Science Foundation of Jiangsu Province under contracts BK20151314, BK20140492, and BK20150459, Jiangsu Overseas Research and Training Program for University Prominent Young and Middle-aged Teachers and Presidents, Jiangsu Government Scholarship for Overseas Studies. This work was also supported in part by National Institutes of Health grant MH100217, MH107815, MH108914.
Conflict of Interest Statement
The authors declare that the research was conducted in the absence of any commercial or financial relationships that could be construed as a potential conflict of interest.
Acknowledgments
Data used in the preparation of this article were obtained from the Pediatric MRI Data Repository created by the NIH MRI Study of Normal Brain Development. This is a multi-site, longitudinal study of typically developing children, from ages newborn through young adulthood, conducted by the Brain Development Cooperative Group and supported by the National Institute of Child Health and Human Development, the National Institute on Drug Abuse, the National Institute of Mental Health, and the National Institute of Neurological Disorders and Stroke (Contract #s N01-HD02-3343, N01-MH9-0002, and N01-NS-9-2314, -2315, -2316, -2317, -2319, and -2320). A listing of the participating sites and a complete listing of the study investigators can be found at http://www.bic.mni.mcgill.ca/nihpd/info/participating_centers.html. This manuscript reflects the views of the authors and may not reflect the opinions or views of the NIH.
Supplementary Material
The Supplementary Material for this article can be found online at: https://www.frontiersin.org/articles/10.3389/fninf.2018.00048/full#supplementary-material
Footnotes
References
Achard, S., and Bullmore, E. (2007). Efficiency and cost of economical brain functional networks. PLoS Comput. Biol. 3:e17. doi: 10.1371/journal.pcbi.0030017
Betzel, R. F., and Bassett, D. S. (2017). Multi-scale brain networks. Neuroimage 160, 73–83. doi: 10.1016/j.neuroimage.2016.11.006
Booth, J. R., Burman, D. D., Meyer, J. R., Gitelman, D. R., Parrish, T. B., and Mesulam, M. M. (2003). Relation between brain activation and lexical performance. Hum. Brain Mapp. 19, 155–169. doi: 10.1002/hbm.10111
Brunet, J. P., Tamayo, P., Golub, T. R., and Mesirov, J. P. (2004). Metagenes and molecular pattern discovery using matrix factorization. Proc. Natl. Acad. Sci. U.S.A. 101, 4164–4169. doi: 10.1073/pnas.0308531101
Bullmore, E., and Sporns, O. (2012). The economy of brain network organization. Nat. Rev. Neurosci. 13, 336–349. doi: 10.1038/nrn3214
Bush, G., Luu, P., and Posner, M. I. (2000). Cognitive and emotional influences in anterior cingulate cortex. Trends Cogn. Sci. 4, 215–222. doi: 10.1016/S1364-6613(00)01483-2
Calhoun, V. D., Miller, R., Pearlson, G., and Adal1, T. (2014). The chronnectome: time-varying connectivity networks as the next frontier in fmri data discovery. Neuron 84, 262–274. doi: 10.1016/j.neuron.2014.10.015
Cole, P. M., Michel, M. K., and Teti, L. O. (1994). The development of emotion regulation and dysregulation: a clinical perspective. Monogr. Soc. Res. Child Dev. 59, 73–100. doi: 10.2307/1166139
Collier, V. P. (1987). The effect of age on acquisition of a second language for school. Acad. Achiev. 3:8.
Collier, V. P. (1989). How long? A synthesis of research on academic achievement in a second language. Tesol Q. 23, 509–531. doi: 10.2307/3586923
Enquist, M., and Ghirlanda, S. (2005). Neural Networks and Animal Behavior. Princeton, NJ: Princeton University Press.
Evans, A. (2006). The NIH MRI study of normal brain development. Neuroimage 30, 184–202. doi: 10.1016/j.neuroimage.2005.09.068
Ghanbari, Y., Smith, A. R., Schultz, R. T., and Verma, R. (2014). Identifying group discriminative and age regressive sub-networks from DTI-based connectivity via a unified framework of non-negative matrix factorization and graph embedding. Med. Image Anal. 18, 1337–1348. doi: 10.1016/j.media.2014.06.006
Grossenbacher, P. G. (2001). Finding Consciousness in the Brain. Amsterdam: John Benjamins Publishing Company.
Hadland, K. A., Rushworth, M. F. S., Gaffan, D., and Passingham, R. E. (2003). The effect of cingulate lesions on social behaviour and emotion. Neuropsychologia 41, 919–931. doi: 10.1016/S0028-3932(02)00325-1
Hadley, J. A., Kraguljac, N. V., White, D. M., Ver Hoef, L., Tabora, J., and Lahti, A. C. (2016). Change in brain network topology as a function of treatment response in schizophrenia: a longitudinal resting-state fMRI study using graph theory. NPJ Schizophrenia 2:16014. doi: 10.1038/npjschz.2016.14
He, Y., Chen, Z. J., and Evans, A. C. (2007). Small-world anatomical networks in the human brain revealed by cortical thickness from MRI. Cereb. Cortex 17, 2407–2419. doi: 10.1093/cercor/bhl149
Hermundstad, A. M., Bassett, D. S., Brown, K. S., Aminoff, E. M., Clewett, D., Freeman, S., et al. (2013). Structural foundations of resting-state and task-based functional connectivity in the human brain. Proc. Natl. Acad. Sci. U.S.A. 110, 6169–6174. doi: 10.1073/pnas.1219562110
Khundrakpam, B. S., Reid, A., Brauer, J., Carbonell, F., Lewis, J., Ameis, S., et al. (2013). Developmental changes in organization of structural brain networks. Cereb. Cortex 23, 2072–2085. doi: 10.1093/cercor/bhs187
Kuhn, H. W. (2005). The hungarian method for the assignment problem. Naval Res. Logist. 52, 7–21. doi: 10.1002/nav.20053
Lange, T., Roth, V., Braun, M. L., and Buhmann, J. M. (2004). Stability-based validation of clustering solutions. Neural Comput. 16, 1299–1323. doi: 10.1162/089976604773717621
Lee, D., and Seung, H. (1999). Learning the parts of objects by non-negative matrix factorization. Nature 401, 788–791. doi: 10.1038/44565
Leonardi, N., Richiardi, J., Gschwind, M., Simioni, S., Annoni, J. M., Schluep, M., et al. (2013). Principal components of functional connectivity: a new approach to study dynamic brain connectivity during rest. Neuroimage 83, 937–950. doi: 10.1016/j.neuroimage.2013.07.019.
Li, G., Nie, J., and Shen, D. (2012). Consistent reconstruction of cortical surfaces from longitudinal brain MR images. Neuroimage 59, 3805–3820. doi: 10.1016/j.neuroimage.2011.11.012
Liu, T., Nie, J., Tarokh, A., Guo, L., and Wong, S. T. (2008). Reconstruction of central cortical surface from brain MRI images: method and application. Neuroimage 40, 991–1002. doi: 10.1016/j.neuroimage.2007.12.027
Liu, T., Shen, D., and Davatzikos, C. (2004). Deformable registration of cortical structures via hybrid volumetric and surface warping. Neuroimage 22, 1790–1801. doi: 10.1016/j.neuroimage.2004.04.020
Menon, V. (2013). Developmental pathways to functional brain networks: emerging principles. Trends Cogn. Sci. 17, 627–640. doi: 10.1016/j.tics.2013.09.015
Miller, R. L., Yaesoubi, M., Turner, J. A., Mathalon, D., Preda, A., Pearlson, G., et al. (2016). Higher dimensional meta-state analysis reveals reduced resting fmri connectivity dynamism in schizophrenia patients. PLoS ONE 11:e0149849. doi: 10.1371/journal.pone.0149849
Mucha, P. J., Richardson, T., Macon, K., Porter, M. A., and Onnela, J. P. (2009). Community structure in time-dependent, multiscale, and multiplex networks. Science 328, 876–878. doi: 10.1126/science.1184819
Nie, J., Li, G., and Shen, D. (2013). Development of cortical anatomical properties from early childhood to early adulthood. Neuroimage 76, 216–224. doi: 10.1016/j.neuroimage.2013.03.021
Olde Dubbelink, K. T., Hillebrand, A., Stoffers, D., Deijen, J. B., Twisk, J. W., Stam, C. J., et al. (2013). Disrupted brain network topology in Parkinson's disease: a longitudinal magnetoencephalography study. Brain 137, 197–207. doi: 10.1093/brain/awt316
Ozdemir, A., Bolaños, M., Bernat, E., and Aviyente, S. (2015). Hierarchical spectral consensus clustering for group analysis of functional brain networks. IEEE Trans. Biomed. Eng. 62, 2158–2169. doi: 10.1109/TBME.2015.2415733
Shaywitz, B. A., Shaywltz, S. E., Pugh, K. R., Constable, R. T., Skudlarski, P., Fulbright, R. K., et al. (1995). Sex differences in the functional organization of the brain for language. Nature 373, 607–609. doi: 10.1038/373607a0
Smith, S. M. (2002). Fast robust automated brain extraction. Hum Brain Mapp. 17, 143–155. doi: 10.1002/hbm.10062
Sotiras, A., Toledo, J. B., Gur, R. E., Gur, R. C., Satterthwaite, T. D., and Davatzikos, C. (2017). Patterns of coordinated cortical remodeling during adolescence and their associations with functional specialization and evolutionary expansion. Proc. Natl. Acad. Sci. U.S.A. 114, 3527–3532. doi: 10.1073/pnas.1620928114
Srebro, N., and Shraibman, A. (2005). “Rank, trace-norm and max-norm,” in Conference on Learning Theory (Bertinoro: Springer), 545–560. doi: 10.1007/11503415_37
Tzourio-Mazoyer, N., Landeau, B., Papathanassiou, D., Crivello, F., Etard, O., Delcroix, N., et al. (2002). Automated anatomical labeling of activations in spm using a macroscopic anatomical parcellation of the MNI MRI single-subject brain. Neuroimage 15, 273–289. doi: 10.1006/nimg.2001.0978
Vogel, A. C., Power, J. D., Petersen, S. E., and Schlaggar, B. L. (2010). Development of the brain's functional network architecture. Neuropsychol. Rev. 20, 362–375. doi: 10.1007/s11065-010-9145-7
Waber, D. P., De Moor, C., Forbes, P. W., Almli, C. R., Botteron, K. N., Leonard, G., et al. (2007). The NIH MRI study of normal brain development: performance of a population based sample of healthy children aged 6 to 18 years on a neuropsychological battery. J. Int. Neuropsychol. Soc. Image 13, 729–746. doi: 10.1017/S1355617707070841
Wang, K., Liang, M., Wang, L., Tian, L., Zhang, X., Li, K., et al. (2007). Altered functional connectivity in early Alzheimer's disease: a resting-state fMRI study. Hum. Brain Mapp. 28, 967–978. doi: 10.1002/hbm.20324
Wu, J., Liu, H., Xiong, H., Cao, J., and Chen, J. (2015). K-means-based consensus clustering: a unified view. IEEE Trans. Knowledge Data Eng. 27, 155–169. doi: 10.1109/TKDE.2014.2316512
Wu, K., Taki, Y., Sato, K., Qi, H., Kawashima, R., and Fukuda, H. (2013). A longitudinal study of structural brain network changes with normal aging. Front. Hum. Neurosci. 7:113. doi: 10.3389/fnhum.2013.00113
Keywords: structural correlation networks, developmental networks, cortical thickness, developmental meta-network decomposition, non-negative matrix factorization
Citation: He P, Xu X, Zhang H, Li G, Nie J, Yap P-T and Shen D (2018) Spatiotemporal Analysis of Developing Brain Networks. Front. Neuroinform. 12:48. doi: 10.3389/fninf.2018.00048
Received: 18 April 2018; Accepted: 10 July 2018;
Published: 31 July 2018.
Edited by:
Arjen van Ooyen, VU University Amsterdam, NetherlandsReviewed by:
Vince D. Calhoun, University of New Mexico, United StatesBudhachandra Singh Khundrakpam, McGill University, Canada
Copyright © 2018 He, Xu, Zhang, Li, Nie, Yap and Shen. This is an open-access article distributed under the terms of the Creative Commons Attribution License (CC BY). The use, distribution or reproduction in other forums is permitted, provided the original author(s) and the copyright owner(s) are credited and that the original publication in this journal is cited, in accordance with accepted academic practice. No use, distribution or reproduction is permitted which does not comply with these terms.
*Correspondence: Xiaohua Xu, YXJ0ZXJ4QGdtYWlsLmNvbQ==
Dinggang Shen, ZGluZ2dhbmdfc2hlbkBtZWQudW5jLmVkdQ==
†These authors have contributed equally to this work.