 Niels Schwaderlapp
 Enya Paschen3
 Pierre LeVan
 Dominik von Elverfeldt
 Carola A. Haas
- 1Division of Medical Physics, Department of Diagnostic and Interventional Radiology, Faculty of Medicine, University Medical Center Freiburg, University of Freiburg, Freiburg im Breisgau, Germany
- 2BrainLinks-BrainTools Center, University of Freiburg, Freiburg im Breisgau, Germany
- 3Experimental Epilepsy Research, Department of Neurosurgery, Faculty of Medicine, Medical Center - University of Freiburg, University of Freiburg, Freiburg im Breisgau, Germany
- 4Department of Radiology and Paediatrics, Cumming School of Medicine, Hotchkiss Brain Institute, University of Calgary, Calgary, AB, Canada
Electrical neurostimulation is currently used to manage epilepsy, but the most effective approach for minimizing seizure occurrence is uncertain. While functional MRI (fMRI) can reveal which brain areas are affected by stimulation, simultaneous deep brain stimulation (DBS)-fMRI examinations in patients are rare and the possibility to investigate multiple stimulation protocols is limited. In this study, we utilized the intrahippocampal kainate mouse model of mesial temporal lobe epilepsy (mTLE) to systematically examine the brain-wide responses to electrical stimulation using fMRI. We compared fMRI responses of saline-injected controls and epileptic mice during stimulation in the septal hippocampus (HC) at 10 Hz and demonstrated the effects of different stimulation amplitudes (80–230 μA) and frequencies (1–100 Hz) in epileptic mice. Motivated by recent studies exploring 1 Hz stimulation to prevent epileptic seizures, we furthermore investigated the effect of prolonged 1 Hz stimulation with fMRI. Compared to sham controls, epileptic mice showed less propagation to the contralateral HC, but significantly stronger responses in the ipsilateral HC and a wider spread to the entorhinal cortex and septal region. Varying the stimulation amplitude had little effect on the resulting activation patterns, whereas the stimulation frequency represented the key parameter and determined whether the induced activation remained local or spread from the hippocampal formation into cortical areas. Prolonged stimulation of epileptic mice at 1 Hz caused a slight reduction in local excitability. In this way, our study contributes to a better understanding of these stimulation paradigms.
1 Introduction
Deep brain stimulation (DBS) is increasingly used for the treatment of intractable epilepsy (Fisher and Velasco, 2014; Foutz and Wong, 2022; Velasco et al., 2022). Mesial temporal lobe epilepsy (mTLE) in particular, the most common form of focal epilepsy in adults, is often refractory to anti-seizure medication. In these cases, surgical resection of the seizure focus is often performed to attain seizure freedom, but there is no guarantee that surgery will result in a positive long-term outcome (Wiebe et al., 2001; Immonen et al., 2010; Hemb et al., 2013; Mohan et al., 2018). DBS may represent an alternative treatment and can be beneficial in epilepsy via two mechanisms: First, high-frequency stimulation (HFS) initiated at the onset of an epileptic seizure could desynchronize neuronal activity and thus terminate the seizure or at least prevent further propagation (Yu et al., 2018). Second, low-frequency stimulation (LFS) could lead to a reduction of neuronal excitability and thus reduce the probability of seizure occurrence (Lim et al., 2016; Paschen et al., 2020; Koubeissi et al., 2022). While there is promising evidence that stimulation has a positive therapeutic effect, it does not always achieve complete seizure freedom (Boon et al., 2007; Klinger and Mittal, 2018; Li and Cook, 2018). A current challenge is to better investigate the effects of stimulation in order to increase effectiveness and minimize side effects.
The outcome of stimulation is largely influenced by the stimulation site and the exact stimulation parameters. In mTLE, the hippocampus (HC) is frequently identified as the presumed site of seizure onset in many patients, making it a prominent target for intervention (Tellez-Zenteno et al., 2006; Velasco et al., 2007; Cukiert et al., 2014, 2017; Lim et al., 2016). Initial stimulation parameters are selected based on experience. If the response is sub-optimal or side effects occur, parameters such as amplitude or frequency are adjusted to individual patients on a trial-and-error basis (Simpson et al., 2022). This time-consuming process is complicated by the fact that it is usually unknown which brain regions and networks are affected by the stimulation. In addition, it is difficult to identify and adapt to long-term changes over time (Kokkinos et al., 2019; Khambhati et al., 2021).
A valuable method for directly assessing the brain-wide responses to stimulation is functional MRI (fMRI), which has been performed concurrently with DBS in recent studies (Jones et al., 2014; Thompson et al., 2020; Middlebrooks et al., 2021; Loh et al., 2022). However, due to the difficulty of performing DBS and fMRI simultaneously, published reports from epilepsy patients are scarce. For example, stimulation in the anterior nucleus of the thalamus showed a more widespread activation at 145 Hz than at 30 Hz stimulation (Middlebrooks et al., 2021). In another study, similar activation patterns were observed with high (8 mA) and low (4 mA) currents at 20 Hz stimulation, whereas no significant fMRI response was found in patients with 1 Hz stimulation (Jones et al., 2014). Further studies are needed to better understand the influence of stimulation parameters.
This investigation can be accelerated by preclinical DBS-fMRI studies. Studies targeting the perforant path or the HC showed fMRI activations within the hippocampal structure and in additional areas, e.g., thalamus and septum, at stimulation frequencies of 10–130 Hz, but no fMRI response at 2 Hz electrical stimulation (Angenstein et al., 2007; Canals et al., 2008; Berge et al., 2015). However, these studies were performed in healthy rodents. Since severe structural alterations in the sclerotic HC have been found in rodent models of mTLE (Häussler et al., 2016; Janz et al., 2017a) and human mTLE (Thom et al., 2002; Freiman et al., 2021), it remains unclear to what extent these results, in particular the frequency dependency and the spread of activation from the HC to connected areas, reflect the situation in mTLE.
The alterations of the HC that occur in the human disease are replicated particularly well in the intrahippocampal kainate (ihKA) mouse model of mTLE, including the onset of spontaneous recurrent seizures and robust unilateral hippocampal sclerosis following status epilepticus (Bouilleret et al., 1999; Riban et al., 2002; Häussler et al., 2012). Hippocampal sclerosis in mTLE patients is characterized by neuronal cell loss and reactive gliosis and is often associated with granule cell dispersion and mossy fiber sprouting (Blümcke et al., 2013; Thom, 2014). Similarly, ihKA-treated mice show an extensively loss of pyramidal neurons in CA1/CA3 regions and interneurons throughout the sclerotic hippocampus, and preservation of dentate granule cells with their entorhinal inputs, and CA2 pyramidal cells (Häussler et al., 2012, 2016; Marx et al., 2013; Janz et al., 2018). As in mTLE patients, the sclerotic hippocampus is thought to be the focus of epileptic activity in ihKA mice (Pallud et al., 2011; Krook-Magnuson et al., 2013, 2015). Results obtained from the ihKA model of mTLE can therefore be translated well to human mTLE (Lévesque and Avoli, 2013). However, to our knowledge, hippocampal stimulation in this model has not been investigated with fMRI.
Non-imaging studies in experimental TLE examined the impact of electrical stimulation in the HC on the rate of epileptiform activity. Long-term (several days) HFS was found to be most effective in reducing seizure rates (Bragin et al., 2002; Wyckhuys et al., 2010; Van Nieuwenhuyse et al., 2015), but also LFS (1–5 Hz) showed promising results (Rajdev et al., 2011; Rashid et al., 2012; Salam et al., 2016; Paschen et al., 2020).
In a recent study, we found that hippocampal LFS in the ihKA model of mTLE reduces epileptic seizures without affecting behavior or memory performance (Paschen et al., 2023). Motivated by this, we used fMRI and EEG in this study to further investigate electrical stimulation in the ihKA model of mTLE.
In this study, we show (1) which regions respond to electrical HC stimulation in chronically epileptic and sham control mice, (2) the influence of different stimulation parameters on the brain-wide activation pattern, and (3) the changes in fMRI responses induced by prolonged 1 Hz stimulation.
2 Materials and methods
2.1 Animals
All experiments were performed with adult (18–24 weeks) male mice (n = 12) that were negative littermates of transgenic mouse lines (C57BL/6 background) according to the 3R principle. All animal procedures were carried out under the guidelines of the European Community's Council Directive (2010/63/EU) and were approved by the regional council (Regierungspräsidium Freiburg, G-19/04).
2.2 Kainate injections
Mice were injected with 50 nl kainate (Tocris, Bristol, UK) (n = 6) or saline (n = 6) into the right dorsal HC. In brief, the stereotaxic injection was performed under deep anesthesia (ketamine hydrochloride 100 mg/kg, xylazine 5 mg/kg, atropine 0.1 mg/kg body weight, i.p.) using Nanoject III [Drummond Scientific Company, Broomall, PA, USA, as described previously (Paschen et al., 2020)]. Mice were randomly assigned for kainate (15 mM in 0.9% sterile saline) or saline injection. Stereotaxic coordinates relative to Bregma (in mm) were: anterioposterior (AP) = −2.0, mediolateral (ML) = −1.5, and relative to the cortical surface: dorsoventral (DV) = −1.5. Following kainate injection the occurrence of a behavioral status epilepticus was verified, characterized by mild convulsion, chewing, immobility, or rotations, as described before (Riban et al., 2002; Tulke et al., 2019).
2.3 Construction of electrodes
The stimulation/recording electrodes were specifically designed according to Duffy et al. (2015) and Dunn et al. (2009) and made of carbon to minimize susceptibility artifacts during MRI measurements. To this end, sections of 1k carbon fiber tow (CST Composites, Tehachapi, California, USA), consisting of 1,000 carbon filaments, were split five times to achieve bundles of ~0.2k. For the electrodes serving as ground/reference, four of these 1k tows were put together to achieve a lower current density and to prevent stimulation at the ground/reference electrodes. The carbon bundles were cold-soldered to sections of copper wire using conductive silver epoxy (MG Chemicals, Ontario, Canada) and coated with two layers of polydimethylsiloxane (PDMS, Sylgard 184, The Dow Chemical Company, USA) to ensure a biocompatible insulation. The carbon ends were cut to 3 mm length to expose the contacts prior to implantation.
2.4 Electrode implantations
Sixteen days after kainate/saline injections, electrodes were implanted into the ipsilateral and contralateral dorsal HC (HCi and HCc, respectively). Stereotaxic coordinates are given relative to Bregma in mm for anterioposterior (AP) and mediolateral (ML) or to the cortical surface for dorsoventral (DV) coordinates: HCc: AP = −2.0, ML = +1.4, DV = −1.6; HCi: AP = −2.0, ML = −1.4, DV = −1.6. Two thick carbon fiber bundles were placed above the frontal cortex to provide reference and ground. The implants were fixed with dental cement (Paladur, Kulzer GmbH, Hanau, Germany).
2.5 MRI acquisition
MRI experiments were performed approximately 2 weeks after electrode implantation. Anesthesia was initiated with ca. 5 % sevoflurane (AbbVie, Ludwigshafen, Germany) and maintained at ca. 2 % during setup. Subsequently, the anesthesia was switched to medetomidine (Domitor, Vetoquinol, Germany; s.c. bolus 0.3 mg/kg, followed by continuous s.c. infusion 0.6 mg/kg/h) (Adamczak et al., 2010; Niranjan et al., 2016). Animals breathed freely during the scans (30 % O2, ca.120–170 breaths/min). A water heater connected to tubes in the animal bed was used to maintain the body temperature at 36°C (maximum deviations of ± 1.5°C were observed). After the scans, atipamezole (Antisedan, Vetoquinol, Germany) was administered (s.c., 0.8 mg/kg) to reverse the sedative effect of medetomidine.
This type of anesthesia was chosen to minimize the influence of anesthesia on the fMRI results. A common alternative would be the combination of isoflurane and medetomidine (Grandjean et al., 2014; Pradier et al., 2021). The disadvantage of this anesthesia for our study would be that isoflurane prevents epileptic activity (Airaksinen et al., 2010) and reduces the BOLD amplitude in the case of spontaneous breathing (Alst et al., 2019). The advantage of medetomidine alone is that it does not suppress epileptic activity (Airaksinen et al., 2012), however, due to the low level of sedation, animals are more likely to move during scanning. In this study, strong movements during the scan could be identified by the signal trace of the pressure sensor (which was used to detect breathing) and by artifacts in the EEG. Each fMRI experiments lasted ~6 min (see Section “2.8 Electrical Stimulations”). If strong movements occurred during this time, the scan was stopped and restarted when the animal came to rest again. If the movements continued, the session was ended and repeated on another day. In total, the individual sessions lasted approximately 1 h (including adjustments, reference scans and two to four fMRI scans).
MRI data were acquired on a preclinical 7 T system (BioSpec 70/20, Bruker BioSpin, Ettlingen, Germany) using a 2-channel surface transmit-receive cryoprobe. Adjustments included local shimming up to 3rd order, adapted to the brain volume. An anatomical scan was acquired using a fast spin-echo sequence (RARE) with the parameters: TR 4 s, effective TE 40 ms, RARE factor 4, encoding matrix 120 x 64, in-plane resolution 0.14 × 0.14 mm2, number of slices 12, slice thickness 0.8 mm, slice gap 0.2 mm.
FMRI data were acquired using a gradient, multi-echo EPI sequence with the parameters: TR 1.5 s, TE1 14 ms, TE2 23 ms and TE3 32 ms, encoding matrix 60 x 32, in-plane resolution 0.28 x 0.28 mm2, number of slices 12, slice thickness 0.8 mm, slice gap 0.2 mm, excitation pulse flip-angle 70°, acquisition bandwidth 250 kHz.
2.6 fMRI postprocessing
Data analysis was performed using FSL (FMRIB, Oxford, UK) and Matlab (Mathworks, USA). Preprocessing included motion correction, slice timing correction and high pass temporal filtering (0.01 Hz). The three individual time series (one for each echo) were combined into a single “multi-echo” dataset by T2*-weighted combination (Poser et al., 2006) (Supplementary Figure 1). After manual brain extraction, the images were spatially smoothed using a Gaussian kernel with a full-width at half-maximum of 1.5 times in-plane resolution.
The activation was analyzed using the general linear model (GLM) in FSL (Woolrich et al., 2001, 2004). In the first level, the stimulation timings were convolved with finite impulse response functions (8th order, 24 s window) to create the design matrix (Liu et al., 2017). In the group level GLM, a fixed-effects model was used and the results were registered to the AMBMC atlas space (Richards et al., 2011; Janke and Ullmann, 2015).
BOLD fMRI time courses were extracted from several region-of-interests of the AMBMC atlas. First, the time series of all voxels in the respective atlas regions were averaged. Then the individual stimulations were averaged, whereby any offsets before the start of the stimulations were removed.
2.7 Local field potential recordings
During fMRI measurements, local field potential (LFP) signals were recorded (EGI, Electrical Geodesics, USA) in the left dorsal HC with a sampling rate of 1 kHz. The data were analyzed with the toolbox EEGLAB (Delorme and Makeig, 2004) in Matlab (Mathworks, USA). Post-processing included removal of the 50 Hz line noise, a moving average FIR filter (order 20) to remove residual line noise and MRI gradient artifacts, and temporal high pass filtering at 2 Hz.
2.8 Electrical stimulations
The stimulation (STG1004, Smart Ephys/Multi-Channel Systems, Reutlingen, Germany) was performed through the electrode in the right dorsal HC with charged balanced bi-phasic pulses; 400 μs phase duration, anodic first.
A single block-design experiment consisted of four 10 s stimulation blocks and 60 s rest periods, except for the 1 Hz stimulation, which lasted 20 s. The scan time of these experiments were 5 min 40 s and 6 min 20 s, respectively.
For systematic parameter testing, amplitude effects were first investigated by keeping a constant stimulation frequency of 10 Hz while increasing the amplitude in 50 μA increments from 80 to 230 μA over several experiments. Based on these experiments, the amplitude was then kept constant at 130 μA and the frequency was set to 1, 40 and 100 Hz.
Finally, it was tested whether a prolonged 1 Hz stimulation causes a sustained effect. For this purpose, continuous 1 Hz stimulation at 130 μA for 10 min was performed inside the MRI system but without running fMRI. Block-design experiments with 10 Hz at 130 μA, before and after the 1 Hz stimulation were used as readout.
2.9 Transcardial perfusion and immunohistochemistry
At the end of the experiments, mice were deeply anesthetized and transcardially perfused with 4% paraformaldehyde in 0.1 M phosphate buffer. Following dissection, brains were sectioned on a vibratome and processed for immunohistochemistry to verify hippocampal sclerosis and electrode positions as described (Paschen et al., 2020).
2.10 Statistical analysis
Statistical analysis was performed using FSL (v5, FMRIB, Oxford, UK) and Matlab [Version 9.1.0 (R2016b), The MathWorks Inc., Natick, MA, USA]. All fMRI activations were displayed using FSL's Gaussian Random Field (GRF)-theory-based voxel-wise correction at p ≤ 0.05, as recommended in Eklund et al. (2016) and Woo et al. (2014). In order to test for group differences, all subjects in these groups were included in the design matrix (for more details, we refer to the user guide of the FSL function “FEAT”, section “group statistics”). Two control mice had to be excluded because the ground/reference electrodes were not connected to the brain. One kainate mouse died during the period of the experiments. All statistical tests and animal numbers are given in the results and figure captions.
3 Results
The stimulations were applied in the septal pole of the ipsilateral HC. Based on our previous study (Janz et al., 2017b), hippocampal sclerosis on this side was identified in kainate-injected mice by a slight increase in signal on the T2-weighted reference images (Figure 1A) and an enlarged dentate gyrus due to granule cell dispersion (Supplementary Figure 2).
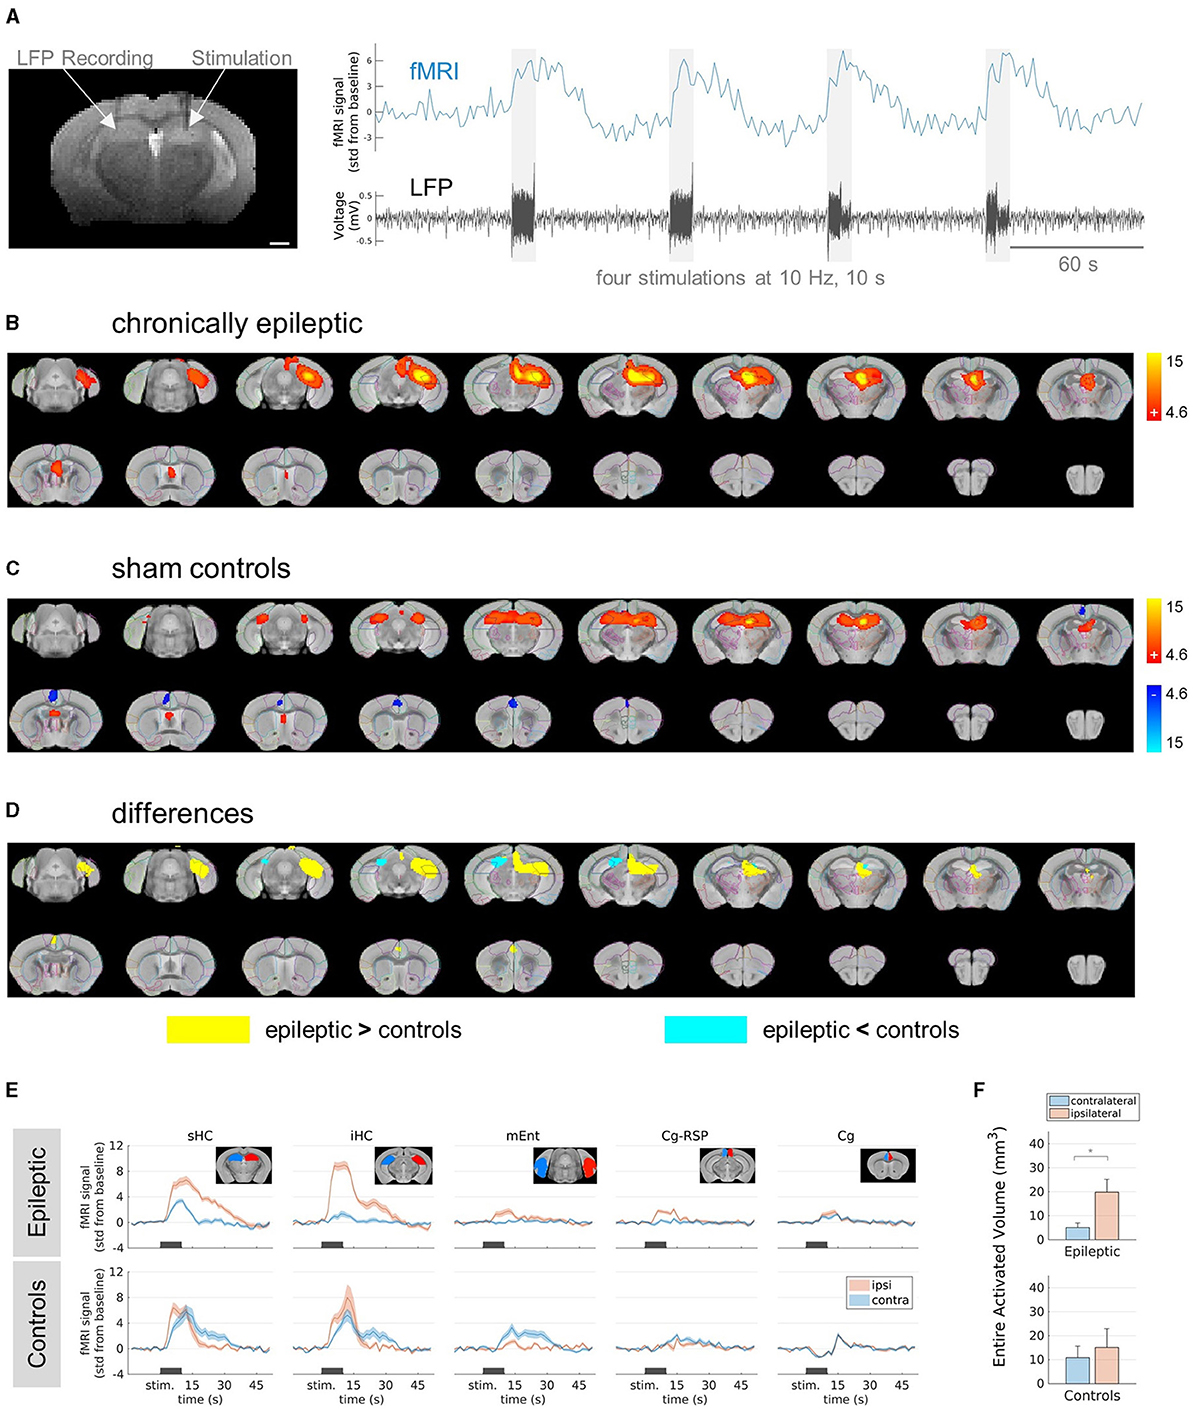
Figure 1. FMRI responses in epileptic mice and sham controls stimulated at 10 Hz. (A) Experimental design. (Left) Representative T2-weighted anatomical reference image showing stimulation and recording electrodes implanted in the right and left hippocampus, respectively. Scale bar: 1 mm. (Right) Exemplary (unprocessed) fMRI time course (blue) showing the responses to the stimulation indicated by the electrical artifacts in the LFP trace (black). Scale bar: 60 s. (B) fMRI activation in chronically epileptic mice from caudal (top left) to rostral (bottom right) direction at stimulation parameters: 10 Hz, 10 s, 80 μA. The group-level (n = 6) fMRI activations are shown as red-yellow overlays in the AMBMC reference space (gray background) with contours of the AMBMC mouse brain atlas (colors red to yellow represent z-scores from 4.6 to 15 of significant responses at a voxel-wise corrected threshold p < 0.05). (C) fMRI activation in sham controls stimulated at 10 Hz, for 10 s and 80 μA. Positive and negative responses are shown as red-yellow (z-scores from 4.6 to 15) and blue-light blue (z-scores from −4.6 to −15) overlays (group-level n = 4, voxel-wise corrected threshold p < 0.05). (D) Group-level differences between epileptic (n = 6) and control (n = 4) mice. Yellow and cyan colored areas represent areas with significantly stronger responses in epileptic mice or controls, respectively (two-sample unpaired T-test, voxel-wise corrected threshold p < 0.05, stimulation parameters 10 Hz, for 10 s and 80 μA). (E) Mean fMRI responses in selected regions (mean ± SEM). The black bars indicate the stimulation periods. Atlas regions: sHC, septal hippocampus; iHC, intermediate hippocampus; mEnt, medial entorhinal cortex; Cg-Rsp, cingulate region/retrosplenial area; Cg, cingulate region/anterior cingulate area. (F) Quantification of the entire activated volume on the ipsilateral and contralateral hemisphere (mean ± SEM). In epileptic mice, the activated volumes on the ipsilateral hemisphere were significantly larger than on the contralateral side, whereas no difference was found in sham controls (*p < 0.05, one-sample t-tests between ipsi- and contralateral “Entire Activated Volumes”).
3.1 Differences between epileptic mice and sham controls in fMRI responses to electrical HC stimulation
First, we delineated the brain regions responsive to electrical HC stimulation in chronically epileptic mice compared to sham controls. We selected a stimulation frequency of 10 Hz. Preliminary tests in an epileptic mouse showed only minimal stimulation artifacts in the LFP and almost no fMRI response at a stimulation amplitude of 30 μA (Supplementary Figure 3). Stimulations at 80 μA elicited robust fMRI activations in epileptic mice (Figure 1B). The main activation was induced around the stimulation site in the ipsilateral septal HC. It was restricted to the ipsilateral dorsal to intermediate HC and did not propagate into the ventral part of the HC nor to the contralateral side. In caudal direction, activation affected parts of the ipsilateral entorhinal cortex and in rostral direction, parts of the cingulate cortex and the septal area.
In controls, no fMRI response was detected at 10 Hz and 30 μA (Supplementary Figures 4A–D). However, the first stimulation block at 80 μA triggered epileptiform afterdischarges (ADs) in control animals (Supplementary Figures 4E, F). The subsequent stimulations did not elicit further ADs (Supplementary Figure 4G). These experiments showed fMRI activation bilaterally in the septal HC, in parts of the entorhinal cortex, septum and a negative BOLD response in the cingulate cortex (Figure 1C).
Testing for group differences revealed areas where epileptic mice showed either significantly stronger or weaker responses compared to sham controls (Figure 1D). The fMRI response in epileptic mice was significantly stronger in the ipsilateral HC and in parts of the ipsilateral thalamus, entorhinal cortex and cingulate cortex (Figure 1D, yellow areas). However, in the contralateral septal HC and in a very small part of the ipsilateral septal HC, the fMRI response was weaker in epileptic mice compared to sham controls (Figure 1D, cyan areas).
The time courses of the BOLD amplitudes further explain the found differences (Figure 1E). While control animals showed similar BOLD responses in the ipsi- and contralateral septal and intermediate HC, epileptic mice showed extremely strong BOLD responses in the ipsilateral HC und only weak responses on the contralateral side. Comparing the entire activated volumes in epileptic mice showed significantly more activation in the ipsilateral hemisphere, whereas sham controls recruited similar activation in both hemispheres (Figure 1F).
In conclusion, the induced fMRI activations differed between sham controls and chronically epileptic mice, with the latter showing pronounced BOLD activity in the ipsilateral hippocampal network and only little spread to the contralateral side. Note that at 10 Hz stimulation, epileptiform ADs occurred only in sham controls and not in epileptic mice.
3.2 Influence of the stimulation amplitude on fMRI activation in epileptic mice
To analyze the impact of different stimulation parameters on the brain-wide activation pattern in chronically epileptic mice, we kept the stimulation frequency constant at 10 Hz and varied the current amplitudes ranging from 80 to 230 μA during fMRI experiments (Figure 2). FMRI activation was found in the ipsilateral dorsal to intermediate HC, parts of the entorhinal, cingulate cortex and septal area. Increasing the amplitude stepwise from 80 to 230 μA resulted in similar activation patterns with only a slight increase in spread (Figure 2A).
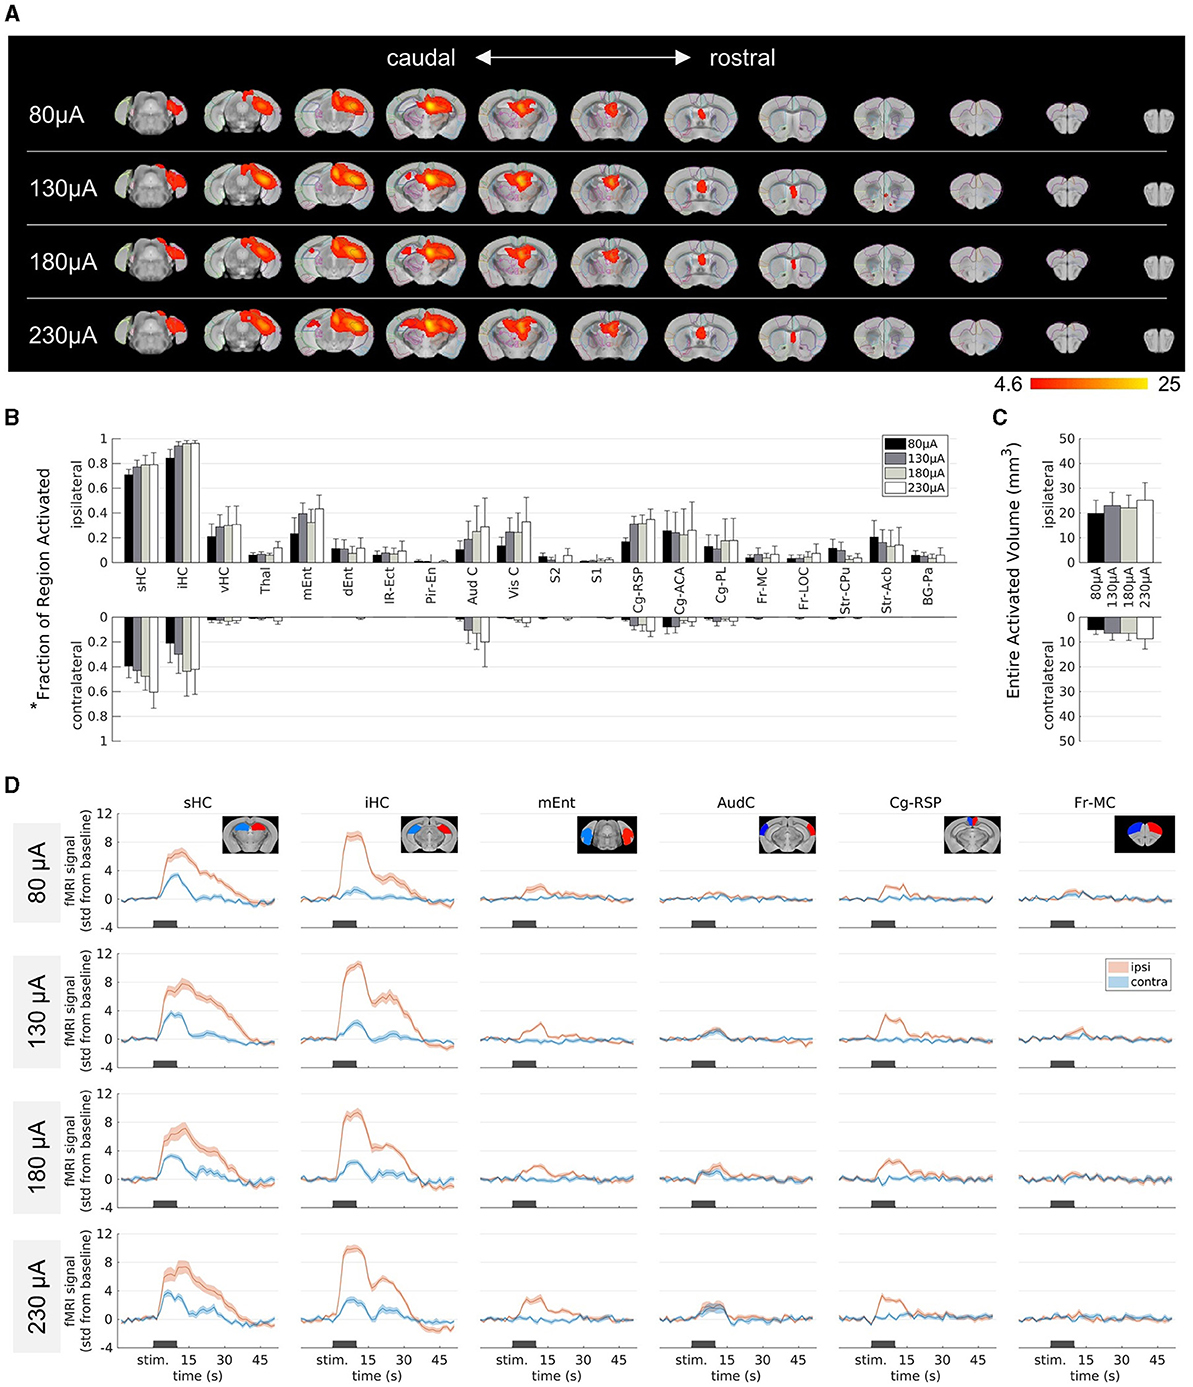
Figure 2. Influence of the stimulation amplitude on fMRI activation in epileptic mice. (A) fMRI activation maps for stimulation amplitudes of 80 μA (top row) to 230 μA (bottom row) from caudal (left) to rostral (right) direction. The group-level fMRI activations are shown as red-yellow overlays in the AMBMC reference space (gray background) with contours of the AMBMC mouse brain atlas (colors red to yellow represent z-scores from 4.6 to 25 of significant responses at a voxel-wise corrected threshold p < 0.05; group n = 6 for 80 and 130 μA, n = 4 for 180 and 230 μA). (B) Quantification of the activated fractions in atlas regions* for stimulation amplitudes from 80 to 230 μA (mean ± standard error of the mean, SEM). Increasing the amplitude did not result in significant differences of the activated volumes (one-way ANOVA p > 0.05 with Tukey-Kramer multiple comparison tests). (C) Quantification of the entire activated volume on the ipsilateral and contralateral hemisphere (mean ± SEM). No significant differences were found between the stimulation amplitudes (one-way ANOVA p > 0.05 with Tukey-Kramer multiple comparison tests). However, the activated volumes on the ipsilateral hemisphere were significantly larger than on the contralateral side (one-sample t-tests between ipsi- and contralateral “Entire Activated Volumes”; Bonferroni-Holm corrected p = 0.016, 0.016, 0.019 and 0.024 for 80, 130, 180 and 230 μA, respectively). (D) Mean fMRI responses in selected regions (mean ± SEM). The black bars indicate the stimulation periods. *Atlas regions: sHC, septal hippocampus; iHC, intermediate hippocampus; vHC, ventral hippocampus; Thal, thalamus; mEnt, medial entorhinal cortex; dEnt, dorsal entorhinal cortex; IR-Ect, insular region/ectorhinal area; Pir-En, piriform cortex/endopiriform claustrum; Aud C, auditory/temporal region; Vis C, visual cortex; S2, secondary somatosensory cortex; S1, primary somatosensory cortex; Cg-Rsp, cingulate region/retrosplenial area; Cg-ACA, cingulate region/anterior cingulate area; Cg-PL, cingulate region/prelimbic area; Fr-MC, frontal association/motor cortex; Fr-LOC, frontal/lateral orbital cortex; Str-CPu, striatum/caudate putamen; Str-Acb, striatum/accumbens; BG-Pa, basal ganglia/pallidum.
To quantify the extent of activation, the percentage of the area covered by the fMRI activation was calculated in each brain region (Figure 2B). Group comparisons across the different brain regions revealed no significant differences between the different amplitudes (one-way ANOVA p > 0.05 with Tukey-Kramer multiple comparison test). The entire activated volume did also not change significantly with amplitude (Figure 2C). A comparison between the two hemispheres revealed significantly larger activation volume on the ipsilateral side at all current amplitudes (one-sample t-tests between ipsi- and contralateral “Entire Activated Volumes”; Bonferroni-Holm corrected p = 0.016, 0.016, 0.019 and 0.024 for 80, 130, 180 and 230 μA, respectively, Figure 2C).
The contralateral septal and intermediate HC became activated only at higher amplitudes (Figure 2A). However, the fMRI time courses of these areas illustrate that there was already a weak response at 80 μA and only minor changes occurred at higher amplitudes (Figure 2D).
Overall, the induced activity patterns were very similar across all current amplitudes.
3.3 Effect of the stimulation frequency on fMRI activation in epileptic mice
Next, we investigated the impact of different stimulation frequencies in chronically epileptic mice. We kept the amplitude constant at 130 μA and stimulated at 1, 40, and 100 Hz (Figure 3).
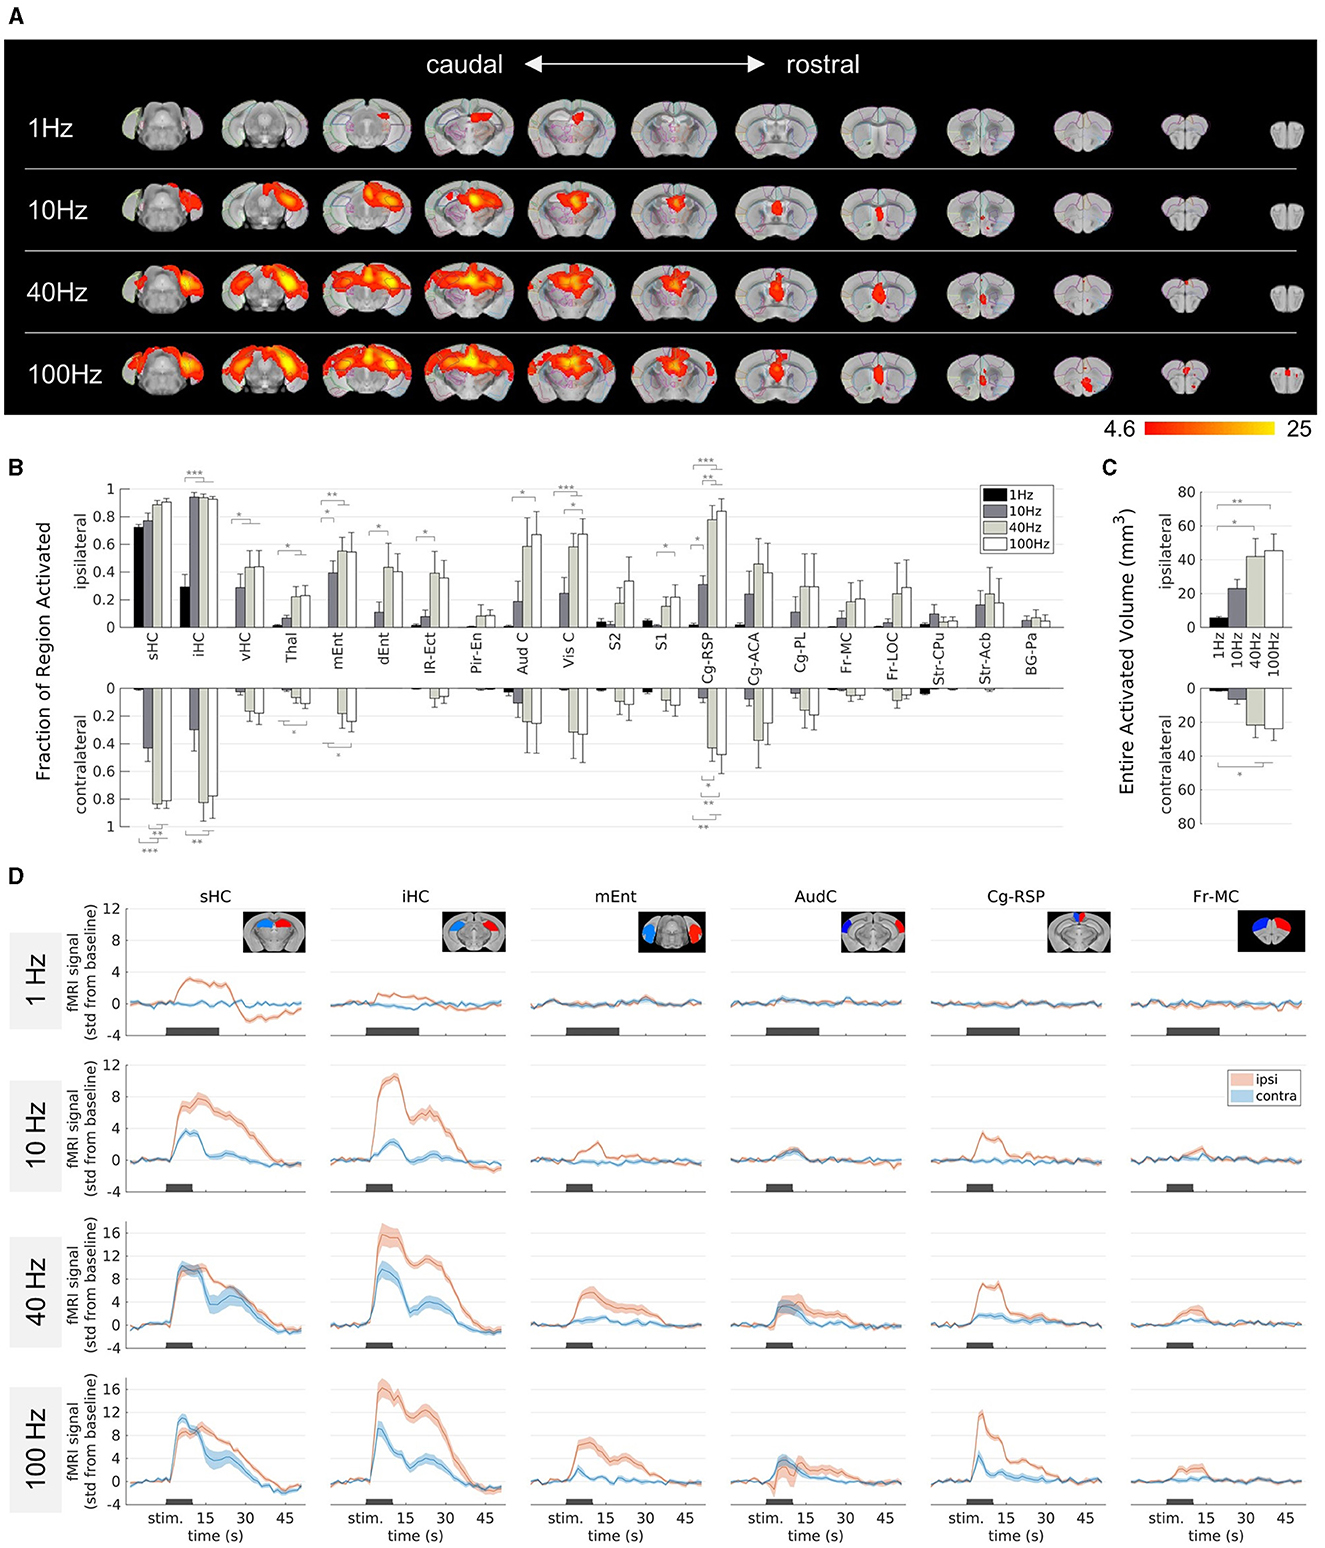
Figure 3. Effect of the stimulation frequency on fMRI activation in epileptic mice. (A) fMRI activation maps for stimulation frequencies of 1 Hz (top row) to 100 Hz (bottom row) from caudal (left) to rostral (right) direction. The group-level fMRI activations are shown as red-yellow overlays in the AMBMC reference space (gray background) with contours of the AMBMC mouse brain atlas (colors red to yellow represent z-scores from 4.6 to 25 of significant responses at a voxel-wise corrected threshold p < 0.05; group n = 6 for 1 and 10 Hz, n = 4 for 40 and 100 Hz). (B) Quantification of the activated fractions in atlas regions showed with increasing frequency several significant changes (*p < 0.05, **p < 0.01, ***p < 0.001, one-way ANOVA with Tukey-Kramer multiple comparison tests). (C) Quantification of the entire activated volume on the ipsilateral and contralateral hemisphere showed significant increases from 1–10 to 40–100 Hz (*p < 0.05, **p < 0.01, one-way ANOVA with Tukey-Kramer multiple comparison tests). The activated volumes differed significantly between the ipsi- and contralateral hemispheres at frequencies of 1 and 10 Hz, but not at 40 and 100 Hz (one-sample t-tests between ipsi- and contralateral “Entire Activated Volumes”; Bonferroni-Holm corrected p = 0.03, 0.016, 0.069 and 0.076 for 1, 10, 40, and 100 Hz, respectively. (D) Mean BOLD fMRI responses in selected regions (mean ± SEM). The black bars indicate the stimulation periods.
At 1 Hz, activation was visible only around the stimulation site, whereas with increasing frequency, activation spread from the HC to large parts of the brain (Figure 3A). At 100 Hz, fMRI responses were detected in the thalamus, several cortical, cingulate and frontal regions. The activated fractions in several brain regions (Figure 3B) and the total activated volumes increased significantly with frequency (Figure 3C, one-way ANOVA p < 0.05 with Tukey-Kramer multiple comparison tests).
Another noteworthy change from 10 Hz to 40–100 Hz was the stronger recruitment of the contralateral hemisphere, for example in the intermediate HC, the medial entorhinal cortex, and the cingulate areas. The activated volumes differed significantly between the ipsi- and contralateral hemispheres at frequencies of 1 and 10 Hz, but not anymore at 40 and 100 Hz (one-sample t-tests between ipsi- and contralateral “Entire Activated Volumes”; Bonferroni-Holm corrected p = 0.03, 0.016, 0.069, and 0.076 for 1, 10, 40, and 100 Hz, respectively, Figure 3C).
The fMRI time courses show that the response at 1 Hz was comparatively weak (Figure 3D). The longer stimulation duration (20 s) was chosen because it was unclear how weak the response would be, but Figure 3D shows that the BOLD response is clearly detectable already after 10 s.
The evaluated fMRI patterns showed only little inter-animal variability (Supplementary Figure 5). In one epileptic mouse, a 40 Hz stimulation elicited seizures on subsequent days (Supplementary Figure 6). In contrast to the ADs in control mice, the seizures in the epileptic mouse were associated with strong seizure-induced movements. However, the rarity of these seizures in only one subject precluded a systematic analysis.
Overall, the stimulation frequency decisively determined which brain regions were affected by the stimulation. While the effect of 1 Hz stimulation was mainly limited to the stimulation site, increasing the frequency to 100 Hz led to a spread across the whole brain, including the contralateral HC, cortical and frontal regions.
3.4 Changes in fMRI activation due to prolonged 1 Hz stimulation
We found that 1 Hz stimulation induced local fMRI activity. However, prolonged application, such as in Paschen et al. (2023), may additionally influence excitability or connectivity. Both would be detectable by modified fMRI patterns. We therefore compared the fMRI patterns induced by 10 Hz block-design fMRI before and after prolonged 1 Hz stimulation (Figure 4A).
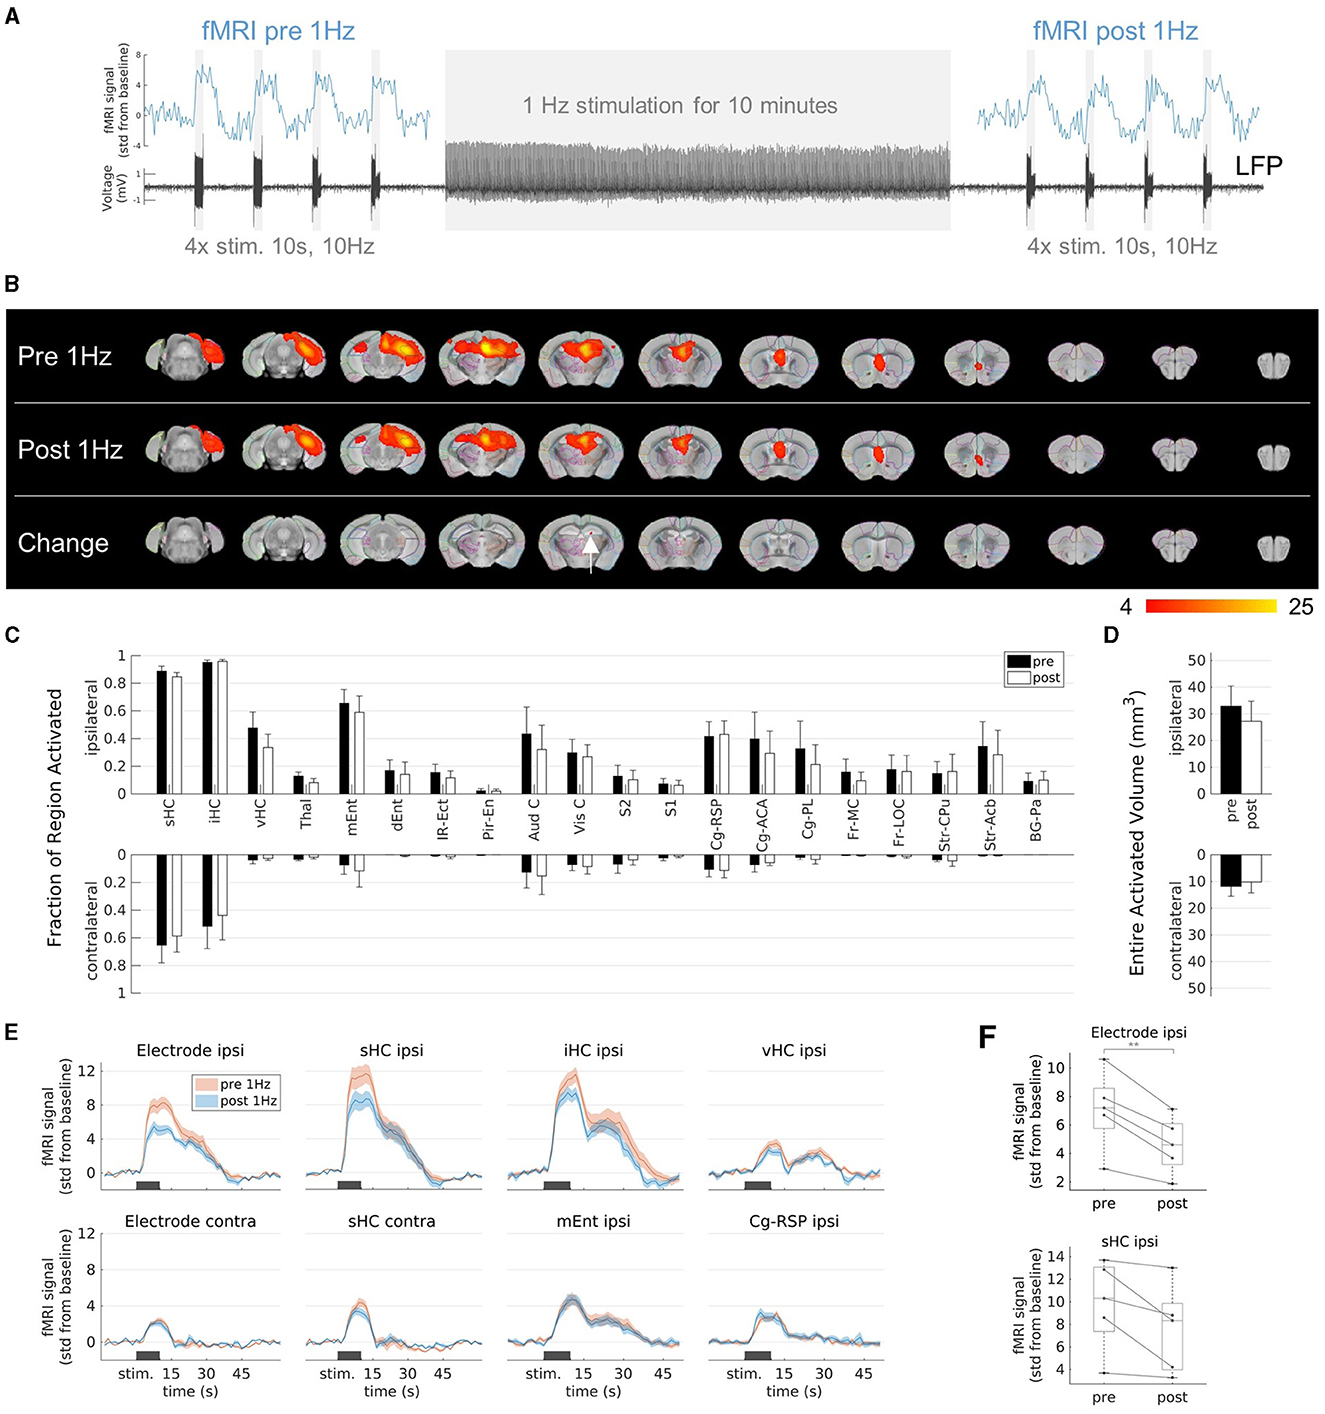
Figure 4. Effects on fMRI response to prolonged 1 Hz stimulation. (A) Experimental design. Stimulation at 1 Hz (130 μA) was applied for 10 min and block-design fMRI experiments (4 stimulation blocks for 10 s at 10 Hz and 130 μA) were performed before and after the 1 Hz stimulation to evaluate the activation patterns. (B) fMRI activation maps before (first row, “Pre 1 Hz”), after the 1 Hz stimulation (second row, “Post 1 Hz”), and the group-level comparison between them (third row). A significant decrease (two-sample paired t-test, voxel-wise corrected threshold p < 0.05; group n = 5) was detected in a small area (red color) within the ipsilateral septal HC (white arrow). (C) Quantification of the activated fractions in atlas regions (mean ± SEM). There were no significant changes from pre 1 Hz to post 1 Hz (paired t-tests p > 0.05). (D) Quantification of the entire activated volumes on the ipsilateral and contralateral hemisphere (mean ± SEM). There was no significant change from pre 1 Hz to post 1 Hz (paired t-tests p > 0.05). (E) Average fMRI responses in selected regions (mean ± SEM). The fMRI response after the 1 Hz stimulation (blue) was reduced compared to the fMRI response before the 1 Hz stimulation (red) in the regions-of-interest (ROIs) near the stimulation electrode (ROIs “Electrode ipsi” and “sHC ipsi”), whereas no change was observed in ROIs far from the stimulation site (e.g., at the contralateral side or in the entorhinal cortex and cingulate region). The ROIs “Electrode ipsi” and “Electrode contra” correspond to a volume of 0.5 mm3 (eight voxels) directly around the electrodes. These and the ROIs in the septal HC (“sHC ipsi” and “sHC contra”) were manually drawn in the single subject space to exclude the electrode artifacts. (F) Change of fMRI amplitudes in the ROIs “Electrode ipsi” (paired t-test between pre and post 1 Hz: **p < 0.01) and “sHC ipsi” (paired t-test: p 0.06). Mean fMRI signals in a 10 s window shifted by 5 s from the start of the stimulation to account for the delayed fMRI response.
The extent of the fMRI pattern before 1 Hz stimulation was similar to that after 1 Hz stimulation (Figure 4B). However, the group comparison revealed a significant decrease within the ipsilateral septal HC (Figure 4B, third row). There were no significant changes in the activated fraction in individual regions (Figure 4C) or in the total volumes (Figure 4D).
To further clarify this finding, we compared the fMRI time courses before and after the 1 Hz stimulation in volumes directly around the electrode, in the entire septal, intermediate and ventral HC (Figure 4E). We found that the fMRI response in the areas close to the stimulation electrode were reduced after the 1 Hz stimulation and this effect became weaker with increasing volume and distance from the electrode. More distant regions, such as the entorhinal cortex, the cingulate region or the contralateral HC showed no change. The fMRI response was not only reduced on average, but also in each animal (paired t-tests; p = 0.004 in volume “Electrode ipsi”, p = 0.06 in volume “sHC ipsi”, Figure 4F).
Regions that were not affected by the 1 Hz stimulation but only by the 10 Hz stimulation served here as negative control. A change in physiological parameters (e.g., depth of anesthesia, heart rate) or simply the time could theoretically have altered the BOLD fMRI response from before to after the 1 Hz stimulation. However, there are several regions, which were not affected by the 1 Hz stimulation, for example mEnt, Cg-RSP or the contralateral septal HC near the electrode (see Figure 3D, Supplementary Figure 5). These regions responded only to the 10 Hz stimulations and showed unchanged BOLD responses after the 10 min 1 Hz stimulation (Figure 4E). From this, it can be concluded that the 1 Hz stimulation was mainly responsible for the local reduction of the fMRI response.
4 Discussion
This study systematically investigated brain-wide fMRI activation patterns under various stimulation protocols in both chronically epileptic and sham control mice. Importantly, our results were derived from the ihKA mouse model of mTLE that replicates several key features of the human disease, such as hippocampal sclerosis and recurrent seizures (Bouilleret et al., 1999).
To compare different stimulation frequencies, in vivo studies must necessarily be limited to a few frequencies to be tested due to time constraints. We chose the intermediate frequencies of 10/40 Hz because there are numerous studies for this frequency range, but they were performed in healthy animals (Moreno et al., 2016) or stimulated different structures such as the perforant path (e.g. Angenstein et al., 2007; Canals et al., 2008; Riemann et al., 2017). In conventional DBS applications in epilepsy, usually higher frequencies ≥100 Hz are applied (Zangiabadi et al., 2019). However, the benefit of low frequency stimulation in epilepsy is also currently being investigated (Paschen et al., 2020, 2023; Manzouri et al., 2021). Therefore, in this study we also included a high (100 Hz) and a low (1 Hz) frequency for comparison.
Other studies have investigated the frequency dependent propagation of activity induced in the HC either via DBS (Moreno et al., 2016) or optogenetics (Weitz et al., 2015). Interestingly, these studies in healthy animals show an increased spread from the HC to extrahippocampal areas only in the frequency range 5 Hz to around 40 Hz and a plateau or even blockade at 40 Hz and higher frequencies. In contrast, our results from the ihKA mouse model of mTLE showed at 100 Hz stimulation a wide spread from the dorsal HC to several cortical areas. MTLE with unilateral hippocampal sclerosis is associated with hyperexcitability, cell loss and rewiring (Häussler et al., 2012; Marx et al., 2013; Janz et al., 2017a), which may explain the wider spread of activity. This is also consistent with increased functional connectivity that has been found in other rodent models of mTLE by resting-state fMRI (Gill et al., 2017; Li et al., 2021).
Aiming to interfere with epileptiform activity, recent studies explored the application of low frequency stimulation in both human mTLE (Koubeissi et al., 2013, 2022; Lim et al., 2016) and rodent mTLE models (Rashid et al., 2012; Paschen et al., 2020, 2023). A possible explanation for the benefit in focal epilepsy is that prolonged stimulation of the epileptic focus leads to long-term depression and reduced excitability (Durand and Bikson, 2001; Manzouri et al., 2021), which may be associated with reduced seizure incidence. Our recent study on the ihKA mouse model of mTLE has also shown that 1 Hz stimulation can reduce seizures without affecting memory or behavioral performance (Paschen et al., 2023). In the current study, we showed using fMRI, that 1 Hz stimulation has a local effect, which may explain the minimal side effects, and yet is able to reduce local excitability, supporting this strategy to interfere with epileptiform activity. The relatively weak effect on fMRI response in this study was most likely due to the relatively short application time of 10 minutes, which can be extended in the future to further investigate if changes in fMRI response increase.
A very pronounced difference to the sham controls in our study was that the induced activity in epileptic animals was extremely strong in the ipsilateral HC and substantially weaker on the contralateral side. This is consistent with known morphological changes in the ihKA mouse model. Hippocampal sclerosis is characterized by cell loss e.g. in CA1, CA3 and the hilus of the septal ipsilateral HC (Lévesque and Avoli, 2013; Marx et al., 2013). However, the DG mainly shows a loss of inhibitory interneurons. Excitatory granule cells in the DG are spared and undergo structural reorganization, a process known as mossy fiber sprouting (Bouilleret et al., 1999). A recent study using acute slices in the ihKA mouse model has indeed shown increased excitability of the DG due to increased synaptic strength, the formation of recurrent synapses, and a reduction of inhibitory synapses on the granule cells (Vergaelen et al., 2024). This finding may have a direct influence on the assessment of stimulation results. The efficacy of low frequency stimulation was found to vary from patient to patient (Lim et al., 2016) or not to be beneficial (Boëx et al., 2007). Reasons why such a local stimulation may be ineffective could be that the seizure focus is not directly at the electrode or that there are additional foci, e.g. in bilateral TLE (Aghakhani et al., 2014; Chiang et al., 2022). Approaches to improve efficacy were to target both hippocampi either by the stimulation of a fiber tract connected to bilateral hippocampi (Koubeissi et al., 2022) or by bilateral stimulation via several electrodes (Cukiert et al., 2014, 2021). Even in unilateral TLE, switching from unilateral to bilateral DBS could improve the efficacy in some patients (Vonck et al., 2013). For the ihKA model in particular, a recent study provides evidence that the contralateral HC plays an important role in the generation of seizures (Padmasola et al., 2024). The fMRI results in sham controls would suggest that an ipsilateral stimulation already affects the contralateral HC. However, the results in epileptic animals showed that the BOLD activity induced by stimulation, especially at low frequency, does not spread equally to the contralateral side, explaining the benefit of bilateral stimulation.
The stimulation parameters can also be adjusted to improve the effect of the stimulation. The results of the present study show that the stimulation frequency constitutes the key factor in determining which areas/networks of the brain are affected by a stimulation. The extent of activation could be adjusted from local activation at 1 Hz to brain-wide activation at 100 Hz. In contrast, we found that the stimulation amplitude had little influence on the extent of the induced fMRI patterns over a relatively wide amplitude range. 80 μA was the lowest amplitude in our study that evoked clearly detectable fMRI responses in individuals and higher currents led only to a minor, yet unspecific broadening of the activation pattern, but did not recruit fundamentally new areas. This is consistent with a previous clinical study that compared two current levels (4 and 8 mA) and found no difference in activation patterns (Jones et al., 2014). The absolute values of the stimulation current may differ between studies due to differences in electrode design and/or positions, but it can be concluded that if a response to a stimulation is detectable, modifying the current strength is unlikely to result in a significantly different response or functional outcome. One point to note here, however, is the low spatial specificity of the electrical stimulation in this study. Already with 80 μA stimulation, the induced fMRI activation extended over the entire septal ipsilateral HC. On the one hand, it would be possible to investigate more precisely at what point stimulation becomes visible, whereby the exact threshold probably varies from individual to individual and also depends on the frequency. On the other hand, newer electrode designs, so-called directional DBS electrodes (Steigerwald et al., 2019), could be used to control the current flow more precisely. For example, with control in a more horizontal direction, one could aim to stimulate only individual HC subfields. The sclerotic HC in particular shows subfield-specific changes, e.g. loss of pyramidal neurons in CA1/CA3 regions and preservation of dentate granule cells with their entorhinal inputs, which is why this spatially more precise electrical stimulation would be interesting to investigate.
At the beginning of the study, we assumed that stimulation above a threshold, a certain amplitude or frequency, would reliably trigger epileptic seizures. Therefore, we chose the stimulation design from low to high amplitudes/frequencies (as opposed to a randomized design). To minimize bias from one experiment to the next, we applied only four blocks of stimulation in each experiment. One surprising result of our study was that the stimulations triggered epileptiform ADs in sham controls, whereas in epileptic animals, seizures occurred in only one animal. This represented only 4.1 % (2 of 49) of all stimulation experiments in epileptic mice and was therefore not representative. It is still unknown how exactly epileptic seizures are triggered. The seizures themselves, in epileptic animals as well as patients, are difficult to study with fMRI because they occur spontaneously and are often associated with strong movements. The fact that the stimulations elicited epileptiform ADs only in sham controls and that these animals did not move during the ADs, suggests that the mechanisms of ADs in sham controls and spontaneous epileptic seizures are different. The results from studies of stimulated ADs in healthy animals, e.g. (Airaksinen et al., 2010, 2012; Duffy et al., 2015, 2020), have to be translated to real epilepsy with caution. However, the comparison to healthy animals can of course provide valuable information about structural alterations. In this study, the comparison was limited because ADs in controls occurred already at 10 Hz. For a direct comparison, also at higher frequencies, it is therefore necessary to select stimulation lengths in both epileptic and control animals that are sufficiently short ( ≤ 1s) to avoid causing seizures.
BOLD fMRI was acquired with a gradient multi-echo EPI sequence in this study. The multi-echo approach should provide optimal sensitivity to T2*, but the temporal resolution (TR 1.5 s) could be improved in future studies. Chuang et al. developed a multiband EPI sequence for ultrafast fMRI (TR 300 ms) for preclinical scanners (Lee et al., 2019; Chuang et al., 2023). However, in BOLD fMRI, which does not directly measure neuronal activity, the limiting factor is the hemodynamic coupling, which leads to delayed and sluggish responses in relation to the actual neuronal activity. Recently, the possibility of directly detecting neuronal activity using fMRI has been reported (Toi et al., 2022). This method is not yet sufficiently established (Choi et al., 2024), but could possibly provide more insights into activation and propagation of activity in stimulation studies.
One limitation of this study is that we only examined which regions respond to stimulation and not to what extent the stimulation patterns are related to the efficacy of the stimulation in suppressing epileptic activity. A future study could shed more light on the relation between stimulated patterns, reduction of epileptic activity, occurrence of adverse effects and the possibility to adapt the stimulation parameters in individuals to tailor the outcome. The positive benefit of DBS in epilepsy could possibly occur only after some time and a distinction would have to be made between acute and chronic effects. Therefore, a long-term study with DBS applications e.g. once a day or constantly every few minutes would be optimal. With long-term EEG to quantify the epileptic activity and fMRI at several time points, the changes over time can be determined. To detect possible adverse effects of stimulation, behavioral tests, such as in (Paschen et al., 2023), should be included. This would be the best way to correlate the induced activity with beneficial effects (reduction of epileptic activity) and adverse effects (worse scores in the behavioral test). Our hypothesis is that this would allow us to identify which stimulation patterns lead eventually to optimal results.
Another limitation is that this study was performed only in an animal model of mTLE. In the human disease, there is greater variability between patients, the epileptic foci might not be so restricted and there is no guarantee that the electrode is positioned exactly at the focus. This variability underscores the benefit of controlling stimulation responses using fMRI, which may provide a way to more effective, individualized treatment.
An extension of this study would be to investigate other forms of stimulation, e.g. DC stimulation which is also used in epilepsy (Fregni et al., 2006; Sudbrack-Oliveira et al., 2021) or very high stimulation frequencies in the kHz range (Neudorfer et al., 2021). A very interesting recent development is the so-called temporal interference (TI) stimulation (Grossman et al., 2017), which makes it possible to stimulate non-invasively, yet focally and even deep enough to reach the human HC (Violante et al., 2023). Applications in the mouse model of epilepsy have also shown that TI stimulation can be effective enough to reduce epileptic activity (Acerbo et al., 2022, 2024). It remains to be investigated whether non-invasive TI stimulation can produce similar effects as stimulation via implanted electrodes.
5 Conclusions
In this study, we presented the brain-wide responses to hippocampal stimulations in the ihKA model of mTLE. When estimating the potential outcome of a stimulation in mTLE, it is essential to consider changes in the epileptic brain and the impact of stimulation parameters. Compared to sham controls, epileptic mice showed pronounced responses in the ipsilateral HC and a wider spread to the entorhinal cortex and septal region. The key parameter that determined the extent of activation was the stimulation frequency. While low frequency (1 Hz) stimulation elicited only a local fMRI response, high frequency (40–100 Hz) stimulation resulted in spread of activity from the HC to cortical regions in the epileptic brain. The amplitude parameter, in contrast to frequency, offered little opportunity to vary the stimulation effects. However, the fact that the amplitude did not show a large influence makes it possible to compare the results of studies even if the amplitude settings differ. This supports the translational value of preclinical fMRI studies.
Data availability statement
The datasets presented in this study can be found in online repositories. The names of the repository/repositories and accession number(s) can be found below: https://doi.org/10.18112/openneuro.ds004959.v1.0.0.
Ethics statement
The animal study was approved by Regierungspräsidium Freiburg, Germany. The study was conducted in accordance with the local legislation and institutional requirements.
Author contributions
NS: Conceptualization, Data curation, Formal analysis, Investigation, Methodology, Software, Visualization, Writing – original draft, Writing – review & editing. EP: Conceptualization, Data curation, Investigation, Methodology, Writing – review & editing. PL: Funding acquisition, Writing – review & editing. DE: Funding acquisition, Project administration, Resources, Writing – review & editing. CH: Funding acquisition, Project administration, Resources, Supervision, Writing – review & editing.
Funding
The author(s) declare financial support was received for the research, authorship, and/or publication of this article. This work was supported by the German Research Foundation (DFG, HA 1443/10-1 and LE 3437/2-1), BrainLinks-BrainTools Center, which was funded by the Federal Ministry of Economics, Science and Arts of Baden-Württemberg within the sustainability program for projects of the Excellence Initiative II. Co-financing by the European Union (Interreg Project IMAGINE-STIM).
Acknowledgments
We acknowledge support by the Open Access Publication Fund of the University of Freiburg. We also acknowledge support by the Core Facility Preclinical Imaging Research Center (AMIRCF; DFG RIsources No. RI_00052), Department of Radiology -Medical Physics of the University Hospital Freiburg.
Conflict of interest
The authors declare that the research was conducted in the absence of any commercial or financial relationships that could be construed as a potential conflict of interest.
The author(s) declared that they were an editorial board member of Frontiers, at the time of submission. This had no impact on the peer review process and the final decision.
Publisher's note
All claims expressed in this article are solely those of the authors and do not necessarily represent those of their affiliated organizations, or those of the publisher, the editors and the reviewers. Any product that may be evaluated in this article, or claim that may be made by its manufacturer, is not guaranteed or endorsed by the publisher.
Supplementary material
The Supplementary Material for this article can be found online at: https://www.frontiersin.org/articles/10.3389/fnimg.2024.1423770/full#supplementary-material
Abbreviations
ADs, afterdischarges; BOLD, blood oxygen level dependent; DBS, deep brain stimulation; HC, hippocampus; HFS, high-frequency stimulation; ihKA, intrahippocampal kainate; LFS, low-frequency stimulation; LFP, local field potential; mTLE, mesial temporal lobe epilepsy.
References
Acerbo, E., Botzanowski, B., Dellavale, D., Stern, M. A., Cole, E. R., Gutekunst, C. A., et al. (2024). Improved temporal and spatial focality of non-invasive deep-brain stimulation using multipolar single-pulse temporal interference with applications in epilepsy. bioRxiv. doi: 10.1101/2024.01.11.575301
Acerbo, E., Jegou, A., Luff, C., Dzialecka, P., Boris, B., Florian, M., et al. (2022). Focal non-invasive deep-brain stimulation with temporal interference for the suppression of epileptic biomarkers. Front. Neurosci. 16:945221. doi: 10.3389/fnins.2022.945221
Adamczak, J. M., Farr, T. D., Seehafer, J. U., Kalthoff, D., and Hoehn, M. (2010). High field BOLD response to forepaw stimulation in the mouse. Neuroimage 51, 704–712. doi: 10.1016/j.neuroimage.2010.02.083
Aghakhani, Y., Liu, X., Jette, N., and Wiebe, S. (2014). Epilepsy surgery in patients with bilateral temporal lobe seizures: a systematic review. Epilepsia 55, 1892–1901. doi: 10.1111/epi.12856
Airaksinen, A. M., Hekmatyar, S. K., Jerome, N., Niskanen, J., Huttunen, J. K., Pitkänen, A., et al. (2012). Simultaneous BOLD FMRI and local field potential measurements during kainic acid–induced seizures. Epilepsia 53, 1245–1253. doi: 10.1111/j.1528-1167.2012.03539.x
Airaksinen, A. M., Niskanen, J., Chamberlain, R., Huttunen, J. K., Nissinen, J., Garwood, M., et al. (2010). Simultaneous fMRI and local field potential measurements during epileptic seizures in medetomidine-sedated rats using raser pulse sequence. Magnet. Reson. Med. 64, 1191–1199. doi: 10.1002/mrm.22508
Alst, T. M., Wachsmuth, L., Datunashvili, M., Albers, F., Just, N., Budde, T, et al. (2019). Anesthesia differentially modulates neuronal and vascular contributions to the BOLD signal. Neuroimage 195, 89–103. doi: 10.1016/j.neuroimage.2019.03.057
Angenstein, F., Kammerer, E., Niessen, H. G., Frey, J. U., Scheich, H., and Frey, S. (2007). Frequency-dependent activation pattern in the rat hippocampus, a simultaneous electrophysiological and fMRI study. Neuroimage 38, 150–163. doi: 10.1016/j.neuroimage.2007.07.022
Berge, N. V. D., Vanhove, C., Descamps, B., Dauwe, I., van Mierlo, P., Vonck, K., et al. (2015). Functional MRI during hippocampal deep brain stimulation in the healthy rat brain. PLoS ONE 10:e0133245. doi: 10.1371/journal.pone.0133245
Blümcke, I., Thom, M., Aronica, E., Armstrong, D. D., Bartolomei, F., Bernasconi, A., et al. (2013). International consensus classification of hippocampal sclerosis in temporal lobe epilepsy: a task force report from the ILAE commission on diagnostic methods. Epilepsia 54, 1315–1329. doi: 10.1111/epi.12220
Boëx, C., Vulliémoz, S., Spinelli, L., Pollo, C., and Seeck, M. (2007). High and low frequency electrical stimulation in non-lesional temporal lobe epilepsy. Seizure 16, 664–669. doi: 10.1016/j.seizure.2007.05.009
Boon, P., Vonck, K., De Herdt, V., Van Dycke, A., Goethals, M., Goossens, L., et al. (2007). Deep brain stimulation in patients with refractory temporal lobe epilepsy. Epilepsia 48, 1551–1560. doi: 10.1111/j.1528-1167.2007.01005.x
Bouilleret, V., Ridoux, V., Depaulis, A., Marescaux, C., Nehlig, A., and Le Gal La Salle, G. (1999). Recurrent seizures and hippocampal sclerosis following intrahippocampal kainate injection in adult mice: electroencephalography, histopathology and synaptic reorganization similar to mesial temporal lobe epilepsy. Neuroscience 89, 717–729. doi: 10.1016/S0306-4522(98)00401-1
Bragin, A., Wilson, C. L., and Engel, J. (2002). Rate of interictal events and spontaneous seizures in epileptic rats after electrical stimulation of hippocampus and its afferents. Epilepsia 43, 81–85. doi: 10.1046/j.1528-1157.43.s.5.22.x
Canals, S., Beyerlein, M., Murayama, Y., and Logothetis, N. K. (2008). Electric stimulation FMRI of the perforant pathway to the rat hippocampus. Magnet. Reson. Imag. 26, 978–986. doi: 10.1016/j.mri.2008.02.018
Chiang, S., Fan, J. M., and Rao, V. R. (2022). Bilateral temporal lobe epilepsy: how many seizures are required in chronic ambulatory electrocorticography to estimate the laterality ratio?” Epilepsia 63, 199–208. doi: 10.1111/epi.17113
Choi, S.-H., Im, G. H., Choi, S., Yu, X., Bandettini, P. A., Menon, R. S., et al. (2024). No replication of direct neuronal activity–related (DIANA) fMRI in anesthetized mice. Sci. Adv. 10:eadl0999. doi: 10.1126/sciadv.adl0999
Chuang, K. H., Li, Z., Huang, H. H., Gerdekoohi, S. K., and Athwal, D. (2023). Hemodynamic transient and functional connectivity follow structural connectivity and cell type over the brain hierarchy. Proc. Nat. Acad. Sci. 120:e2202435120. doi: 10.1073/pnas.2202435120
Cukiert, A., Cukiert, C. M., Burattini, J. A., and Lima, A. M. (2014). Seizure outcome after hippocampal deep brain stimulation in a prospective cohort of patients with refractory temporal lobe epilepsy. Seizure 23, 6–9. doi: 10.1016/j.seizure.2013.08.005
Cukiert, A., Cukiert, C. M., Burattini, J. A., and Mariani, P. P. (2021). Long-term seizure outcome during continuous bipolar hippocampal deep brain stimulation in patients with temporal lobe epilepsy with or without mesial temporal sclerosis: an observational, open-label study. Epilepsia 62, 190–197. doi: 10.1111/epi.16776
Cukiert, A., Cukiert, C. M., Burattini, J. A., Mariani, P. P., and Bezerra, D. F. (2017). Seizure outcome after hippocampal deep brain stimulation in patients with refractory temporal lobe epilepsy: a prospective, controlled, randomized, double-blind study. Epilepsia 58, 1728–1733. doi: 10.1111/epi.13860
Delorme, A., and Makeig, S. (2004). EEGLAB: an open source toolbox for analysis of single-trial EEG dynamics including independent component analysis. J. Neurosci. Methods 134, 9–21. doi: 10.1016/j.jneumeth.2003.10.009
Duffy, B. A., Choy, M., Chuapoco, M. R., Madsen, M., and Lee, J. H. (2015). MRI compatible optrodes for simultaneous LFP and optogenetic fMRI investigation of seizure-like afterdischarges. Neuroimage 123, 173–184. doi: 10.1016/j.neuroimage.2015.07.038
Duffy, B. A., Choy, M., and Lee, J. H. (2020). Predicting successful generation and inhibition of seizure-like afterdischarges and mapping their seizure networks using fMRI. Cell Reports 30, 2540–2554.e4. doi: 10.1016/j.celrep.2020.01.095
Dunn, J. F., Tuor, U. I., Kmech, J., Young, N. A., Henderson, A. K., Jackson, J. C., et al. (2009). Functional brain mapping at 9.4T using a new MRI-compatible electrode chronically implanted in rats. Magnetic Reson. Med. 61, 222–228. doi: 10.1002/mrm.21803
Durand, D. M., and Bikson, M. (2001). Suppression and control of epileptiform activity by electrical stimulation: a review. Proc. IEEE 89, 1065–1082. doi: 10.1109/5.939821
Eklund, A., Nichols, T. E., and Knutsson, H. (2016). Cluster failure: why fMRI inferences for spatial extent have inflated false-positive rates. Proc. Nat. Acad. Sci. 113, 7900–7905. doi: 10.1073/pnas.1602413113
Fisher, R. S., and Velasco, A. L. (2014). Electrical brain stimulation for epilepsy. Nature Rev. Neurol. 10, 261–270. doi: 10.1038/nrneurol.2014.59
Foutz, T. J., and Wong, M. (2022). Brain stimulation treatments in epilepsy: basic mechanisms and clinical advances. Biomed. J. 45, 27–37. doi: 10.1016/j.bj.2021.08.010
Fregni, F., Thome-Souza, S., Nitsche, M. A., Freedman, S. D., Valente, K. D., and Pascual-Leone, A. (2006). A controlled clinical trial of cathodal DC polarization in patients with refractory epilepsy. Epilepsia 47, 335–342. doi: 10.1111/j.1528-1167.2006.00426.x
Freiman, T. M., Häussler, U., Zentner, J., Doostkam, S., Beck, J., Scheiwe, C., et al. (2021). Mossy fiber sprouting into the hippocampal region CA2 in patients with temporal lobe epilepsy. Hippocampus 31, 580–592. doi: 10.1002/hipo.23323
Gill, R. S., Mirsattari, S. M., and Leung, L. S. (2017). Resting state functional network disruptions in a kainic acid model of temporal lobe epilepsy. NeuroImage. Clini. 13, 70–81. doi: 10.1016/j.nicl.2016.11.002
Grandjean, J., Schroeter, A., Batata, I., and Rudin, M. (2014). Optimization of anesthesia protocol for resting-state fMRI in mice based on differential effects of anesthetics on functional connectivity patterns. Neuroimage 102, 838–847. doi: 10.1016/j.neuroimage.2014.08.043
Grossman, N., Bono, D., Dedic, N., Kodandaramaiah, S. B., Rudenko, A., Suk, H. J., et al. (2017). Noninvasive deep brain stimulation via temporally interfering electric fields. Cell 169, 1029–1041.e16. doi: 10.1016/j.cell.2017.05.024
Häussler, U., Bielefeld, L., Froriep, U. P., Wolfart, J., and Haas, C. A. (2012). Septotemporal position in the hippocampal formation determines epileptic and neurogenic activity in temporal lobe epilepsy. Cerebral Cortex 22, 26–36. doi: 10.1093/cercor/bhr054
Häussler, U., Rinas, K., Kilias, A., Egert, U., and Haas, C. A. (2016). Mossy fiber sprouting and pyramidal cell dispersion in the hippocampal CA2 region in a mouse model of temporal lobe epilepsy. Hippocampus 26, 577–588. doi: 10.1002/hipo.22543
Hemb, M., Palmini, A., Paglioli, E., Paglioli, E. B., da Costa, J. C., Azambuja, N., et al. (2013). An 18-year follow-up of seizure outcome after surgery for temporal lobe epilepsy and hippocampal sclerosis. J. Neurol. Neurosurg. Psychiat. 84, 800–805. doi: 10.1136/jnnp-2012-304038
Immonen, A., Jutila, L., Muraja-Murro, A., Mervaala, E., Äikiä, M., Lamusuo, S., et al. (2010). Long-term epilepsy surgery outcomes in patients with mri-negative temporal lobe epilepsy. Epilepsia 51, 2260–2269. doi: 10.1111/j.1528-1167.2010.02720.x
Janke, A. L., and Ullmann, J. F. P. (2015). Robust methods to create ex vivo minimum deformation atlases for brain mapping. Meth. Spat. Mapping Multi-Modal Data Neurosci. 73, 18–26. doi: 10.1016/j.ymeth.2015.01.005
Janz, P., Hauser, P., Heining, K., Nestel, S., Kirsch, M., Egert, U., et al. (2018). Position- and time-dependent arc expression links neuronal activity to synaptic plasticity during epileptogenesis. Front. Cell. Neurosci. 12:244. doi: 10.3389/fncel.2018.00244
Janz, P., Savanthrapadian, S., Häussler, U., Kilias, A., Nestel, S., Kretz, O., et al. (2017a). Synaptic remodeling of entorhinal input contributes to an aberrant hippocampal network in temporal lobe epilepsy. Cereb. Cortex 27, 2348–2364. doi: 10.1093/cercor/bhw093
Janz, P., Schwaderlapp, N., Heining, K., Häussler, U., Korvink, J. G., von Elverfeldt, D., et al. (2017b). Early tissue damage and microstructural reorganization predict disease severity in experimental epilepsy. ELife 6:e25742. doi: 10.7554/eLife.25742
Jones, S. E., Zhang, M., Avitsian, R., Bhattacharyya, P., Bulacio, J., Cendes, F., et al. (2014). Functional magnetic resonance imaging networks induced by intracranial stimulation may help defining the epileptogenic zone. Brain Connect. 4, 286–298. doi: 10.1089/brain.2014.0225
Khambhati, A. N., Shafi, A., Rao, V. R., and Chang, E. F. (2021). Long-term brain network reorganization predicts responsive neurostimulation outcomes for focal epilepsy. Sci. Transl. Med. 13:eabf6588. doi: 10.1126/scitranslmed.abf6588
Klinger, N., and Mittal, S. (2018). Deep brain stimulation for seizure control in drug-resistant epilepsy. Neurosurg. Focus 45:E4. doi: 10.3171/2018.4.FOCUS1872
Kokkinos, V., Sisterson, N. D., Wozny, T. A., and Richardson, R. M. (2019). Association of closed-loop brain stimulation neurophysiological features with seizure control among patients with focal epilepsy. JAMA Neurol. 76, 800–808. doi: 10.1001/jamaneurol.2019.0658
Koubeissi, M. Z., Joshi, S., Eid, A., Emami, M., Jaafar, N., Syed, T., et al. (2022). Low-frequency stimulation of a fiber tract in bilateral temporal lobe epilepsy. Epilep. Behav. 130:108667. doi: 10.1016/j.yebeh.2022.108667
Koubeissi, M. Z., Kahriman, E., Syed, T. U., Miller, J., and Durand, D. M. (2013). Low-frequency electrical stimulation of a fiber tract in temporal lobe epilepsy. Ann. Neurol. 74, 223–231. doi: 10.1002/ana.23915
Krook-Magnuson, E., Armstrong, C., Bui, A., Lew, S., Oijala, M., and Soltesz, I. (2015). In vivo evaluation of the dentate gate theory in epilepsy. J. Physiol. 593, 2379–2388. doi: 10.1113/JP270056
Krook-Magnuson, E., Armstrong, C., Oijala, M., and Soltesz, I. (2013). On-demand optogenetic control of spontaneous seizures in temporal lobe epilepsy. Nat. Commun. 4:1376. doi: 10.1038/ncomms2376
Lee, H., Li, Z., Coulson, E. J., and Chuang, K.-H. (2019). Ultrafast fMRI of the rodent brain using simultaneous multi-slice EPI. Neuroimage 195, 48–58. doi: 10.1016/j.neuroimage.2019.03.045
Lévesque, M., and Avoli, M. (2013). The Kainic Acid model of temporal lobe epilepsy. Neurosci. Biobehav. Rev. 37, 2887–2899. doi: 10.1016/j.neubiorev.2013.10.011
Li, L., He, L., Harris, N., Zhou, Y., Engel, J., and Bragin, A. (2021). Topographical reorganization of brain functional connectivity during an early period of epileptogenesis. Epilepsia 62, 1231–1243. doi: 10.1111/epi.16863
Li, M. C. H., and Cook, M. J. (2018). Deep brain stimulation for drug-resistant epilepsy. Epilepsia 59, 273–290. doi: 10.1111/epi.13964
Lim, S.-N., Lee, C.-Y., Lee, S.-T., Tu, P.-H., Chang, B.-L., Lee, C.-H., et al. (2016). Low and high frequency hippocampal stimulation for drug-resistant mesial temporal lobe epilepsy. Neuromodulation 19, 365–372. doi: 10.1111/ner.12435
Liu, J., Duffy, B. A., Bernal-Casas, D., Fang, Z., and Lee, J. H. (2017). Comparison of fMRI analysis methods for heterogeneous BOLD responses in block design studies. Neuroimage 147, 390–408. doi: 10.1016/j.neuroimage.2016.12.045
Loh, A., Gwun, D., Chow, C. T., Boutet, A., Tasserie, J., Germann, J., et al. (2022). Probing responses to deep brain stimulation with functional magnetic resonance imaging. Brain Stimul. 15, 683–694. doi: 10.1016/j.brs.2022.03.009
Manzouri, F., Meisel, C., Kunz, L., Dümpelmann, M., Stieglitz, T., and Schulze-Bonhage, A. (2021). Low-frequency electrical stimulation reduces cortical excitability in the human brain. NeuroImage. Clini. 31:102778. doi: 10.1016/j.nicl.2021.102778
Marx, M., Haas, C. A., and Häussler, U. (2013). Differential vulnerability of interneurons in the epileptic hippocampus. Front. Cell. Neurosci. 7:167. doi: 10.3389/fncel.2013.00167
Middlebrooks, E., Jain, A., Okromelidze, L., Lin, C., Westerhold, E. M., O'Steen, C. A., et al. (2021). Acute brain activation patterns of high- versus low-frequency stimulation of the anterior nucleus of the thalamus during deep brain stimulation for epilepsy. Neurosurgery 89, 901–908. doi: 10.1093/neuros/nyab306
Mohan, M., Keller, S., Nicolson, A., Biswas, S., Smith, D., Farah, J. O., et al. (2018). The long-term outcomes of epilepsy surgery. PLoS ONE 13:e0196274. doi: 10.1371/journal.pone.0196274
Moreno, A., Morris, R. G. M., and Canals, S. (2016). Frequency-dependent gating of hippocampal–neocortical interactions. Cerebral Cortex 26, 2105–2114. doi: 10.1093/cercor/bhv033
Neudorfer, C., Chow, C. T., Boutet, A., Loh, A., Germann, J., Elias, G. J. B., et al. (2021). Kilohertz-frequency stimulation of the nervous system: a review of underlying mechanisms. Brain Stimul. 14, 513–530. doi: 10.1016/j.brs.2021.03.008
Niranjan, A., Christie, I. N., Solomon, S. G., Wells, J. A., and Lythgoe, M. F. (2016). fMRI mapping of the visual system in the mouse brain with interleaved snapshot GE-EPI. Neuroimage 139, 337–345. doi: 10.1016/j.neuroimage.2016.06.015
Padmasola, G. P., Friscourt, F., Rigoni, I., Vulliémoz, S., Schaller, K., Michel, C. M., et al. (2024). Involvement of the contralateral hippocampus in ictal-like but not interictal epileptic activities in the kainate mouse model of temporal lobe epilepsy. Epilepsia 65, 2082–2098. doi: 10.1111/epi.17970
Pallud, J., Häussler, U., Langlois, M., Hamelin, S., Devaux, B., Deransart, C., et al. (2011). Dentate gyrus and hilus transection blocks seizure propagation and granule cell dispersion in a mouse model for mesial temporal lobe epilepsy. Hippocampus 21, 334–343. doi: 10.1002/hipo.20795
Paschen, E., Elgueta, C., Heining, K., Vieira, D. M., Kleis, P., Orcinha, C., et al. (2020). Hippocampal low-frequency stimulation prevents seizure generation in a mouse model of mesial temporal lobe epilepsy. ELife 9:e54518. doi: 10.7554/eLife.54518
Paschen, E., Kleis, P., Vieira, D. M., Heining, K., Boehler, C., Egert, U., et al. (2023). On-demand low-frequency stimulation for seizure control: efficacy and behavioural implications. Brain 147:awad299. doi: 10.1101/2023.04.17.537172
Poser, B. A., Versluis, M. J., Hoogduin, J. M., and Norris, D. G. (2006). BOLD contrast sensitivity enhancement and artifact reduction with multiecho EPI: parallel-acquired inhomogeneity-desensitized fMRI. Magnetic Reson. Med. 55, 1227–1235. doi: 10.1002/mrm.20900
Pradier, B., Wachsmuth, L., Nagelmann, N., Segelcke, D., Kreitz, S., Hess, A., et al. (2021). Combined resting state-fMRI and calcium recordings show stable brain states for task-induced fMRI in mice under combined ISO/MED anesthesia. Neuroimage 245:118626. doi: 10.1016/j.neuroimage.2021.118626
Rajdev, P., Ward, M., and Irazoqui, P. (2011). Effect of stimulus parameters in the treatment of seizures by electrical stimulation in the kainate animal model. Int. J. Neural Syst. 21:151–162. doi: 10.1142/S0129065711002730
Rashid, S., Pho, G., Czigler, M., Werz, M. A., and Durand, D. M. (2012). Low frequency stimulation of ventral hippocampal commissures reduces seizures in a rat model of chronic temporal lobe epilepsy. Epilepsia 53, 147–156. doi: 10.1111/j.1528-1167.2011.03348.x
Riban, V., Bouilleret, V., Pham, -L.ê B. T, Fritschy, J.-M., Marescaux, C., and Depaulis, A. (2002). Evolution of hippocampal epileptic activity during the development of hippocampal sclerosis in a mouse model of temporal lobe epilepsy. Neuroscience 112, 101–111. doi: 10.1016/S0306-4522(02)00064-7
Richards, K., Watson, C., Buckley, R. F., Kurniawan, N. D., Yang, Z., Keller, M. D., et al. (2011). Segmentation of the mouse hippocampal formation in magnetic resonance images. Neuroimage 58, 732–740. doi: 10.1016/j.neuroimage.2011.06.025
Riemann, S., Helbing, C., and Angenstein, F. (2017). From unspecific to adjusted, how the BOLD response in the rat hippocampus develops during consecutive stimulations. J. Cereb. Blood Flow Metabol. 37, 590–604. doi: 10.1177/0271678X16634715
Salam, M., Tariqus, M., Velazquez, J. L. P., and Genov, R. (2016). Seizure suppression efficacy of closed-loop versus open-loop deep brain stimulation in a rodent model of epilepsy. IEEE Trans. Neural Syst. Rehabilitat. Eng. 24, 710–719. doi: 10.1109/TNSRE.2015.2498973
Simpson, H., Schulze-Bonhage, A., Cascino, G. D., Fisher, R. S., Jobst, B. C., Sperling, M. R., et al. (2022). Practical considerations in epilepsy neurostimulation. Epilepsia 63, 2445–2460. doi: 10.1111/epi.17329
Steigerwald, F., Matthies, C., and Volkmann, J. (2019). directional deep brain stimulation. Neurotherapeutics 16, 100–104. doi: 10.1007/s13311-018-0667-7
Sudbrack-Oliveira, P., Barbosa, M. Z., Thome-Souza, S., Razza, L. B., Gallucci-Neto, J., Valiengo, C. L., et al. (2021). Transcranial direct current stimulation (TDCS) in the management of epilepsy: a systematic review. Seizure 86, 85–95. doi: 10.1016/j.seizure.2021.01.020
Tellez-Zenteno, J. F., McLachlan, R. S., Parrent, A., Kubu, C. S., and Wiebe, S. (2006). Hippocampal electrical stimulation in mesial temporal lobe epilepsy. Neurology 66, 1490–1494. doi: 10.1212/01.wnl.0000209300.49308.8f
Thom, M. (2014). Review: hippocampal sclerosis in epilepsy: a neuropathology review. Neuropathol. Appl. Neurobiol. 40, 520–543. doi: 10.1111/nan.12150
Thom, M., Sisodiya, S. M., Beckett, A., Martinian, L., Lin, W.-R., Harkness, W., et al. (2002). Cytoarchitectural abnormalities in hippocampal sclerosis. J. Neuropathol. Exp. Neurol. 61, 510–519. doi: 10.1093/jnen/61.6.510
Thompson, H., Nair, R., Oya, H., Esteban, O., Shine, J. M., Petkov, C. I., et al. (2020). A Data Resource from concurrent intracranial stimulation and functional MRI of the human brain. Scientific Data 7:258. doi: 10.1038/s41597-020-00595-y
Toi, P. T., Jang, H. J., Min, K., Kim, S.-P., Lee, S.-K., Lee, J., et al. (2022). In vivo direct imaging of neuronal activity at high temporospatial resolution. Science 378, 160–168. doi: 10.1126/science.abh4340
Tulke, S., Haas, C. A., and Häussler, U. (2019). Expression of brain-derived neurotrophic factor and structural plasticity in the dentate gyrus and CA2 region correlate with epileptiform activity. Epilepsia 60, 1234–1247. doi: 10.1111/epi.15540
Van Nieuwenhuyse, B., Raedt, R., Delbeke, J., Wadman, W. J., Boon, P., and Vonck, K. (2015). In search of optimal DBS paradigms to treat epilepsy: bilateral versus unilateral hippocampal stimulation in a rat model for temporal lobe epilepsy. Brain Stimul. 8, 192–199. doi: 10.1016/j.brs.2014.11.016
Velasco, A. L., Velasco, F., Velasco, M., Trejo, D., Castro, G., and Carrillo-Ruiz, J. D. (2007). Electrical stimulation of the hippocampal epileptic foci for seizure control: a double-blind, long-term follow-up study. Epilepsia 48, 1895–1903. doi: 10.1111/j.1528-1167.2007.01181.x
Velasco, F., Saucedo-Alvarado, P. E., Vazquez-Barron, D., Trejo, D., and Velasco, A. L. (2022). Deep brain stimulation for refractory temporal lobe epilepsy. current status and future trends. Front. Neurol. 13:796846. doi: 10.3389/fneur.2022.796846
Vergaelen, M., Manzella, S., Vonck, K., Craey, E., Spanoghe, J., Sprengers, M., et al. (2024). Increased dentate gyrus excitability in the intrahippocampal kainic acid mouse model for temporal lobe epilepsy. Int. J. Mol. Sci. 25:660. doi: 10.3390/ijms25010660
Violante, I. R., Alania, K., Cassar, à A. M, Neufeld, E., Acerbo, E., Carron, R., et al. (2023). Non-invasive temporal interference electrical stimulation of the human hippocampus. Nat. Neurosci. 26, 1994–2004. doi: 10.1038/s41593-023-01456-8
Vonck, K., Sprengers, M., Carrette, E., Dauwe, I., Miatton, M., Meurs, A., et al. (2013). A decade of experience with deep brain stimulation for patients with refractory medial temporal lobe epilepsy. Int. J. Neural Syst. 23:1250034. doi: 10.1142/S0129065712500347
Weitz, A., Fang, Z., Lee, H. J., Fisher, R. S., Smith, W. C., Choy, M., et al. (2015). Optogenetic fMRI reveals distinct, frequency-dependent networks recruited by dorsal and intermediate hippocampus stimulations. Neuroimage 107, 229–241. doi: 10.1016/j.neuroimage.2014.10.039
Wiebe, S., Blume, W. T., Girvin, J. P., and Eliasziw, M. (2001). A randomized, controlled trial of surgery for temporal-lobe epilepsy. New Engl. J. Med. 345, 311–318. doi: 10.1056/NEJM200108023450501
Woo, C., Krishnan, A., and Wager, T. D. (2014). Cluster-extent based thresholding in fMRI analyses: pitfalls and recommendations. Neuroimage 91, 412–419. doi: 10.1016/j.neuroimage.2013.12.058
Woolrich, M. W., Behrens, T. E. J., Beckmann, C. F., Jenkinson, M., and Smith, S. M. (2004). Multilevel linear modelling for fMRI group analysis using Bayesian inference. Neuroimage 21, 1732–1747. doi: 10.1016/j.neuroimage.2003.12.023
Woolrich, M. W., Ripley, B. D., Brady, M., and Smith, S. M. (2001). Temporal autocorrelation in univariate linear modeling of fMRI data. Neuroimage 14, 1370–1386. doi: 10.1006/nimg.2001.0931
Wyckhuys, T., Boon, P., Raedt, R., Nieuwenhuyse, B. V., Vonck, K., and Wadman, W. (2010). Suppression of hippocampal epileptic seizures in the kainate rat by poisson distributed stimulation. Epilepsia 51, 2297–2304. doi: 10.1111/j.1528-1167.2010.02750.x
Yu, T., Wang, X., Li, Y., Zhang, G., Worrell, G., Chauvel, P., et al. (2018). High-frequency stimulation of anterior nucleus of thalamus desynchronizes epileptic network in humans. Brain: J. Neurol. 141, 2631–2643. doi: 10.1093/brain/awy187
Keywords: DBS, fMRI, epilepsy, kainate mouse model, TLE, hippocampus
Citation: Schwaderlapp N, Paschen E, LeVan P, von Elverfeldt D and Haas CA (2024) Probing hippocampal stimulation in experimental temporal lobe epilepsy with functional MRI. Front. Neuroimaging 3:1423770. doi: 10.3389/fnimg.2024.1423770
Received: 26 April 2024; Accepted: 29 July 2024;
Published: 14 August 2024.
Edited by:
Nathalie Just, Copenhagen University Hospital, DenmarkReviewed by:
Adam Williamson, Linköping University, SwedenEkaterina Paasonen, University of Eastern Finland, Finland
Hsu-Lei Lee, Cedars Sinai Medical Center, United States
Copyright © 2024 Schwaderlapp, Paschen, LeVan, von Elverfeldt and Haas. This is an open-access article distributed under the terms of the Creative Commons Attribution License (CC BY). The use, distribution or reproduction in other forums is permitted, provided the original author(s) and the copyright owner(s) are credited and that the original publication in this journal is cited, in accordance with accepted academic practice. No use, distribution or reproduction is permitted which does not comply with these terms.
*Correspondence: Niels Schwaderlapp, bmllbHMuc2Nod2FkZXJsYXBwQHVuaWtsaW5pay1mcmVpYnVyZy5kZQ==