 Richard Novobilský1,2Petra Bartova1,2Karin Lichá3
 Michal Bar1,2
 David Stejskal3,4
 Pavlína Kusnierova3,4*
- 1Department of Neurology, University Hospital Ostrava, Ostrava, Czechia
- 2Department of Clinical Neurosciences, University of Ostrava, Ostrava, Czechia
- 3Department of Clinical Biochemistry, Institute of Laboratory Medicine, University Hospital Ostrava, Ostrava, Czechia
- 4Institute of Laboratory Medicine, University of Ostrava, Ostrava, Czechia
Background: Serum neurofilament light chain (S NfL) is a non-specific marker of neuronal damage, including Alzheimer’s disease (AD). We aimed to verify the reference interval (RI) of serum NfL using a highly sensitive ELISA, and to estimate the optimal cut-off value for neuronal damage. Our second objective was to compare NfL in cerebrospinal fluid (CSF) and serum (S) with the routine neurodegeneration biomarkers used in AD, and to assess their concentrations relative to the degree of cognitive deficit.
Methods: Samples from 124 healthy volunteers were used to estimate the S NfL RI. For the comparison study, we used CSF and S samples from 112 patients with cognitive disorders. Cognitive functions were assessed using the mini-mental state examination. ELISA assays were used to determine the CSF and S NfL levels, CSF β-amyloid peptide42 (Aβ42), CSF β-amyloid peptide40 (Aβ40), CSF total tau protein (tTau), CSF phosphorylated tau protein (pTau), and CSF alpha-synuclein (αS).
Results: The estimated RI of S NfL were 2.25–9.19 ng.L–1. The cut-off value of S NfL for assessing the degree of neuronal impairment was 10.5 ng.L–1. We found a moderate statistically significant correlation between S NfL and CSF Aβ42 in the group with movement disorders, without dementia (rs = 0.631; p = 0.016); between S NfL and CSF Aβ40 in the group with movement disorder plus dementia (rs = −0.750; p = 0.052); between S NfL and CSF tTau in the control group (rs = 0.689; p = 0.009); and between S NfL and CSF pTau in the control group (rs = 0.749; p = 0.003). The non-parametric Kruskal–Wallis test revealed statistically significant differences between S NfL, CSF NfL, CSF Aβ42, CSF tTau, and CSF pTau and diagnosis within groups. The highest kappa coefficients were found between the concentrations of S NfL and CSF NfL (κ = 0.480) and between CSF NfL and CSF tTau (κ = 0.351).
Conclusion: Our results suggested that NfL and tTau in CSF of patients with cognitive decline could be replaced by the less-invasive determination of S NfL using a highly sensitive ELISA method. S NfL reflected the severity of cognitive deficits assessed by mini-mental state examination (MMSE). However, S NfL is not specific to AD and does not appear to be a suitable biomarker for early diagnosis of AD.
1 Introduction
Neurodegenerative diseases constitute a broad group of diseases of the nervous system. They typically involve the progressive and irreversible loss of specific neuron populations in distinct brain and spine localizations, which result in diverse clinical manifestations, most often dementia and movement disorders. It has recently been theorized that the neurodegeneration process is caused by the precipitation of specific proteins in the tissue, leading to inflammation and apoptosis (Dugger and Dickson, 2017; Ciccocioppo et al., 2020).
Neurodegenerative diseases are most common in people over 65 years of age, their prevalence increases with age, and it is estimated that the number of people with dementia will double in the next 30 years due to increasing life expectancy (Ferri et al., 2005; Nichols et al., 2019). Therefore, laboratory biomarkers are being sought to help diagnose neurodegenerative disease in its early stages. In addition to the determination of β-amyloid42 (Aβ42), total tau protein (tTau), and phosphorylated tau protein181 (pTau), attention is now focused on evaluation of neurofilaments (Nf). The major structural proteins of neurons, Nfs are class IV intermediate filaments that are selectively expressed in neurons. Abnormal concentrations have been observed with axonal damage in neurodegenerative, inflammatory, vascular, and traumatic diseases, in both cerebrospinal fluid (CSF) and serum (S). Due to their high specificity for neuronal cell damage and eventual death, Nf levels are an important parameter for monitoring and predicting the progression of various acute and chronic neurological diseases, and for evaluating the efficacy of therapy (Khalil et al., 2018; Revendova et al., 2022).
The main objective of the present study was to verify the reference interval (RI) of serum neurofilament light chain (NfL) in a control population, using a highly sensitive serum ELISA, and to estimate the optimal cut-off value indicating neuronal damage. The second objective was to compare the determination of NfL in CSF and S, using a highly sensitive ELISA method, with the routine neurodegeneration biomarkers measured in Alzheimer’s disease (AD), and to study their concentrations relative to the degree of cognitive deficit among patients with neurodegenerative diseases.
2 Materials and methods
2.1 Patients and data collection
To determine the reference values for S NfL, serum samples were collected from healthy adults from the Blood Centre of the University Hospital Ostrava (n = 124, average age 43.8 ± 10.1 years; 60 females, average age 43.4 ± 10.0 years; 64 males, average age 44.1 ± 10.4 years). Outlying results (n = 8) were excluded from further statistical processing of the data. Except for gender and age, all other patient data were anonymous. All volunteers were healthy and were not taking any medication.
For comparative analysis, CSF and S samples were collected from patients attending the Outpatient Clinic for Movement and Cognitive Disorders at the University Hospital Ostrava, Czechia, who were included in a single-center prospective cohort study (n = 115, average age 67.1 ± 11.5 years; 66 females, average age 67.7 ± 11.5 years; 49 males, average age 66.2 ± 11.5 years). CSF of standardized volume (10 ± 1 ml) from all patients was obtained through a lumbar puncture in intervertebral space L3/L4, L4/5 or L5/S1. The inclusion criteria were: (1) gave signed informed consent for study inclusion; (2) brain imaging (CT or MRI) performed to exclude space-occupying brain lesions (e.g., tumor, brain contusion, multiple sclerosis, normal-pressure hydrocephalus, and large postischemic or posthemorrhagic lesion); (3) other causes of cognitive deficit excluded by laboratory examination (e.g., ion imbalance, anemia, B12 hypovitaminosis, Wilson’s disease, and thyroid disorder); and (4) a mini-mental state examination (MMSE) score of ≤25/30 points, with a temporal aspect of at least 6 months of clinical symptoms affecting daily activities; or (5) a neurodegenerative movement disorder, with primary complaints other than dementia [Parkinson’s disease (PD), multiple system atrophy, progressive supranuclear palsy, etc.] without cognitive deficit (MMSE score of >25/30 points). The exclusion criterion was: age of <18 years. The baseline data of the prospective study were used for the study of cognitive deficit. The control group included patients with an MMSE score of >28/30 and without clinical signs of parkinsonism (tremor, rigidity, bradykinesia, hypokinesia, and gait disturbance) following examination by an experienced neurologist. The cut-off score of 25 points on the MMSE was established according to the limitation of reimbursement by Czech insurance for treatment of AD. Five patients with severe dementia could not complete the MMSE because of their non-cooperation.
Patients were subdivided into groups: Group 1, AD according to NIA-AA research criteria for AD (Jack et al., 2018) (n = 33; average age 71.3 ± 9.2 years); Group 2, non-Alzheimer’s dementia (n = 32; average age 70.4 ± 9.9 years); Group 3, PD and patients with movement disorder without cognitive deficit (n = 24; average age 62.8 ± 10.9 years); Group 4, combination of cognitive syndrome and movement disorder (n = 10; average age 67.8 ± 13.1 years); and Group 5, healthy controls (n = 16; average age 57.6 ± 11.7 years). The diagnoses in Group 1 included AD according to NIA-AA research criteria for AD without dementia (n = 5), AD according to NIA-AA research criteria for AD (n = 9), and AD established by an experienced neurologist when patients did not agree to undergo lumbar puncture (n = 19). In Group 2, the Non-Alzheimer dementias comprised vascular dementia (n = 15); frontotemporal dementia (FTD, n = 8), Lyme neuroborreliosis (n = 3), alcohol-related dementia (n = 3), Creutzfeldt-Jakob disease (CJD, n = 2), and primary progressive aphasia (n = 1). Group 3 comprised patients with PD established by an experienced neurologist according to the criteria of the Movement Disorder Society (Postuma et al., 2015) (n = 14) and patients with movement disorders other than PD without dementia (n = 10) including multiple system atrophy (n = 4), progressive supranuclear palsy (n = 2), dystonia (n = 2), Huntington’s disease (n = 1), and essential tremor plus syndrome (n = 1). Group 4 Combination of cognitive syndrome and movement disorder consisted of patients with Lewy body disease (n = 6), Multiple system atrophy (n = 2), Spinocerebellar ataxia (n = 1), and progressive supranuclear palsy (n = 1).
2.2 Samples
All CSF samples were collected with an atraumatic needle into polypropylene tubes (Sarstedt, Nümbrecht, Germany). Serum samples were collected into a Serum Gel with Clotting Activator tube (Sarstedt). CSF samples were centrifuged at 390 × g for 10 min at room temperature, and serum samples were centrifuged at 2,500 × g for 6 min at 4°C. Both the CSF and serum samples were aliquoted into at least three vials (0.3 ml per vial) and stored at −70°C until analysis.
2.3 Analytical methods
The concentrations of CSF NfL and S NfL were determined by ELISA assays (NF-light® ELISA CE, REF. 10-7001; NF-light™ Serum ELISA RUO, REF. 20-8002, UmanDiagnostics, A Quanterix Company). The manufacturers stated that the limits of detection were 33 ng.L for CSF NfL, and 0.4 ng.L for S NfL. All samples were analyzed in duplicates. CSF NfL and S NfL were measured in 2× diluted CSF and 4× diluted serum.
Concentrations of other biomarkers of neurodegenerative damage were determined by ELISA methods using the following diagnostic kits: Total-Tau-ELISA, REF. EQ 6531-9601-L; Beta-Amyloid (1-42)-ELISA, REF. EQ 6521-9601-L; Beta-Amyloid (1-40)-ELISA, REF. EQ 6511-9601-L and pTau(181) ELISA, REF EQ-6591-9601-L (Euroimmun); and Alpha-Synuclein ELISA, REF EQ 6545-9601-L. Undiluted CSF samples were used. The detection limits were 28 ng.L–1 for CSF tTau, 1.5 ng.L–1 for CSF pTau, 41 ng.L–1 for CSF Aβ40, 6.5 ng.L–1 for Aβ42, and 19 ng.L–1 for CSF αS.
2.4 Statistical methods
Microsoft Excel and MedCal version 17.9.7. were used for statistical data processing. Reference intervals (RI) were estimated based on the guidelines of the Clinical and Laboratory Standards Institute (CLSI C28-A3) (Clinical and Laboratory Standards Institute [CLSI], 2008; Pavlov et al., 2010). A robust method was used due to the sample size (n < 120).
The diagnostic value of S NfL was evaluated by receiver operating characteristics (ROC) curve analysis. The sensitivity and specificity, and 95% confidence interval (CI) were considered against the group involving any cognitive deficit. An area under the curve (AUC) of >0.9 was considered to have excellent diagnostic power.
Basic descriptive statistics were used to describe patient data, including tables of frequencies, minimum and maximum values, medians, arithmetic means, and standard deviations. Relationships between the biomarkers were assessed using Spearman’s correlation coefficient. The Shapiro–Wilk test was used to assess the normality of residues in the analysis of variance (ANOVA). Due to the non-normal distribution of data, non-parametric tests were used, including the Kruskal–Wallis rank test. The Dunn test was used for the post hoc analysis. The kappa statistic was used to assess the agreement between methods based on clinical interpretation (McHugh, 2012). Data values were categorized as positive and negative. Stepwise multinomial linear regression analysis was performed to assess the effects of biochemical markers on MMSE values. All statistical tests were assessed at the 5% significance level.
3 Results
3.1 Estimation of reference intervals, sensitivity, and specificity of S NfL using a highly sensitive ELISA method
The total reference values of S NfL were 2.25–9.19 ng.L–1, and the data showed statistically significant age dependence (r = 0.55; p < 0.001) (Figure 1A). On the other hand, age dependence of S NfL was not observed among patients from the Outpatient Clinic for Movement and Cognitive Disorders (Figure 1B). A more detailed analysis revealed that the patients with a cognitive syndrome plus movement disorder (Group 4) exhibited a negative slope of the dependence of S NfL on age, which affected the outcome of the whole study population (Figure 1C).
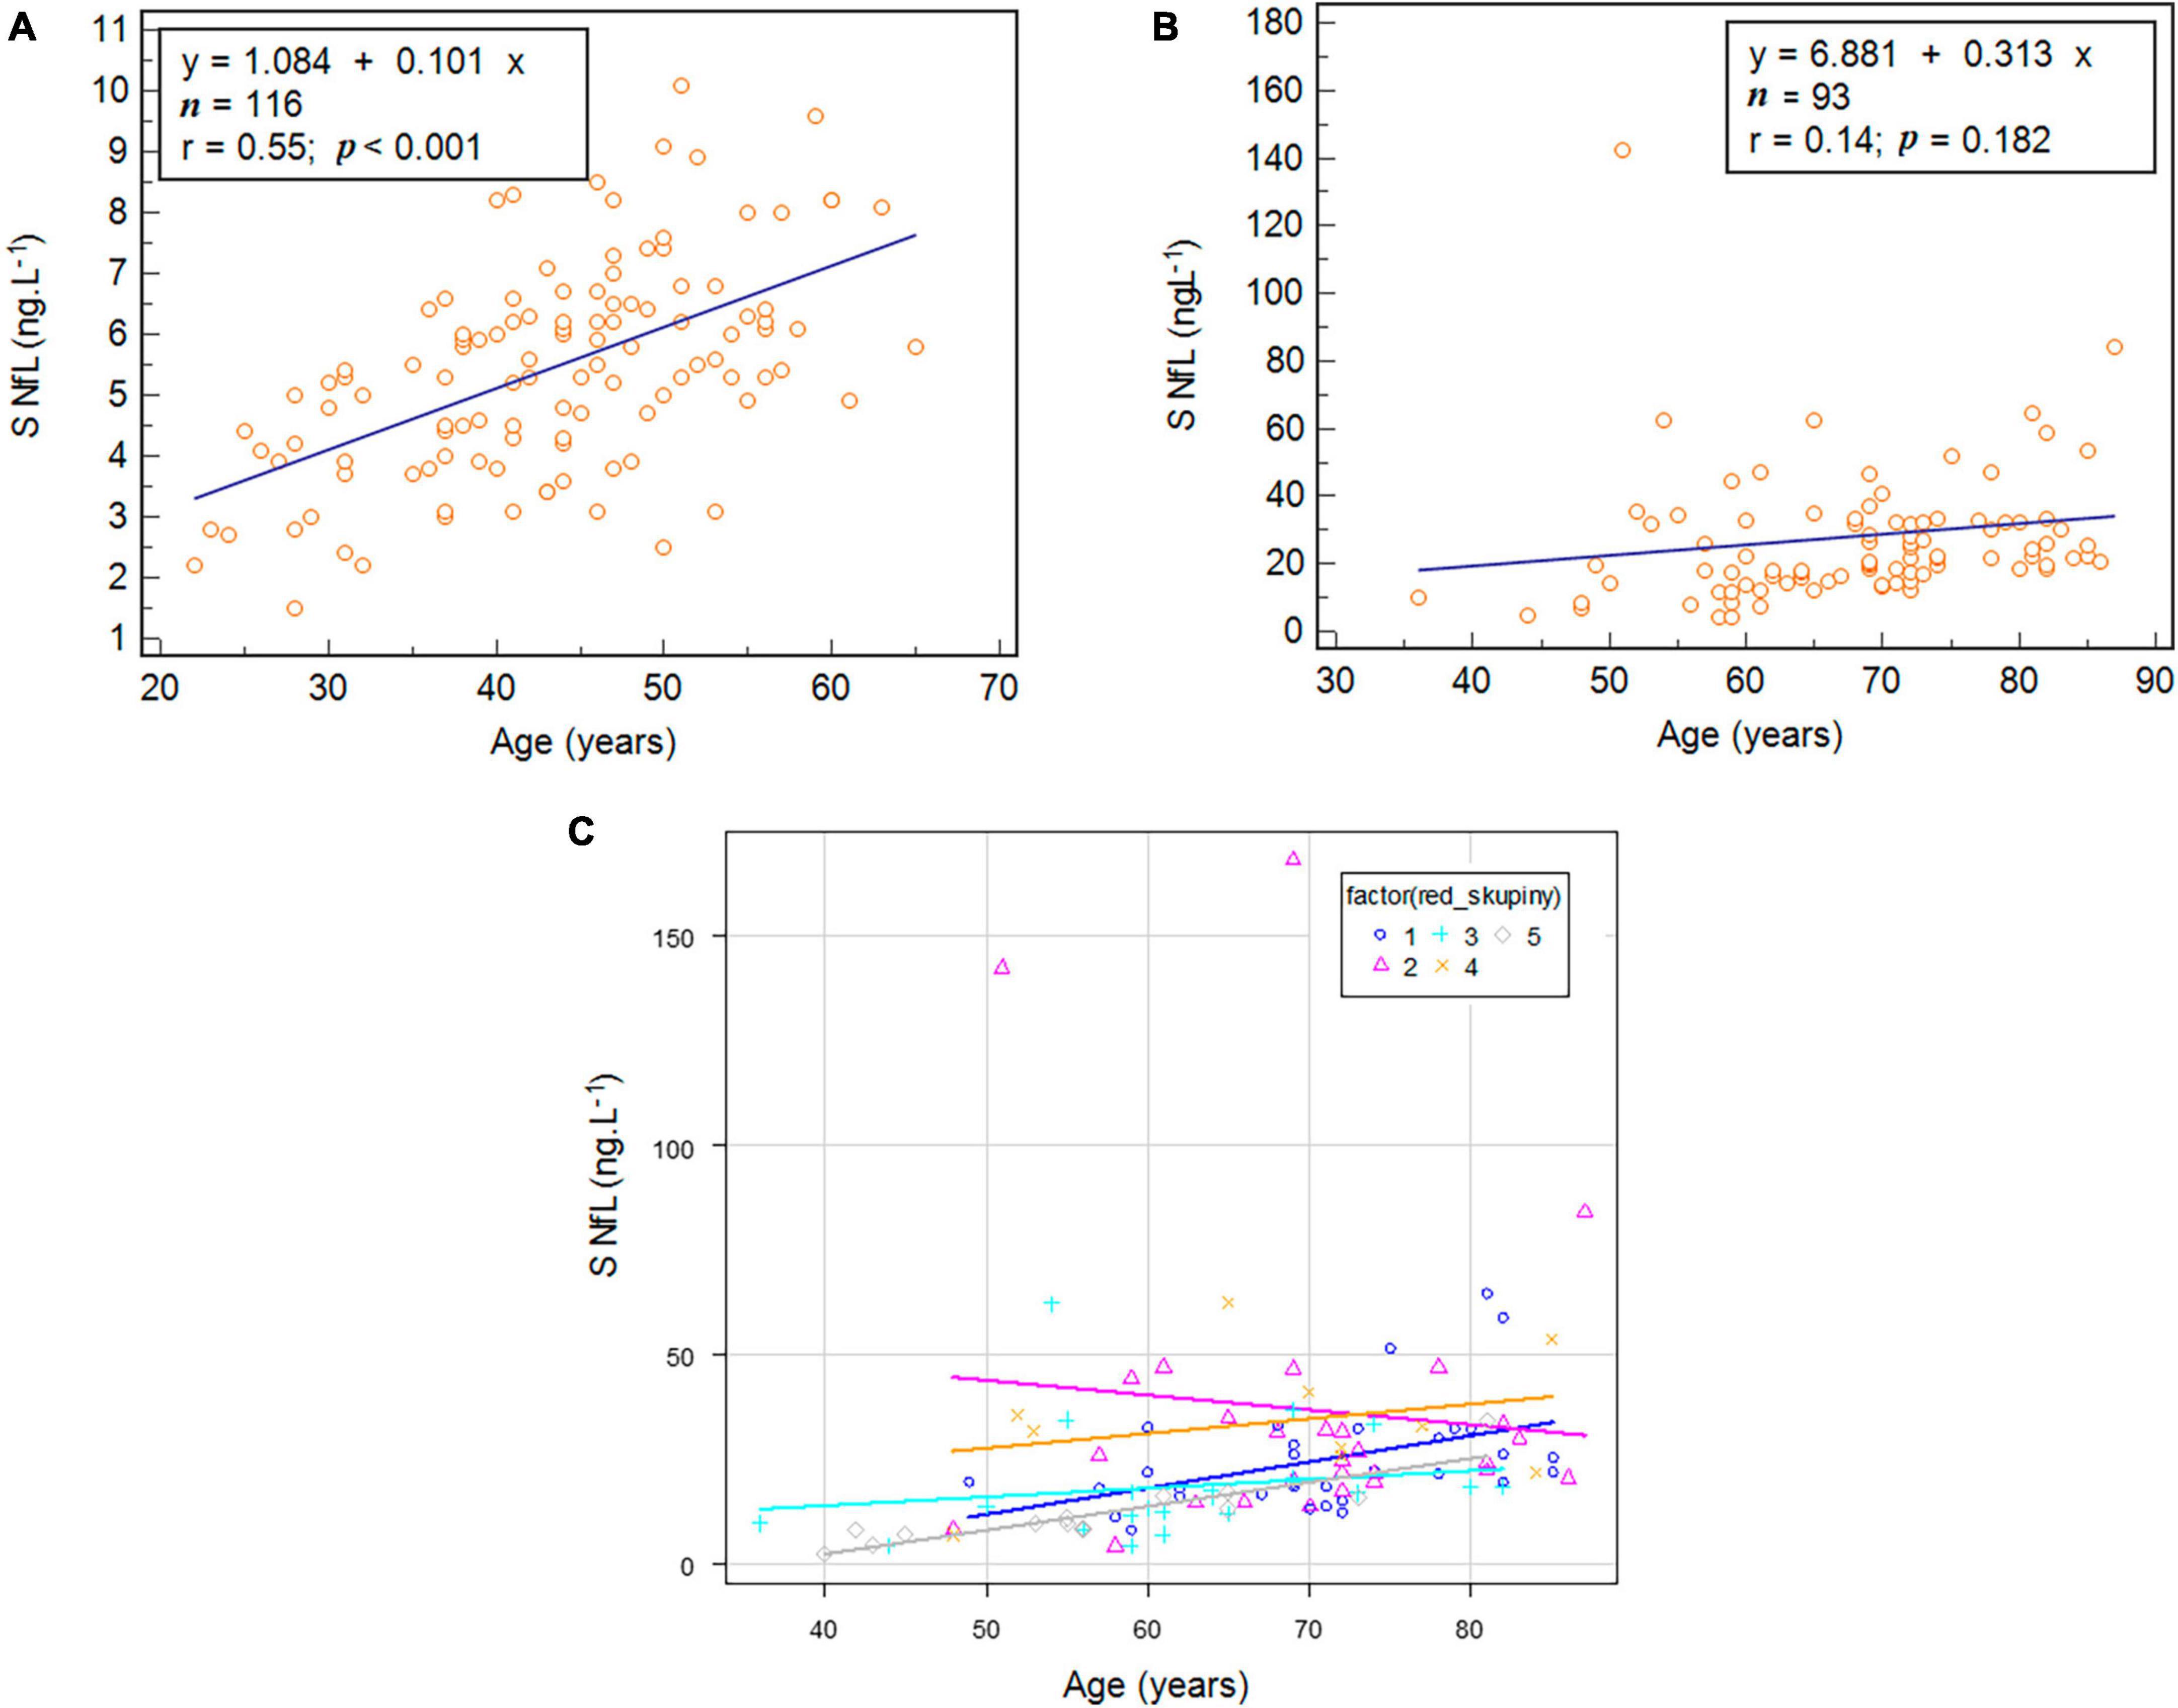
Figure 1. The age dependence of serum (S) neurofilament light chain (NfL) in the control group (A), in patients from the Outpatient Clinic for Movement and Cognitive Disorders (B), and in each diagnostic group (C).
Receiver operating characteristics analyses revealed the optimal cut-off value of S NfL (>10.5 ng.L–1) for assessing the neuronal damage. The sensitivity was 90.5% (CI 82.1–95.8%), and specificity was 95.2% (CI 89.8–98.2%) (Figure 2).
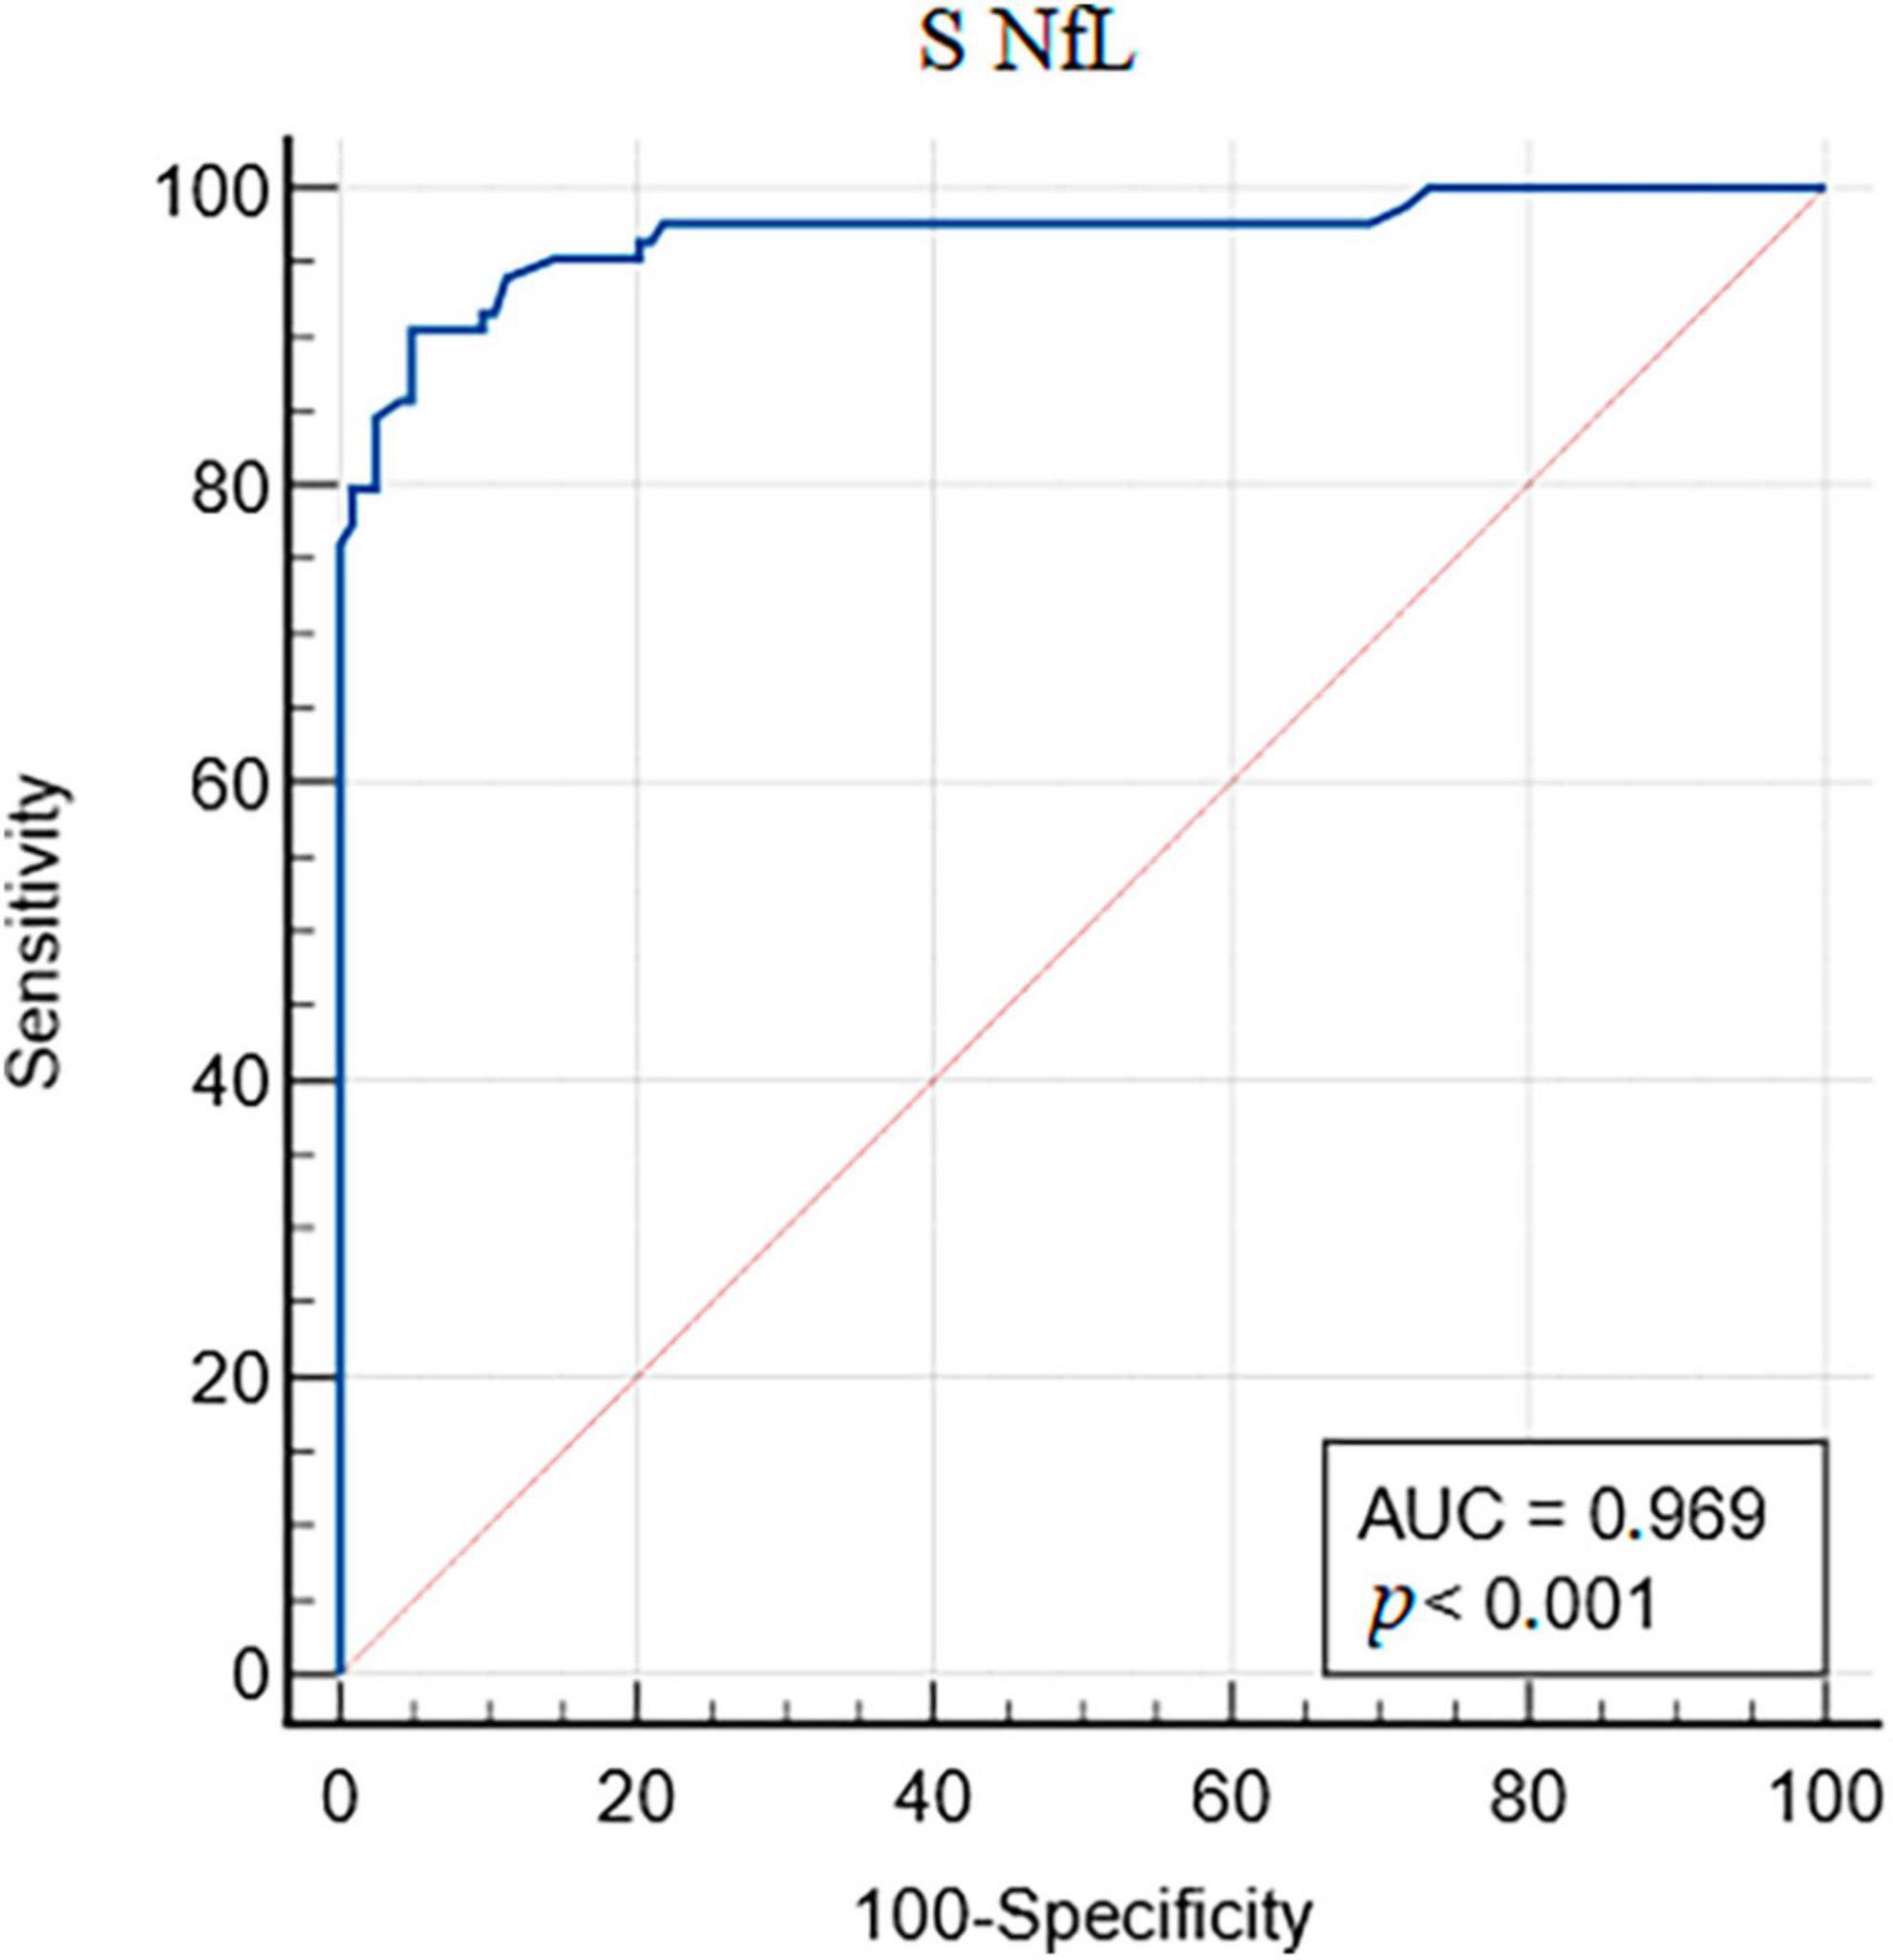
Figure 2. Receiver operating characteristic (ROC) analysis of serum (S) neurofilament light chain (NfL).
3.2 Comparison of S NfL determined by highly sensitive ELISA with other biochemical markers in cohorts with different degrees of cognitive deficit
Samples from 115 patients were used for the comparison between methods. Table 1 presents characteristics of the studied group. The median concentration of S NfL was 20.1 ng.L–1 (IQR 14.0–32.3), CSF NfL 1036 ng.L–1 (IQR 639–2,363), CSF Aβ40 7,779 ng.L–1 (IQR 5,376–9,964), CSF Aβ42 1,127 ng.L–1 (IQR 661–1,562), CSF tTau 309 ng.L–1 (IQR 216–518), CSF pTau 41.2 ng.L–1 (IQR 27.7–71.3), and CSF αS 2,251 ng.L–1 (IQR 1,871–2,836).
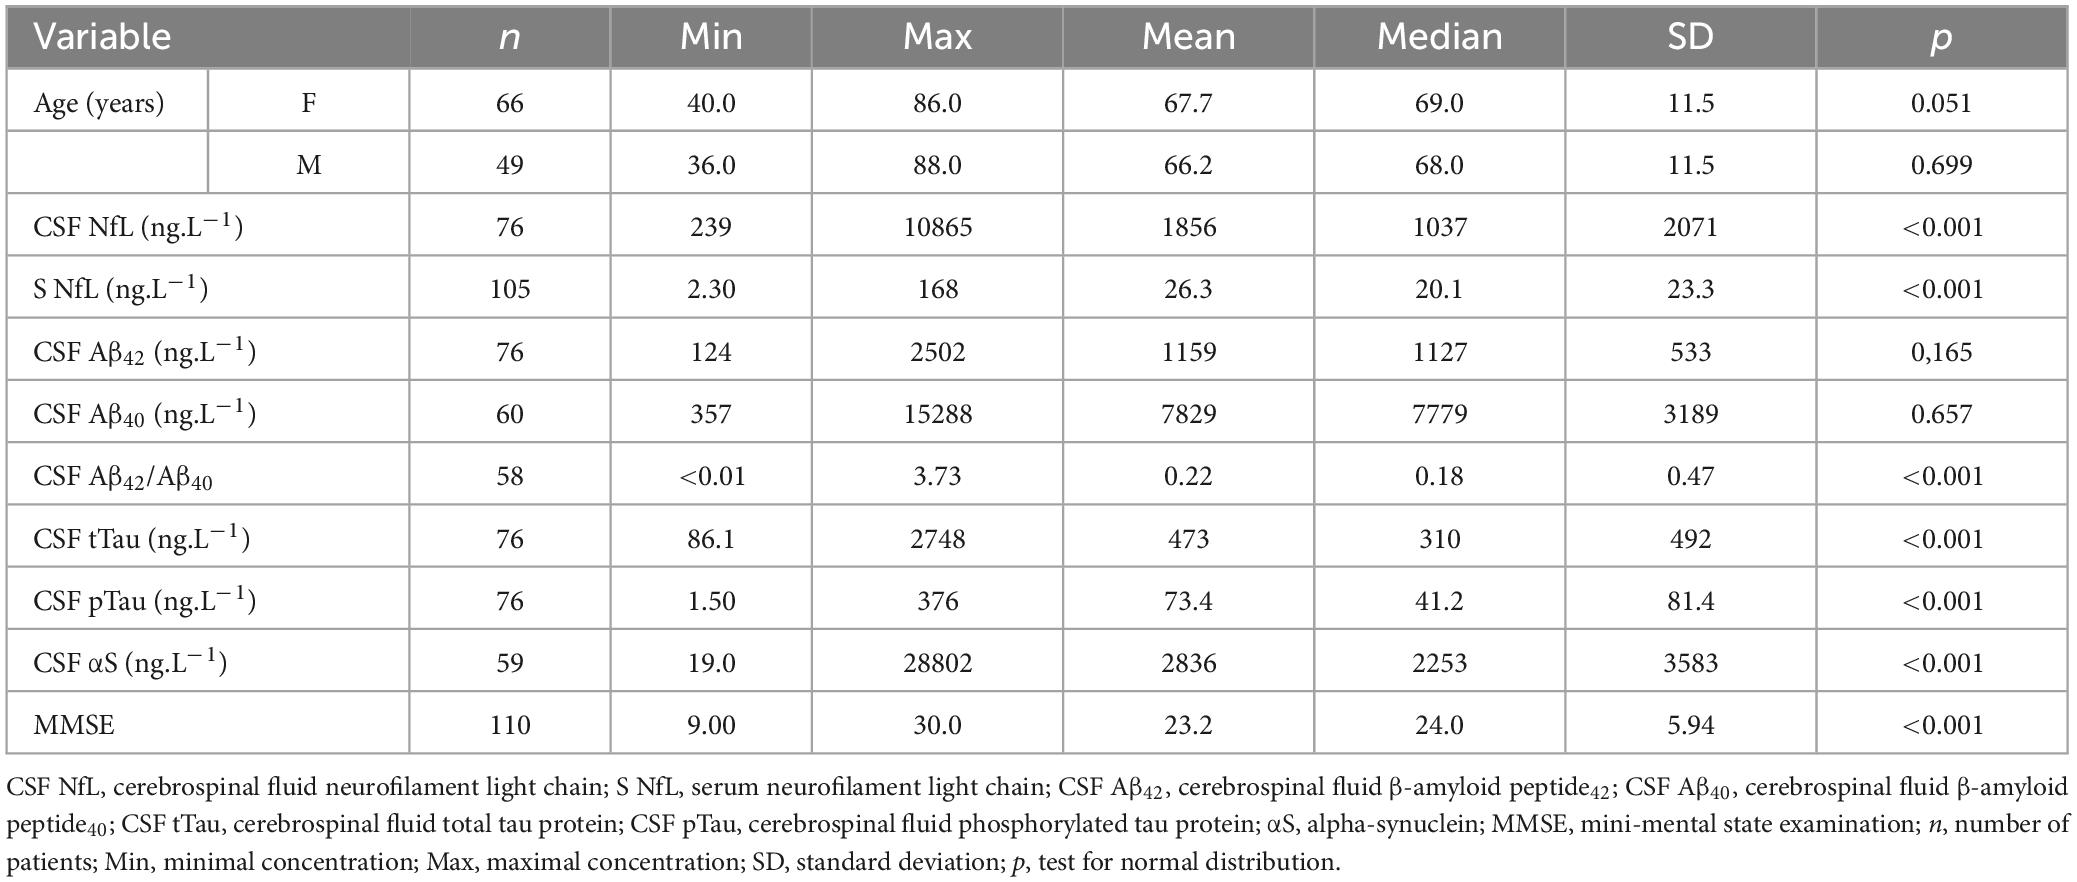
Table 1. Descriptive characteristics of the studied groups.
In all groups, we found a very strong Spearman’s rank correlation coefficient between the CSF NfL and S NfL (rs = 0.767; p < 0.001) (Table 2). We found a moderate statistically significant correlation between S NfL and CSF Aβ42 in Group 3 (rs = 0.631; p = 0.016); between S NfL and CSF Aβ40 in Group 4 (rs = −0.750; p = 0.052); between S NfL and CSF tTau in Group 5 (rs = 0.689; p = 0.009), and between S NfL and CSF pTau in Group 5 (rs = 0.749; p = 0.003). Very strong correlation coefficients were found between CSF NfL and CSF Aβ40 in Group 4 (rs = −0.964; p < 0.001); between CSF Aβ42 and CSF αS in Group 5 (rs = 0.804; p = 0.002); between CSF Aβ40 and CSF tTau in Group 1 (rs = 0.811 p = 0.001); between CSF Aβ40 and αS all groups (rs = 0.811) in Group 1 (rs = 0.909) and Group 5 (rs = 0.868) (all p < 0.001); and between CSF tTau and αS in Group 1 (rs = 0.937, p < 0.001).
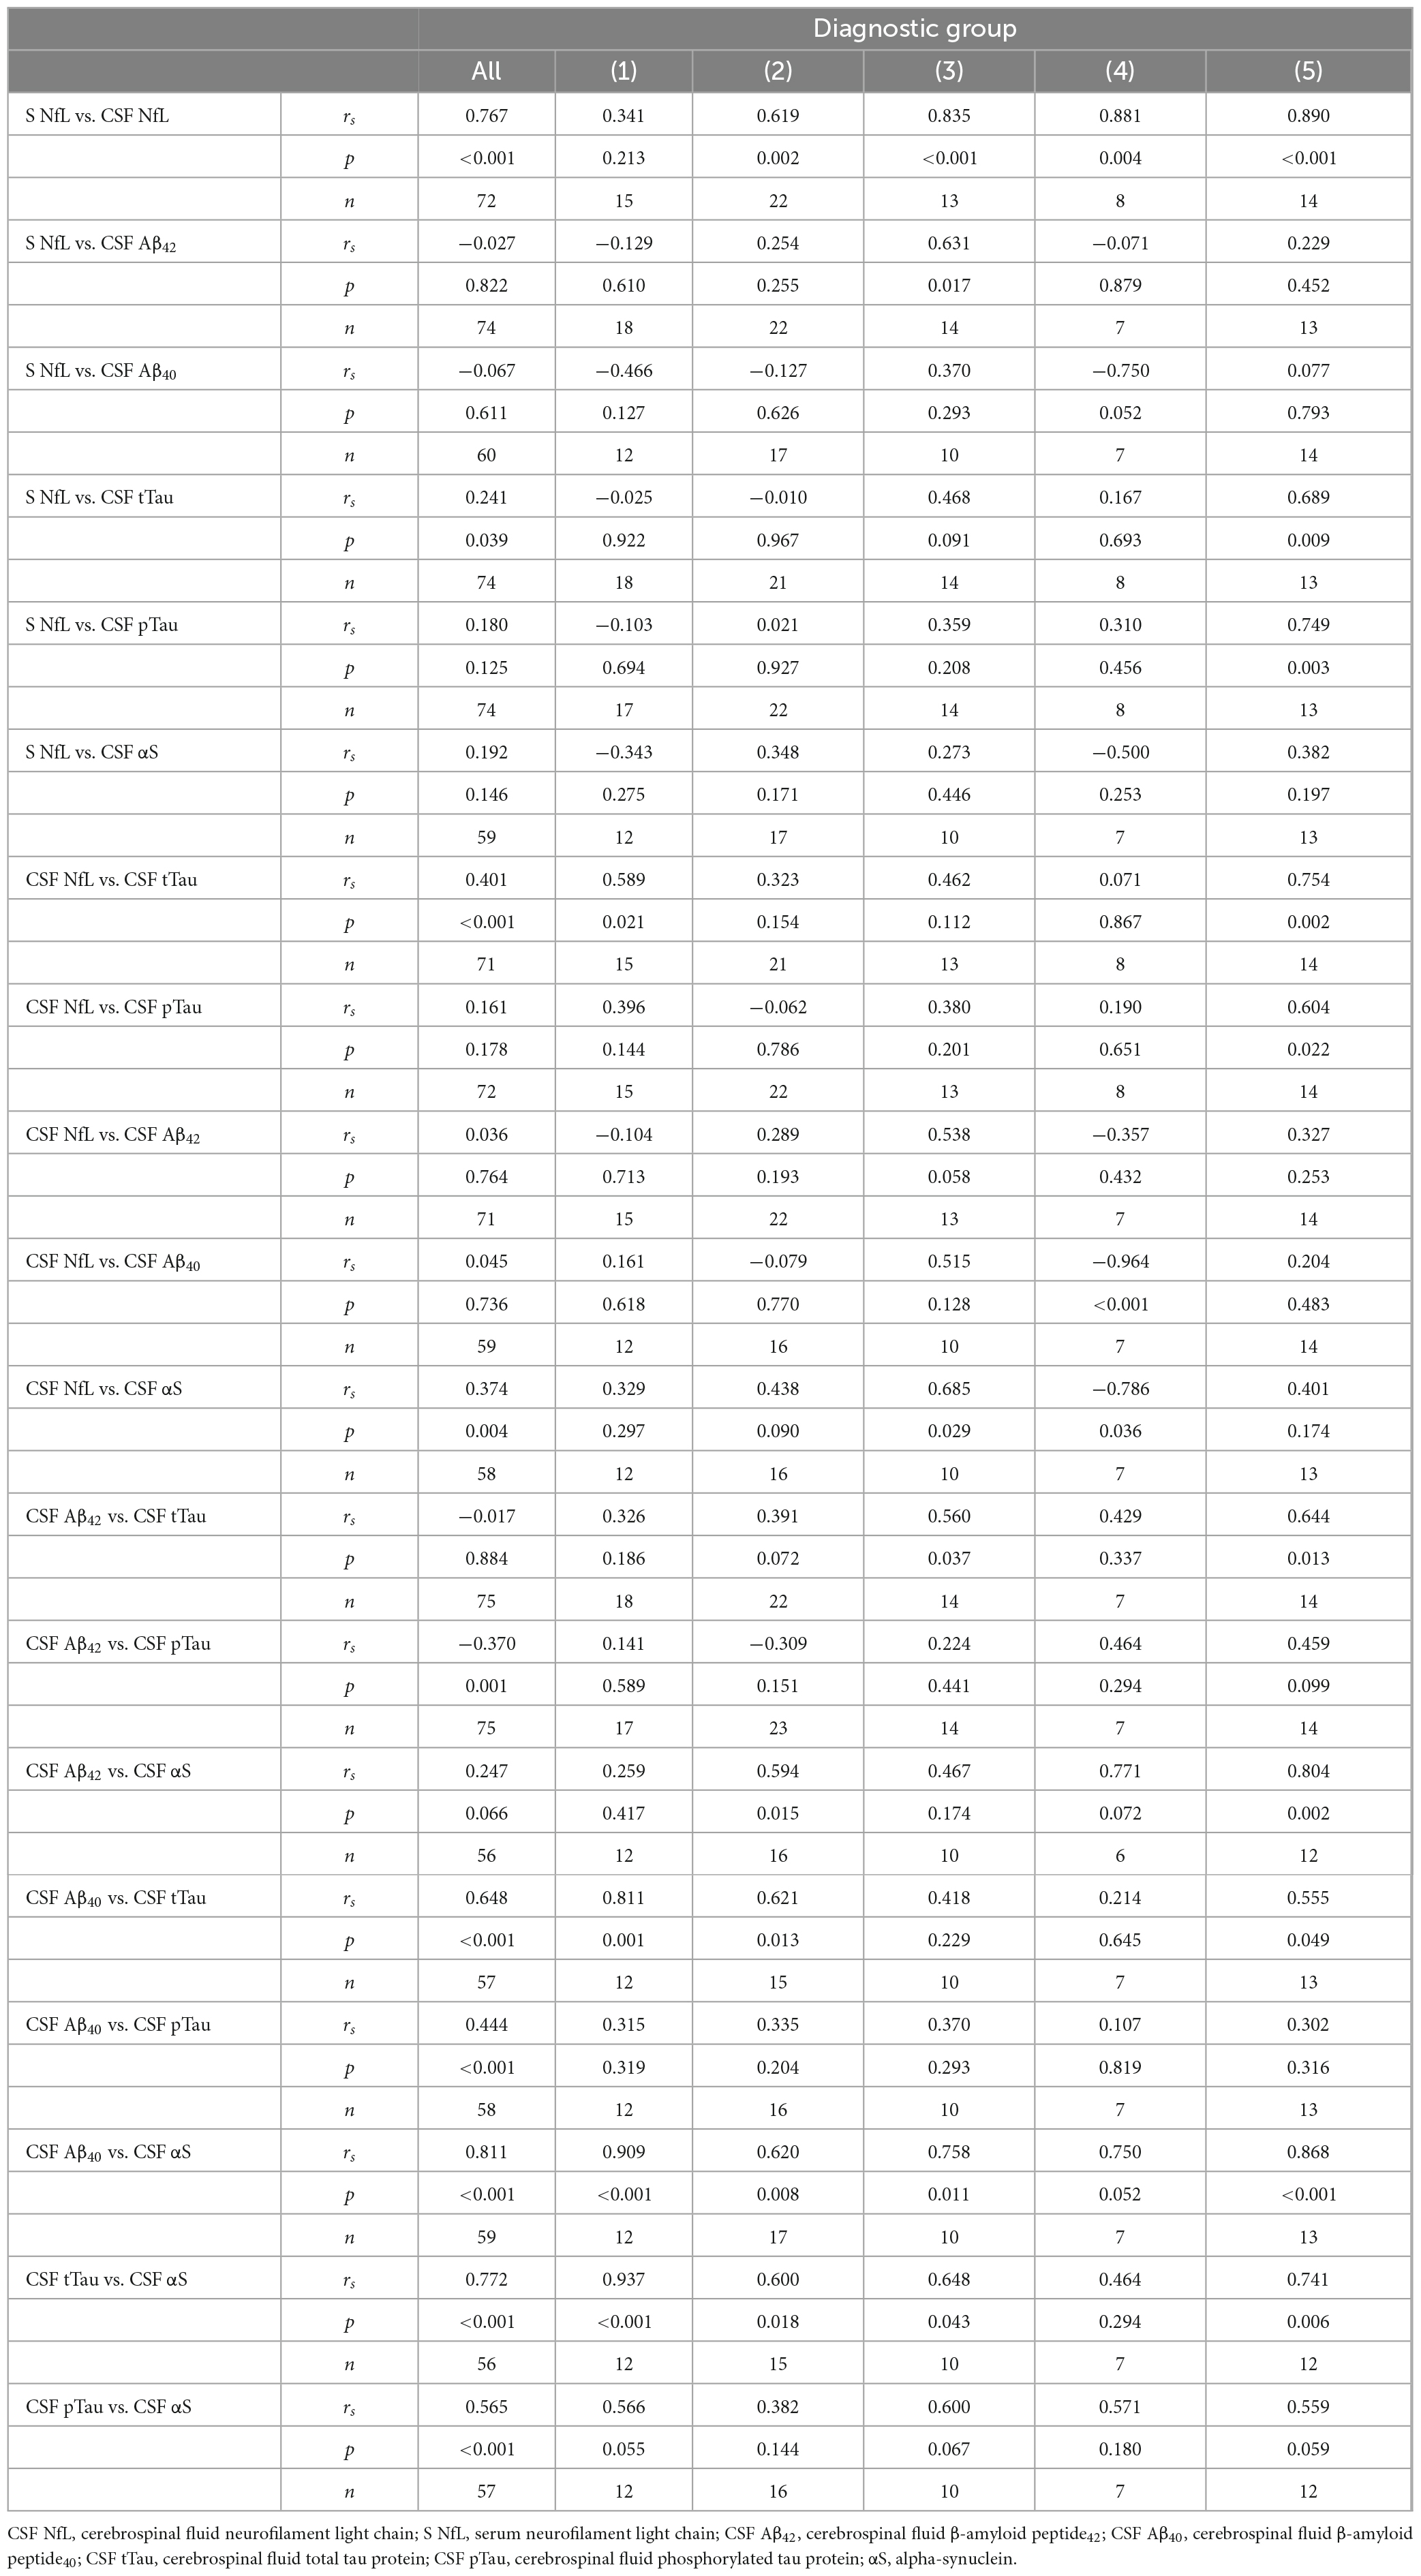
Table 2. Correlations between selected biochemical markers in cerebrospinal fluid and serum in individual diagnostic groups.
3.3 Evaluation of the relationships between individual analytes and diagnosis
The non-parametric Kruskal–Wallis test was used to evaluate the relationship between individual analytes and diagnosis. We found statistically significant differences in S NfL, CSF NfL, CSF Aβ42, CSF tTau, and CSF pTau among different diagnosis groups (Figure 3). Post hoc analysis was performed using the Dunn test (Table 3).
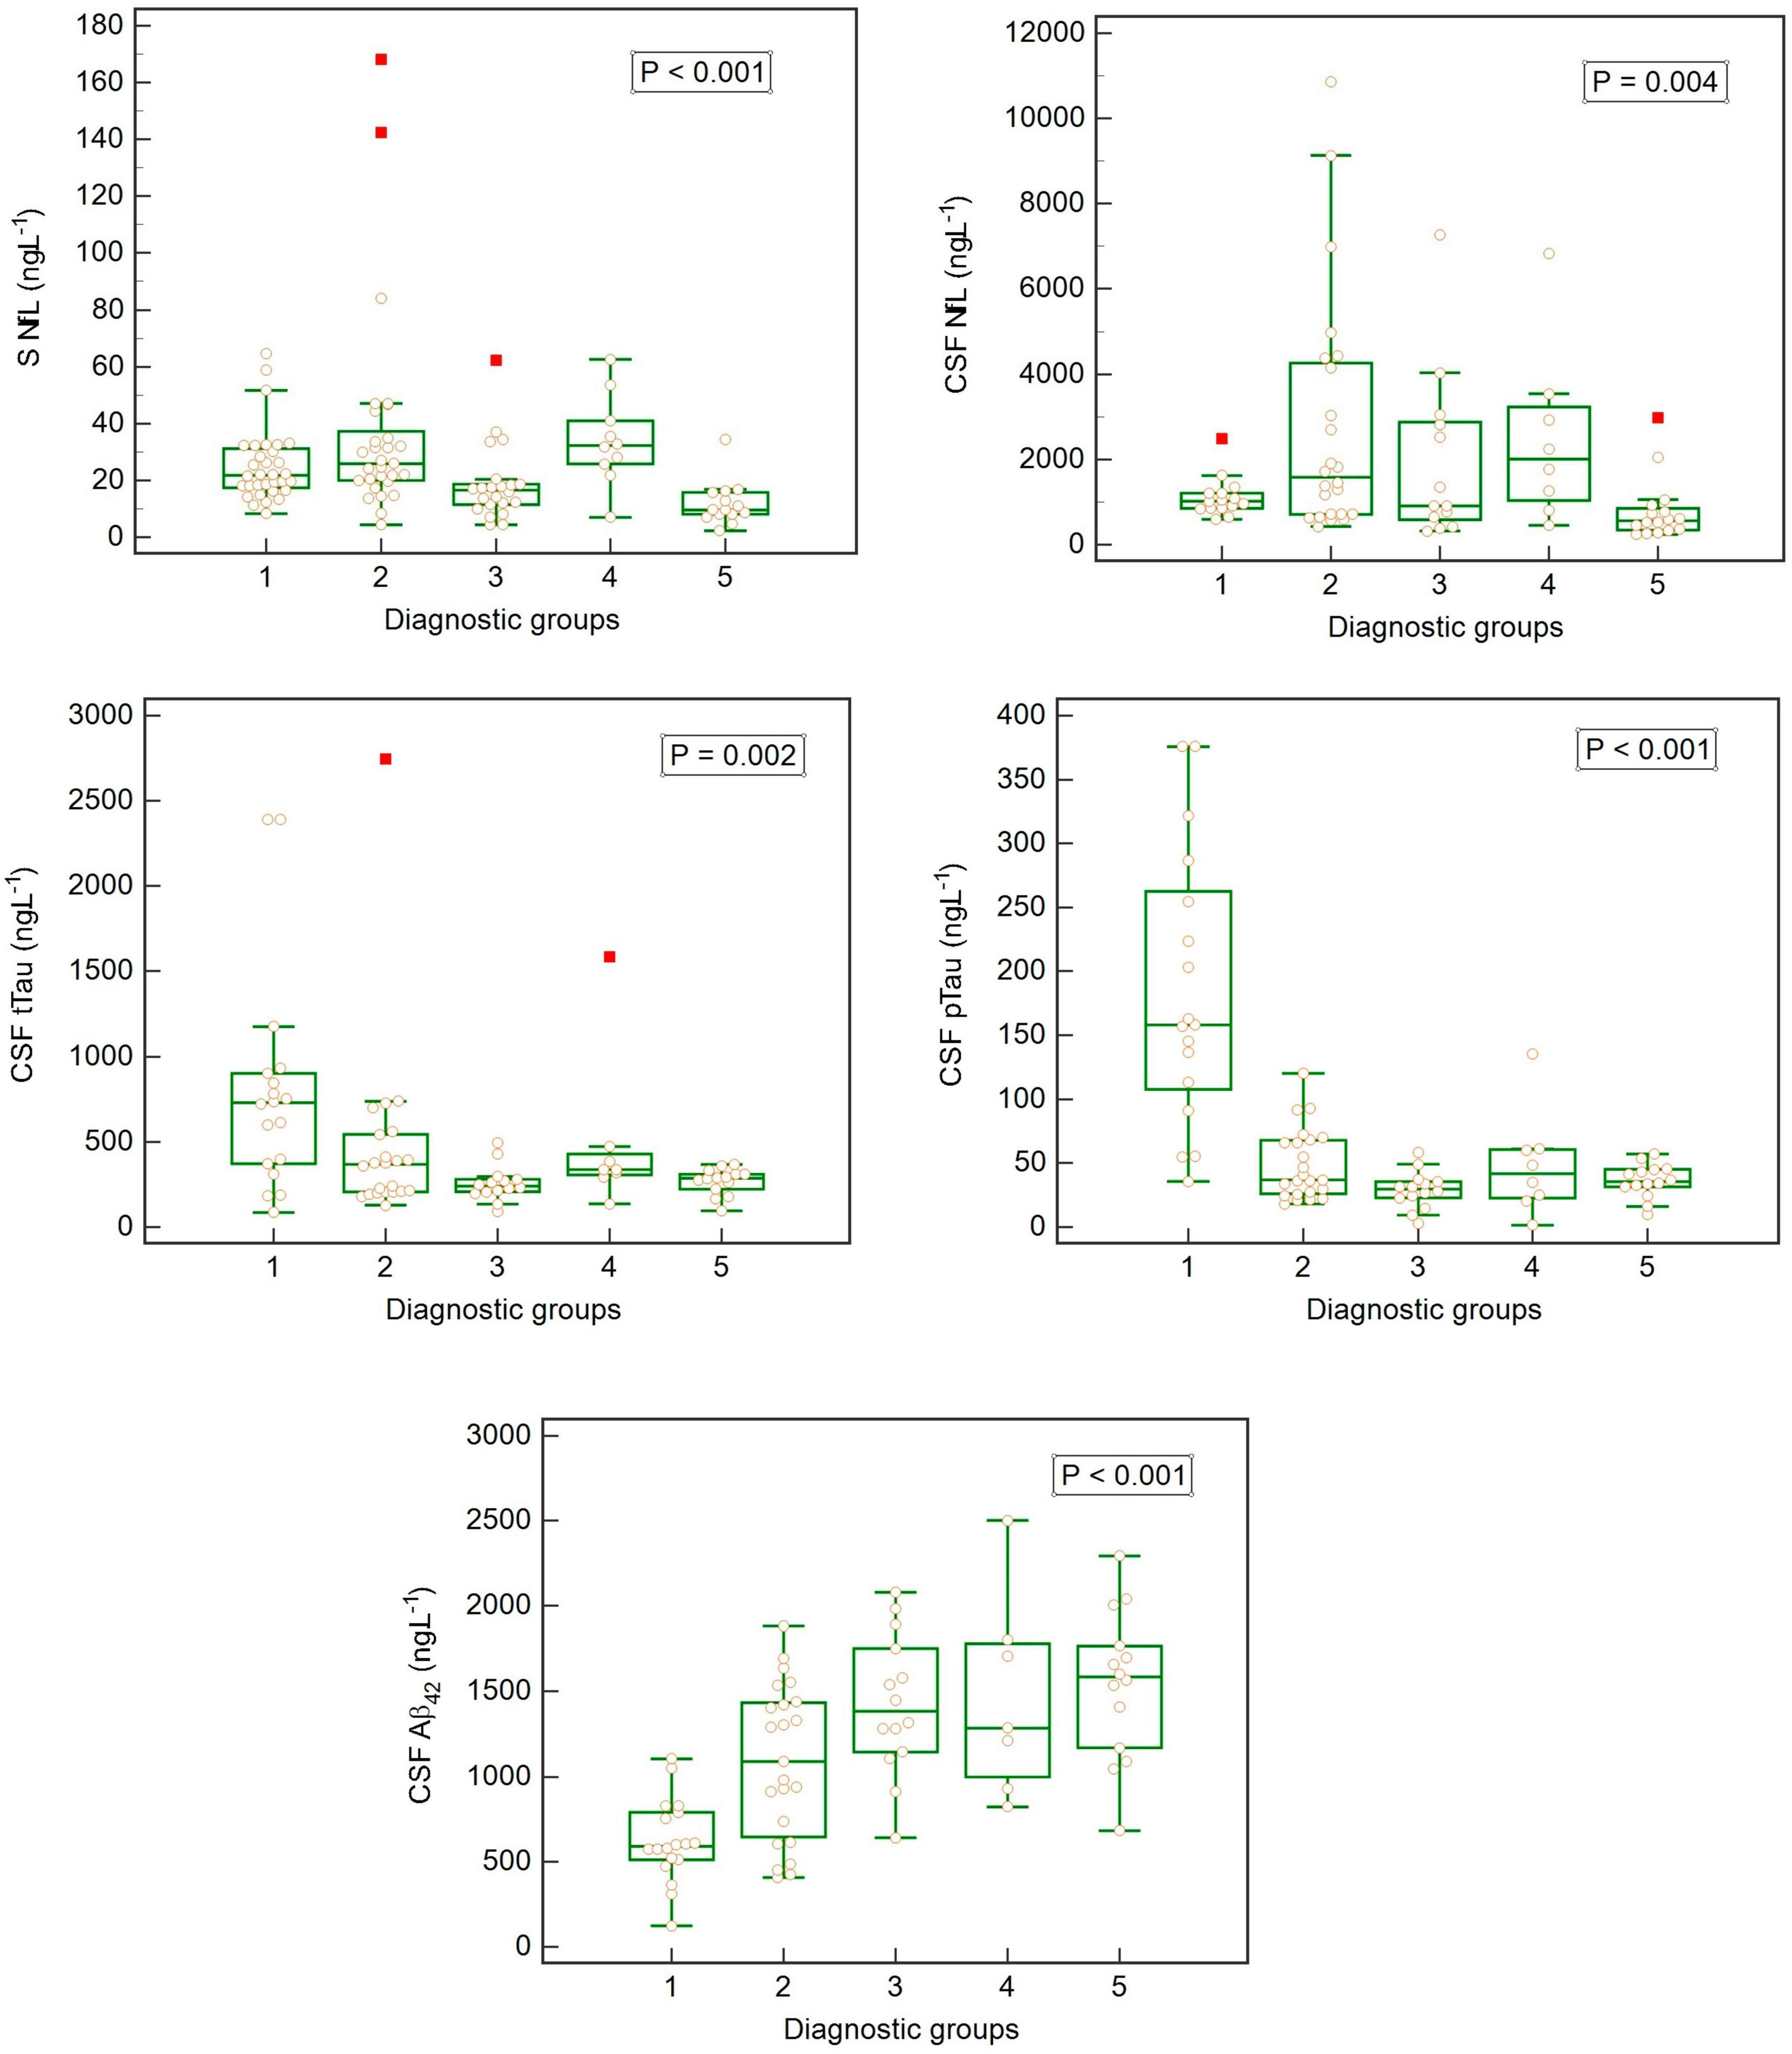
Figure 3. Box-plots showing concentrations of biomarkers in cerebrospinal fluid (CSF) and serum (S) in individual diagnostic groups (Kruskal–Wallis rank test).
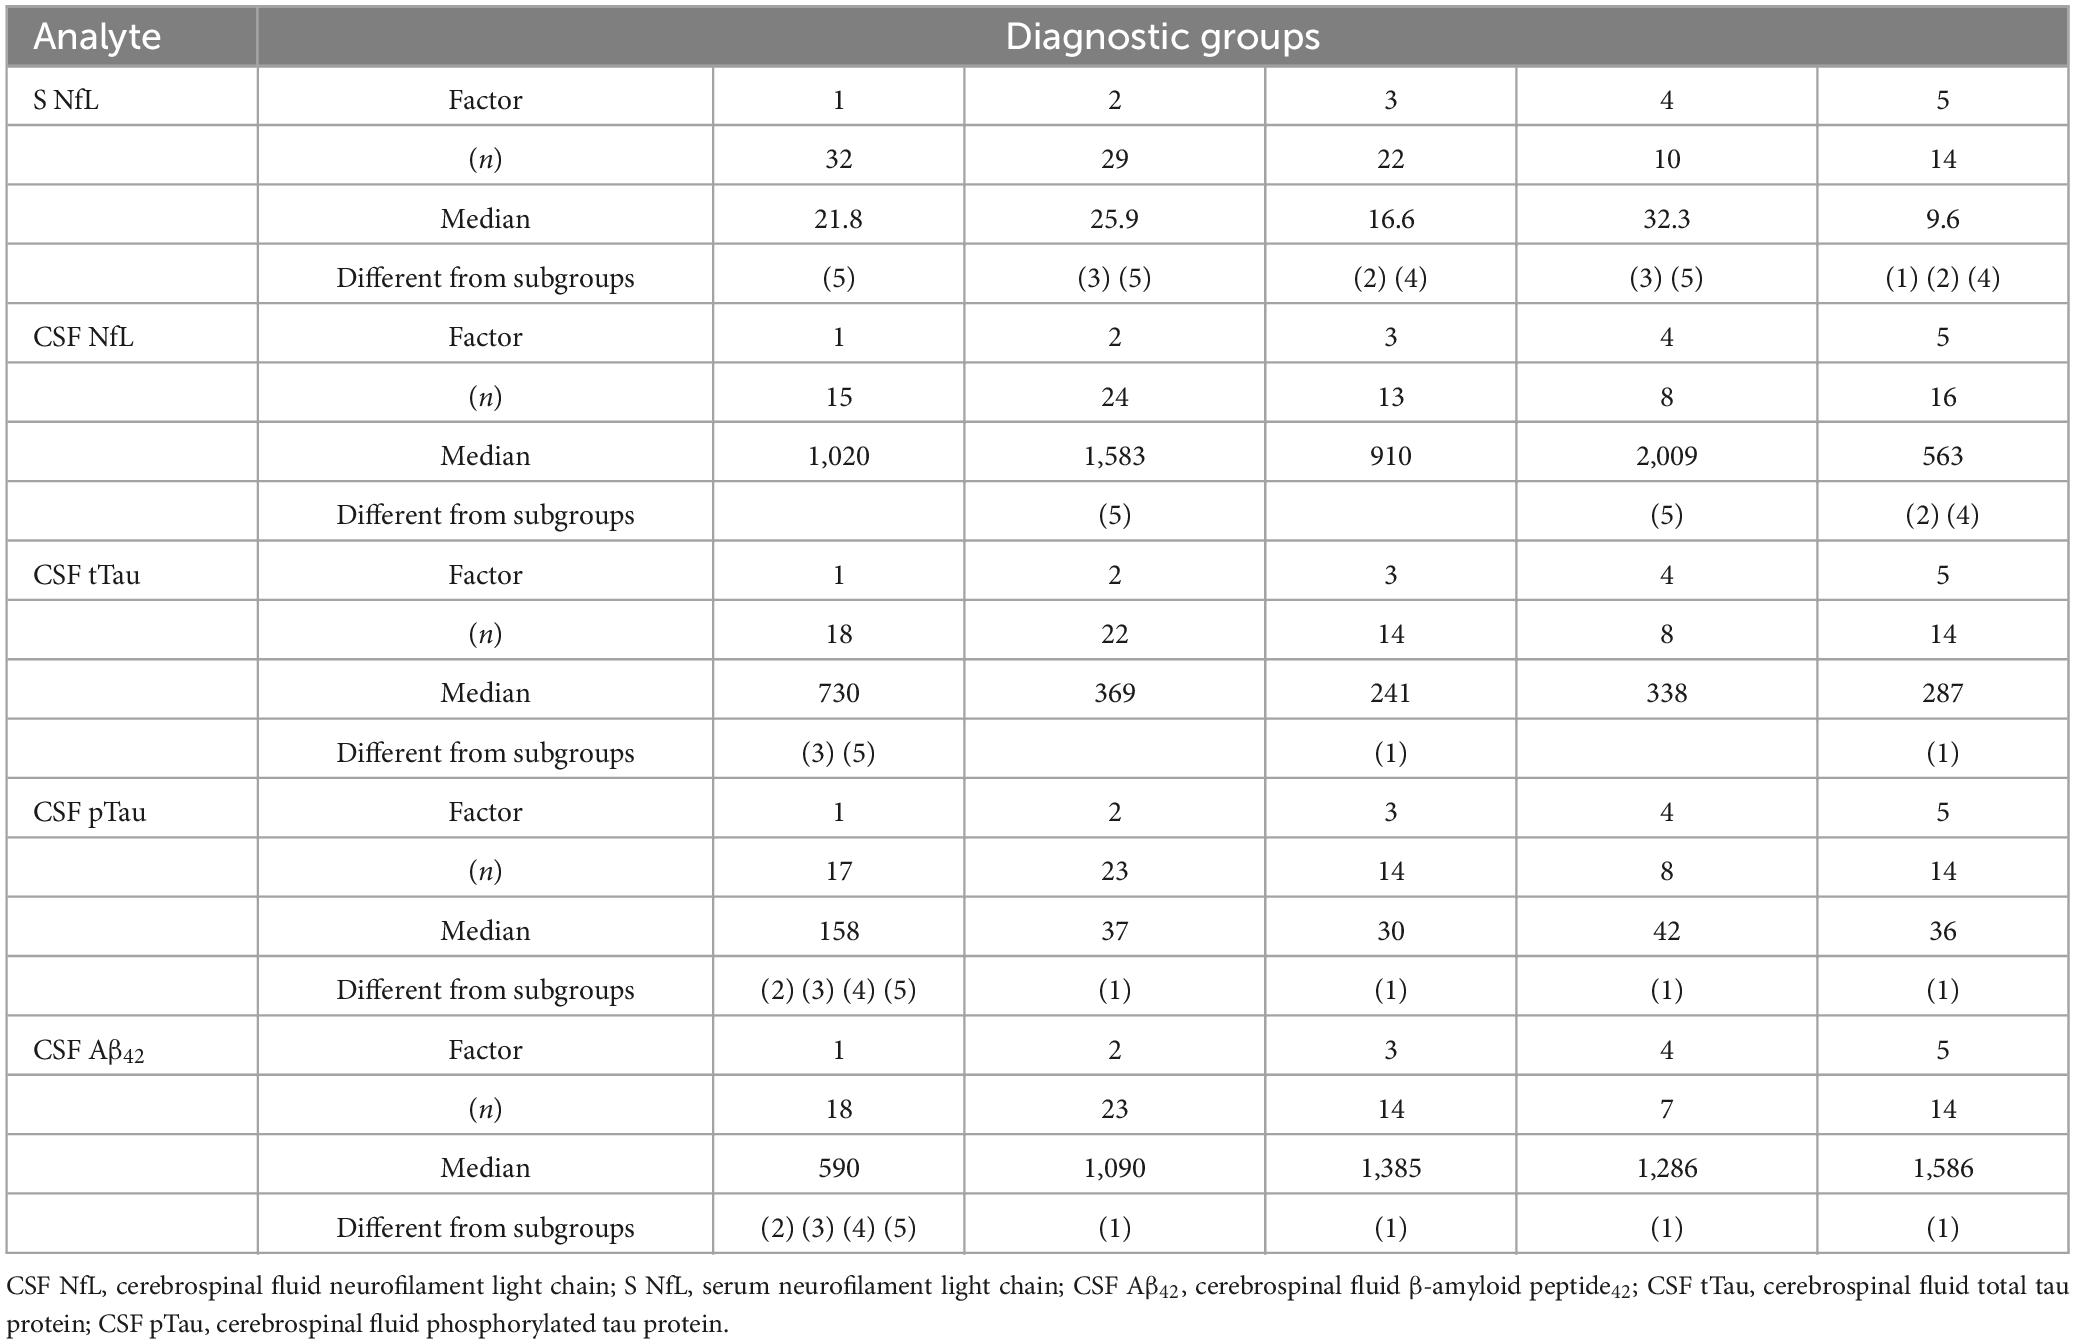
Table 3. Mutual comparison of individual diagnoses (Dunn test) for S NfL, CSF NfL, CSF Aβ42, CSF tTau, and CSF pTau; and significant differences between subgroups (p < 0.05).
3.4 Assessment of interrater reliability among the investigated biomarkers
Since the compared methods had different RIs, we used Cohen’s kappa statistic to compare the assays based on clinical interpretation (Table 4). The highest kappa coefficients (indicating moderate conformity between the diagnostic kits) were found between the concentrations of S NfL and CSF NfL (κ = 0.480), and between CSF NfL and CSF tTau (κ = 0.351). The positive value was set at >10.5 ng.L–1 for the S NfL concentration, at >900 ng.L–1 for CSF NfL (value indicating axonal damage) (Arrambide et al., 2016), and at >452 ng.L–1 for CSF tTau (Bartoš et al., 2019).
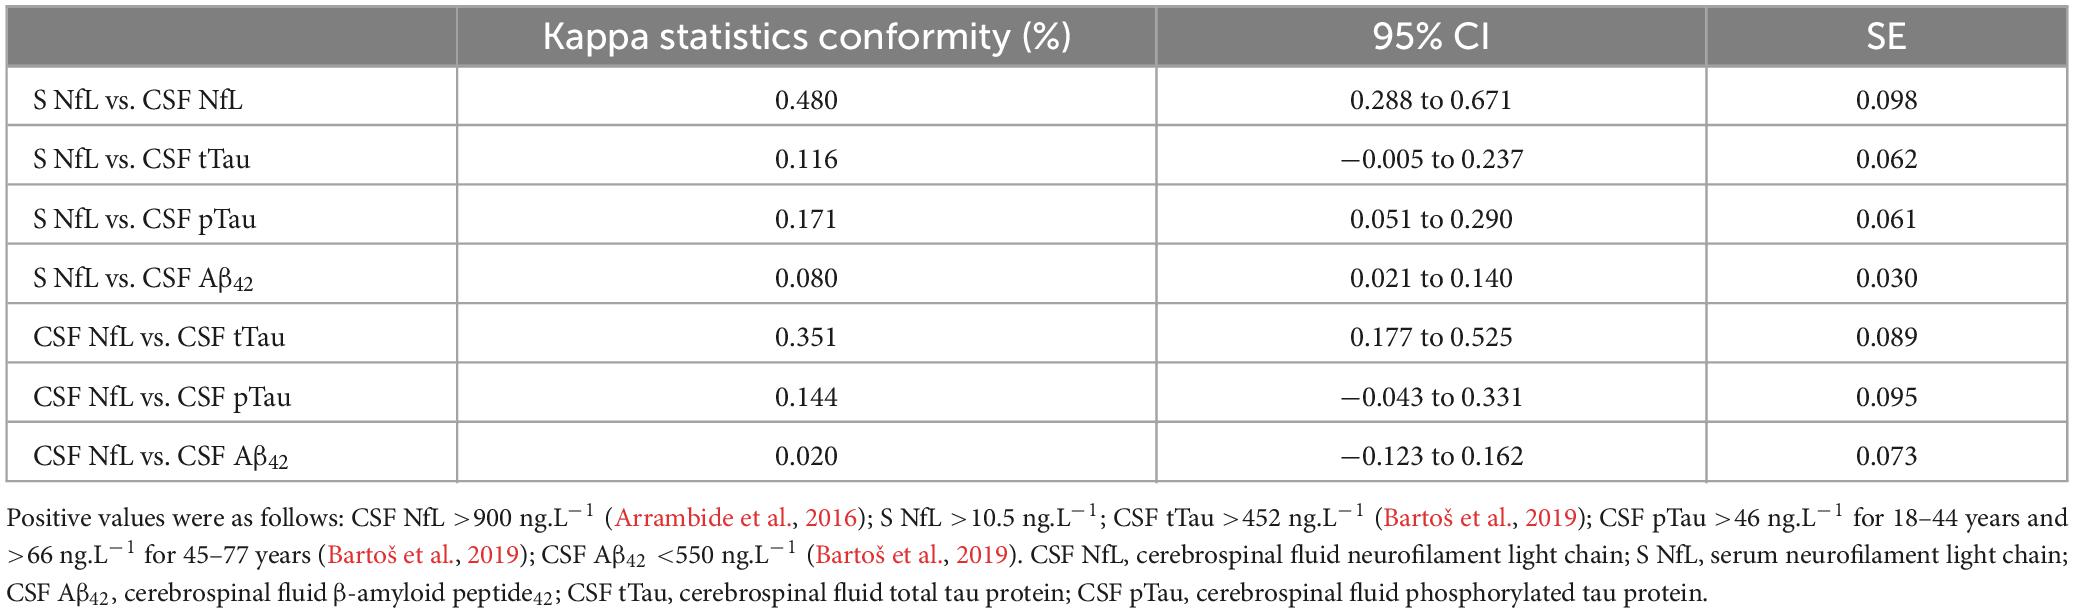
Table 4. Assay conformity based on the kappa statistic.
3.5 Stepwise multinomial linear regression analysis
We performed stepwise multinomial linear regression analysis to assess the effects of biochemical markers on MMSE values, and identified statistically significant effects of S NfL, CSF Aβ42, and CSF pTau (Table 5). The multiple R-squared value was 0.390, the adjusted R-squared was 0.349, and the F statistic was 9.594 at 3 and 42 df (p < 0.0001). These results indicated that 39% of the MMSE values can be explained by these three parameters, which each make different contributions to the final MMSE value.
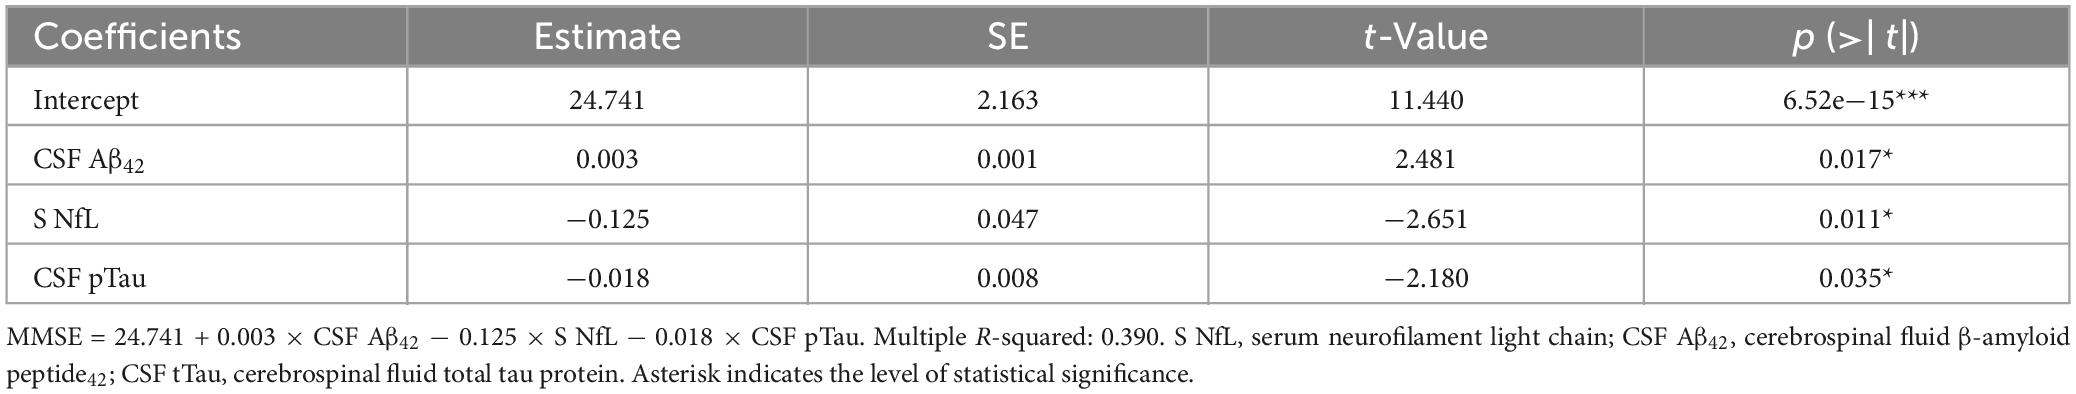
Table 5. Final stepwise multinomial linear regression analysis.
4 Discussion
In this study, we tested S NfL as a marker of neuronal damage. We estimated the physiological levels of S NfL, and identify a cut-off value for assessing the degree of neuronal impairment, using a highly sensitive ELISA method. In healthy controls, S NfL was found to be dependent on age. Similar results have also been published using the SIMOA method (Hviid et al., 2020; Harp et al., 2022). Notably, we did not find age dependence of S NfL in groups of patients with varying degrees of cognitive deficit. The patients included in our study were older than the healthy controls; therefore, the age range was narrower among patients than in the healthy population. Importantly, some of the included diseases are often more severe in younger patients, such that the neuronal damage could be greater. These explanations are supported by our more detailed analysis of the age dependence S NfL in individual diagnostic groups, which revealed statistically significant age dependency in all subgroups, except those with non-Alzheimer dementia (Group 2). That subgroup included multiple diseases that affect younger people and progress more rapidly than AD (e.g., FTLD and CJD), which could have affected the results (Buganza et al., 2009; Mohandas and Rajmohan, 2009). We must also consider the impacts of other factors that affect S NfL levels (e.g., body mass index, renal function, blood volume, high-density lipoprotein, etc.) and are associated with increased risk of vascular disease (Koini et al., 2021), given that Group 2 also included several patients with vascular dementia classified as non-Alzheimer dementia (Román, 2005).
We also evaluated the correlation of S NfL as a biomarker of neuronal injury with other biomarkers in CSF in patients with various diseases that presented as dementia, movement disorder, or combination of both. Serum and CSF concentrations of NfL showed a strong correlation in all groups except AD (Group 1). We assume this may have been due to the small size of this group, and the low absolute concentrations of NfL in the examined tissues. Moreover, this group included a few patients with AD in the predementia state, who had lower NfL concentrations compared to patients with dementia, which could also have affected our results. The negative correlation between CSF NfL and MMSE score has previously been published (Das et al., 2022), and investigations of transgenic mice with familiar AD suggest that plasmatic NfL does not differ between presymptomatic animals and control mice (Loeffler et al., 2020). The uncertainty regarding plasmatic NfL levels (in contrast with CSF NfL) in preclinical AD has been mentioned in the literature (Andersson et al., 2020). Apart from this exception, our findings confirmed that the detection of serum NfL (without requiring CSF NfL examination) was sufficient in these diseases, in accordance with other recent studies (Mollenhauer et al., 2020; Delaby et al., 2022). In the AD group (Group 1), we found no significant correlation between S NfL and any other examined biomarker. This was quite surprising, especially in the case of tTau in CSF, because both of these biomarkers reflect neuronal damage (Holper et al., 2022). Dhiman et al. (2020) reported that they did not find an association between Aβ and NfL, but that tTau and pTau were each correlated with NfL. In our present study, we found a significant correlation between NfL and tau, only in the healthy population (Khalil et al., 2018). According to these results and the above-mentioned literature, it seems that S NfL is not suitable as early biomarker of AD alone. It is possible that repeated examinations and studies of the dynamics of S NfL will be more successful (Preische et al., 2019). It is important to realize that we studied serum biomarkers in different stages of the disease, from preclinical phase to severe dementia. We tried to take into account the disease duration from first sign to sample investigation. However, in this specific disease it is nearly impossible to gain precise time frame and family members are not able to determine even a year of symptomatic beginning. In the study of Giacomucci et al. (2022) there has been proved some dependence between NfL and Aβ, but there had been used SIMOA method. We found a significant correlation between S NfL and CSF Aβ42 only in the group with PD (Group 3). One possible explanation could be the absence of dementia in this group, and consequently higher concentrations of Aβ42 in the CSF of these patients (Siderowf et al., 2010; Irwin et al., 2013). In the groups with AD (Group 1) and combination disease (Group 4), there were negative regressions that reflect lower concentrations of Aβ42, while the NfL levels were increased.
As expected based on the high correlation between serum and CSF concentrations of NfL, we found similar patterns of correlation between CSF NfL and other biomarkers of neurodegenerative diseases. There was a significant correlation between CSF NfL and CSF tTau in the AD group (Group 1). We also found significant correlations between CSF NfL and CSF αS (in contrast with S NfL) in groups with synucleinopathies. Similar results were found in the studies of PD by Oosterveld et al. (2020), and of MSA by Tokutake et al. (2022).
We also examined the correlations of other biomarkers among themselves, independent of NfL. CSF Aβ42 and CSF tTau were correlated in the group with PD (Group 3) and controls (Group 5). This correlation has been previously shown among PD patients (Zhang et al., 2013). We also found strong correlations between CSF Aβ40 and CSF pTau in the general population of all patients (while the results were non-significant in individual groups), and between CSF Aβ40 and CSF tTau in the AD group (Group 1). The correlation between Aβ40 and CSF pTau among AD patients (and slightly in controls) was previously published by Lehmann et al. (2020). We obtained interesting results in our examination of CSF Aβ40 and CSF αS, with significant correlations in practically all groups. This correlation was previously reported in synucleinopathies (Swirski et al., 2014). Surprisingly, we also found correlations between CSF tTau and CSF αS in the groups with AD (Group 1), non-AD dementia (Group 2), and PD (Group 3), and among controls (Group 5). Synucleinopathies are characterized by decreased concentrations of αS in CSF (Mollenhauer, 2014), and we expected to find negative regression between markers of neuronal damage and accumulation of αS, as in the case of CSF NfL and CSF αS. Despite this assumption, the literature includes evidence of a correlation between CSF αS and tTau in early PD, where tTau and pTau were lower than in control patients (Kang et al., 2016).
Our study also included analysis of the dependence of S NfL concentration in different diagnostic groups (Table 3). Our findings enable differentiation of the healthy population (Group 3) from people with dementia (Groups 1, 2, and 4). It seems that the key element is cognitive performance, because S NfL concentrations could differentiate even PD (Group 3) and the combination of dementia and movement disorder (Group 4). A previous study also described this role of NfL (in CSF) in the distinction between parkinsonian syndromes and PD and healthy controls (Canaslan et al., 2021). Even serum NfL dynamics can predict cognitive decline in PD patients (Ma et al., 2021).
Analogically, we found similar results when we tested the NfL concentrations in CSF. However, CSF NfL did not allow us to distinguish the group with AD. A possible reason could be that this group included a few patients without dementia, and the concentrations of NfL in CSF are about 50 times higher than in serum. Notably, the determination is much more precise in this case.
The rest of the studied analytes are common biomarkers used for AD diagnostics: tTau, pTau, and Aβ42. Our results supported the general idea that tTau and pTau concentrations were high and Aβ42 concentration was decreased in CSF in AD (Jack et al., 2018). Each of these biomarkers could differentiate AD from other groups by itself.
Finally, the results of our stepwise multinomial linear regression analyses proved that S NfL, CSF Aβ42, and CSF pTau were related to MMSE scores.
Our study has several limitations. The highest limitation was the unavailability of a larger number of analyzed samples, and the heterogeneity of the groups with regards to the etiology of neuronal damage. In addition, for most of the neurodegenerative diseases, the definitive diagnosis can only be established post mortem.
5 Conclusion
In this study, we estimated the physiological levels of S NfL using a highly sensitive ELISA method. The S NfL ELISA assay has high sensitivity and specificity for assessing the neuronal damage. The results implied that measurement of the biomarkers CSF NfL and CSF tTau of patients with cognitive decline could be replaced by the less-invasive determination of S NfL. This could be useful in future therapeutic trials to monitor the disease course. S NfL levels reflected the severity of cognitive deficits assessed by MMSE. However, NfL is not specific to AD and according to our results it does not appear to be a suitable biomarker for early diagnosis of AD.
Data availability statement
The raw data supporting the conclusions of this article will be made available by the authors, without undue reservation.
Ethics statement
The studies involving humans were approved by the Ethics Committee of the Ostrava University Hospital, as a part of the project “Laboratory biomarkers of neurodegenerative diseases” (reference number 340/2021). The studies were conducted in accordance with the local legislation and institutional requirements. The participants provided their written informed consent to participate in this study.
Author contributions
PK: Conceptualization, Data curation, Formal analysis, Funding acquisition, Investigation, Methodology, Project administration, Resources, Supervision, Validation, Writing – original draft, Writing – review & editing. RN: Conceptualization, Data curation, Formal analysis, Funding acquisition, Investigation, Methodology, Resources, Writing – original draft, Writing – review & editing. PB: Conceptualization, Funding acquisition, Investigation, Methodology, Resources, Validation, Writing – review & editing. KL: Formal analysis, Methodology, Writing – review & editing. MB: Resources, Supervision, Validation, Writing – review & editing. DS: Resources, Supervision, Validation, Writing – review & editing.
Funding
The author(s) declare financial support was received for the research, authorship, and/or publication of this article. This study was supported in part by an institutional grant from the Ministry of Health, Czech Republic - conceptual development of research organization (07/RVO-FNOs/2021).
Acknowledgments
We thank all of the patients and staff who contributed to data collection. We also thank Frantisek Vsiansky for statistical consultations.
Conflict of interest
The authors declare that the research was conducted in the absence of any commercial or financial relationships that could be construed as a potential conflict of interest.
Publisher’s note
All claims expressed in this article are solely those of the authors and do not necessarily represent those of their affiliated organizations, or those of the publisher, the editors and the reviewers. Any product that may be evaluated in this article, or claim that may be made by its manufacturer, is not guaranteed or endorsed by the publisher.
References
Andersson, E., Janelidze, S., Lampinen, B., Nilsson, M., Leuzy, A., Stomrud, E., et al. (2020). Blood and cerebrospinal fluid neurofilament light differentially detect neurodegeneration in early Alzheimer’s disease. Neurobiol. Aging 95, 143–153. doi: 10.1016/j.neurobiolaging.2020.07.018
Arrambide, G., Espejo, C., Eixarch, H., Villar, L., Alvarez-Cermeño, J., Picón, C., et al. (2016). Neurofilament light chain level is a weak risk factor for the development of MS. Neurology. 87, 1076–1084.
Bartoš, A., Smětáková, M., Nosková, L., Říčný, J., and Fialová, L. (2019). Determination of tau proteins and β-amyloid 42 in cerebrospinal fluid by ELISA methods and indicative normative values. Èeská Slov. Neurol. Neurochir. 82/115, 533–540.
Buganza, M., Ferrari, S., Cecchini, M., Orrico, D., Monaco, S., and Zanusso, G. (2009). The oldest old Creutzfeldt-Jakob disease case. J. Neurol. Neurosurg. Psychiatry 80, 1140–1142.
Canaslan, S., Schmitz, M., Villar-Piqué, A., Maass, F., Gmitterová, K., Varges, D., et al. (2021). Detection of cerebrospinal fluid neurofilament light Chain as a marker for alpha-synucleinopathies. Front. Aging Neurosci. 13:717930. doi: 10.3389/fnagi.2021.717930
Ciccocioppo, F., Bologna, G., Ercolino, E., Pierdomenico, L., Simeone, P., Lanuti, P., et al. (2020). Neurodegenerative diseases as proteinopathies-driven immune disorders. Neural. Regen. Res. 15, 850–856. doi: 10.4103/1673-5374.268971
Clinical and Laboratory Standards Institute [CLSI]. (2008). Defining, establishing, and verifying reference intervals in the clinical laboratory; approved guideline, 3rd Edn. Wayne, PA: CLSI.
Das, S., Dewit, N., Jacobs, D., Pijnenburg, Y., In’t Veld, S., Coppens, S., et al. (2022). A Novel neurofilament light chain ELISA validated in patients with Alzheimer’s disease, frontotemporal dementia, and subjective cognitive decline, and the evaluation of candidate proteins for immunoassay calibration. Int. J. Mol. Sci. 23:7221. doi: 10.3390/ijms23137221
Delaby, C., Bousiges, O., Bouvier, D., Fillée, C., Fourier, A., Mondésert, E., et al. (2022). Neurofilaments contribution in clinic: State of the art. Front. Aging Neurosci. 14:1034684. doi: 10.3389/fnagi.2022.1034684
Dhiman, K., Gupta, V., Villemagne, V., Eratne, D., Graham, P., Fowler, C., et al. (2020). Cerebrospinal fluid neurofilament light concentration predicts brain atrophy and cognition in Alzheimer’s disease. Alzheimer’s Dement. (Amsterdam, Netherlands) 12:e12005.
Dugger, B., and Dickson, D. (2017). Pathology of neurodegenerative diseases. Cold Spring Harb. Perspect. Biol. 9:a028035.
Ferri, C., Prince, M., Brayne, C., Brodaty, H., Fratiglioni, L., Ganguli, M., et al. (2005). Global prevalence of dementia: A Delphi consensus study. Lancet (London, England) 366, 2112–2117.
Giacomucci, G., Mazzeo, S., Bagnoli, S., Ingannato, A., Leccese, D., Berti, V., et al. (2022). Plasma neurofilament light chain as a biomarker of Alzheimer’s disease in Subjective Cognitive Decline and Mild Cognitive Impairment. J. Neurol. 269, 4270–4280. doi: 10.1007/s00415-022-11055-5
Harp, C., Thanei, G., Jia, X., Kuhle, J., Leppert, D., Schaedelin, S., et al. (2022). Development of an age-adjusted model for blood neurofilament light chain. Ann. Clin. Transl. Neurol. 9, 444–453.
Holper, S., Watson, R., and Yassi, N. (2022). Tau as a biomarker of neurodegeneration. Int. J. Mol. Sci. 23:7307.
Hviid, C., Knudsen, C., and Parkner, T. (2020). Reference interval and preanalytical properties of serum neurofilament light chain in Scandinavian adults. Scand. J. Clin. Lab. Invest. 80, 291–295. doi: 10.1080/00365513.2020.1730434
Irwin, D., Lee, V., and Trojanowski, J. (2013). Parkinson’s disease dementia: Convergence of α-synuclein, tau and amyloid-β pathologies. Nat. Rev. Neurosci. 14, 626–636.
Jack, C., Bennett, D., Blennow, K., Carrillo, M., Dunn, B., Haeberlein, S., et al. (2018). NIA-AA research framework: Toward a biological definition of Alzheimer’s disease. Alzheimers Dement. 14, 535–562. doi: 10.1016/j.jalz.2018.02.018
Kang, J., Mollenhauer, B., Coffey, C., Toledo, J., Weintraub, D., Galasko, D., et al. (2016). CSF biomarkers associated with disease heterogeneity in early Parkinson’s disease: the Parkinson’s progression markers initiative study. Acta Neuropathol. 131, 935–949.
Khalil, M., Teunissen, C., Otto, M., Piehl, F., Sormani, M., Gattringer, T., et al. (2018). Neurofilaments as biomarkers in neurological disorders. Nat. Rev. Neurol. 14, 577–589.
Koini, M., Pirpamer, L., Hofer, E., Buchmann, A., Pinter, D., Ropele, S., et al. (2021). Factors influencing serum neurofilament light chain levels in normal aging. Aging (Albany NY). 13, 25729–25738. doi: 10.18632/aging.203790
Lehmann, S., Dumurgier, J., Ayrignac, X., Marelli, C., Alcolea, D., Ormaechea, J., et al. (2020). Cerebrospinal fluid A beta 1-40 peptides increase in Alzheimer’s disease and are highly correlated with phospho-tau in control individuals. Alzheimers Res. Ther. 12:123. doi: 10.1186/s13195-020-00696-1
Loeffler, T., Schilcher, I., Flunkert, S., and Hutter-Paier, B. (2020). Neurofilament-light chain as biomarker of neurodegenerative and rare diseases with high translational value. Front. Neurosci. 14:579. doi: 10.3389/fnins.2020.00579
Ma, L., Zhang, C., Wang, H., Ma, Y., Shen, X., Wang, J., et al. (2021). Serum neurofilament dynamics predicts cognitive progression in de novo Parkinson’s disease. J. Parkinsons Dis. 11, 1117–1127. doi: 10.3233/JPD-212535
Mohandas, E., and Rajmohan, V. (2009). Frontotemporal dementia: An updated overview. Indian J. Psychiatry. 51(Suppl. 1), S65–S69.
Mollenhauer, B. (2014). Quantification of α-synuclein in cerebrospinal fluid: How ideal is this biomarker for Parkinson’s disease? Parkinsonism Relat. Disord. 20(Suppl. 1), S76–S79. doi: 10.1016/S1353-8020(13)70020-8
Mollenhauer, B., Dakna, M., Kruse, N., Galasko, D., Foroud, T., Zetterberg, H., et al. (2020). Validation of serum neurofilament light Chain as a biomarker of Parkinson’s disease progression. Mov. Disord. 35, 1999–2008. doi: 10.1002/mds.28206
Nichols, E., Szoeke, C., Vollser, S., Abbasi, N., Foad, A., Jemal, A., et al. (2019). Global, regional, and national burden of Alzheimer’s disease and other dementias, 1990-2016: A systematic analysis for the Global Burden of Disease Study 2016. Lancet Neurol. 18, 88–106.
Oosterveld, L., Verberk, I., Majbour, N., El-Agnaf, O., Weinstein, H., Berendse, H., et al. (2020). CSF or serum neurofilament light added to α-Synuclein panel discriminates Parkinson’s from controls. Mov. Disord. 35, 288–295.
Pavlov, I., Wilson, A., and Delgado, J. (2010). Resampling approach for determination of the method for reference interval calculation in clinical laboratory practice. Clin. Vaccine Immunol. 17, 1217–1222. doi: 10.1128/CVI.00112-10
Postuma, R., Berg, D., Stern, M., Poewe, W., Olanow, C., Oertel, W., et al. (2015). MDS clinical diagnostic criteria for Parkinson’s disease. Mov. Disord. 30, 1591–1601.
Preische, O., Schultz, S., Apel, A., Kuhle, J., Kaeser, S., Barro, C., et al. (2019). Serum neurofilament dynamics predicts neurodegeneration and clinical progression in presymptomatic Alzheimer’s disease. Nat. Med. 25, 277–283. doi: 10.1038/s41591-018-0304-3
Revendova, K., Zeman, D., Bunganic, R., Karasova, K., Volny, O., Bar, M., et al. (2022). Serum neurofilament levels in patients with multiple sclerosis: A comparison of SIMOA and high sensitivity ELISA assays and contributing factors to ELISA levels. Mult. Scler. Relat. Disord. 67:104177. doi: 10.1016/j.msard.2022.104177
Román, G. (2005). Vascular dementia prevention: A risk factor analysis. Cerebrovasc. Dis. 20(Suppl. 2), 91–100.
Siderowf, A., Xie, S., Hurtig, H., Weintraub, D., Duda, J., Chen-Plotkin, A., et al. (2010). CSF amyloid β 1-42 predicts cognitive decline in Parkinson disease. Neurology 75, 1055–1061.
Swirski, M., Miners, J., de Silva, R., Lashley, T., Ling, H., Holton, J., et al. (2014). Evaluating the relationship between amyloid-β and α-synuclein phosphorylated at Ser129 in dementia with Lewy bodies and Parkinson’s disease. Alzheimers Res. Ther. 6:77.
Tokutake, T., Kasuga, K., Tsukie, T., Ishiguro, T., Shimohata, T., Onodera, O., et al. (2022). Clinical correlations of cerebrospinal fluid biomarkers including neuron-glia 2 and neurofilament light chain in patients with multiple system atrophy. Parkinsonism Relat. Disord. 102, 30–35. doi: 10.1016/j.parkreldis.2022.07.007
Keywords: neurofilament light chain, high-sensitivity ELISA, cognitive deficit, mini-mental state examination, serum
Citation: Novobilský R, Bartova P, Lichá K, Bar M, Stejskal D and Kusnierova P (2023) Serum neurofilament light chain levels in patients with cognitive deficits and movement disorders: comparison of cerebrospinal and serum neurofilament light chain levels with other biomarkers. Front. Hum. Neurosci. 17:1284416. doi: 10.3389/fnhum.2023.1284416
Received: 28 August 2023; Accepted: 13 November 2023;
Published: 14 December 2023.
Edited by:
Lutz Jäncke, University of Zurich, SwitzerlandReviewed by:
Wojciech Piotr Paslawski, Karolinska Institutet (KI), SwedenSung Ung Kang, Johns Hopkins University, United States
George D. Vavougios, University of Cyprus, Cyprus
Copyright © 2023 Novobilský, Bartova, Lichá, Bar, Stejskal and Kusnierova. This is an open-access article distributed under the terms of the Creative Commons Attribution License (CC BY). The use, distribution or reproduction in other forums is permitted, provided the original author(s) and the copyright owner(s) are credited and that the original publication in this journal is cited, in accordance with accepted academic practice. No use, distribution or reproduction is permitted which does not comply with these terms.
*Correspondence: Pavlína Kusnierova, cGF2bGluYS5rdXNuaWVyb3ZhQGZuby5jeg==