
94% of researchers rate our articles as excellent or good
Learn more about the work of our research integrity team to safeguard the quality of each article we publish.
Find out more
ORIGINAL RESEARCH article
Front. Hum. Neurosci., 26 September 2023
Sec. Brain Imaging and Stimulation
Volume 17 - 2023 | https://doi.org/10.3389/fnhum.2023.1231513
This article is part of the Research TopicMethods and Application in Fractal Analysis of Neuroimaging DataView all 5 articles
 Chiara Marzi1
 Riccardo Scheda2
 Emilia Salvadori3
 Antonio Giorgio4
 Nicola De Stefano4
 Anna Poggesi3Domenico Inzitari3
 Leonardo Pantoni5
 Mario Mascalchi6,7†
 Stefano Diciotti2,8*†
Background: The relative contribution of changes in the cerebral white matter (WM) and cortical gray matter (GM) to the transition to dementia in patients with mild cognitive impairment (MCI) is not yet established. In this longitudinal study, we aimed to analyze MRI features that may predict the transition to dementia in patients with MCI and T2 hyperintensities in the cerebral WM, also known as leukoaraiosis.
Methods: Sixty-four participants with MCI and moderate to severe leukoaraiosis underwent baseline MRI examinations and annual neuropsychological testing over a 2 year period. The diagnosis of dementia was based on established criteria. We evaluated demographic, neuropsychological, and several MRI features at baseline as predictors of the clinical transition. The MRI features included visually assessed MRI features, such as the number of lacunes, microbleeds, and dilated perivascular spaces, and quantitative MRI features, such as volumes of the cortical GM, hippocampus, T2 hyperintensities, and diffusion indices of the cerebral WM. Additionally, we examined advanced quantitative features such as the fractal dimension (FD) of cortical GM and WM, which represents an index of tissue structural complexity derived from 3D-T1 weighted images. To assess the prediction of transition to dementia, we employed an XGBoost-based machine learning system using SHapley Additive exPlanations (SHAP) values to provide explainability to the machine learning model.
Results: After 2 years, 18 (28.1%) participants had transitioned from MCI to dementia. The area under the receiving operator characteristic curve was 0.69 (0.53, 0.85) [mean (90% confidence interval)]. The cortical GM-FD emerged as the top-ranking predictive feature of transition. Furthermore, aggregated quantitative neuroimaging features outperformed visually assessed MRI features in predicting conversion to dementia.
Discussion: Our findings confirm the complementary roles of cortical GM and WM changes as underlying factors in the development of dementia in subjects with MCI and leukoaraiosis. FD appears to be a biomarker potentially more sensitive than other brain features.
Mild cognitive impairment (MCI) is a condition characterized by a variable impairment of cognitive functions that does not interfere with activities of daily living (Gauthier et al., 2006). Over half of the subjects with MCI progress to dementia in the next 5 years (Gauthier et al., 2006). Since vascular and neurodegenerative diseases overlap in the older population and both may underlie MCI and dementia (Jellinger, 2013), distinguishing the respective contributors to the transition to dementia can be difficult. There is great interest in the identification of biomarkers as predictors of the transition to dementia in patients with MCI in longitudinal studies (Jokinen et al., 2012, 2015, 2020; Bilello et al., 2015; Wright and Flores, 2015; Ye et al., 2015; Williams et al., 2017, 2019; Zeestraten et al., 2017; Wu et al., 2019; Egle et al., 2022). Changes in the cerebral subcortical white matter (WM) appearing as areas of decreased density on computed tomography or hyperintensities on T2-weighted MR images, termed leukoaraiosis, are associated with changes in the diffusion of water protons in both T2-weighted hyperintense and normal-appearing WM (O'Sullivan, 2008). Such WM changes are a common finding in elderly subjects whose cognitive functions span from normal to MCI and dementia (Fazekas et al., 1987; Golomb et al., 1995; O'Sullivan, 2008; Inzitari et al., 2009). Leukoaraiosis, along with lacunes and microbleeds, is a marker of small vessel disease (SVD) (Jokinen et al., 2015, 2020; Lambert et al., 2016; Williams et al., 2017, 2019; Zeestraten et al., 2017), but, overall, it is a non-specific finding that is observed in elderly subjects with preserved cognition and patients with Alzheimer's disease (AD) (Fazekas et al., 1987; Golomb et al., 1995; Bracco et al., 2005; O'Sullivan, 2008; Bilello et al., 2015).
The Vascular MCI (VMCI) Tuscany study aimed to identify clinical, neuroimaging, and biological markers predictive of transition to dementia in patients with MCI and leukoaraiosis (Poggesi et al., 2012). In the VMCI Tuscany study, visually assessed MRI features of brain damage included the number of lacunes, microbleeds (Valenti et al., 2016), and dilated perivascular spaces (Mascalchi et al., 2014). Quantitative MRI assessment included volumes of the entire cortical gray matter (GM), hippocampus, and T2 hyperintense WM (Giorgio et al., 2019) and diffusion properties of the T2 hyperintense and normal-appearing WM (Mascalchi et al., 2014; Ciulli et al., 2016). We also considered advanced quantitative features such as the fractal dimension (FD) of the cortical GM and WM (Pantoni et al., 2019)—indices of tissue structural complexity extracted from 3D-T1 weighted images (Marzi et al., 2020).
Herein, our objective was to assess the predictive power for the transition to dementia of various factors, including demographic data, neuropsychological assessments, and both visually and quantitatively assessed MRI features over a 2-year period. This evaluation was conducted on a cohort of 64 patients with MCI and leukoaraiosis as part of the VMCI Tuscany study.
The VMCI Tuscany study was approved by the local ethical committees of the three participating centers in the Tuscany region of Italy, namely Florence, Pisa, and Siena, which shared selection criteria and assessment protocols (Poggesi et al., 2012).
The inclusion criteria for the VMCI Tuscany study were as follows: (1) MCI as defined according to the criteria by Winblad et al. (2004), and (2) evidence of moderate to severe T2 hyperintensity in the cerebral WM, based on the modified version of the Fazekas scale (Pantoni et al., 2005). The VMCI Tuscany study recruited 138 subjects, all of whom provided written informed consent to participate in the study (Salvadori et al., 2018).
Each patient underwent a comprehensive neuropsychological evaluation developed for patients with SVD and MCI (Salvadori et al., 2016), including both global cognitive functioning tests (i.e., Montreal Cognitive Assessment (MoCA) (Nasreddine et al., 2005; Conti et al., 2015) and second-level tests covering different cognitive domains [i.e., Visual Search (VS) (Della Sala et al., 1992), Symbol-Digit Modalities Test (SDMT) (Nocentini et al., 2006), Trail-Making Test (TMT), Part A (Giovagnoli et al., 1996), Color Word Stroop Test (Stroop) (Caffarra et al., 2002), and an immediate copy of the Rey–Osterrieth Complex Figure (ROC-F)]. For the neuropsychological tests, we used the available normative data based on healthy Italian adult samples' national norms to calculate demographically adjusted scores using the regression equations extracted by normative studies (details in Pantoni et al., 2019). The definition of change from MCI to dementia, or major neurocognitive disorder, was conducted in accordance with the DSM-5 criteria (Salvadori et al., 2018). The results of the baseline clinical, neuropsychological (Salvadori et al., 2016, 2018), and MRI assessments have been reported in previous studies (Valenti et al., 2016; Giorgio et al., 2019).
For this study, 64 participants were selected from a single center, and they underwent baseline MRI and annual neuropsychological testing over a 2-year period (Table 1). After 2 years, 18 (28.1%) participants had converted from MCI to dementia. The results of the cross-sectional assessment in this sub-cohort using visually assessed and quantitative MRI features and their correlation with the neuropsychological evaluation were reported in a previous study (Pantoni et al., 2019).
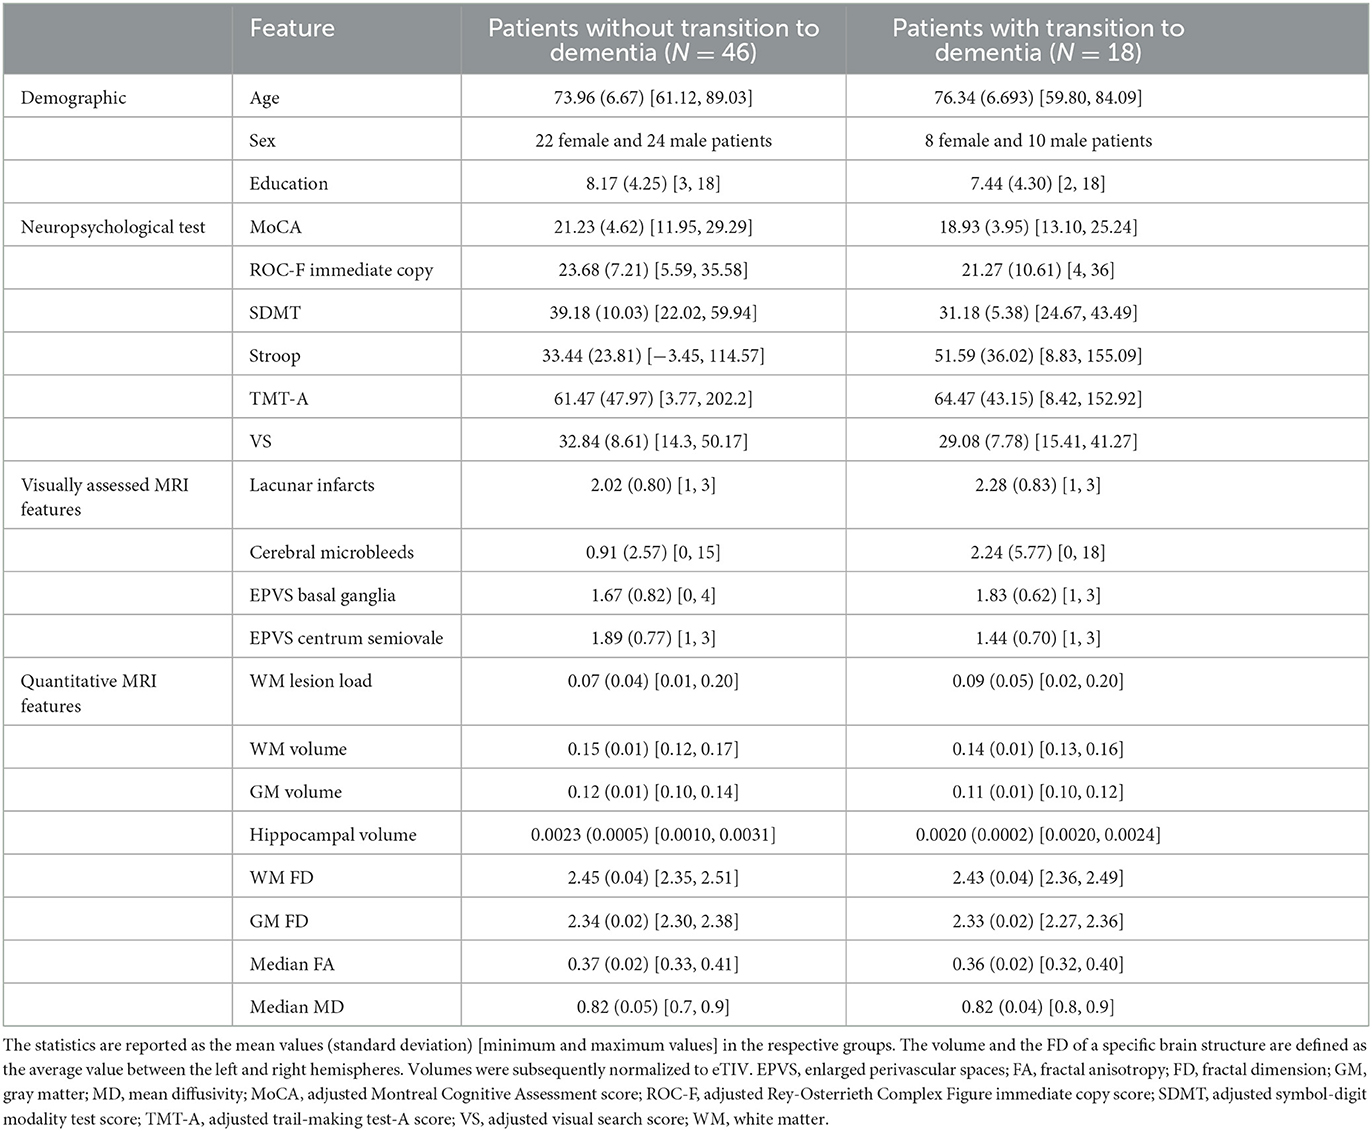
Table 1. Descriptive statistics of demographic, neuropsychological, visually assessed MRI, and quantitative MRI features for patients with and without a 2-year transition to dementia.
All examinations were performed on a 1.5 T system (Intera, Philips Medical System, Best, The Netherlands) with 33 mT/m maximum gradient strength and a 6-channel head coil with SENSE technology. After scouts, we obtained sagittal 3D T1-weighted turbo gradient echo [repetition time (TR) = 8.1 ms, echo time (TE) = 3.7 ms, flip angle = 8°, inversion time (TI) = 764 ms, field of view (FOV) = 256 mm × 256 mm, matrix size = 256 × 256, 160 contiguous slices, slice thickness = 1 mm; number of excitations (NEX) = 1] images, axial T2-weighted FLAIR (TR = 11,000 ms, TE = 140 ms, TI = 2800 ms, flip angle = 90°, FOV = 250 mm × 250 mm, matrix size = 280 × 202, 40 contiguous slices, slice thickness = 3 mm, interslice gap = 0.6 mm, NEX = 1) images, axial T-weighted gradient-echo [TR = 696 ms, TE = 23 ms, flip angle = 18°, FOV = 250 mm × 200 mm, matrix size = 252 × 160, 22 slices, slice thickness = 5 mm, interslice gap = 1 mm, NEX = 2] images, and diffusion-weighted imaging (DWI) volumes using an axial single-shot echo planar imaging sequence [TR = 9,394 ms, TE = 89 ms, FOV = 256 mm, matrix size = 128 × 128, 50 slices, slice thickness = 3 mm, no gap, NEX = 3, diffusion sensitizing gradients applied along 15 non-collinear directions using b value of 0 (b0 image) and 1,000 s/mm2]. An experienced neuroradiologist visually checked all images for possible artifacts prior to image processing.
Figure 1 shows the extraction procedure for the brain MRI features considered in the present investigation and partially described in detail in a previous study (Pantoni et al., 2019).
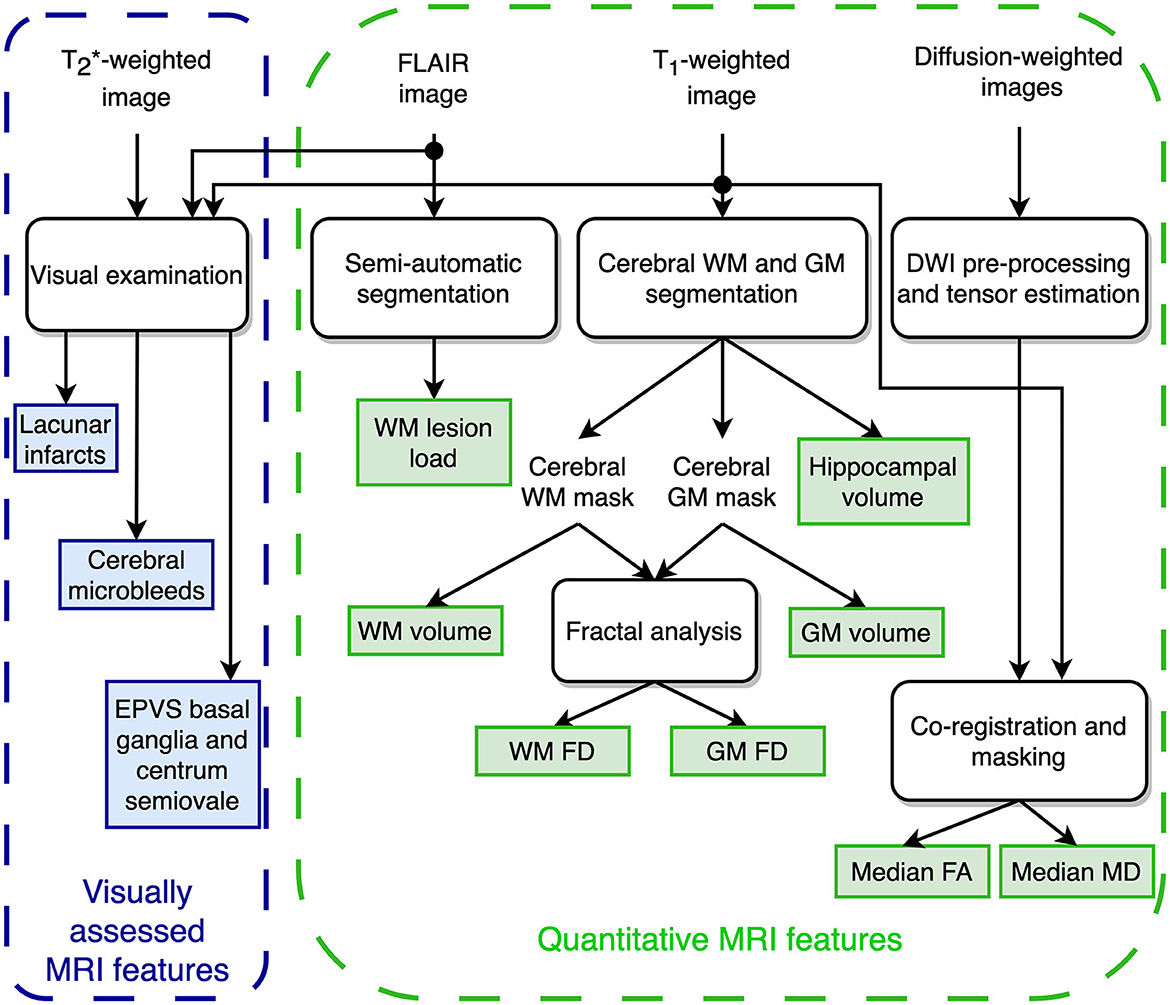
Figure 1. Schematic representation of the MRI features extraction for predicting the transition to dementia.
An experienced observer visually assessed the number of lacunes, cerebral microbleeds, and enlarged perivascular spaces (EPVS). He scored lacunar infarcts, defined as cavities of 3-to-10 mm in diameter, as 0 = (absent), 1 = (1–3), and 3 = (>3) and used the Microbleed Anatomical Rating Scale (MARS) (Gregoire et al., 2009) to assess the total number of microbleeds, defined as small, rounded, or circular, well-defined T2 hypointense focal brain lesions ranging from 2 to 10 mm in diameter. The inter- and intra-observer agreement for rating lacunar infarcts and microbleeds in patients of the VMCI Tuscany cohort was “substantial” or “almost perfect” (Valenti et al., 2016; Mascalchi et al., 2019).
Finally, he assessed the EPVS in the basal ganglia and the centrum semiovale. These were defined as small, sharply delineated structures with cerebrospinal fluid intensity; they followed the orientation of the perforating vessels, ran perpendicular to the brain surface, and were < 3 mm wide. EPVS were scored as 0 = (absent), 1 = ( ≤ 10), 2 = (11–20), 3 = (21–40), and 4 = (≥40).
The WM T2 hyperintensities were quantitatively assessed by computing the lesion load using a semiautomatic segmentation technique based on user-supervised local thresholding (Jim 5.0, Xinapse System, Leicester, UK; www.xinapse.com/Manual/). A single operator outlined the T2 hyperintense WM lesions on FLAIR images. The WM lesion load was then calculated by normalizing the total volume of lesions by the individual's cerebral WM volume.
The FreeSurfer image analysis suite v. 5.3 (http://surfer.nmr.mgh.harvard.edu/) performed cortical reconstruction and volumetric segmentation of the WM, cortical GM, and hippocampus on T1-weighted images (Fischl, 2012). We applied the correction procedures for segmentation and surface reconstruction errors, as proposed by the FreeSurfer developers, to FreeSurfer outputs. They involve editing the brain and WM masks, adding control points, and re-running the FreeSurfer pipeline (https://surfer.nmr.mgh.harvard.edu/fswiki/FsTutorial/TroubleshootingData). To correct all defects, manual editing and re-running were performed by the same operator up to three times (McCarthy et al., 2015). Given the inherently hemispheric nature of the hippocampus, we computed the volumes of the hippocampus, WM, and cortical GM in the left and right hemispheres separately. Then, we calculated the average value of the volume of each structure in the left and right hemispheres and normalized these averages to the estimated intracranial volume (eTIV).
DWI volumes were subjected to head motion and eddy current distortion correction using FDT (FMRIB's Diffusion Toolbox 2.0), a component of FSL 4.1.9 (Smith et al., 2004). Subsequently, brain tissue was extracted using BET (Smith, 2002). The b-matrix was reoriented by applying the rotational part of the affine transformation employed during the eddy-correction step (Leemans and Jones, 2009). A tensor model was then fitted to the raw data using a constrained non-linear least squares procedure implemented in the CAMINO package (Cook et al., 2006). Any residual non-positive definite tensors in isolated regions, primarily located at the edge of the brain, were eliminated through tensor interpolation in the log-euclidean domain (Arsigny et al., 2006). Finally, fractional anisotropy (FA) and mean diffusivity (MD) were computed from the estimated tensor field. Median MD and FA values of the cerebral WM were computed using a previously described procedure (De Stefano et al., 2006; Mascalchi et al., 2014).
Among different methods to compute the FD, we selected the 3-D box-counting algorithm (Russell et al., 1980), a fairly direct and reliable method to analyze fractal objects. The algorithm involves overlaying a grid of cubes of side length s onto a binary segmentation of a brain structure, counting the number of cubes N(s) needed to enclose the structure, and repeating this process for different values of s. To prevent any systematic influence of the grid placement, for each s value, we applied 20 uniformly distributed random offsets to the grid origin, and the relative box count was averaged to obtain a single N(s) value (Goñi et al., 2013). The FD of the structure is then computed by modeling the data points N(s) vs. s in a log-log plane as a linear regression function and calculating the absolute value of the slope of the regression line. In the natural scale, the FD, a measure of space-filling, is the exponent (sign changed) of a power law that describes the relationship between the number of cubes enclosing the structure and their side length.
Generally, a natural object such as a brain structure shows its fractal properties in a limited interval of spatial scales, named the fractal scaling window, which is unknown a priori. Therefore, we applied an automated selection of spatial scales for each brain region, searching for the interval of spatial scales in which the linear regression shows the best fit, as measured by the rounded coefficient of determination adjusted for the number of data points (R). The fractal analysis was carried out using the fractalbrain toolkit version 1.1 (Marzi, 2023) (freely available at https://github.com/chiaramarzi/fractalbrain-toolkit) and described in detail in Marzi et al. (2020).
In this study, we examined the fractal properties of both WM and cortical GM by calculating and averaging the FD from both the left and right hemispheres of each structure.
To forecast the transition to dementia, we used an explainable machine learning (ML) framework fed by baseline demographical, neuropsychological, visual, and quantitative MRI features. During the training phase, missing values in the data were imputed by replacing them with the average value of the corresponding feature. Additionally, standardization was performed by rescaling each feature to have a mean of zero and a variance of one. These imputation and standardization techniques were exclusively learned during the training phase and subsequently applied in the validation and testing phases, leading to an unbiased generalization performance.
The explainable ML framework was trained, validated, and tested through a repeated stratified nested validation procedure (Figure 2). Nested validation is a technique that reduces the possibility of overfitting and model hyperparameter optimization, along with estimating the generalization error on unseen data (Müller and Guido, 2016). We chose bootstrap resampling for the outer split and a 5-fold cross-validation (CV) for the inner loop. We selected a number of folds equal to 5 because it offers a favorable bias-variance trade-off (Hastie et al., 2013). In detail, for each repetition of the bootstrap resampling, the entire dataset was divided by sampling—with replacement—the instances contained in the original dataset to form an outer training set. The outer test set included the unique instances that were not selected for the training set, i.e., the out-of-bag samples. The outer training set was then used for hyperparameter optimization through an inner subject-level 5-fold CV. The subject-level splitting ensures that the repetitions present in the outer training set are either in the inner training set or in the inner validation set, preventing data leakage (Yagis et al., 2021). Once the combination of hyperparameter values that minimized the out-of-sample prediction error (Hastie et al., 2013) had been found in the inner CV, the model with that combination of hyperparameters' values was re-trained on the outer training set and tested on the unseen outer test set, thus preventing any form of peeking effect (Diciotti et al., 2013). The stratified sampling ensured that samples possessing a particular characteristic, i.e., the transition to dementia, were selected in the same proportion in the training, validation, and test sets as they existed in the entire dataset. The stratified nested validation was repeated 100 times with different bootstrap data splitting to attenuate the dependencies of the model from the training data, along with reducing performance estimation variance while maintaining a minimal bias (Molinaro et al., 2005; Kim, 2009).
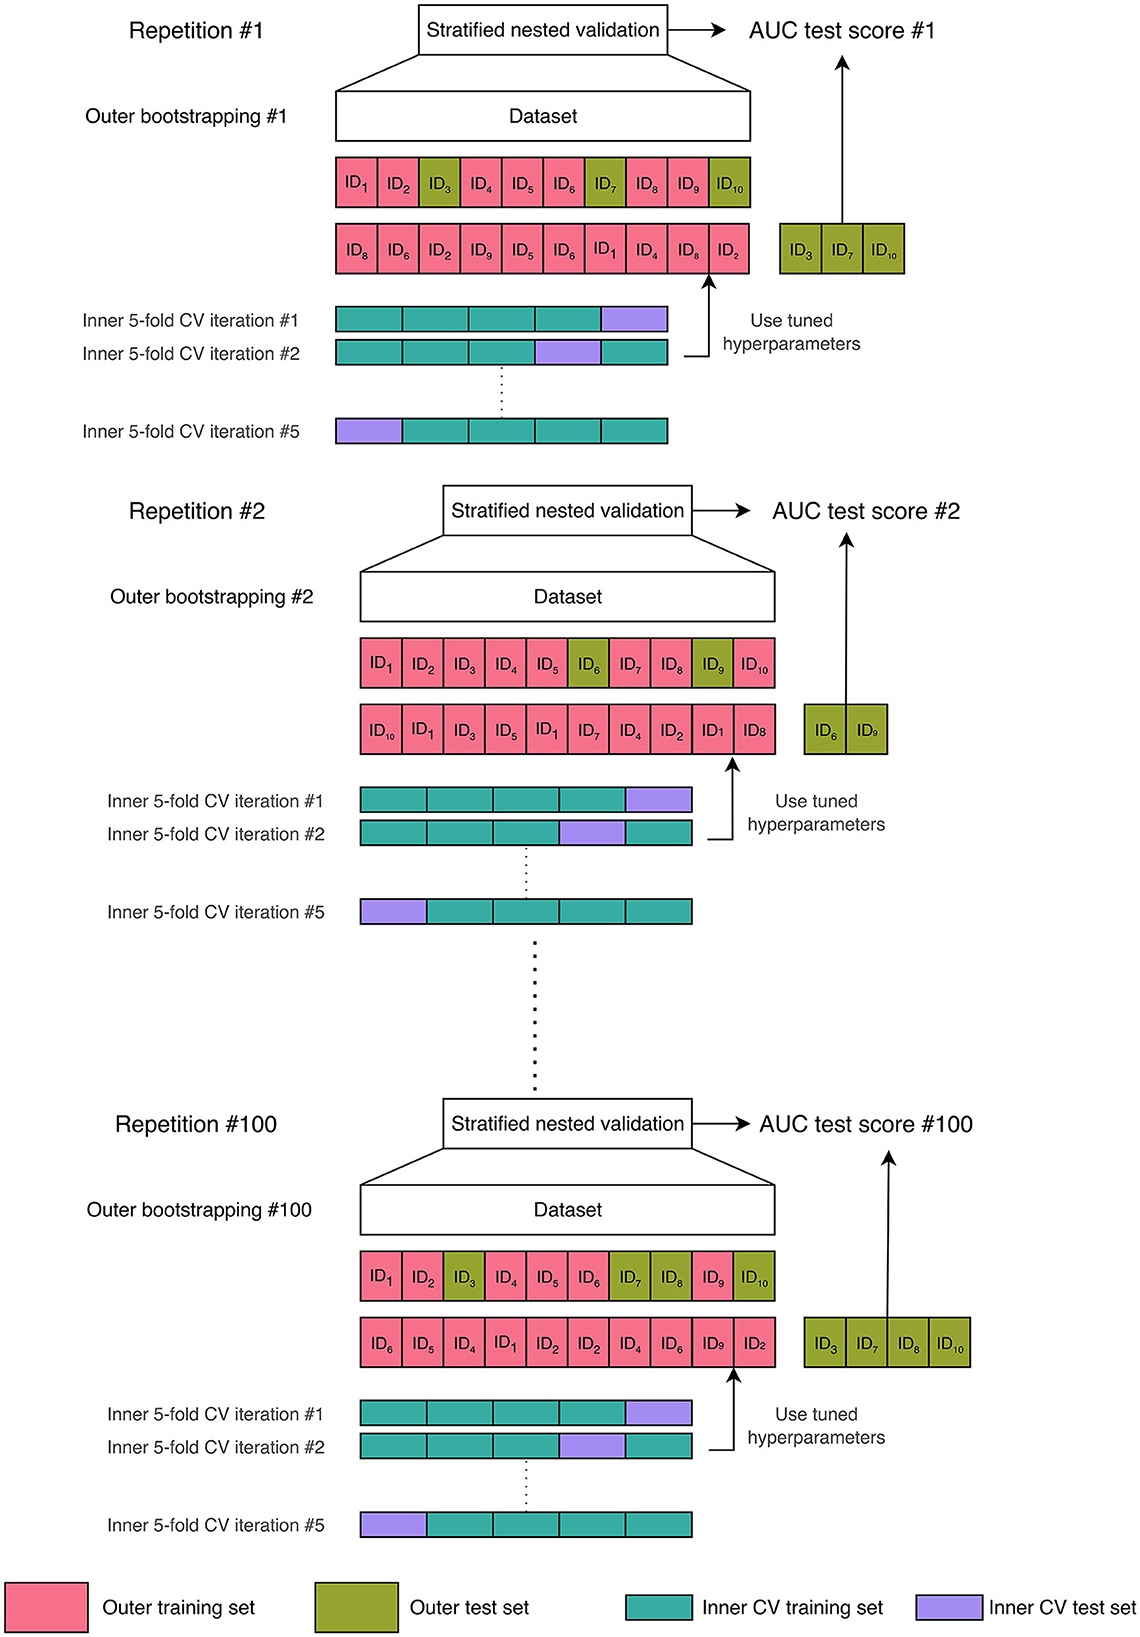
Figure 2. Machine learning validation scheme: 100-times repeated stratified nested validation procedure. In the figure, we chose a dataset comprising ten samples to provide a comprehensive illustration of the bootstrap resampling procedure with replacement. When applying bootstrap resampling to our actual dataset, which contains 64 subjects, we obtain an outer training set consisting of 64 instances (some of which are repeated) and an outer test set that comprises the unique instances not included in the training set, referred to as the out-of-bag samples. The outer training set was then used for an inner subject-level 5-fold cross-validation (CV) for hyperparameter optimization.
The explainable ML framework utilized in this study employed an Extreme Gradient Boosting Classifier (XGboost) model. This model, based on tree-based machine learning, has demonstrated effectiveness in addressing various recent challenges in the field of machine learning (Chen and Guestrin, 2016). The hyperparameters of the model were selected through a random search within the inner CV process. The hyperparameter space was defined as follows: the minimum loss reduction required for further partitioning a leaf node of the tree γ ∈s (0.6, 0.7, 0.8), the subsample ratio of columns used when constructing each tree colsample_bytree ∈ (0.25, 0.5, 0.75, 1), the maximum depth of a tree max_depth ∈ (2, 3, 4), the minimum number of instances required in each node min_child_weight ∈ (2, 3, 5), the number of decision trees n_estimators ∈ (5, 10, 20, 100), and the ratio of training data randomly sampled before growing trees subsample ∈ (0.1, 0.2, 0.4).
For each repetition of the stratified nested validation, the classifier's performance was evaluated on the outer test set using the area under the receiver operating characteristic (ROC) curve (AUC). The mean AUC and the 90% confidence interval (CI) were reported as the final performance. To verify whether the performance of our classifier was significantly superior to that of a random guessing classifier (Fawcett, 2006), we compared the AUC values with the value 0.5, i.e., the chance-level performance, through a one-tailed Wilcoxon signed rank with a significance level of 5%. By considering the coordinates of the ROC curve obtained from the data of the outer test set at each repetition of the stratified nested validation, we built a median ROC curve. The optimal operating point on the median ROC curve was identified as the point with the highest Youden's index, denoted as J = sensitivity + specificity – 1 (Youden, 1950).
Furthermore, we used SHAP (Lundberg, 2017), an explainable AI technique that enables the determination of feature contributions to each model output. Each SHAP value represents a real number associated with a particular feature of an individual sample (i.e., a subject). The sign of the SHAP value indicates the direction in which the feature influences the output for a specific subject. To obtain the feature contributions, SHAP values were computed for the outer test set during each repetition of the repeated nested validation and were subsequently averaged, in absolute value, across patients (Scheda and Diciotti, 2022). Therefore, we obtained 100 global SHAP values for each feature and calculated the median over the repetitions as the final global feature importance. The global contribution of the top-ranking predictive feature was compared to the second feature of the ranking through a one-tailed Wilcoxon signed rank with a significance of 0.05. In addition to assessing the individual contributions of each feature toward predicting the transition to dementia, we also averaged the SHAP values over specific feature categories (i.e., a sum of the SHAP values of all features belonging to a category divided by the total number of features in the category). These categories included demographic features (age, sex, and education), adjusted neuropsychological scores (MoCA, TMT-A, ROC-F immediate copy, SDMT, Stroop, VS), visually assessed MRI features (lacunar infarcts, cerebral microbleeds, EPVS basal ganglia, EPVS centrum semiovale), and quantitative MRI features (WM lesion load, GM FD, WM FD, hippocampal volume, GM volume, WM volume, Median MD, Median FA). By grouping the SHAP values according to these feature categories, we gained a comprehensive understanding of their combined contributions to the prediction of the transition to dementia.
To forecast the transition to dementia, the mean ROC AUC was 0.69 with a 90% CI of (0.53, 0.85). The AUC value of our classifier was significantly higher than the chance-level performance (one-tailed Wilcoxon signed rank p-value < 0.001). Through ROC curve analysis (Figure 3), we identified a specific operating point that maximized Youden's index, gaining a sensitivity of 0.67 and a specificity of 0.67.
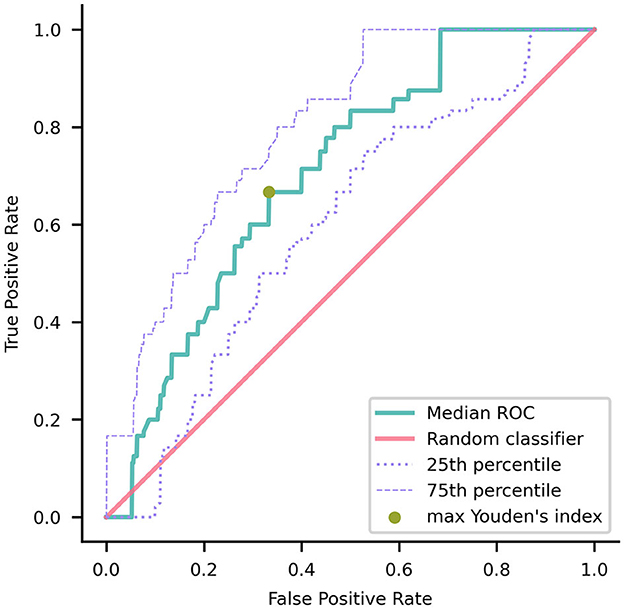
Figure 3. Median receiver operating characteristic (ROC) curve of the model trained using nested validation over 100 repetitions. The gold point on the ROC curve corresponds to the coordinates (0.33, 0.67) where the maximal Youden's index is achieved. The red overlay represents the ROC curve of a random classifier, serving as a reference. The dotted and dashed purple curves indicate the 25th and 75th percentiles, respectively.
Notably, the GM FD was the top-ranking predictive feature (Figure 4). The median absolute SHAP value of the GM FD was significantly higher than that of the second-ranking feature, i.e., hippocampal volume (one-tailed Wilcoxon signed rank p-value < 0.001). SDMT score, cortical GM volume, Stroop score, EPVS centrum semiovale, WM FD, age, MoCA score, and WM lesion load were the main important predictive features. The aggregated quantitative neuroimaging features exhibited superior predictive capabilities compared to visually assessed MRI features (Figure 5). Figure 6 illustrates the visualization of mean SHAP values corresponding to specific features within individual samples (subjects). This visualization aims to provide a concise representation of how the dataset's features influence the model's output. Each subject is depicted by a single dot for every feature. The SHAP value of a feature determines the horizontal position of the dot, and dots accumulate along each feature's row to depict density. Colors are utilized to indicate the original feature values. In essence, this plot enables us to observe the SHAP value for each feature in every sample. In this graphical representation, a dot's color varies (from blue to pink) according to whether the feature value is high or low. Additionally, its position on the graph shifts (from the base SHAP value to the right or left) based on its influence on the model's decision (i.e., its SHAP value). As depicted in Figure 6, lower FD values, showing decreased cortical GM structural complexity, significantly affects the model's decision, guiding it toward the transition to dementia class.
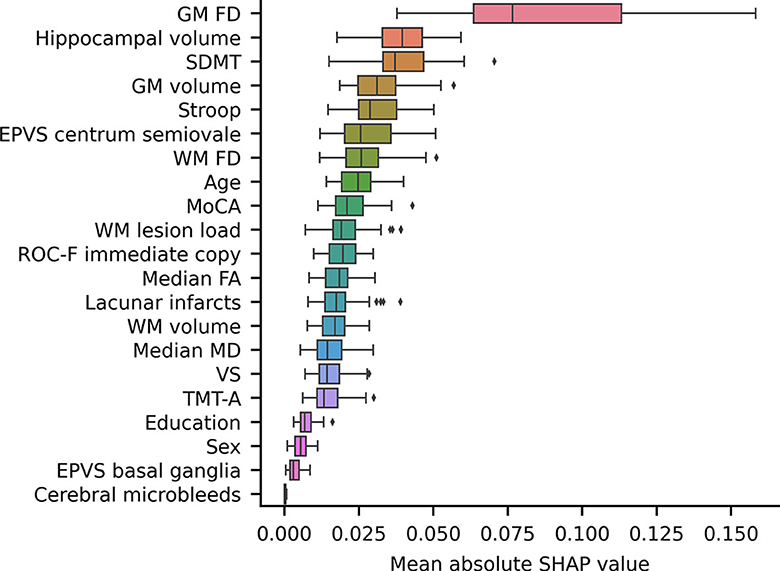
Figure 4. A box plot showing the mean absolute SHAP values of each feature, sorted in ascending order. The volume and the FD of a specific brain structure are defined as the average values among the left and right hemispheres. Volumes were subsequently normalized to eTIV. EPVS, enlarged perivascular spaces; FD, fractal dimension; GM, gray matter; MoCA, adjusted Montreal Cognitive Assessment score; SDMT, adjusted symbol-digit modality test score; WM, white matter.
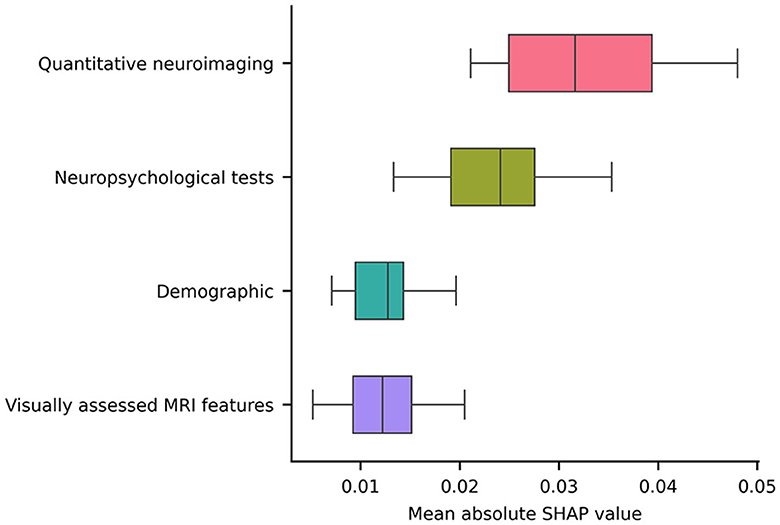
Figure 5. A box plot illustrating the averaged absolute SHAP values over each category (i.e., a sum of the SHAP values of all features belonging to a category divided by the total number of features in the category).
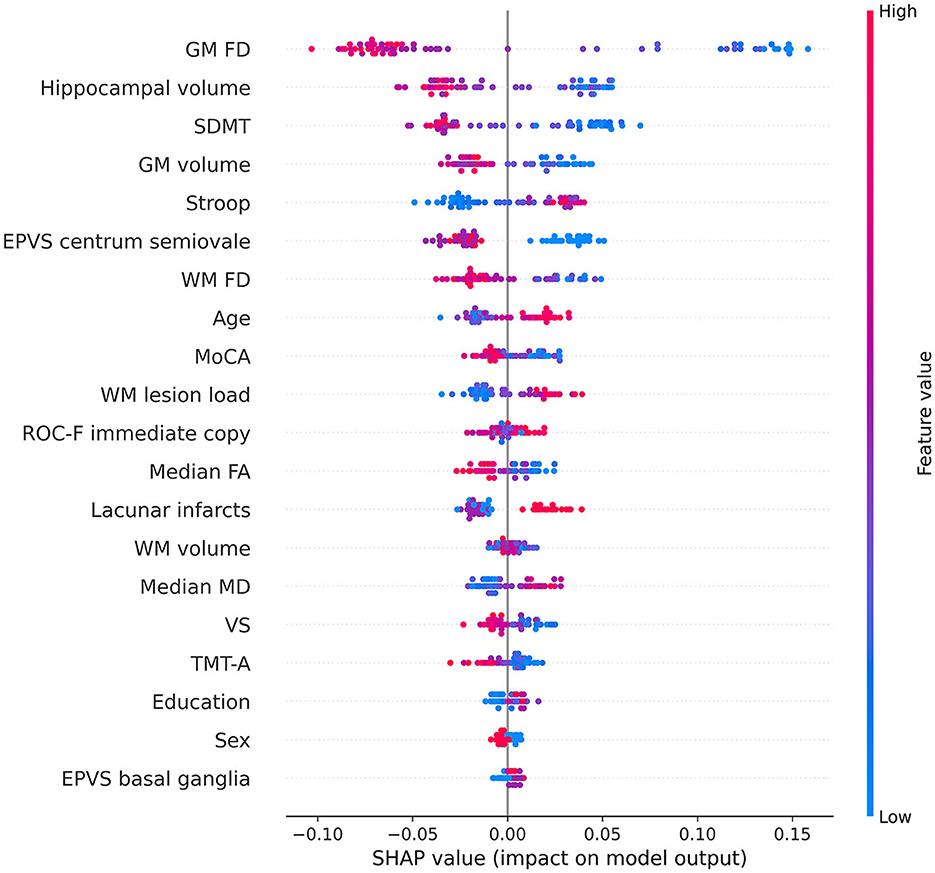
Figure 6. Beeswarm summary plot depicting representative SHAP values. Each feature row for each sample (i.e., subject) is represented by a single dot, with the x position determined by the corresponding SHAP value. Dots accumulate along each feature row to indicate density. The color of each dot represents the original value of the feature. The volume and the FD of a specific brain structure are defined as the average values among the left and right hemispheres. Volumes were subsequently normalized to eTIV. EPVS, enlarged perivascular spaces; FA, fractal anisotropy; FD, fractal dimension; GM, gray matter; MD, mean diffusivity; MoCA, adjusted Montreal Cognitive Assessment score; ROC-F, adjusted Rey-Osterrieth Complex Figure immediate copy score; SDMT, adjusted symbol-digit modality test score; TMT-A, adjusted trail making test-A score; VS, adjusted visual search score; WM, white matter.
Predicting the transition to dementia in patients with MCI is of utmost importance, as it could enable the implementation of therapies aimed at slowing or halting the progression of the disease. In a previous cross-sectional study that involved the same MCI and leukoaraiosis cohort as the current investigation, we observed that different combinations of MRI features were predictive of the cognitive status at baseline. Notably, the FD of the WM was consistently identified as the most frequently selected feature for this purpose (Pantoni et al., 2019). In this longitudinal investigation, we expanded our evaluation to include the same features, hippocampal volume, and diffusion indexes of the WM, which are well-established correlates of cognitive impairment (O'Sullivan, 2008; Mascalchi et al., 2013; Zeestraten et al., 2017). First, we wish to point out that the overall predictive performance achieved by a series of demographic, neuropsychological, and MRI features was not exceptionally high, as reflected by a mean (90% CI) ROC area of 0.69 (0.53, 0.85). We speculate that this relatively modest performance might be attributed to the broad clinical-instrumental definition of VMCI used in our study, potentially including cases with concomitant and potentially prevalent AD pathology within our sample.
Interestingly, the FD of the cortical GM emerged as the most remarkable and best predictor for this transition. Furthermore, the FD and volume of the cortical GM exhibited superior predictive performance compared to the WM lesion load, diffusion-derived indices, and FD of the cerebral WM. Notably, when features of the same type were aggregated, quantitative neuroimaging features demonstrated superior predictive capability compared to neuropsychological tests, visually assessed MRI features, and demographic factors.
Our findings provide further confirmation that cortical GM is closely associated with leukoaraiosis, as demonstrated by previous studies (Lambert et al., 2015; Ye et al., 2015; Heinen et al., 2020). Moreover, our results highlight the contribution of GM atrophy to the transition to dementia in patients with MCI and leukoaraiosis (Jokinen et al., 2012, 2020; Bilello et al., 2015; Wu et al., 2019; Fan et al., 2021). Specifically, it has been observed that cortical atrophy associated with leukoaraiosis exhibits a distinct distribution in the dorsolateral prefrontal, parietal, and posterior-superior temporal cortices, differing from the cortical changes associated with normal aging (Lambert et al., 2015; Ye et al., 2015; Heinen et al., 2020). Additionally, studies have indicated a correlation between the progression of cortical atrophy and leukoaraiosis over time (Lambert et al., 2016). Furthermore, atrophy in the hippocampal and medial temporal lobes has been identified as an underlying factor contributing to cognitive deficits in patients with leukoaraiosis (Bastos-Leite et al., 2007; Jokinen et al., 2020; Chen et al., 2021; Fan et al., 2021; Sun et al., 2022) and has been associated with their transition to dementia in these individuals (Jokinen et al., 2012, 2020). The exact nature of cortical changes in relation to leukoaraiosis and SVD remains uncertain, as some studies suggest that these changes could be secondary effects of leukoaraiosis/SVD (Bastos-Leite et al., 2007; Jokinen et al., 2020; Chen et al., 2021), while others propose the involvement of a dual pathology with accompanying AD (Jellinger, 2013; Ye et al., 2015; Wu et al., 2019). Notably, our study reveals that subtle changes in cortical GM, manifested as decreased FD, better anticipate the transition from MCI to dementia compared to overt cortical atrophy. In parallel, it is well-established that “invisible” changes in terms of subtle T2 signal changes (Jokinen et al., 2015) or diffusion properties (Zeestraten et al., 2017; Williams et al., 2019; Egle et al., 2022) can be observed in the normal-appearing WM of patients with leukoaraiosis, and these changes are predictive of cognitive decline. In line with these findings, our study suggests that the FD of the WM may serve as an additional marker for the subtle structural changes occurring in the WM of patients with leukoaraiosis.
The findings of this study further strengthen the evidence that FD provides supplementary information beyond what is offered by other conventional structural features (Free et al., 1996; Im et al., 2006; Sandu et al., 2008a,b, 2014a,b, 2022; King et al., 2009, 2010; Madan and Kensinger, 2016, 2018; Marzi et al., 2018, 2020, 2021, 2022; Pantoni et al., 2019; Pani et al., 2022; Nazlee and Waiter, 2023) and has potential relevant practical and diagnostic implications, particularly regarding the MRI evaluation of the cortical GM. Importantly, the FD measurement can be derived from standard, high-resolution 3D T1-weighted images commonly included in clinical MRI protocols. This means that FD assessment does not necessitate additional dedicated acquisitions, such as magnetization transfer imaging, which is capable of detecting subtle microstructural changes in the cortical GM in both inherited and sporadic AD (Ginestroni et al., 2009; Mascalchi et al., 2013). By contrast, nuclear medicine techniques for assessing cortical GM metabolism or amyloid deposits for the differential diagnosis of patients with leukoaraiosis have not been widely implemented (Ye et al., 2015; Altomare et al., 2023). Therefore, using FD measurements from standard MRI scans may represent a valuable and accessible tool in clinical practice for evaluating cortical GM alterations without requiring additional specialized imaging techniques.
We acknowledge several limitations in our study. First, the relatively small sample size and the fact that the study was conducted at a single center may affect the generalizability of our findings. The sample was collected in a highly qualified referral university hospital where patients fulfilling admission criteria were consecutively identified and carefully evaluated before enrollment. Of course, this cannot support the full generalizability of the results. Therefore, to enhance the robustness and generalizability of the results, further validation in independent samples would be beneficial. Second, the consideration of whole brain structures rather than regional FD differences does not allow for the demonstration of the distributed microstructural or overt changes that are known to occur in vascular MCI and dementia. Finally, longitudinal MRI data would be valuable to better elucidate the underlying mechanisms. Unfortunately, such longitudinal data are not available for our study.
In conclusion, our study highlights that the transition to dementia from MCI in patients with leukoaraiosis is associated with subtle alterations in both the cerebral cortical GM and WM, as reflected by altered FD. Notably, our findings suggest that the FD changes observed in the cortical GM exhibit a stronger predictive value for future transitions compared to other brain measurements. The FD of the cortical GM emerges as a biomarker that is potentially more sensitive than other brain measurements for predicting the transition to dementia.
The data analyzed in this study is subject to the following licenses/restrictions: The participants of this study did not give written consent for their data to be shared publicly. Requests to access these datasets should be directed to SD, c3RlZmFuby5kaWNpb3R0aUB1bmliby5pdA==.
The studies involving humans were approved by Ethics Committee of Careggi Hospital. The studies were conducted in accordance with the local legislation and institutional requirements. The participants provided their written informed consent to participate in this study.
MM and SD are jointly supervised this work. ES performed the neuropsychological evaluation. AP and MM visually assessed MR images. AG assessed white matter hyperintensities in FLAIR images. CM and SD processed MR images and implemented the fractal analysis. RS performed the machine learning analysis. CM, MM, and SD wrote the first draft of the manuscript. All authors interpreted the results, contributed to manuscript revision, read, and approved the submitted version.
The VMCI-Tuscany study was funded by Tuscany region (Programma per la Ricerca Regionale in Materia di Salute 2009).
The authors declare that the research was conducted in the absence of any commercial or financial relationships that could be construed as a potential conflict of interest.
All claims expressed in this article are solely those of the authors and do not necessarily represent those of their affiliated organizations, or those of the publisher, the editors and the reviewers. Any product that may be evaluated in this article, or claim that may be made by its manufacturer, is not guaranteed or endorsed by the publisher.
Altomare, D., Barkhof, F., Caprioglio, C., Collij, L. E., Scheltens, P., Lopes Alves, I., et al. (2023). Clinical effect of early vs late amyloid positron emission tomography in memory clinic patients: the AMYPAD-DPMS randomized clinical trial. JAMA Neurol. 8, e230997. doi: 10.1001/jamaneurol.2023.0997
Arsigny, V., Fillard, P., Pennec, X., and Ayache, N. (2006). Log-Euclidean metrics for fast and simple calculus on diffusion tensors. Magn. Reson. Med. 56, 411–421. doi: 10.1002/mrm.20965
Bastos-Leite, A. J., Van Der Flier, W. M., Van Straaten, E. C. W., Staekenborg, S. S., Scheltens, P., Barkhof, F., et al. (2007). The contribution of medial temporal lobe atrophy and vascular pathology to cognitive impairment in vascular dementia. Stroke. 38, 3182–3185. doi: 10.1161/STROKEAHA.107.490102
Bilello, M., Doshi, J., Nabavizadeh, S. A., Toledo, J. B., Erus, G., Xie, S. X., et al. (2015). Correlating cognitive decline with white matter lesion and brain atrophy magnetic resonance imaging measurements in Alzheimer's disease. JAD. 48, 987–994. doi: 10.3233/JAD-150400
Bracco, L., Piccini, C., Moretti, M., Mascalchi, M., Sforza, A., Nacmias, B., et al. (2005). Alzheimer's disease: role of size and location of white matter changes in determining cognitive deficits. Dement Geriatr. Cogn. Disord. 20, 358–366. doi: 10.1159/000088562
Caffarra, P., Vezzadini, G., Dieci, F., Zonato, F., and Venneri, A. A. (2002). short version of the Stroop test: normative data in an Italian population sample. Nuova Riv. Neurol. 12, 111–115.
Chen, L., Song, J., Cheng, R., Wang, K., Liu, X., He, M., et al. (2021). Cortical thinning in the medial temporal lobe and precuneus is related to cognitive deficits in patients with subcortical ischemic vascular disease. Front. Aging Neurosci. 12, 614833. doi: 10.3389/fnagi.2020.614833
Chen, T., and Guestrin, C. (2016). “XGBoost: a scalable tree boosting system,” in Proceedings of the 22nd ACM SIGKDD International Conference on Knowledge Discovery and Data Mining (San Francisco, CA, USA: ACM), p. 785–94. doi: 10.1145/2939672.2939785
Ciulli, S., Citi, L., Salvadori, E., Valenti, R., Poggesi, A., Inzitari, D., et al. (2016). Prediction of impaired performance in trail making test in MCI patients with small vessel disease using DTI Data. IEEE J. Biomed. Health Inform. 20, 1026–1033. doi: 10.1109/JBHI.2016.2537808
Conti, S., Bonazzi, S., Laiacona, M., Masina, M., and Coralli, M. V. (2015). Montreal Cognitive Assessment (MoCA)-Italian version: regression based norms and equivalent scores. Neurol. Sci. 36, 209–214. doi: 10.1007/s10072-014-1921-3
Cook, P. A., Bai, Y., Nedjati-Gilani, S., Seunarine, K. K., Hall, M. G., Parker, G. J., et al. (2006). “Camino: Open-Source Diffusion-MRI Reconstruction and Processing,” in 14th Scientific Meeting of the International Society for Magnetic Resonance in Medicine, Seattle, WA, USA 2759. doi: 10.54294/fgfrtv
De Stefano, N., Battaglini, M., Stromillo, M., Zipoli, V., Bartolozzi, M., Guidi, L., et al. (2006). Brain damage as detected by magnetization transfer imaging is less pronounced in benign than in early relapsing multiple sclerosis. Brain. 129, 2008–2016. doi: 10.1093/brain/awl152
Della Sala, S., Laiacona, M., Spinnler, H., and Ubezio, C. (1992). A cancellation test: its reliability in assessing attentional deficits in Alzheimer's disease. Psychol. Med. 22, 885–901. doi: 10.1017/S0033291700038460
Diciotti, S., Ciulli, S., Mascalchi, M., Giannelli, M., and Toschi, N. (2013). The “Peeking” effect in supervised feature selection on diffusion tensor imaging data. Am. J. Neuroradiol. 34, E107–E107. doi: 10.3174/ajnr.A3685
Egle, M., Hilal, S., Tuladhar, A. M., Pirpamer, L., Hofer, E., Duering, M., et al. (2022). Prediction of dementia using diffusion tensor MRI measures: the OPTIMAL collaboration. J. Neurol. Neurosurg. Psychiatry. 93, 14–23. doi: 10.1136/jnnp-2021-326571
Fan, Y., Shen, M., Huo, Y., Gao, X., Li, C., Zheng, R., et al. (2021). Total cerebral small vessel disease burden on MRI correlates with medial temporal lobe atrophy and cognitive performance in patients of a memory clinic. Front. Aging Neurosci. 13, 698035. doi: 10.3389/fnagi.2021.698035
Fawcett, T. (2006). An introduction to ROC analysis. Patt. Recogn. Lett. 27, 861–874. doi: 10.1016/j.patrec.2005.10.010
Fazekas, F., Chawluk, J. B., Alavi, A., Hurtig, H. I., and Zimmerman, R. A. M. R. (1987). signal abnormalities at 1.5 T in Alzheimer's dementia and normal aging. Am. J. Roentgenol. 149, 351–356. doi: 10.2214/ajr.149.2.351
Free, S. L., Sisodiya, S. M., Cook, M. J., Fish, D. R., and Shorvon, S. D. (1996). Three-dimensional fractal analysis of the white matter surface from magnetic resonance images of the human brain. Cereb Cortex. 6, 830–836. doi: 10.1093/cercor/6.6.830
Gauthier, S., Reisberg, B., Zaudig, M., Petersen, R. C., Ritchie, K., Broich, K., et al. (2006). Mild cognitive impairment. Lancet. 367, 1262–1270. doi: 10.1016/S0140-6736(06)68542-5
Ginestroni, A., Battaglini, M., Della Nave, R., Moretti, M., Tessa, C., Giannelli, M., et al. (2009). Early structural changes in individuals at risk of familial Alzheimer's disease: a volumetry and magnetization transfer MR imaging study. J. Neurol. 256, 925–932. doi: 10.1007/s00415-009-5044-3
Giorgio, A., Di Donato, I., De Leucio, A., Zhang, J., Salvadori, E., Poggesi, A., et al. (2019). Relevance of brain lesion location for cognition in vascular mild cognitive impairment. NeuroImage. 22, 101789. doi: 10.1016/j.nicl.2019.101789
Giovagnoli, A. R., Del Pesce, M., Mascheroni, S., Simoncelli, M., Laiacona, M., Capitani, E., et al. (1996). Trail making test: normative values from 287 normal adult controls. Ital. J. Neuro. Sci. 17, 305–309. doi: 10.1007/BF01997792
Golomb, J., Kluger, A., Gianutsos, J., Ferris, S. H., de Leon, M. J., George, A. E., et al. (1995). Nonspecific leukoencephalopathy associated with aging. Neuroimag. Clin. N Am. 5, 33–44.
Goñi, J., Sporns, O., Cheng, H., Aznárez-Sanado, M., Wang, Y., Josa, S., et al. (2013). Robust estimation of fractal measures for characterizing the structural complexity of the human brain: Optimization and reproducibility. NeuroImage. 83, 646–657. doi: 10.1016/j.neuroimage.2013.06.072
Gregoire, S. M., Chaudhary, U. J., Brown, M. M., Yousry, T. A., Kallis, C., Jager, H. R., et al. (2009). The microbleed anatomical rating scale (MARS): Reliability of a tool to map brain microbleeds. Neurology. 73, 1759–1766. doi: 10.1212/WNL.0b013e3181c34a7d
Hastie, T., Tibshirani, R., and Friedman, J. (2013). The Elements of Statistical Learning. New York, NY: Springer New York (Springer Series in Statistics).
Heinen, R., Groeneveld, O. N., Barkhof, F., Bresser, J., Exalto, L. G., Kuijf, H. J., et al. (2020). Small vessel disease lesion type and brain atrophy: The role of co-occurring amyloid. Alzheimer's Dement. 12, 60. doi: 10.1002/dad2.12060
Im, K., Lee, J. M., Yoon, U., Shin, Y. W., Hong, S. B., Kim, I. Y., et al. (2006). Fractal dimension in human cortical surface: Multiple regression analysis with cortical thickness, sulcal depth, and folding area. Hum. Brain Mapp. 27, 994–1003. doi: 10.1002/hbm.20238
Inzitari, D., Pracucci, G., Poggesi, A., Carlucci, G., Barkhof, F., Chabriat, H., et al. (2009). Changes in white matter as determinant of global functional decline in older independent outpatients: three year follow-up of LADIS (leukoaraiosis and disability) study cohort. BMJ. 339, b2477–b2477. doi: 10.1136/bmj.b2477
Jellinger, K. A. (2013). Pathology and pathogenesis of vascular cognitive impairment—a critical update. Front. Aging Neurosci. 5, 17. doi: 10.3389/fnagi.2013.00017
Jokinen, H., Gonçalves, N., Vigário, R., Lipsanen, J., Fazekas, F., Schmidt, R., et al. (2015). Early-stage white matter lesions detected by multispectral MRI segmentation predict progressive cognitive decline. Front. Neurosci. 9, 455. doi: 10.3389/fnins.2015.00455
Jokinen, H., Koikkalainen, J., Laakso, H. M., Melkas, S., Nieminen, T., Brander, A., et al. (2020). Global burden of small vessel disease–related brain changes on mri predicts cognitive and functional decline. Stroke. 51, 170–178. doi: 10.1161/STROKEAHA.119.026170
Jokinen, H., Lipsanen, J., Schmidt, R., Fazekas, F., Gouw, A. A., Van Der Flier, W. M., et al. (2012). Brain atrophy accelerates cognitive decline in cerebral small vessel disease: The LADIS study. Neurology. 78, 1785–1792. doi: 10.1212/WNL.0b013e3182583070
Kim, J. H. (2009). Estimating classification error rate: Repeated cross-validation, repeated hold-out and bootstrap. Computat. Stat. Data Analy. 53, 3735–3745. doi: 10.1016/j.csda.2009.04.009
King, R. D., Brown, B., Hwang, M., Jeon, T., and George, A. T. (2010). Alzheimer's Disease Neuroimaging Initiative. Fractal dimension analysis of the cortical ribbon in mild Alzheimer's disease. Neuroimage. 53, 471–479. doi: 10.1016/j.neuroimage.2010.06.050
King, R. D., George, A. T., Jeon, T., Hynan, L. S., Youn, T. S., Kennedy, D. N., et al. (2009). Characterization of atrophic changes in the cerebral cortex using fractal dimensional analysis. Brain Imag. Behav. 3, 154–166. doi: 10.1007/s11682-008-9057-9
Lambert, C., Benjamin, P., Zeestraten, E., Lawrence, A. J., Barrick, T. R., Markus, H. S., et al. (2016). Longitudinal patterns of leukoaraiosis and brain atrophy in symptomatic small vessel disease. Brain. 139, 1136–1151. doi: 10.1093/brain/aww009
Lambert, C., Sam Narean, J., Benjamin, P., Zeestraten, E., Barrick, T. R., Markus, H. S., et al. (2015). Characterising the grey matter correlates of leukoaraiosis in cerebral small vessel disease. NeuroImage. 9, 194–205. doi: 10.1016/j.nicl.2015.07.002
Leemans, A., and Jones, D. K. (2009). The B-matrix must be rotated when correcting for subject motion in DTI data. Magn. Reson. Med. 61, 1336–1349. doi: 10.1002/mrm.21890
Lundberg, S. M. (2017). “A unified approach to interpreting model predictions,” in Advances in Neural Information Processing Systems 30.
Madan, C. R., and Kensinger, E. A. (2016). Cortical complexity as a measure of age-related brain atrophy. NeuroImage. 134, 617–629. doi: 10.1016/j.neuroimage.2016.04.029
Madan, C. R., and Kensinger, E. A. (2018). Predicting age from cortical structure across the lifespan. Eur. J. Neurosci. 47, 399–416. doi: 10.1111/ejn.13835
Marzi, C. (2023). chiaramarzi/fractalbrain-toolkit: fraxtalbrain-toolkit v1, 1. Zenodo. Available from: https://zenodo.org/record/7852212 (accessed May 11, 2023).
Marzi, C., Ciulli, S., Giannelli, M., Ginestroni, A., Tessa, C., Mascalchi, M., et al. (2018). Structural complexity of the cerebellum and cerebral cortex is reduced in spinocerebellar ataxia type 2. J. Neuroimaging. 28, 688–693. doi: 10.1111/jon.12534
Marzi, C., Giannelli, M., Barucci, A., Tessa, C., and Mascalchi, M. (2022). Efficacy of MRI data harmonization in the age of machine learning. A multicenter study across 36 datasets. arXiv preprint arXiv:2211.04125.
Marzi, C., Giannelli, M., Tessa, C., Mascalchi, M., and Diciotti, S. (2020). Toward a more reliable characterization of fractal properties of the cerebral cortex of healthy subjects during the lifespan. Sci. Rep. 10, 16957. doi: 10.1038/s41598-020-73961-w
Marzi, C., Giannelli, M., Tessa, C., Mascalchi, M., and Diciotti, S. (2021). Fractal analysis of MRI data at 7 T: how much complex is the cerebral cortex? IEEE Access. 9, 69226–69234. doi: 10.1109/ACCESS.2021.3077370
Mascalchi, M., Ginestroni, A., Bessi, V., Toschi, N., Padiglioni, S., Ciulli, S., et al. (2013). Regional analysis of the magnetization transfer ratio of the brain in mild alzheimer disease and amnestic mild cognitive impairment. Am. J. Neuroradiol. 34, 2098–2104. doi: 10.3174/ajnr.A3568
Mascalchi, M., Ginestroni, A., Toschi, N., Poggesi, A., Cecchi, P., Salvadori, E., et al. (2014). The burden of microstructural damage modulates cortical activation in elderly subjects with MCI and leuko-araiosis. A DTI and fMRI study: cortical activation in leuko-araiosis. Hum. Brain Mapp. 35, 819–830. doi: 10.1002/hbm.22216
Mascalchi, M., Salvadori, E., Toschi, N., Giannelli, M., Orsolini, S., Ciulli, S., et al. (2019). DTI-derived indexes of brain WM correlate with cognitive performance in vascular MCI and small-vessel disease. A TBSS study. Brain Imag. Behav. 13, 594–602. doi: 10.1007/s11682-018-9873-5
McCarthy, C. S., Ramprashad, A., Thompson, C., Botti, J. A., Coman, I. L., Kates, W. R. A., et al. (2015). comparison of FreeSurfer-generated data with and without manual intervention. Front. Neurosci. 9, 379. doi: 10.3389/fnins.2015.00379
Molinaro, A. M., Simon, R., and Pfeiffer, R. M. (2005). Prediction error estimation: a comparison of resampling methods. Bioinformatics. 21, 3301–3307. doi: 10.1093/bioinformatics/bti499
Müller, A. C., and Guido, S. (2016). Introduction to Machine Learning with Python: A Guide for Data Scientists. First edition. Sebastopol, CA: O'Reilly Media, Inc. 376 p.
Nasreddine, Z. S., Phillips, N. A., Bédirian, V., Charbonneau, S., Whitehead, V., Collin, I., et al. (2005). The Montreal Cognitive Assessment, MoCA: a brief screening tool for mild cognitive impairment. J. Am. Geriatr. Soc. 53, 695–699. doi: 10.1111/j.1532-5415.2005.53221.x
Nazlee, N., and Waiter, G. D. (2023). Age-associated sex and asymmetry differentiation in hemispheric and lobar cortical ribbon complexity across adulthood: A UK BIOBANK imaging study. Hum. Brain Mapp. 44, 49–65. doi: 10.1002/hbm.26076
Nocentini, U., Giordano, A., Di Vincenzo, S., Panella, M., and Pasqualetti, P. (2006). The symbol digit modalities test - oral version: Italian normative data. Funct. Neurol. 21, 93–96.
Pani, J., Marzi, C., Stensvold, D., Wisløff, U., and Håberg, A. K. (2022). Longitudinal study of the effect of a 5-year exercise intervention on structural brain complexity in older adults. A generation 100 substudy. NeuroImage 256, 119226. doi: 10.1016/j.neuroimage.2022.119226
Pantoni, L., Basile, A. M., Pracucci, G., Asplund, K., Bogousslavsky, J., Chabriat, H., et al. (2005). Impact of age-related cerebral white matter changes on the transition to disability – the LADIS study: rationale, design and methodology. Neuroepidemiology. 24, 51–62. doi: 10.1159/000081050
Pantoni, L., Marzi, C., Poggesi, A., Giorgio, A., De Stefano, N., Mascalchi, M., et al. (2019). Fractal dimension of cerebral white matter: A consistent feature for prediction of the cognitive performance in patients with small vessel disease and mild cognitive impairment. Neuroimage Clin. 24, 101990. doi: 10.1016/j.nicl.2019.101990
Poggesi, A., Salvadori, E., Pantoni, L., Pracucci, G., Cesari, F., Chiti, A., et al. (2012). Risk and determinants of dementia in patients with mild cognitive impairment and brain subcortical vascular changes: a study of clinical, neuroimaging, and biological markers—The VMCI-tuscany study: rationale, design, and methodology. Int. J. Alzheimer's Dis. 2012, 608013. doi: 10.1155/2012/608013
Russell, D. A., Hanson, J. D., and Ott, E. (1980). Dimension of strange attractors. Phys. Rev. Lett. 45, 1175–1178. doi: 10.1103/PhysRevLett.45.1175
Salvadori, E., Poggesi, A., Pracucci, G., Chiti, A., Ciolli, L., Cosottini, M., et al. (2018). Application of the DSM-5 criteria for major neurocognitive disorder to vascular MCI patients. Dement. Geriatr. Cogn. Disord. Extra. 8, 104–116. doi: 10.1159/000487130
Salvadori, E., Poggesi, A., Valenti, R., Pracucci, G., Pescini, F., Pasi, M., et al. (2016). Operationalizing mild cognitive impairment criteria in small vessel disease: the VMCI-tuscany study. Alzheimer's Dement. 12, 407–418. doi: 10.1016/j.jalz.2015.02.010
Sandu, A. L., Izard, E., Specht, K., Beneventi, H., Lundervold, A., Ystad, M., et al. (2014a). Post-adolescent developmental changes in cortical complexity. Behav. Brain Funct. 10, 44. doi: 10.1186/1744-9081-10-44
Sandu, A. L., Rasmussen, I. A., Lundervold, A., Kreuder, F., Neckelmann, G., Hugdahl, K., et al. (2008a). Fractal dimension analysis of MR images reveals grey matter structure irregularities in schizophrenia. Computer. Med. Imag. Graph. 32, 150–158. doi: 10.1016/j.compmedimag.2007.10.005
Sandu, A. L., Specht, K., Beneventi, H., Lundervold, A., and Hugdahl, K. (2008b). Sex-differences in grey–white matter structure in normal-reading and dyslexic adolescents. Neurosci. Lett. 438, 80–84. doi: 10.1016/j.neulet.2008.04.022
Sandu, A. L., Staff, R. T., McNeil, C. J., Mustafa, N., Ahearn, T., Whalley, L. J., et al. (2014b). Structural brain complexity and cognitive decline in late life—A longitudinal study in the Aberdeen 1936 birth cohort. NeuroImage. 100, 558–563. doi: 10.1016/j.neuroimage.2014.06.054
Sandu, A. L., Waiter, G. D., Staff, R. T., Nazlee, N., Habota, T., McNeil, C. J., et al. (2022). Sexual dimorphism in the relationship between brain complexity, volume and general intelligence (g): a cross-cohort study. Sci. Rep. 12, 11025. doi: 10.1038/s41598-022-15208-4
Scheda, R., and Diciotti, S. (2022). Explanations of machine learning models in repeated nested cross-validation: an application in age prediction using brain complexity features. Appl. Sci. 12, 6681. doi: 10.3390/app12136681
Smith, S. M. (2002). Fast robust automated brain extraction. Hum. Brain Mapp. 17, 143–155. doi: 10.1002/hbm.10062
Smith, S. M., Jenkinson, M., Woolrich, M. W., Beckmann, C. F., Behrens, T. E. J., Johansen-Berg, H., et al. (2004). Advances in functional and structural MR image analysis and implementation as FSL. Neuroimage. 23, S208–219. doi: 10.1016/j.neuroimage.2004.07.051
Sun, W., Huang, L., Cheng, Y., Qin, R., Xu, H., Shao, P., et al. (2022). Medial temporal atrophy contributes to cognitive impairment in cerebral small vessel disease. Front. Neurol. 13, 858171. doi: 10.3389/fneur.2022.858171
Valenti, R., Del Bene, A., Poggesi, A., Ginestroni, A., Salvadori, E., Pracucci, G., et al. (2016). Cerebral microbleeds in patients with mild cognitive impairment and small vessel disease: The Vascular Mild Cognitive Impairment (VMCI)-Tuscany study. J. Neurol. Sci. 368, 195–202. doi: 10.1016/j.jns.2016.07.018
Williams, O. A., Zeestraten, E. A., Benjamin, P., Lambert, C., Lawrence, A. J., Mackinnon, A. D., et al. (2017). Diffusion tensor image segmentation of the cerebrum provides a single measure of cerebral small vessel disease severity related to cognitive change. NeuroImage. 16, 330–342. doi: 10.1016/j.nicl.2017.08.016
Williams, O. A., Zeestraten, E. A., Benjamin, P., Lambert, C., Lawrence, A. J., Mackinnon, A. D., et al. (2019). Predicting dementia in cerebral small vessel disease using an automatic diffusion tensor image segmentation technique. Stroke. 50, 2775–2782. doi: 10.1161/STROKEAHA.119.025843
Winblad, B., Palmer, K., Kivipelto, M., Jelic, V., Fratiglioni, L., Wahlund, L. O., et al. (2004). Mild cognitive impairment - beyond controversies, towards a consensus: report of the international working group on mild cognitive impairment. J. Intern. Med. 256, 240–246. doi: 10.1111/j.1365-2796.2004.01380.x
Wright, C. B., and Flores, A. (2015). Vascular contributions to cognitive impairment. Neurol. Clin. Pract. 5, 201–208. doi: 10.1212/CPJ.0000000000000118
Wu, A., Sharrett, A. R., Gottesman, R. F., Power, M. C., Mosley, T. H., Jack, C. R., et al. (2019). Association of brain magnetic resonance imaging signs with cognitive outcomes in persons with nonimpaired cognition and mild cognitive impairment. JAMA Netw. Open. 2, e193359. doi: 10.1001/jamanetworkopen.2019.3359
Yagis, E., Atnafu, S. W., García Seco de Herrera, A., Marzi, C., Scheda, R., Giannelli, M., et al. (2021). Effect of data leakage in brain MRI classification using 2D convolutional neural networks. Sci Rep. 11, 22544. doi: 10.1038/s41598-021-01681-w
Ye, B. S., Seo, S. W., Kim, J. H., Kim, G. H., Cho, H., Noh, Y., et al. (2015). Effects of amyloid and vascular markers on cognitive decline in subcortical vascular dementia. Neurology. 85, 1687–1693. doi: 10.1212/WNL.0000000000002097
Youden, W. J. (1950). Index for rating diagnostic tests. Cancer. 3, 32–35. doi: 10.1002/1097-0142(1950)3:1<32::AID-CNCR2820030106>3.0.CO;2-3
Keywords: dementia, fractal dimension, gray matter, leukoaraiosis, mild cognitive impairment, MRI, white matter
Citation: Marzi C, Scheda R, Salvadori E, Giorgio A, De Stefano N, Poggesi A, Inzitari D, Pantoni L, Mascalchi M and Diciotti S (2023) Fractal dimension of the cortical gray matter outweighs other brain MRI features as a predictor of transition to dementia in patients with mild cognitive impairment and leukoaraiosis. Front. Hum. Neurosci. 17:1231513. doi: 10.3389/fnhum.2023.1231513
Received: 30 May 2023; Accepted: 31 August 2023;
Published: 26 September 2023.
Edited by:
Antonio Ferretti, University of Studies G. d'Annunzio Chieti and Pescara, ItalyReviewed by:
Lei Gao, Wuhan University, ChinaCopyright © 2023 Marzi, Scheda, Salvadori, Giorgio, De Stefano, Poggesi, Inzitari, Pantoni, Mascalchi and Diciotti. This is an open-access article distributed under the terms of the Creative Commons Attribution License (CC BY). The use, distribution or reproduction in other forums is permitted, provided the original author(s) and the copyright owner(s) are credited and that the original publication in this journal is cited, in accordance with accepted academic practice. No use, distribution or reproduction is permitted which does not comply with these terms.
*Correspondence: Stefano Diciotti, c3RlZmFuby5kaWNpb3R0aUB1bmliby5pdA==
†These authors share senior authorship
Disclaimer: All claims expressed in this article are solely those of the authors and do not necessarily represent those of their affiliated organizations, or those of the publisher, the editors and the reviewers. Any product that may be evaluated in this article or claim that may be made by its manufacturer is not guaranteed or endorsed by the publisher.
Research integrity at Frontiers
Learn more about the work of our research integrity team to safeguard the quality of each article we publish.