 Aoyu Li
 Jingwen Li2
 Yan Qiang
- 1College of Information and Computer, Taiyuan University of Technology, Taiyuan, China
- 2School of Computer Science, Xijing University, Xian, China
- 3Department of Clinical Laboratory, Affiliated People’s Hospital of Shanxi Medical University, Shanxi Provincial People’s Hospital, Taiyuan, China
Introduction: Advances in mobile computing platforms and the rapid development of wearable devices have made possible the continuous monitoring of patients with mild cognitive impairment (MCI) and their daily activities. Such rich data can reveal more subtle changes in patients’ behavioral and physiological characteristics, providing new ways to detect MCI anytime, anywhere. Therefore, we aimed to investigate the feasibility and validity of digital cognitive tests and physiological sensors applied to MCI assessment.
Methods: We collected photoplethysmography (PPG), electrodermal activity (EDA) and electroencephalogram (EEG) signals from 120 participants (61 MCI patients, 59 healthy controls) during rest and cognitive testing. The features extracted from these physiological signals involved the time domain, frequency domain, time-frequency domain and statistics. Time and score features during the cognitive test are automatically recorded by the system. In addition, selected features of all modalities were classified by tenfold cross-validation using five different classifiers.
Results: The experimental results showed that the weighted soft voting strategy combining five classifiers achieved the highest classification accuracy (88.9%), precision (89.9%), recall (88.2%), and F1 score (89.0%). Compared to healthy controls, the MCI group typically took longer to recall, draw, and drag. Moreover, during cognitive testing, MCI patients showed lower heart rate variability, higher electrodermal activity values, and stronger brain activity in the alpha and beta bands.
Discussion: It was found that patients’ classification performance improved when combining features from multiple modalities compared to using only tablet parameters or physiological features, indicating that our scheme could reveal MCI-related discriminative information. Furthermore, the best classification results on the digital span test across all tasks suggest that MCI patients may have deficits in attention and short-term memory that came to the fore earlier. Finally, integrating tablet cognitive tests and wearable sensors would provide a new direction for creating an easy-to-use and at-home self-check MCI screening tool.
1. Introduction
Health conditions such as memory loss, frequent repetitive questioning, and geographic orientation impairment affect the daily lives of many older adults (Knopman and Petersen, 2014). These cognitive issues usually are attributed to “normal for age” (Breitner, 2014). However, when these initial signs occur more frequently, they may indicate something more substantial, such as mild cognitive impairment (MCI). MCI is an intermediate state between normal aging and dementia in which one or more of the corresponding cognitive impairments in language, memory, attention, visuospatial and executive functions are present (Burns and Zaudig, 2002). A recent study showed that ~22.7% of the total United States population might suffer from some form of MCI (Rajan et al., 2021). In addition, given that many of the early symptoms in MCI are insidious, patients may confuse cognitive impairment with normal aging, leading to a delay in the actual diagnosis and exacerbating the progression to dementia.
Early detection of dementia has been shown to allow interventions to slow the evolution of the disease, such as physical activity (Groot et al., 2016) and pharmacological interventions (Hansen et al., 2008). However, in the clinical setting, commonly available cognitive screening tests [e.g., the Mini-Mental State Examination (MMSE) test (Folstein et al., 1975); the Montreal Cognitive Assessment (MoCA) test (Nasreddine et al., 2005)] and other screening tools (e.g., cerebrospinal fluid examination and magnetic resonance imaging) are time-consuming, invasive or not readily available. Furthermore, these assessments are subjective and require constant attention from managers. Thus, the effective diagnosis of MCI remains one of the most difficult challenges in geriatric psychiatry (Gosztolya et al., 2019).
Evidence is mounting that changes in cognition, behavior, sensation and movement in patients with Alzheimer’s disease (AD) may manifest years earlier than clinical symptoms (Sperling et al., 2014). Diagnosing MCI and dementia based on clinical features alone is challenging and relatively unreliable (Grässler et al., 2021). In recent years, with the rapid development of computer technology, computer-aided diagnostic techniques have contributed tremendously positively to improving diagnostic accuracy, reducing missed diagnoses, and increasing efficiency (Chen et al., 2022a; Yu et al., 2022). In the early screening of neurodegenerative diseases (e.g., dementia), several researchers have attempted to use consumer-grade mobile and wearable technologies to explore effective digital biomarkers. For example, Müller et al. (2019) captured a large number of kinematic features of participants during a digital clock drawing test. They found that dwell time in the air appeared to be a distinctive feature between MCI patients and healthy individuals. Later, Ehsani et al. (2020) assessed the uncertainty of elbow angle and angular velocity in older adults while wearing a tri-axial gyroscope performing an upper limb dual task, highlighting the potential of entropy of elbow angular velocity in detecting cognitive impairment. Furthermore, Ladas et al. (2014) discovered that blink rates per minute were higher in MCI patients than in healthy controls (HC), suggesting that eye blink rates would be promising as one of the potential biomarkers of MCI. Finally, Jonell et al. (2021) used nine sensors to capture data on participants’ behavioral and physiological signals during clinical interviews and identified head temperature changes and mapping gap length as novel digital biomarkers perhaps associated with early AD diagnosis. Thus, mobile applications and continuous passive sensor data may improve individuals’ early detection and monitoring, and provide more effective clinical decision-making.
With significant technological advances in the ubiquitous availability of convenient devices and wearable sensors, continuous monitoring of patients and their daily activities has become possible. Combining low-cost and non-invasive methods of measuring an individual’s physical signs with a game-based screening test for serious cognition will allow older adults to detect and track cognitive decline with minimal disruption and burden. This paper aims to explore the validity and feasibility of extracting features from physiological signals (e.g., PPG, EDA, and EEG) and digital cognitive parameters to assess MCI. Specifically, subjects’ physiological data are recorded at rest and while performing a cognitive task. The digital cognitive parameters consist of time and score, while features of the physiological data are extracted from several modalities, time domain, frequency domain, time-frequency domain and statistical. After obtaining the optimal feature subset by a feature selection algorithm, we compared the classification performance of the feature subset in single-mode and fused multi-mode. We hypothesized that features extracted from all physiological modalities fused with cognitive parameters would be the best for classification. Finally, five machine learning classification algorithms, including k-Nearest Neighbor (kNN), Decision Tree (DT), Random Forest (RF), Naive Bayes (NB) and XGBoost (GBDT), were used to classify healthy individuals and MCI patients. In particular, their classification accuracy was used as a decision weight for model predictions, considering the differences in screening performance for each cognitive test.
2. Materials and methods
2.1. Participants
A total of 120 participants (62 females and 58 males) were recruited consecutively. Participants met the following criteria: (1) normal or corrected normal hearing and vision; (2) age > 65 years; (3) completed the MMSE test; (4) completed the MoCA test; and (5) were able to do moderate exercise and had no physical disability. The MCI group comprised 61 subjects who scored below 26 on the MoCA scale. Clinical interviews confirmed that healthy individuals had no neurological or psychiatric history and showed no signs of cognitive decline. In addition, all subjects had not previously performed these tasks and completed all test items. Table 1 summarizes the clinical statistical information for the 120 participants.
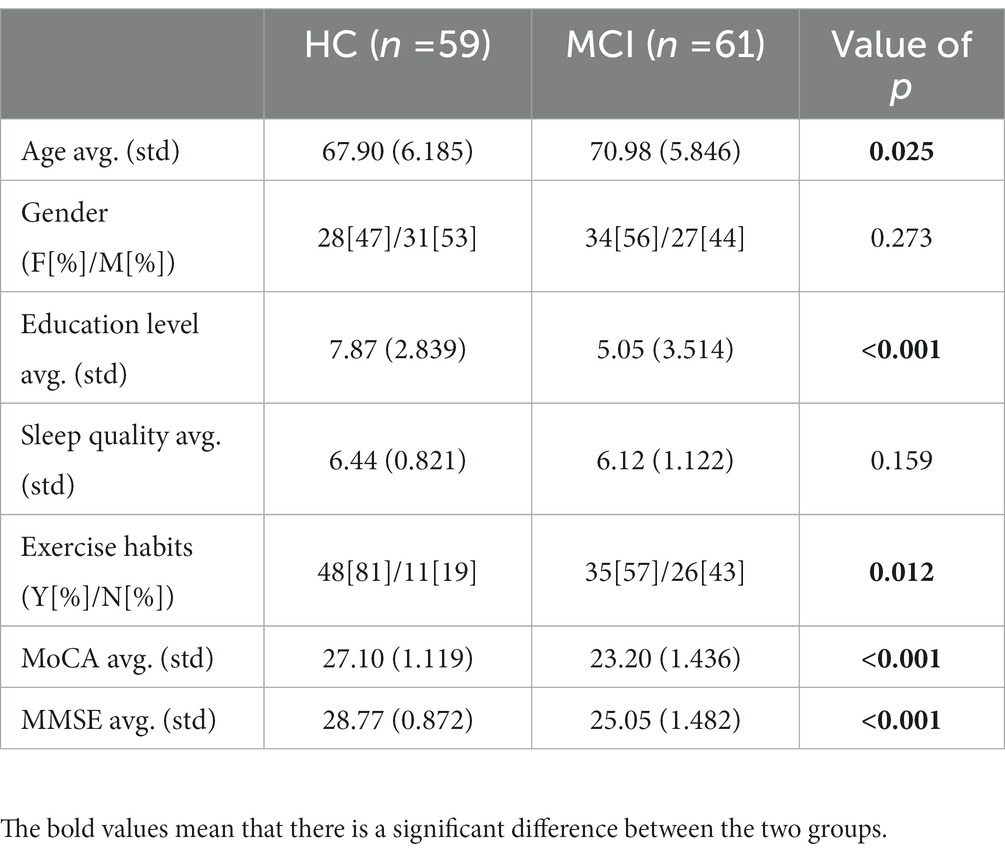
Table 1. Clinical and demographic characteristics.
2.2. Experimental equipment and procedure
In this study, we used an iPad 2019, Empatica E4 and MUSE 2 to collect digital cognitive parameters and physiological signals from participants at rest and in the task state. All cognitive tests were presented on the iPad 2019 (7th generation, 3GB/128GB, 10.2″, 2,160 × 1,620 pixel touchscreen), and Apple Pencil to perform drawing-related tasks. The tablet records the start and end times of each test in real time, providing the basis for subsequent synchronization of physiological data. The Empatica E4 is a watch-like multi-sensor device that measures EDA, PPG, skin temperature and accelerometer data. It is small, lightweight and comfortable to wear, making it particularly suitable for unobtrusive, continuous monitoring in the cognitive screening of older adults. We charge and synchronize the E4 to a laptop computer before use. The data is typically stored on the E4 and then transferred to the computer for processing. The MUSE 2 is a wire-free, portable, wearable, and flexible EEG headband widely used in meditation and research (Cannard et al., 2021; Hunkin et al., 2021; Chai et al., 2023). It contains five electrodes, two of which are frontal electrodes (AF7 and AF8), two others are temporal electrodes (TP9 and TP10) and a reference electrode located at the Fpz position. The MUSE headband uses Bluetooth technology to send data through the Muse monitor at a sampling rate of 256 Hz.
The cognitive test was developed through discussions between two neurologists, two nurses and three engineers from our team. Specifically, it includes Boston naming, immediate recall, associated memory, building block test, trail making test A, trail making test B, clock drawing test, handwriting test, digital span sequence, digital span inverse, color interference and listening test, as shown in Figure 1. The battery assessed various cognitive abilities, including verbal fluency, memory, attention, listening, visuospatial and executive function. Before the experiment begins, the experimenter will explain the procedure to the participants and obtain their written consent. Once consent was obtained, the experimenter would place the MUSE on the subject’s forehead and the Empatica on the wrist of the subject’s non-dominant hand (Boucsein, 2012; Gashi et al., 2019). The subjects were asked to sit comfortably, fully relaxed, and record physiological signals with their eyes closed for 5 min. Next, subjects began performing cognitive tasks with real-time access to wearable device physiological signals and tablet cognitive data, as shown in Step 1 (Figure 2). In particular, for cognitive tasks involving drawing, the experimenter would provide some assistance (e.g., fixing the tablet) during the drawing process to minimize the participant’s non-dominant hand involvement.
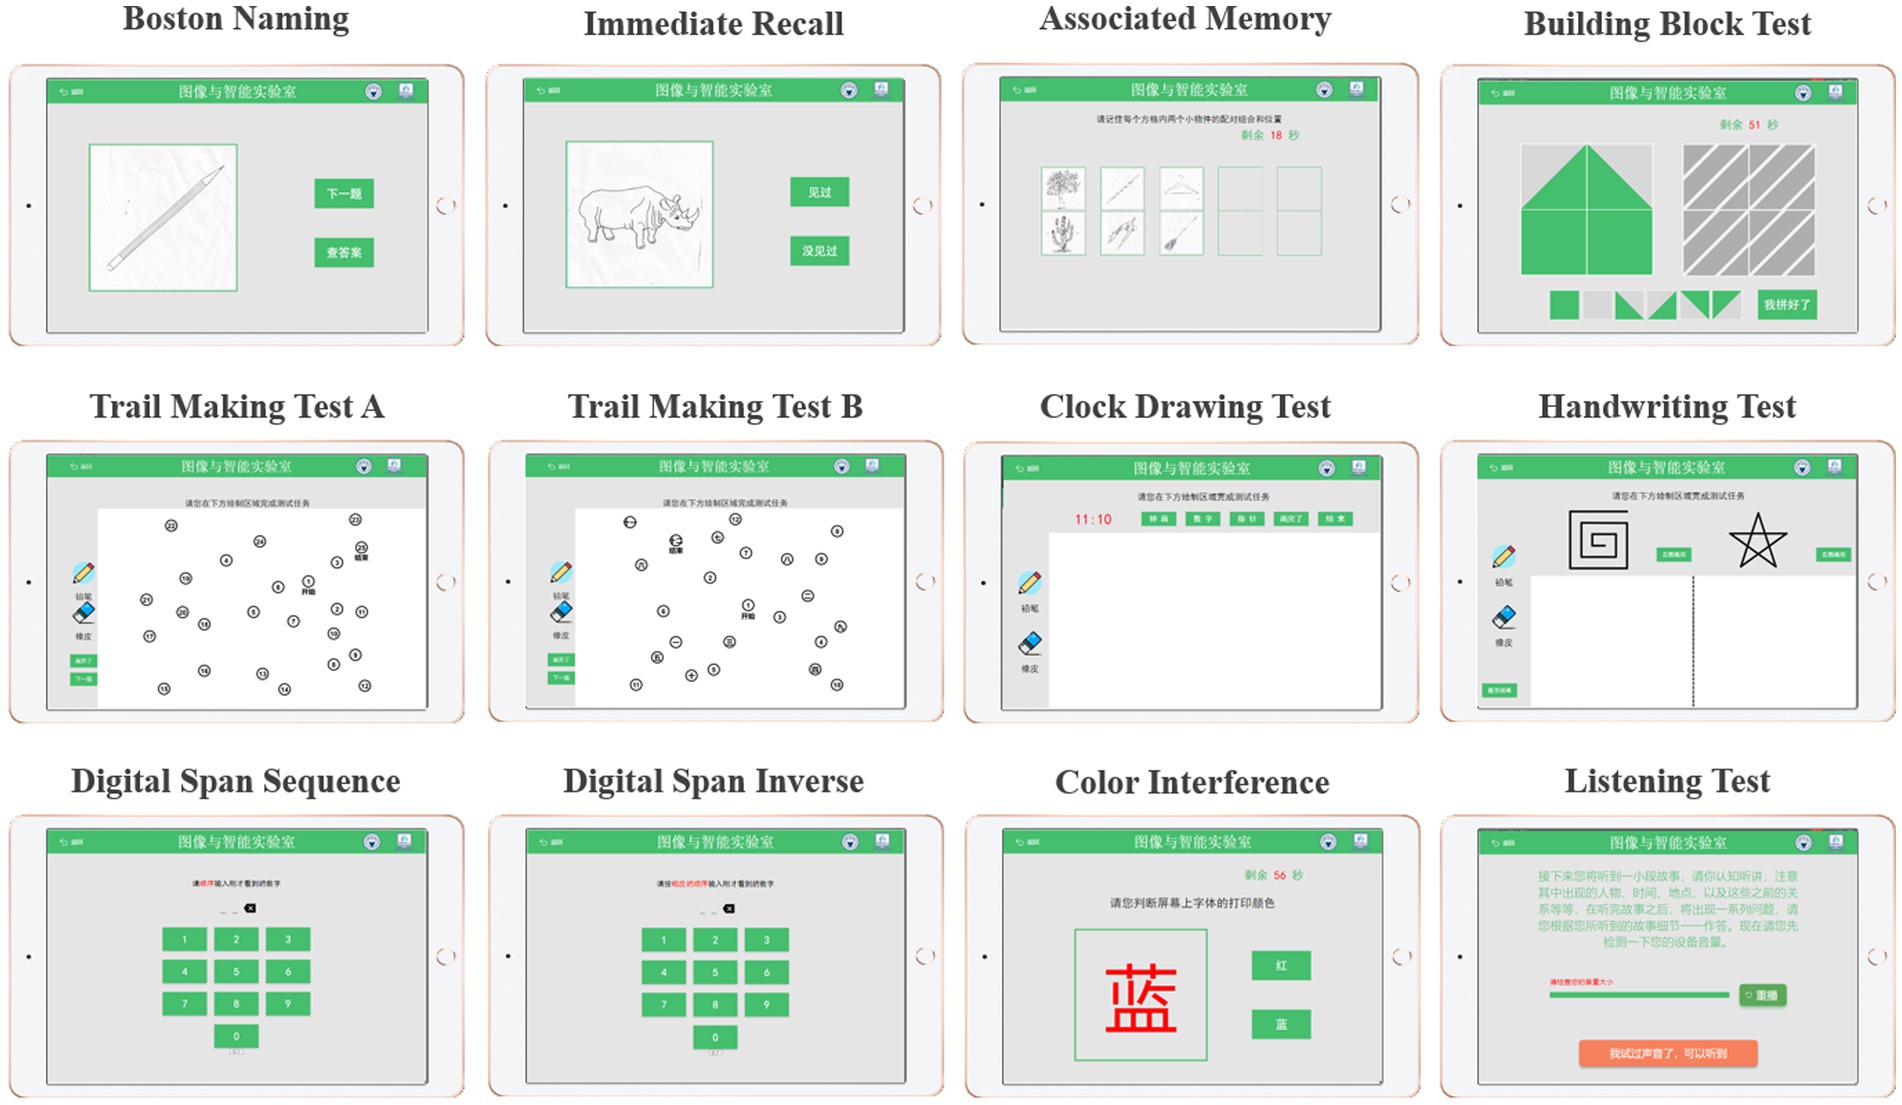
Figure 1. Tablet-based digital cognitive testing.
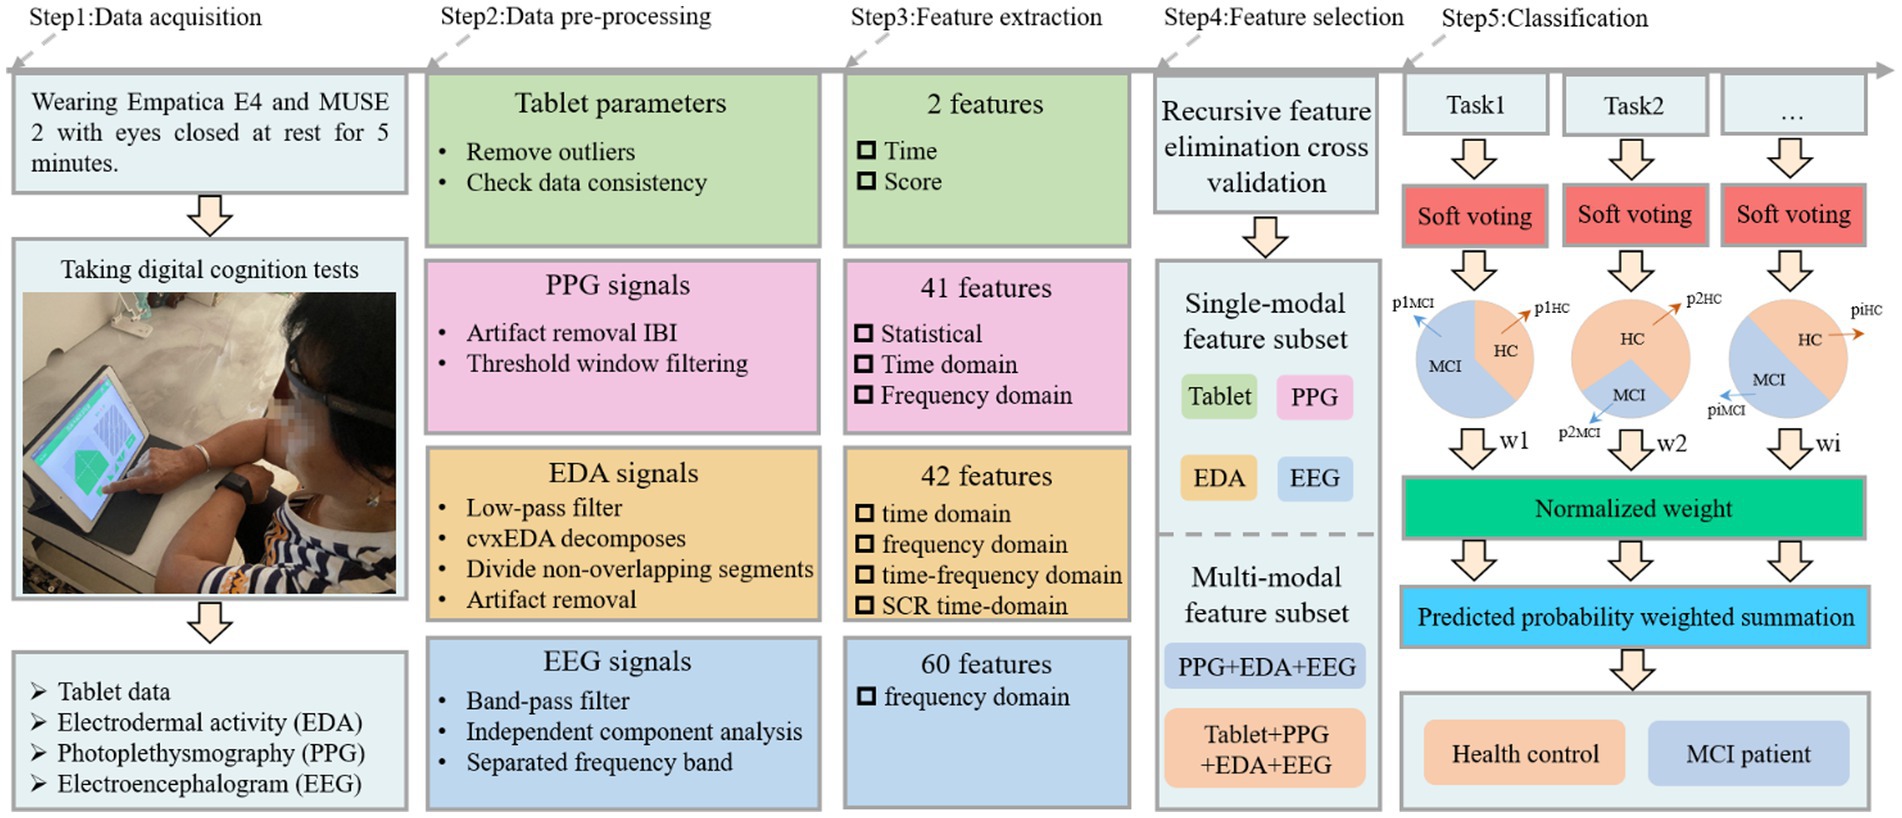
Figure 2. The proposed MCI detection framework for multi-source data.
2.3. Data processing and analysis
We draw on the computer-aided diagnostic medical image analysis process, i.e., from dataset to preprocessing, feature extraction, feature selection, and classification (Li et al., 2022; Hu et al., 2023) for the acquired cognitive and physiological data. The details are described below.
2.3.1. Data pre-processing
HRV describes the irregularity between two consecutive heartbeats by measuring variations known as the RR interval or interbeat interval (IBI). It is pleasing to note that IBI data can be easily obtained from the participant’s E4 wristband. By pre-processing the IBI, the reliability of HRV can be effectively improved. First, we removed noticeable artifacts from the IBI series according to the rules for detecting artifacts in existing studies (Acar et al., 2000; Karlsson et al., 2012). Second, for those missing heartbeat data not identified by the measurement device, we increase the reliability of the HRV measurement by defining a threshold standard to remove imperfect windows, as suggested by Föll et al. (2021). Thus, if a time window t satisfies the following inequality, it will not be discarded.
where Nt denotes the number of valid heart beats detected in window t, L denotes the epoch width (window length) in seconds, μIBIt denotes the average IBI (in seconds) in window t and thresh [0, 1]. In summary, a higher threshold setting will result in a higher proportion of detected heartbeats relative to the desired amount of expected heartbeats. Here, we set the epoch width to 180 and the threshold to 0.2.
Autonomous activation of human sweat glands causes skin conductance changes and is a phenomenon commonly referred to as EDA. To improve the obtained EDA signal quality, we followed the same preprocessing steps suggested by Boucsein (2012), Gashi et al. (2019), Hassib et al. (2017), and Martínez-Rodrigo et al. (2017): (1) A first-order Butterworth low-pass filter with a cut-off frequency of 0.6 Hz is used to remove high-frequency noise fluctuations from the signal; (2) EDA signal is further decomposed into tonic and phase components using the cvxEDA method proposed in the literature (Greco et al., 2015); (3) Given that the SCR response duration is between 1 and 5 s, we divide the EDA series into 5 s non-overlapping segments and extract most of the features suggested by existing literature (Gashi et al., 2019; Shukla et al., 2019) to describe shape artifacts; (4) Machine learning was used to identify shape artifacts, thereby effectively distinguishing between standard EDA signals and artifacts.
The EEG signal is an overall reflection in the cerebral cortex or scalp surface from the electrophysiological activity of brain nerve cells. As a typical signal in body sign signals, it contains much neurophysiological information. Owing to its susceptibility to the state of contact between the scalp and the sensor and to interference from environmental noise, we followed several routine pre-processing steps as recommended by the OHBM COBIDAS MEEG committee (Pernet et al., 2020). First, the recorded EEG data were band-pass filtered to 1–45 Hz using the egfiltfft function in the EEGLab toolbox. Then, independent component analysis (ICA) was applied to each channel’s signal to detect and remove eye movements, muscle artifacts, channel noise and outlier data segments. Subsequently, the remaining data epochs were manually checked to remove data segments with significant artifacts or drowsiness features that were not automatically removed. Finally, the EEG signal was separated into five typical bands, namely the delta band (1–4 Hz), theta band (4–8 Hz), alpha band (8–13 Hz), beta band (13–30 Hz) and gamma band (13–45 Hz), employing a second-order Butterworth band-pass filter.
The tablet-based digital cognitive test records hand movements and cognitive performance in older adults. Features extracted from these data will be used as digital biomarkers that may distinguish healthy individuals from those with mild cognitive impairment. Therefore, the raw data needs to be cleaned before features can be extracted, including removing outliers and checking data consistency.
2.3.2. Feature extraction and selection
After pre-processing, the next step was to extract features from the wearable sensor signals and tablet data to classify healthy individuals and MCI patients, as shown in Step 3 (Figure 2). Three frequency domain features, namely mean power (MP), spectral entropy (SE) and asymmetry index (AI) were extracted from the EEG signal and these features have been applied to MCI detection (Luckhaus et al., 2008; Bruña et al., 2012; Martin et al., 2022). MP is derived by calculating the mean of the absolute power in each band. SE is a measure of unpredictability and disorder associated with the spectrum of a signal, and a higher SE indicates a higher level of complexity. The MP and SE have 20 features each, i.e., four channels in the MUSE headband, each with five bands. AI includes Differential Asymmetry (DASM), which is the absolute power difference between each band of the left and right hemisphere asymmetric channels (TP9 & TP10 and AF7 & AF8), and Reasonable Asymmetry (RASM), which is the absolute power ratio between each band of the left and right hemisphere asymmetric channels (TP9 & TP10 and AF7 & AF8). Ten feature values were obtained from the EEG data for each DASM and RASM feature set. The final total number of extracted EEG features was 60. For the EDA and PPG signals collected from the E4 wristband, we used FLIRT (Föll et al., 2021) to extract 41 HR or HRV features (these features belong to the statistical, time domain, and frequency domain) and 42 EDA features (these features belong to the time domain, frequency domain, time-frequency domain and SCR time-domain). Finally, the time spent and scores obtained by the participants for each test were extracted from the tablet. The specific features can be found in the Supplementary material.
Regarding feature selection, we use recursive feature elimination cross-validation (RFECV) to separate the best subset of features from each physiological signal, enabling the classification model to maintain accuracy while reducing the computational cost. The algorithm is divided into two phases: (1) creating the model through iterations, eliminating the worst features or retaining the best features in each iteration. Subsequent iterations use the unselected features from the previous modeling to build the next model until all features are used. The features are ranked according to the order in which they are retained or rejected. (2) Different numbers of features are sequentially selected from the ranked feature set for cross-validation, and the number of features with the highest mean score is determined by comparison to obtain the best feature subset. In addition, the RFECV we use for single-mode and multi-mode data is performed independently with a 10-fold cross-validation.
2.3.3. Classification
In this study, different cognitive tests may affect the MCI diagnosis and correspond to different classification accuracies, so we proposed a weighted soft voting strategy for classification, as shown in Step 5 (Figure 2). The fused base classifiers in the soft voting principle include kNN, DT, RF, NB and GBDT. Here, the tree count of RF was set to 100, NB is Gaussian Bayes, and the tree count, learning rate, and booster of XGBoost are 100, 0.1, and gbtree, respectively. Cross-validation is 10-fold cross-validation, where all samples are divided into 10 equal parts and any first part is treated as test data. We normalized each test cross-validation score and used them as predictive model weights In other words, identifying a subject as MCI can be derived from the following formula.
denotes the probability that the predicted individual belongs to MCI, is the probability that the i-th test soft-vote predicts an individual to be MCI, and is the normalized value of the i-th test soft-vote cross-validation score. The same is true for , . Individual categories are predicted by comparing the magnitude of and . Finally, in line with most evaluation metrics in the literature (Zhang J. et al., 2021; Chen et al., 2022b), we use accuracy, precision, recall, and F1 score to measure classification performance.
3. Results
For the statistical analysis of demographic characteristics, digital cognitive parameters and physiological sensor data, the Kolmogorov–Smirnov test was used to test for normality. Welch correction was applied to the uneven variance data. A t-test was used to compare differences between MCI patients and healthy individuals. The non-parametric Mann–Whitney test was applied to assess group differences in the score variables and the Hodges-Lehmann estimator estimated confidence intervals, as the variable did not follow a normal distribution. In addition, for age, education, MoCA, MMSE and sleep quality, statistical descriptions were performed using means (standard deviations). However, gender and exercise habits were categorical variables described by percentages, and Pearson’s chi-square test was used to detect differences between groups. For all tests, the level of statistical significance was set at p < 0.05.
3.1. Digital cognitive tests performance in healthy individuals and MCI patients
Figure 3 shows the statistical comparison results of the time and score features among the investigated groups (MCI patients and healthy controls) during the digital cognitive test. We found that both features performed well in distinguishing MCI patients from healthy individuals. Specifically, except for three tests (handwriting test, color interference and listening test), there was a significant difference in finishing time between healthy individuals and MCI patients (all p < 0.05; Figure 3A). The MCI group usually took longer to recall, draw and drag than the control group. Interestingly, in the digital span test, healthy individuals could correctly recall previous digits and move on to the next level, increasing their time overhead. However, in terms of score features, the two groups differed significantly on Boston naming, associated memory, digital span sequence, digital span inverse, building block test, and trail making test B (all p < 0.001; Figure 3B). Finally, the color interference and listening test were less effective in screening MCI patients and healthy individuals, which may indicate that MCI patients are aligned with healthy individuals in their ability to inhibit habitual behavior and auditory memory.
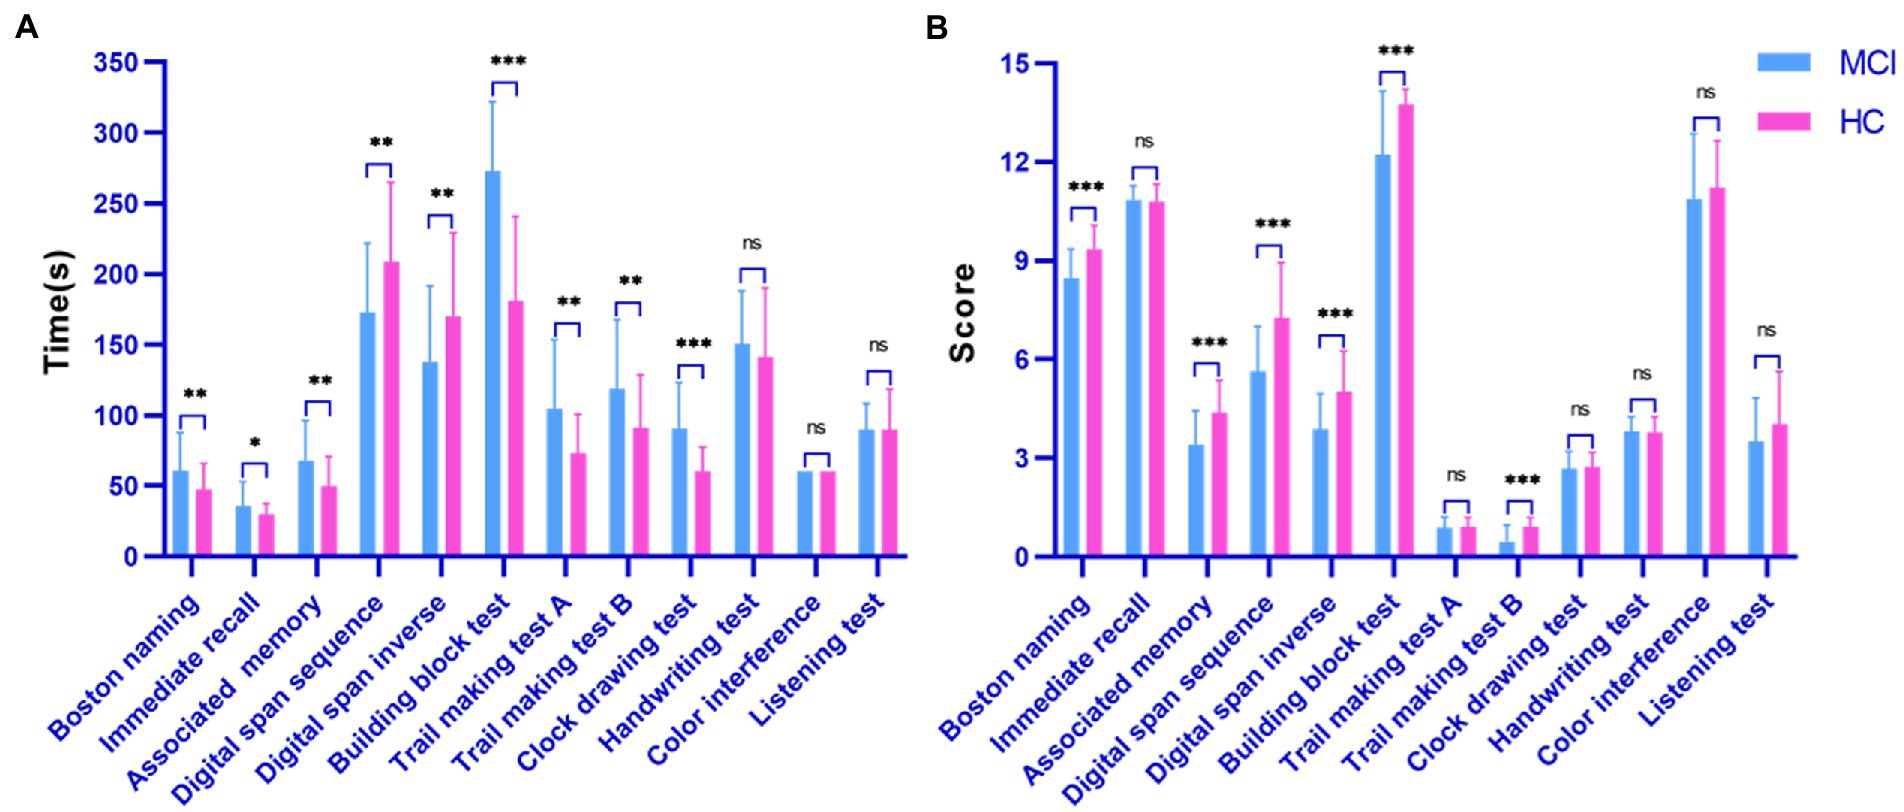
Figure 3. Performance of the surveyed group in the digital cognitive test. (A) Time cognitive parameter; (B) Score cognitive parameter.
3.2. Physiological signals performance in healthy individuals and MCI patients
Physiological signals obtained by Empatica E4 at rest and while performing a cognitive task were analyzed using paired t-tests. We found significant differences between the HR and EDA data obtained by the investigated groups during the experiment’s two phases (all p < 0.001; Figure 4). It is also evident from the box plots that MCI patients exhibited lower HRV and higher EDA values during the test, which may reflect dysautonomia and impaired health in MCI patients (Rossini et al., 2008). Furthermore, Figure 5 shows a brain activity visualization of participants at rest and in the task state from the power spectral density. A brain map in red describes intense brain activity, while orange indicates weak cortical activation. We can conclude from the experimental results: (1) the MCI group had increased power spectral density at slower frequencies (i.e., delta and theta) compared to the control group (i.e., the MCI group showed yellow brain maps while the HC group showed orange brain maps in the delta and theta bands) and (2) the electrodes in the alpha and beta bands during the task had visually different brain activity compared to the resting state, which was evident in both the healthy control and MCI groups (i.e., MCI: alpha-TP10, beta-TP9; HC: alpha-TP10, beta-TP10).
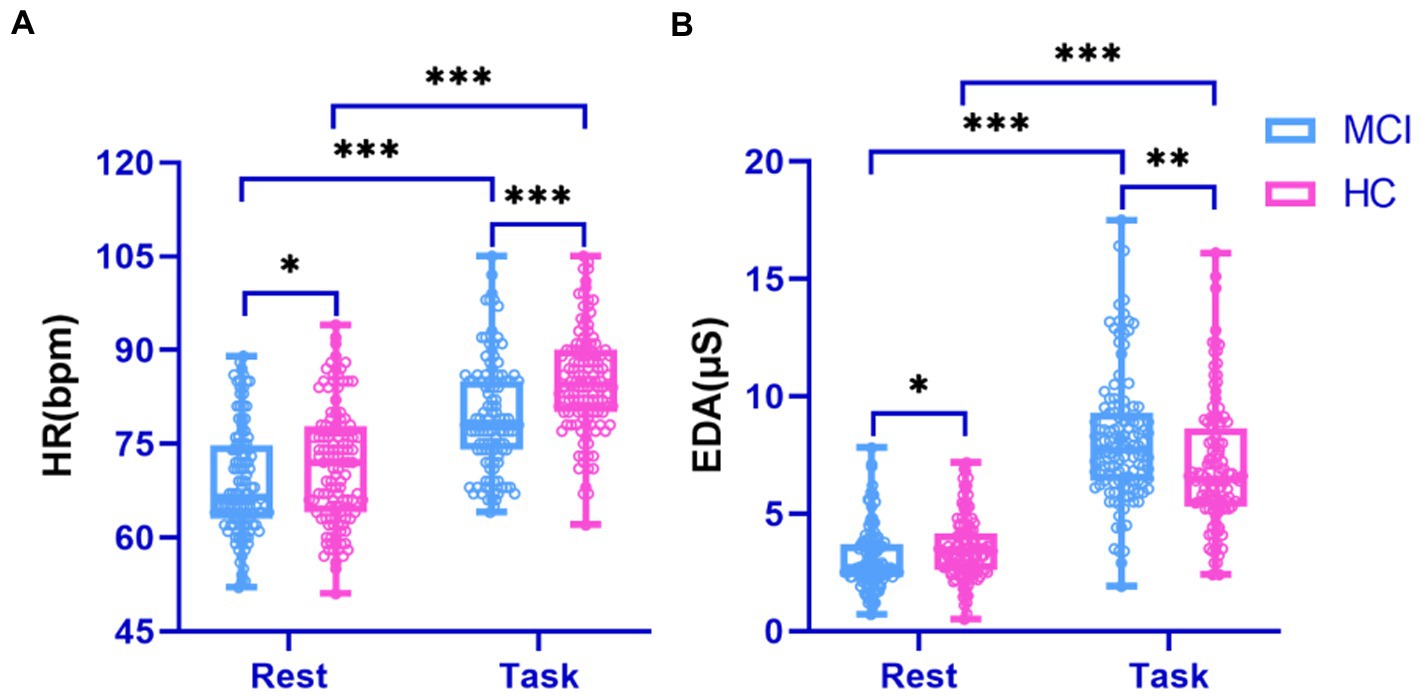
Figure 4. Performance of physiological signals in the surveyed group during rest and cognitive testing. (A) HR signal; (B) EDA signal.
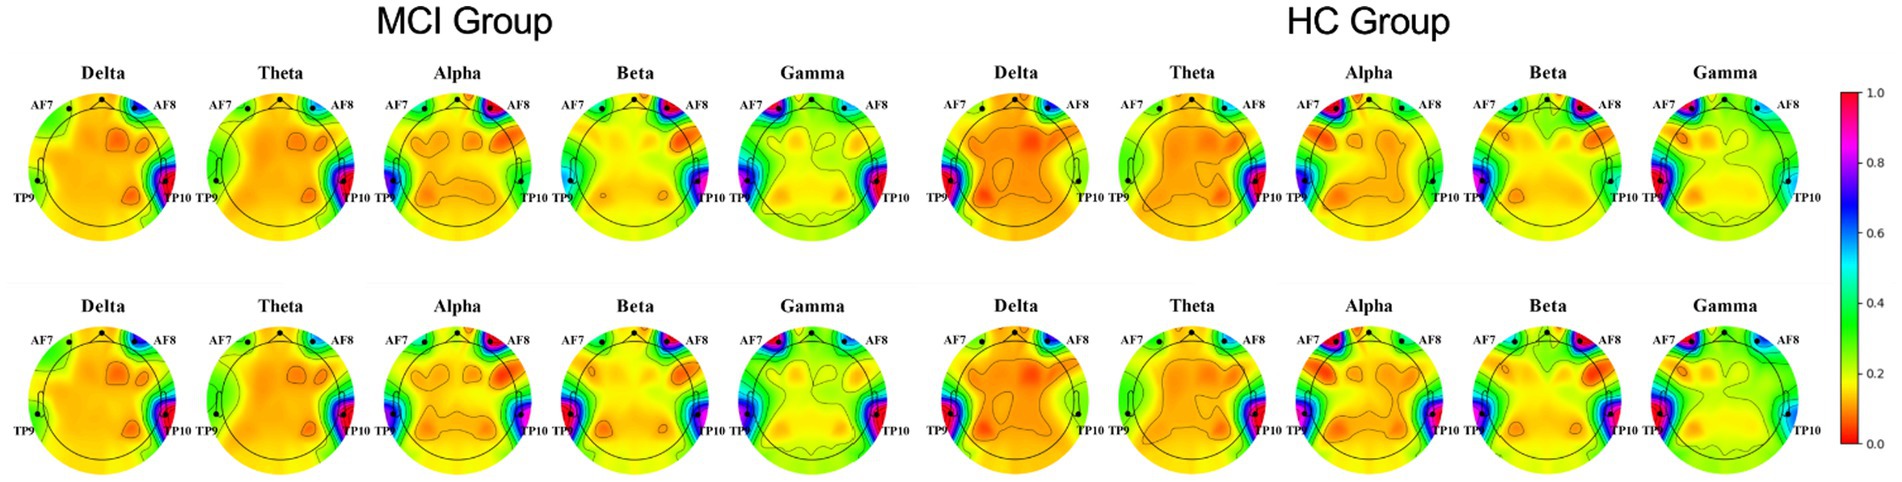
Figure 5. Brain activity visualization in different EEG bands at power spectral density during two phases of the experiment (Row 1: rest-state, Row 2: during cognitive testing).
3.3. Predictive value of the digital cognitive tasks
We examined the classification performance of each task in the digital cognitive test, as shown in Table 2. The results show that digital span inverse had the highest detection accuracy of 84.4%. As far as precision is concerned, digital span inverse also had the best results. That is, 85.7% of all predicted MCI patients in digital span inverse were actual MCI patients. Digital span sequence achieved the best recall, indicating that this task could correctly detect 86.4% of real MCI patients. The F1 score takes into account both accuracy and recall. Digital span inverse achieved the best result of 85.2% in this metric, demonstrating the better overall performance of digital span inverse. Furthermore, to explore which physiological features were more prominent in distinguishing the MCI and HC groups, we selected features ranked 3, 3, and 2 (HRV, EDA, and EEG) in importance from the subset of best features for each cognitive test. The experimental results involved three aspects: (1) SDNN, pNN50 and LF occur more frequently in HRV. In other words, lower SDNN indices and PNN50 indicate that MCI patients may be vulnerable to autonomic and parasympathetic dysfunction (Xue et al., 2022). However, LF power performed more prominently on memory and attention-related tests (Nicolini et al., 2020), further strengthening the classification performance of the Digital Span (which measures a person’s attention and short-term memory capacity); (2) Phasic signals in EDA features, particularly those derived from SCR components (transient, faster fluctuations in skin conductance) are most prominent, such as phasic kurtosis, amp (mean amplitude of the SCR peaks) and decay time (mean of the SCR peaks decay time). Compared to healthy individuals, MCI patients typically show higher amp and longer decay time, indicating that they are more reactive to external stimuli and less able to recover from stress; (3) Interestingly, the EEG features of each test are mainly focused on the alpha and beta bands. The alpha and beta bands contribute to the perfect oscillation of human consciousness in cognitive reasoning, computation, reading, communication and thought states, suggesting that touchscreen-based tests can have a better stimulating and arousing effect on older adults.
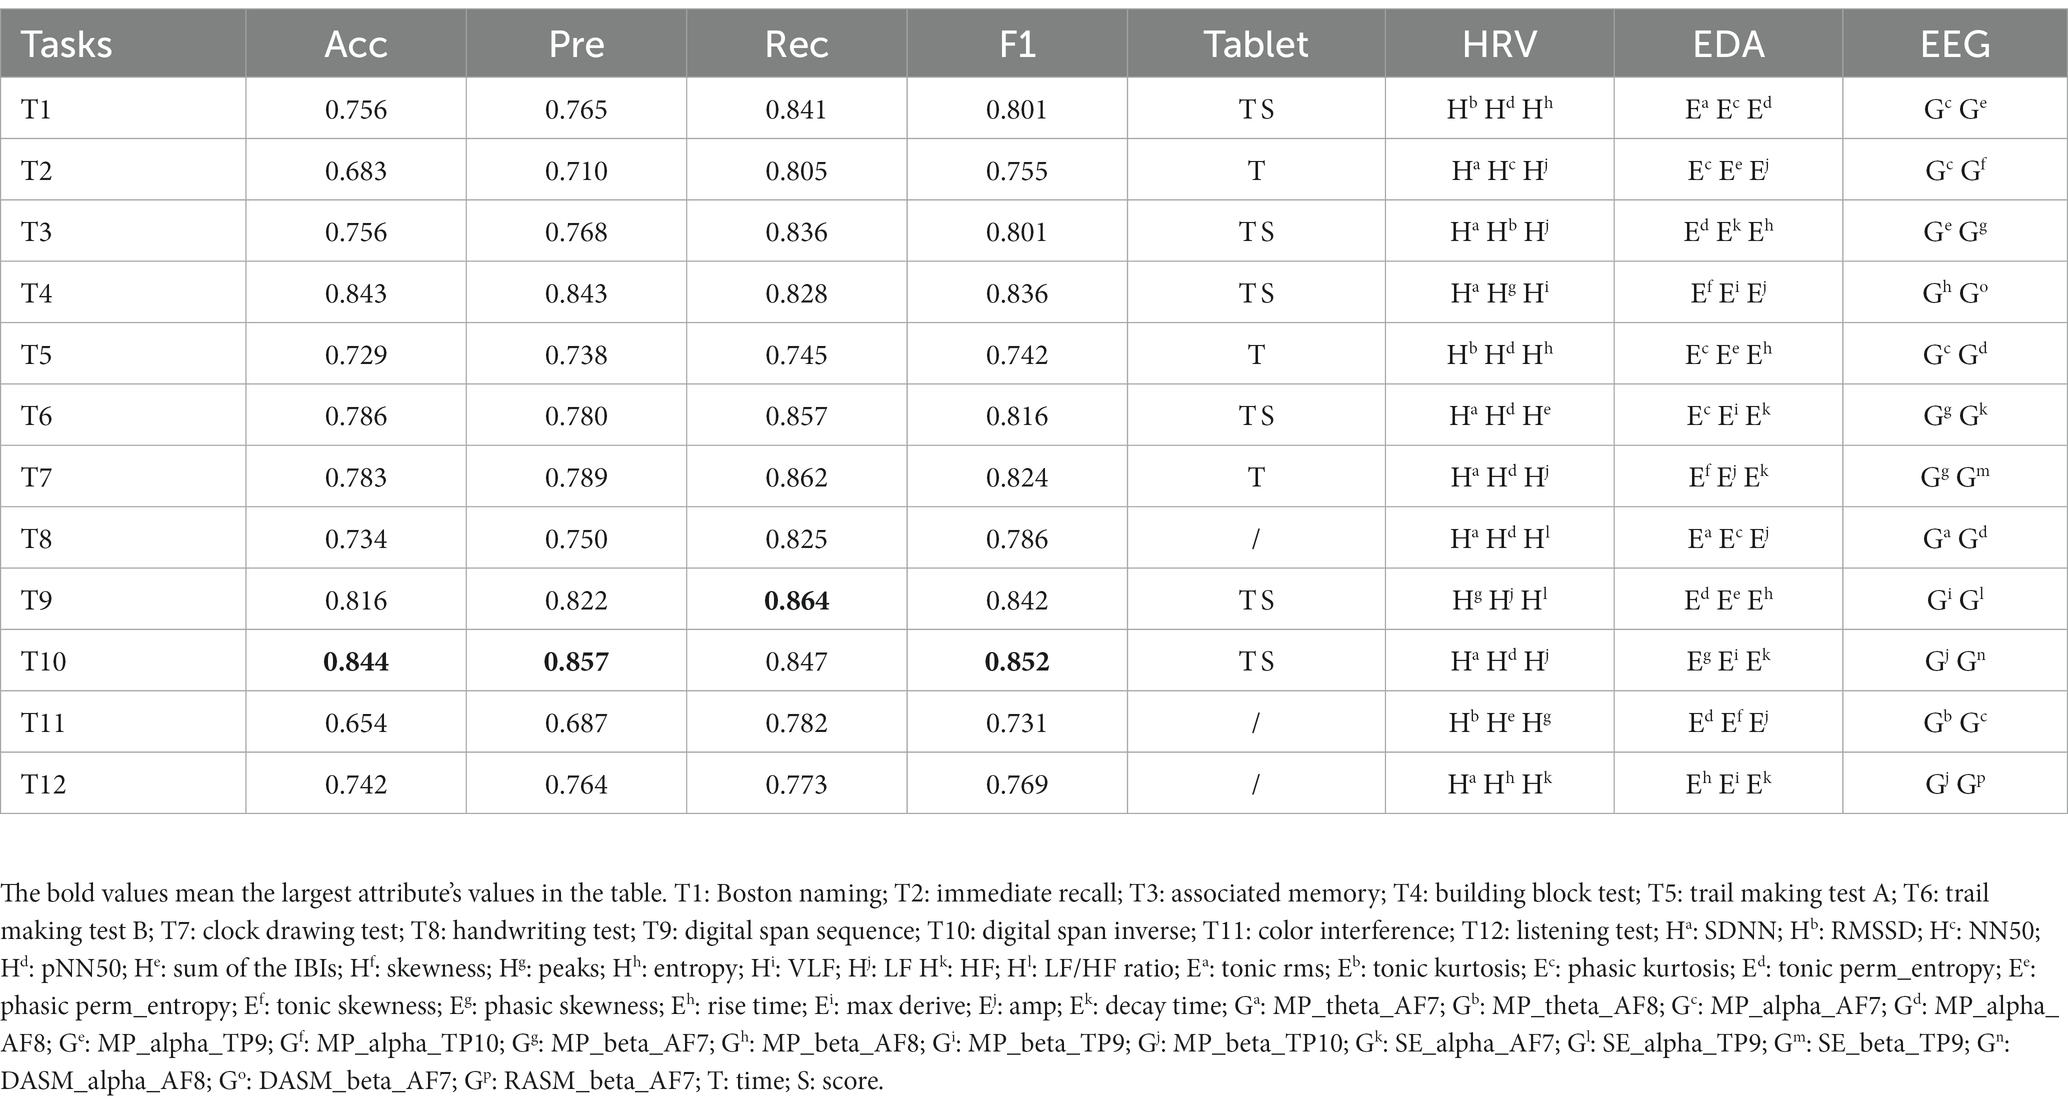
Table 2. Performance comparison of classification of selected feature subsets for 12 digital cognitive tests.
3.4. Predictive value of the classification framework
We compared the classification performance of the proposed classification framework under different classifiers for cognitive features from tablets, physiological features from wearable devices, and their combined features, as shown in Tables 3, 4. As expected, the combined features of all modalities yielded the highest classification accuracy. In particular, the highest classification accuracy (88.9%), precision (89.9%), recall (88.2%) and F1 values (89.0%) were obtained using the weighted soft voting strategy (Table 4). Furthermore, we compared it with digital cognitive tests and wearable sensors used for MCI detection in recent years, as shown in Table 5. The results show that our cognitive system outperformed recent studies in correctly identifying MCI patients, achieving an accuracy rate of 85.1%. Features fusing HRV, EDA and EEG signals were also the best when used to differentiate healthy individuals from MCI patients, achieving an accuracy of 86.2%, indicating that the use of fused features from multimodal data is more effective than unimodal data for classifying MCI. Similarly, our proposed MCI classification scheme outperformed all these methods by using fused features selected from Tablet, HRV, EDA and EEG signals, achieving a classification accuracy of 88.9%. Finally, the number of subjects participating in the experiment was 120, which is also the highest compared to studies using non-invasive wearable sensors to screen elderly with cognitive impairment.
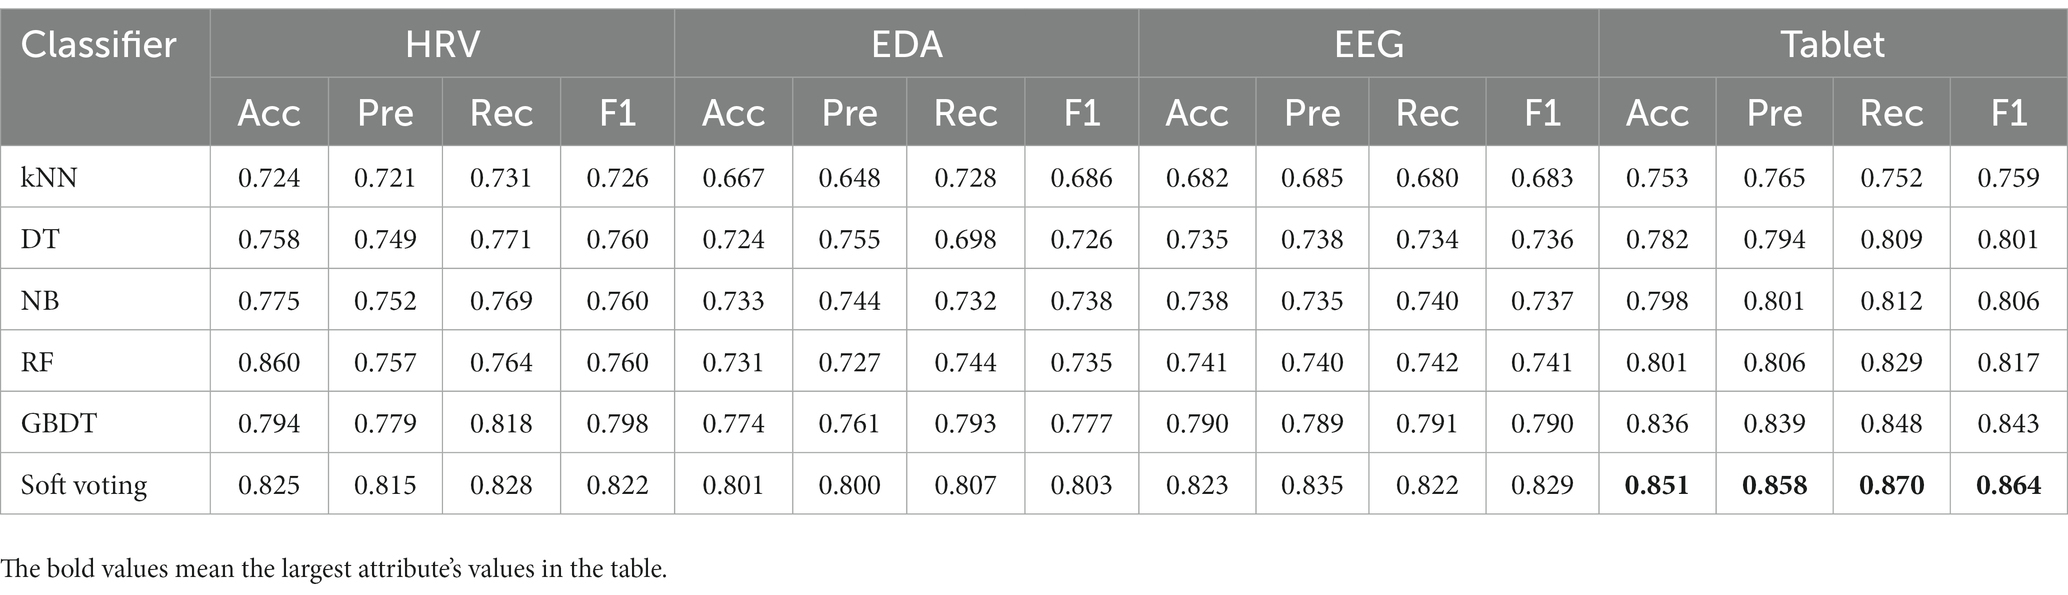
Table 3. Performance comparison of the classification framework with different classifiers for single-modal features from tablets and wearable devices.
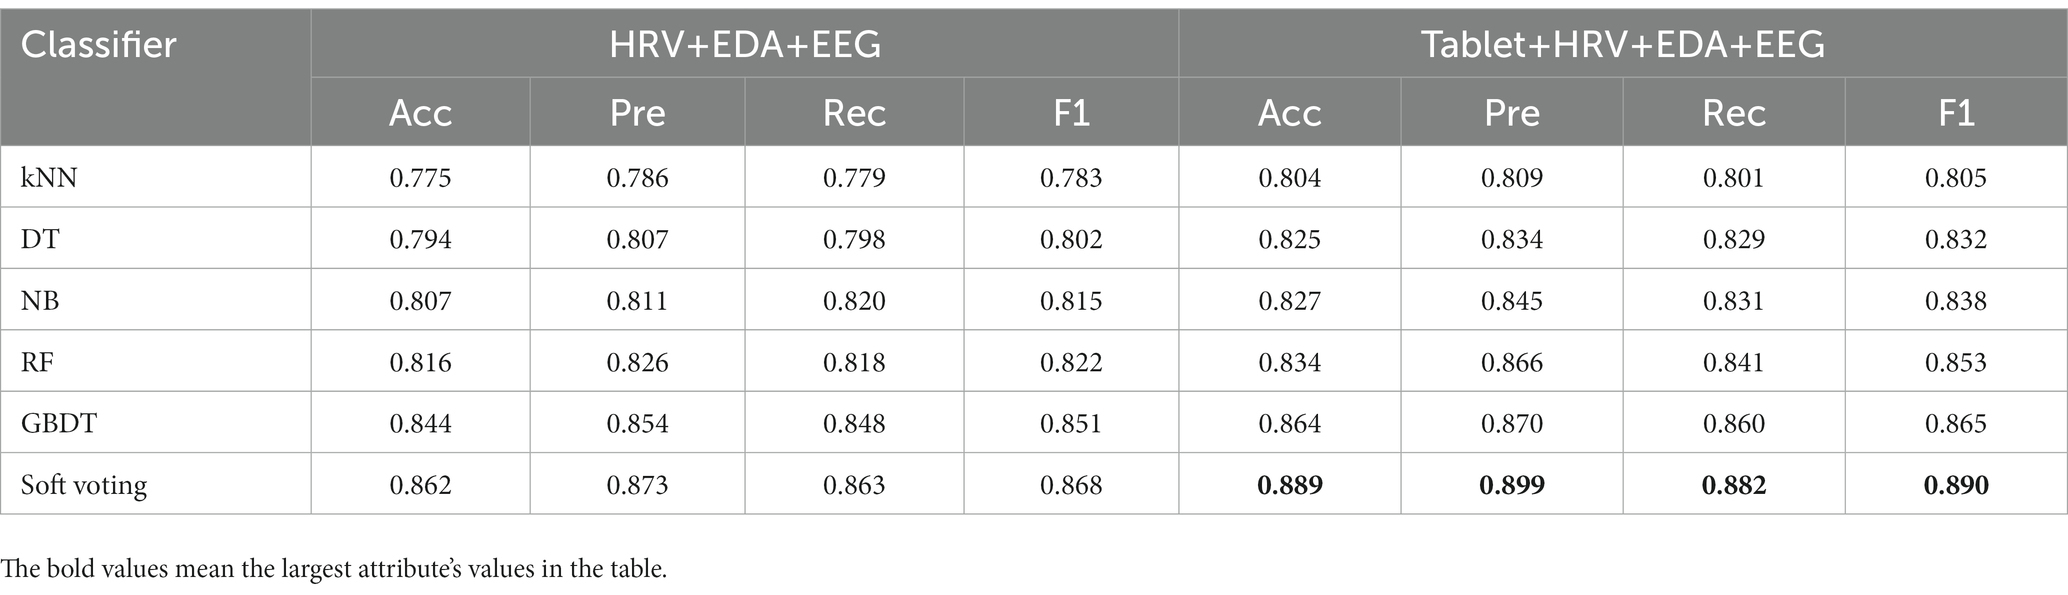
Table 4. Performance comparison of a classification framework with different classifiers for multi-modal fusion features of tablets and wearable devices.
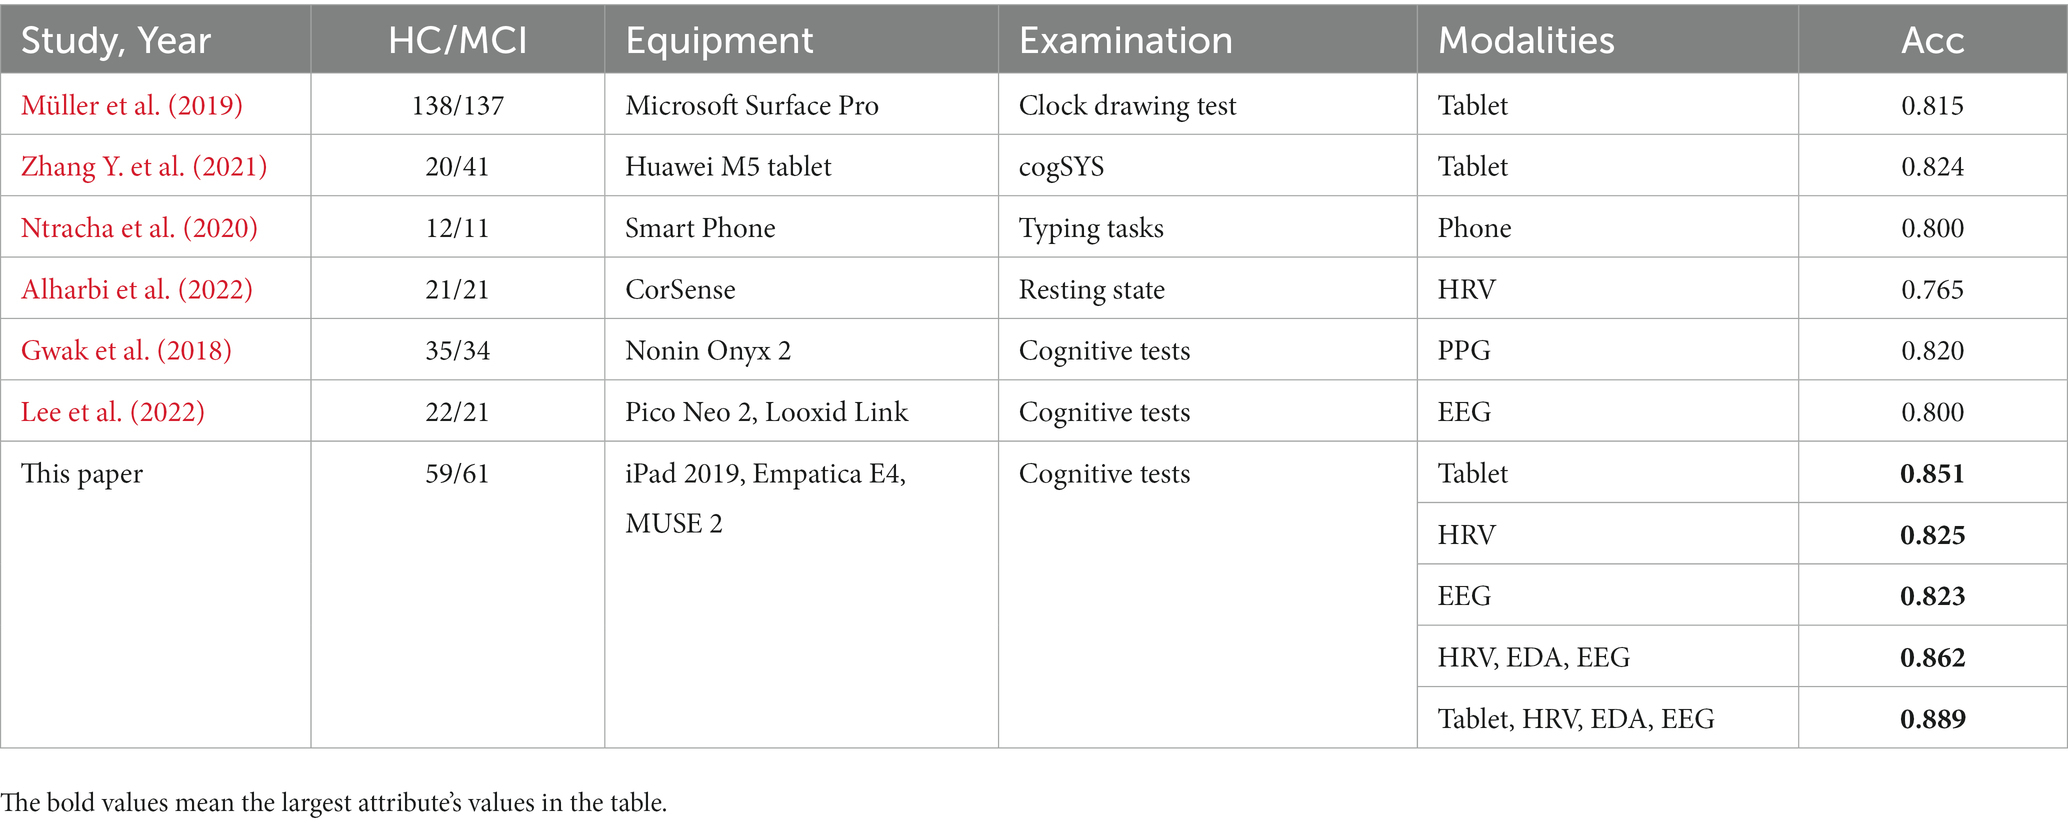
Table 5. Diagnostic value of our classification framework compared to existing studies of healthy individuals and MCI patients.
4. Discussion
This paper describes a non-invasive and convenient classification approach to facilitate early sign detection in MCI by simultaneously collecting cognitive behavioral and physiological data. To our knowledge, this is a rare study using a mobile app and multimodal wearable sensors (e.g., PPG, EDA and EEG) to assess and monitor physiological variations in MCI patients. Specifically, we fused features extracted from all physiological modalities and digital cognitive parameters, and applied machine learning to classify healthy individuals and MCI patients. The experimental results show that our classification framework works well, achieving 88.9% accuracy, reflecting the synergistic effect of combining digital cognitive tests and physiological sensor recordings in the context of MCI screening. In addition, the cognitive screening process can be carried out portable and without the involvement of a medical specialist, regardless of the test location, thus providing a low-cost and flexible family screening paradigm for the early detection of MCI.
Secondly, regarding cognitive domains, our digital cognitive tests covered multiple dimensions of language, memory, attention, visuospatial and executive function, which are core dimensions included in many existing computerized cognitive assessment tools (Gates and Kochan, 2015; Demeyere et al., 2021). A comparison of categorical performance on 12 cognitive tests found that the surveyed group had better discrimination on the digital span and building block tests (mean accuracy of 83.4%; Table 2), suggesting that early cognitive impairment is primarily associated with declines in memory, attention and executive function (Petersen, 2004). In addition, statistical hypothesis testing analyses found that time features performed more prominently on cognitive assessments; in other words, mobile apps could capture favorable cognitive parameters more efficiently than traditional paper-based screening methods. Notably, two tests (i.e., the color interference and listening test) performed poorly in screening the MCI, providing insights for future cognitive systems improvements.
Third, regarding the application of wearable sensors in MCI validation, the combination of the three modalities achieved an accuracy of 86.2% (Table 4). In other words, the best classification results were obtained by combining selected features of all modalities compared to the separate modalities. Furthermore, HRV reflects the activity of the autonomic nervous system and can be used as a parameter to monitor the health status of the elderly. Assessment of HRV characteristics showed that SDNN, pNN50 and LF were the most important predictors (Table 2), implying that sympathetic autonomic regulation contributes well to overall cognitive function (Dalise et al., 2020). The autonomic nervous system has been reported to be activated during cognitive assessment (Nicolini et al., 2014; Luque-Casado et al., 2016). However, participants’ EDA values were significantly higher during the task than resting state (Figure 3), reflecting that their mental health may be dominated by stress or an increased awareness of the ongoing job. High arousal levels are a complex physiological response to stress and task awareness observed during daily activities, accompanied by increased EDA and reduced heart rate (Hernandez et al., 2014). Finally, our findings also suggest that EEG recorded by MUSE has the potential to screen for neurodegenerative diseases. For example, (1) the MCI group showed an increase in power spectral density at slower frequencies (i.e., delta and theta) compared to controls (Figure 3); (2) EEG features selected by RFECV method were concentrated in the alpha and beta bands (Table 2), indicating significant differences between the investigated groups in these two bands; (3) Mean power was most frequent in distinguishing MCI patients from healthy individuals (Table 2), in other words, lower mean power indicated a significant association with poorer cognitive performance on psychometric tests (Luckhaus et al., 2008).
Finally, some limitations and future directions can be worked on in this paper. First, our sample was relatively small, including only 120 participants in the validation process. Transfer learning provides an idea for solving the small sample problem (Rahaman et al., 2020), and a richer dataset will enhance the validation of the screening effect of the MCI classification framework. Secondly, we ignored the relationship between physiological signals and cognitive domains (e.g., language, memory, attention, visuospatial and executive functions, etc.) to highlight whether these data or their derived features can be considered indicators of general cognitive functioning. In the next step, we will investigate participants’ physiological data under different cognitive domains to assess whether they can be regarded as predictors of cognitive performance. Finally, our classification framework is based on traditional machine learning methods and in the future, as the sample increases, we propose to improve the classification performance further using deep learning models (Zhao et al., 2022; Chen et al., 2023).
5. Conclusion
This study used digital cognitive tests and multimodal wearable sensors (e.g., PPG, EDA and EEG) to screen for MCI. We acquired physiological signals from participants at rest and during the task, and extracted features from these data. We found that participants differed significantly in their physiological signals during these two phases (i.e., resting and task states). Moreover, data from multiple modalities provided better classification performance than data from either modality alone, implying that combining the two (i.e., mobile app and wearable device) can synergistically influence MCI screening. The RFECV method and weighted soft voting strategy provided 88.9% classification accuracy by performing 10-fold cross-validation using a selected subset of features. With the popularization of mobile computing platforms, our classification framework may provide new ideas and practical support for early MCI detection in home and portable screening.
Data availability statement
The raw data supporting the conclusions of this article will be made available by the authors, without undue reservation.
Ethics statement
The studies involving human participants were reviewed and approved by Biomedical Ethics Review Committee of Taiyuan University of Technology. The patients/participants provided their written informed consent to participate in this study.
Author contributions
AL: thesis writing and experiments. JL and WW: data collection and processing. DZ and JZ: proofreading essay formatting and grammar. YQ: overall control of the thesis. All authors contributed to the article and approved the submitted version.
Funding
This work was supported by the Central Guidance for Local Science and Technology Development Funds (YDZJSX2022C004) and National Natural Science Foundation Collaboration (U21A20469).
Conflict of interest
The authors declare that the research was conducted in the absence of any commercial or financial relationships that could be construed as a potential conflict of interest.
Publisher’s note
All claims expressed in this article are solely those of the authors and do not necessarily represent those of their affiliated organizations, or those of the publisher, the editors and the reviewers. Any product that may be evaluated in this article, or claim that may be made by its manufacturer, is not guaranteed or endorsed by the publisher.
Supplementary material
The Supplementary material for this article can be found online at: https://www.frontiersin.org/articles/10.3389/fnhum.2023.1183457/full#supplementary-material
References
Acar, B., Savelieva, I., Hemingway, H., and Malik, M. (2000). Automatic ectopic beat elimination in short-term heart rate variability measurement. Comput. Methods Prog. Biomed. 63, 123–131. doi: 10.1016/S0169-2607(00)00081-X
Alharbi, E. A., Jones, J. M., and Alomainy, A. (2022). Non-invasive solutions to identify distinctions between healthy and mild cognitive impairments participants. IEEE J. Transl. Eng. Health Med. 10, 1–6. doi: 10.1109/JTEHM.2022.3175361
Breitner, J. C. S. (2014). Mild cognitive impairment and progression to dementia about mild cognitive impairment: new findings. Neurology 82, e34–e35. doi: 10.1212/WNL.0000000000000158
Bruña, R., Poza, J., Gomez, C., García, M., Fernández, A., and Hornero, R. (2012). Analysis of spontaneous MEG activity in mild cognitive impairment and Alzheimer's disease using spectral entropies and statistical complexity measures. J. Neural Eng. 9:036007. doi: 10.1088/1741-2560/9/3/036007
Burns, A., and Zaudig, M. (2002). Mild cognitive impairment in older people. Lancet 360, 1963–1965. doi: 10.1016/S0140-6736(02)11920-9
Cannard, C., Wahbeh, H., and Delorme, A.. (2021). “Validating the wearable MUSE headset for EEG spectral analysis and frontal alpha asymmetry,” in 2021 IEEE International Conference on Bioinformatics and Biomedicine (BIBM). (IEEE). 3603–3610.
Chai, J., Wu, R., Li, A., Xue, C., Qiang, Y., Zhao, J., et al. (2023). Classification of mild cognitive impairment based on handwriting dynamics and qEEG. Comput. Biol. Med. 152:106418. doi: 10.1016/j.compbiomed.2022.106418
Chen, Y., Gan, H., Chen, H., Zeng, Y., Xu, L., Heidari, A. A., et al. (2023). Accurate iris segmentation and recognition using an end-to-end unified framework based on MADNet and DSANet. Neurocomputing 517, 264–278. doi: 10.1016/j.neucom.2022.10.064
Chen, H., Li, C., Li, X., Rahaman, M. M., Hu, W., Li, Y., et al. (2022a). IL-MCAM: an interactive learning and multi-channel attention mechanism-based weakly supervised colorectal histopathology image classification approach. Comput. Biol. Med. 143:105265. doi: 10.1016/j.compbiomed.2022.105265
Chen, H., Li, C., Wang, G., Li, X., Mamunur Rahaman, M., Sun, H., et al. (2022b). GasHis-transformer: a multi-scale visual transformer approach for gastric histopathological image detection. Pattern Recogn. 130:108827. doi: 10.1016/j.patcog.2022.108827
Dalise, A. M., Prestano, R., Fasano, R., Gambardella, A., Barbieri, M., and Rizzo, M. R. (2020). Autonomic nervous system and cognitive impairment in older patients: evidence from long-term heart rate variability in real-life setting. Front. Aging Neurosci. 12:40. doi: 10.3389/fnagi.2020.00040
Demeyere, N., Haupt, M., Webb, S. S., Strobel, L., Milosevich, E. T., Moore, M. J., et al. (2021). Introducing the tablet-based Oxford cognitive screen-plus (OCS-plus) as an assessment tool for subtle cognitive impairments. Sci. Rep. 11, 1–14. doi: 10.1038/s41598-021-87287-8
Ehsani, H., Parvaneh, S., Mohler, J., Wendel, C., Zamrini, E., O'Connor, K., et al. (2020). Can motor function uncertainty and local instability within upper-extremity dual-tasking predict amnestic mild cognitive impairment and early-stage Alzheimer's disease? Comput. Biol. Med. 120:103705. doi: 10.1016/j.compbiomed.2020.103705
Föll, S., Maritsch, M., Spinola, F., Mishra, V., Barata, F., Kowatsch, T., et al. (2021). FLIRT: a feature generation toolkit for wearable data. Comput. Methods Prog. Biomed. 212:106461. doi: 10.1016/j.cmpb.2021.106461
Folstein, M. F., Folstein, S. E., and McHugh, P. R. (1975). “Mini-mental state”: a practical method for grading the cognitive state of patients for the clinician. J. Psychiatr. Res. 12, 189–198. doi: 10.1016/0022-3956(75)90026-6
Gashi, S., Di Lascio, E., and Santini, S. (2019). Using unobtrusive wearable sensors to measure the physiological synchrony between presenters and audience members. Proc. ACM Interact. Mobile Wearable Ubiquitous Technol. 3, 1–19. doi: 10.1145/3314400
Gates, N. J., and Kochan, N. A. (2015). Computerized and on-line neuropsychological testing for late-life cognition and neurocognitive disorders: are we there yet? Curr. Opin. Psychiatry 28, 165–172. doi: 10.1097/YCO.0000000000000141
Gosztolya, G., Vincze, V., Tóth, L., Pákáski, M., Kálmán, J., and Hoffmann, I. (2019). Identifying mild cognitive impairment and mild Alzheimer’s disease based on spontaneous speech using ASR and linguistic features. Comput. Speech Lang. 53, 181–197. doi: 10.1016/j.csl.2018.07.007
Grässler, B., Herold, F., Dordevic, M., Gujar, T. A., Darius, S., Böckelmann, I., et al. (2021). Multimodal measurement approach to identify individuals with mild cognitive impairment: study protocol for a cross-sectional trial. BMJ Open 11:e046879. doi: 10.1136/bmjopen-2020-046879
Greco, A., Valenza, G., Lanata, A., Scilingo, E. P., and Citi, L. (2015). cvxEDA: a convex optimization approach to electrodermal activity processing. IEEE Trans. Biomed. Eng. 63, 797–804. doi: 10.1109/TBME.2015.2474131
Groot, C., Hooghiemstra, A. M., Raijmakers, P. G. H. M., van Berckel, B. N. M., Scheltens, P., Scherder, E. J. A., et al. (2016). The effect of physical activity on cognitive function in patients with dementia: a meta-analysis of randomized control trials. Ageing Res. Rev. 25, 13–23. doi: 10.1016/j.arr.2015.11.005
Gwak, M., Sarrafzadeh, M., and Woo, E.. (2018). “Support for a clinical diagnosis of mild cognitive impairment using photoplethysmography and gait sensors,” in Proceedings, APSIPA Annual Summit and Conference. 2018: 12–15.
Hansen, R. A., Gartlehner, G., Webb, A. P., Morgan, L. C., Moore, C. G., and Jonas, D. E. (2008). Efficacy and safety of donepezil, galantamine, and rivastigmine for the treatment of Alzheimer’s disease: a systematic review and meta-analysis. Clin. Interv. Aging 3, 211–225. doi: 10.2147/cia.S12159936
Hassib, M., Schneegass, S., Eiglsperger, P., Henze, N., Schmidt, A., and Alt, F. (2017). “EngageMeter: a system for implicit audience engagement sensing using electroencephalography,” in Proceedings of the 2017 Chi conference on human factors in computing systems. 5114–5119.
Hernandez, J., Riobo, I., Rozga, A., Abowd, G. D., and Picard, R. W. (2014). “Using electrodermal activity to recognize ease of engagement in children during social interactions,” in Proceedings of the 2014 ACM international joint conference on pervasive and ubiquitous computing. 307–317
Hu, W., Li, C., Rahaman, M. M., Chen, H., Liu, W., Yao, Y., et al. (2023). EBHI: a new Enteroscope Biopsy Histopathological H&E Image Dataset for image classification evaluation. Phys. Med. 107:102534. doi: 10.1016/j.ejmp.2023.102534
Hunkin, H., King, D. L., and Zajac, I. T. (2021). Evaluating the feasibility of a consumer-grade wearable EEG headband to aid assessment of state and trait mindfulness. J. Clin. Psychol. 77, 2559–2575. doi: 10.1002/jclp.23189
Jonell, P., Moëll, B., Håkansson, K., Henter, G. E., Kucherenko, T., Mikheeva, O., et al. (2021). Multimodal capture of patient behaviour for improved detection of early dementia: clinical feasibility and preliminary results. Front. Comput. Sci. 3:642633. doi: 10.3389/fcomp.2021.642633
Karlsson, M., Hörnsten, R., Rydberg, A., and Wiklund, U. (2012). Automatic filtering of outliers in RR intervals before analysis of heart rate variability in Holter recordings: a comparison with carefully edited data. Biomed. Eng. Online 11, 1–12. doi: 10.1186/1475-925X-11-2
Knopman, D. S., and Petersen, R. C. (2014). “Mild cognitive impairment and mild dementia: a clinical perspective” in Mayo clinic proceedings. (Elsevier), 1452–1459.
Ladas, A., Frantzidis, C., Bamidis, P., and Vivas, A. B. (2014). Eye blink rate as a biological marker of mild cognitive impairment. Int. J. Psychophysiol. 93, 12–16. doi: 10.1016/j.ijpsycho.2013.07.010
Lee, B., Lee, T., Jeon, H., Lee, S., Kim, K., Cho, W., et al. (2022). Synergy through integration of wearable EEG and virtual reality for mild cognitive impairment and mild dementia screening. IEEE J. Biomed. Health Inform. 26, 2909–2919. doi: 10.1109/JBHI.2022.3147847
Li, X., Li, C., Rahaman, M. M., Sun, H., Li, X., Wu, J., et al. (2022). A comprehensive review of computer-aided whole-slide image analysis: from datasets to feature extraction, segmentation, classification and detection approaches. Artif. Intell. Rev. 55, 4809–4878. doi: 10.1007/s10462-021-10121-0
Luckhaus, C., Grass-Kapanke, B., Blaeser, I., Ihl, R., Supprian, T., Winterer, G., et al. (2008). Quantitative EEG in progressing vs stable mild cognitive impairment (MCI): results of a 1-year follow-up study. Int. J. Geriatr. Psychiatry 23, 1148–1155. doi: 10.1002/gps.2042
Luque-Casado, A., Perales, J. C., Cárdenas, D., and Sanabria, D. (2016). Heart rate variability and cognitive processing: the autonomic response to task demands. Biol. Psychol. 113, 83–90. doi: 10.1016/j.biopsycho.2015.11.013
Martin, T., Giordani, B., and Kavcic, V. (2022). EEG asymmetry and cognitive testing in MCI identification. Int. J. Psychophysiol. 177, 213–219. doi: 10.1016/j.ijpsycho.2022.05.012
Martínez-Rodrigo, A., Zangróniz, R., Pastor, J. M., and Sokolova, M. V. (2017). Arousal level classification of the aging adult from electro-dermal activity: from hardware development to software architecture. Pervasive Mobile Comput. 34, 46–59. doi: 10.1016/j.pmcj.2016.04.006
Müller, S., Herde, L., Preische, O., Zeller, A., Heymann, P., Robens, S., et al. (2019). Diagnostic value of digital clock drawing test in comparison with CERAD neuropsychological battery total score for discrimination of patients in the early course of Alzheimer’s disease from healthy individuals. Sci. Rep. 9, 1–10. doi: 10.1038/s41598-019-40010-0
Nasreddine, Z. S., Phillips, N. A., Bédirian, V., Charbonneau, S., Whitehead, V., Collin, I., et al. (2005). The Montreal cognitive assessment, MoCA: a brief screening tool for mild cognitive impairment. J. Am. Geriatr. Soc. 53, 695–699. doi: 10.1111/j.1532-5415.2005.53221.x
Nicolini, P., Ciulla, M. M., Malfatto, G., Abbate, C., Mari, D., Rossi, P. D., et al. (2014). Autonomic dysfunction in mild cognitive impairment: evidence from power spectral analysis of heart rate variability in a cross-sectional case-control study. PLoS One 9:e96656. doi: 10.1371/journal.pone.0096656
Nicolini, P., Mari, D., Abbate, C., Inglese, S., Bertagnoli, L., Tomasini, E., et al. (2020). Autonomic function in amnestic and non-amnestic mild cognitive impairment: spectral heart rate variability analysis provides evidence for a brain–heart axis. Sci. Rep. 10, 1–16. doi: 10.1038/s41598-020-68131-x
Ntracha, A., Iakovakis, D., Hadjidimitriou, S., Charisis, V. S., Tsolaki, M., and Hadjileontiadis, L. J. (2020). Detection of mild cognitive impairment through natural language and touchscreen typing processing. Front. Digital Health 2:567158. doi: 10.3389/fdgth.2020.567158
Pernet, C., Garrido, M. I., Gramfort, A., Maurits, N., Michel, C. M., Pang, E., et al. (2020). Issues and recommendations from the OHBM COBIDAS MEEG committee for reproducible EEG and MEG research. Nat. Neurosci. 23, 1473–1483. doi: 10.1038/s41593-020-00709-0
Petersen, R. C. (2004). Mild cognitive impairment as a diagnostic entity. J. Intern. Med. 256, 183–194. doi: 10.1111/j.1365-2796.2004.01388.x
Rahaman, M. M., Li, C., Yao, Y., Kulwa, F., Rahman, M. A., Wang, Q., et al. (2020). Identification of COVID-19 samples from chest X-ray images using deep learning: a comparison of transfer learning approaches. J. Xray Sci. Technol. 28, 821–839. doi: 10.3233/XST-200715
Rajan, K. B., Weuve, J., Barnes, L. L., McAninch, E. A., Wilson, R. S., and Evans, D. A. (2021). Population estimate of people with clinical Alzheimer's disease and mild cognitive impairment in the United States (2020–2060). Alzheimers Dement. 17, 1966–1975. doi: 10.1002/alz.12362
Rossini, P. M., Buscema, M., Capriotti, M., Grossi, E., Rodriguez, G., del Percio, C., et al. (2008). Is it possible to automatically distinguish resting EEG data of normal elderly vs. mild cognitive impairment subjects with high degree of accuracy? Clin. Neurophysiol. 119, 1534–1545. doi: 10.1016/j.clinph.2008.03.026
Shukla, J., Barreda-Angeles, M., Oliver, J., Nandi, G. C., and Puig, D. (2019). Feature extraction and selection for emotion recognition from electrodermal activity. IEEE Trans. Affect. Comput. 12, 857–869. doi: 10.1109/TAFFC.2019.2901673
Sperling, R., Mormino, E., and Johnson, K. (2014). The evolution of preclinical Alzheimer’s disease: implications for prevention trials. Neuron 84, 608–622. doi: 10.1016/j.neuron.2014.10.038
Xue, S., Li, M. F., Leng, B., Yao, R., Sun, Z., Yang, Y., et al. (2022). Complement activation mainly mediates the association of heart rate variability and cognitive impairment in adults with obstructive sleep apnea without dementia. Sleep 46:zsac146. doi: 10.1093/sleep/zsac146
Yu, M., Han, M., Li, X., Wei, X., Jiang, H., Chen, H., et al. (2022). Adaptive soft erasure with edge self-attention for weakly supervised semantic segmentation: thyroid ultrasound image case study. Comput. Biol. Med. 144:105347. doi: 10.1016/j.compbiomed.2022.105347
Zhang, Y., Chen, Y., Yu, H., Lv, Z., Yang, X., Hu, C., et al. (2021). What can “drag & drop” tell? Detecting mild cognitive impairment by hand motor function assessment under dual-task paradigm. Int. J. Hum.–Comput. Stud. 145:102547. doi: 10.1016/j.ijhcs.2020.102547
Zhang, J., Li, C., Kosov, S., Grzegorzek, M., Shirahama, K., Jiang, T., et al. (2021). LCU-net: a novel low-cost U-net for environmental microorganism image segmentation. Pattern Recogn. 115:107885. doi: 10.1016/j.patcog.2021.107885
Keywords: mild cognitive impairment, cognitive assessment, screening tool, wearable devices, touchscreen
Citation: Li A, Li J, Zhang D, Wu W, Zhao J and Qiang Y (2023) Synergy through integration of digital cognitive tests and wearable devices for mild cognitive impairment screening. Front. Hum. Neurosci. 17:1183457. doi: 10.3389/fnhum.2023.1183457
Edited by:
Chen Li, Northeastern University, ChinaReviewed by:
Huiling Chen, Wenzhou University, ChinaZhenghao Shi, Xi'an University of Technology, China
Copyright © 2023 Li, Li, Zhang, Wu, Zhao and Qiang. This is an open-access article distributed under the terms of the Creative Commons Attribution License (CC BY). The use, distribution or reproduction in other forums is permitted, provided the original author(s) and the copyright owner(s) are credited and that the original publication in this journal is cited, in accordance with accepted academic practice. No use, distribution or reproduction is permitted which does not comply with these terms.
*Correspondence: Yan Qiang, cWlhbmd5YW5AdHl1dC5lZHUuY24=