 Fenfen Sun
 Yue Chen1,2
95% of researchers rate our articles as excellent or good
Learn more about the work of our research integrity team to safeguard the quality of each article we publish.
Find out more
ORIGINAL RESEARCH article
Front. Hum. Neurosci. , 06 January 2023
Sec. Brain Health and Clinical Neuroscience
Volume 16 - 2022 | https://doi.org/10.3389/fnhum.2022.1039590
This article is part of the Research Topic Effective Connectivity Analysis in Neuropsychiatric Disorders View all 6 articles
Objective: The present study used magnetic resonance imaging to investigate the difference in the relationship between gray matter structure and age in children and adolescents with autism spectrum disorder (ASD) and typically developing (TD) subjects.
Methods: After screening T1 structural images from the Autism Brain Imaging Data Exchange (ABIDE) database, 111 children and adolescents (7–18 years old) with high-functioning ASD and 151 TD subjects matched for age, sex and full IQ were included in the current study. By using the voxel-based morphological analysis method, gray matter volume/density (GMV/GMD) maps were obtained for each participant. Then, a multiple regression analysis was performed for ASD and TD groups, respectively to estimate the relationship between GMV/GMD and age with gender, education, site, and IQ scores as covariates. Furthermore, a z-test was used to compare such relationship difference between the groups.
Results: Results showed that compared with TD, the GMD of ASD showed stronger positive correlations with age in the prefrontal cortex, and a stronger negative correlation in the left inferior parietal lobule, and a weaker positive correlation in the right inferior parietal lobule. The GMV of ASD displayed stronger positive correlations with age in the prefrontal cortex and cerebellum.
Conclusion: These findings may provide evidence to support that the brain structure abnormalities underlying ASD during childhood and adolescence may differ from each other.
Autism spectrum disorder (ASD) is a neurodevelopmental disorder that begins in early childhood, and its core symptoms are mainly impairments of social communication and language, repetitive stereotyped behaviors, and narrow interests, which seriously hinder the socialization process of child development (Baio et al., 2018). A previous survey showed that the prevalence of ASD was 1‰ for children aged 0–6 years, 1.53‰ for children aged 2–6 years, and approximately 2.59‰ for children aged 3–12 years (Rydzewska et al., 2019). Studies have shown that the prevalence of ASD in children under the age of 8 is 1/59 (Baio et al., 2018) and is 1/45 in children or adolescents aged 3–17 (Zablotsky et al., 2015), and the prevalence of adult autism is 9.8‰ (Brugha et al., 2016). Moreover, ASD patients in different age groups have different clinical symptoms. For example, a prior study has demonstrated that differences between verbal and non-verbal skills (especially visual processing) in children with ASD increase with age, and children with high non-verbal skills have greater impairments in social functioning (Joseph et al., 2002). Another study found that male children with ASD might exhibit more repetitive stereotyped behaviors after age 6 than before age 6 (Van Wijngaarden-Cremers et al., 2014). Additionally, adult ASD patients’ executive function and working memory worsen with age (Braden et al., 2017). Collectively, these findings suggest that the pathogenesis of ASD may be closely related to age.
In recent years, non-invasive magnetic resonance imaging (MRI) technology has been widely used in the study of the pathological mechanisms underlying diseases. Studies have shown that compared with typically developing (TD) subjects, the gray matter in brains of children with ASD aged 1 to 2 years showed overgrowth (Hazlett et al., 2005); the brain volume of those aged 2 to 4 years was significantly larger, but such a change was not found in the adult ASD population (Redcay and Courchesne, 2005). Moreover, this study also found that the gray matter volume changes of the frontotemporal cortex, limbic system and cerebellum in adult ASD patients were different from those of children and adolescents (Yang et al., 2016), and the cortical thickness decreased with age in children and adolescents with ASD but increased with age in adulthood (Van Rooij et al., 2018). These findings suggest that gray matter structure in the cortex of ASD patients shows age-specific alterations. As a widespread and lifelong developmental disorder, ASD seriously affects the quality of life of patients, especially children and adolescents with age ranged from 7 to 18 years (Dong et al., 2021; Zheng et al., 2021). However, so far, the relationship between gray matter structure and age in children and adolescents with high-functioning ASD and its difference with TD are still unclear.
The present study used MRI to calculate the gray matter volume/density (GMV/GMD) and compared the relationship between gray matter structure and age in ASD and TD individuals to explore the brain structure mechanism of the effect of age in ASD. We hope that our findings will provide a theoretical basis for behavioral intervention and educational countermeasures for children and adolescents with ASD.
T1-weighted MRI data was downloaded from the Autism Brain Imaging Data Exchange (ABIDE1). All images were acquired with a 3T MRI scanner with a resolution of 1 × 1 × 1 mm3. More details of the scan sequence parameters can be found on the ABIDE website. Data collection at all sites was approved by the local Ethics Committee. The structural MRI images from a total of 1,081 subjects were downloaded at the initial stage. Then, the subjects were screened according to the following criteria: (1) right-handed; (2) full IQ ≥ 80; (3) 7 years old < age < 18 years old; (4) sample size ≥ 10 at each site (see Table 1 for site and sample size information); and (5) age, IQ, site origin, and gender showed no significant difference between the ASD and TD groups. The IQ of all subjects was measured by the Wechsler Abbreviated Scales of Intelligence (WASI), which includes the full intelligence quotient (FIQ), verbal intelligence quotient (VIQ) and performance intelligence quotient (PIQ) indicators. The symptoms of ASD patients were assessed by the Autism Diagnostic Interview Revised (ADI-R) scale. Finally, 111 ASD and 151 TD subjects entered the subsequent data analysis.
Table 1. Sites of participants where T1 images were obtained and corresponding sample sizes.
Voxel-based morphological (VBM) analysis was performed for each subject by using the VBM toolkit within SPM.2 First, the T1 structural image was spatially registered to a MNI age-specific spatial template (Dong et al., 2020). Second, the registered image was segmented into white matter, gray matter, and cerebrospinal fluid by the built-in segmentation algorithm of the software, and further performed the bias correction of images to remove inhomogeneities in signal intensity. Finally, the bias-corrected gray matter image and the modulated gray matter image reflected density and volume, respectively. Both GMV and GMD maps were smoothed with a Gaussian smoothing kernel with a width at half maximum of 8 mm.
This study used multiple regression analysis based on the SPM software module to assess the correlation between age and gray matter structure. This regression model was established with age as an independent variable, gray matter structure (GMV/GMD) as a dependent variable, and gender, education level, total GMV, site and three IQ scores as the covariates. All analyses were performed within a gray matter mask, with FDR correction (voxel-level p < 0.05, cluster size > 100 voxels) for multiple comparisons to reduce false-positive results in statistical analyses. After FDR correction for the multiple regression analysis in each group, we obtained two masks and then merged them into one, which included the brain regions showing significant correlations between GMD/GMV and age in ASD or TD or both groups. Next, we calculated the Pearson’s correlation between GMD/GMV and age for each region within the merged mask in ASD and TD groups, respectively. Finally, we performed a z-test to detect the difference of correlation coefficient between the two groups in each region.
There were no significant differences in age, gender and IQ between the two groups (p > 0.05), as shown in Table 2.
Table 2. Comparison between groups of demographic data.
Both the ASD and TD groups showed positive correlations between age and the GMDs in the prefrontal cortex (PFC), orbitofrontal gyrus, occipital lobe, and hippocampus. The GMDs in the medial frontal lobe, anterior cingulate gyrus, and inferior parietal lobule (IPL) were negatively correlated with age in the two groups (Figure 1). However, the GMD in the cerebellum showed a positive correlation with age in the TD group but not in the ASD group. The two groups showed a positive correlation between GMV in the hippocampus as well as cerebellum and age and negative correlations between GMVs in the precuneus, posterior cingulate and IPL and age (Figure 2). However, a positive correlation between GMV in the prefrontal lobe and age was found only in the ASD group.
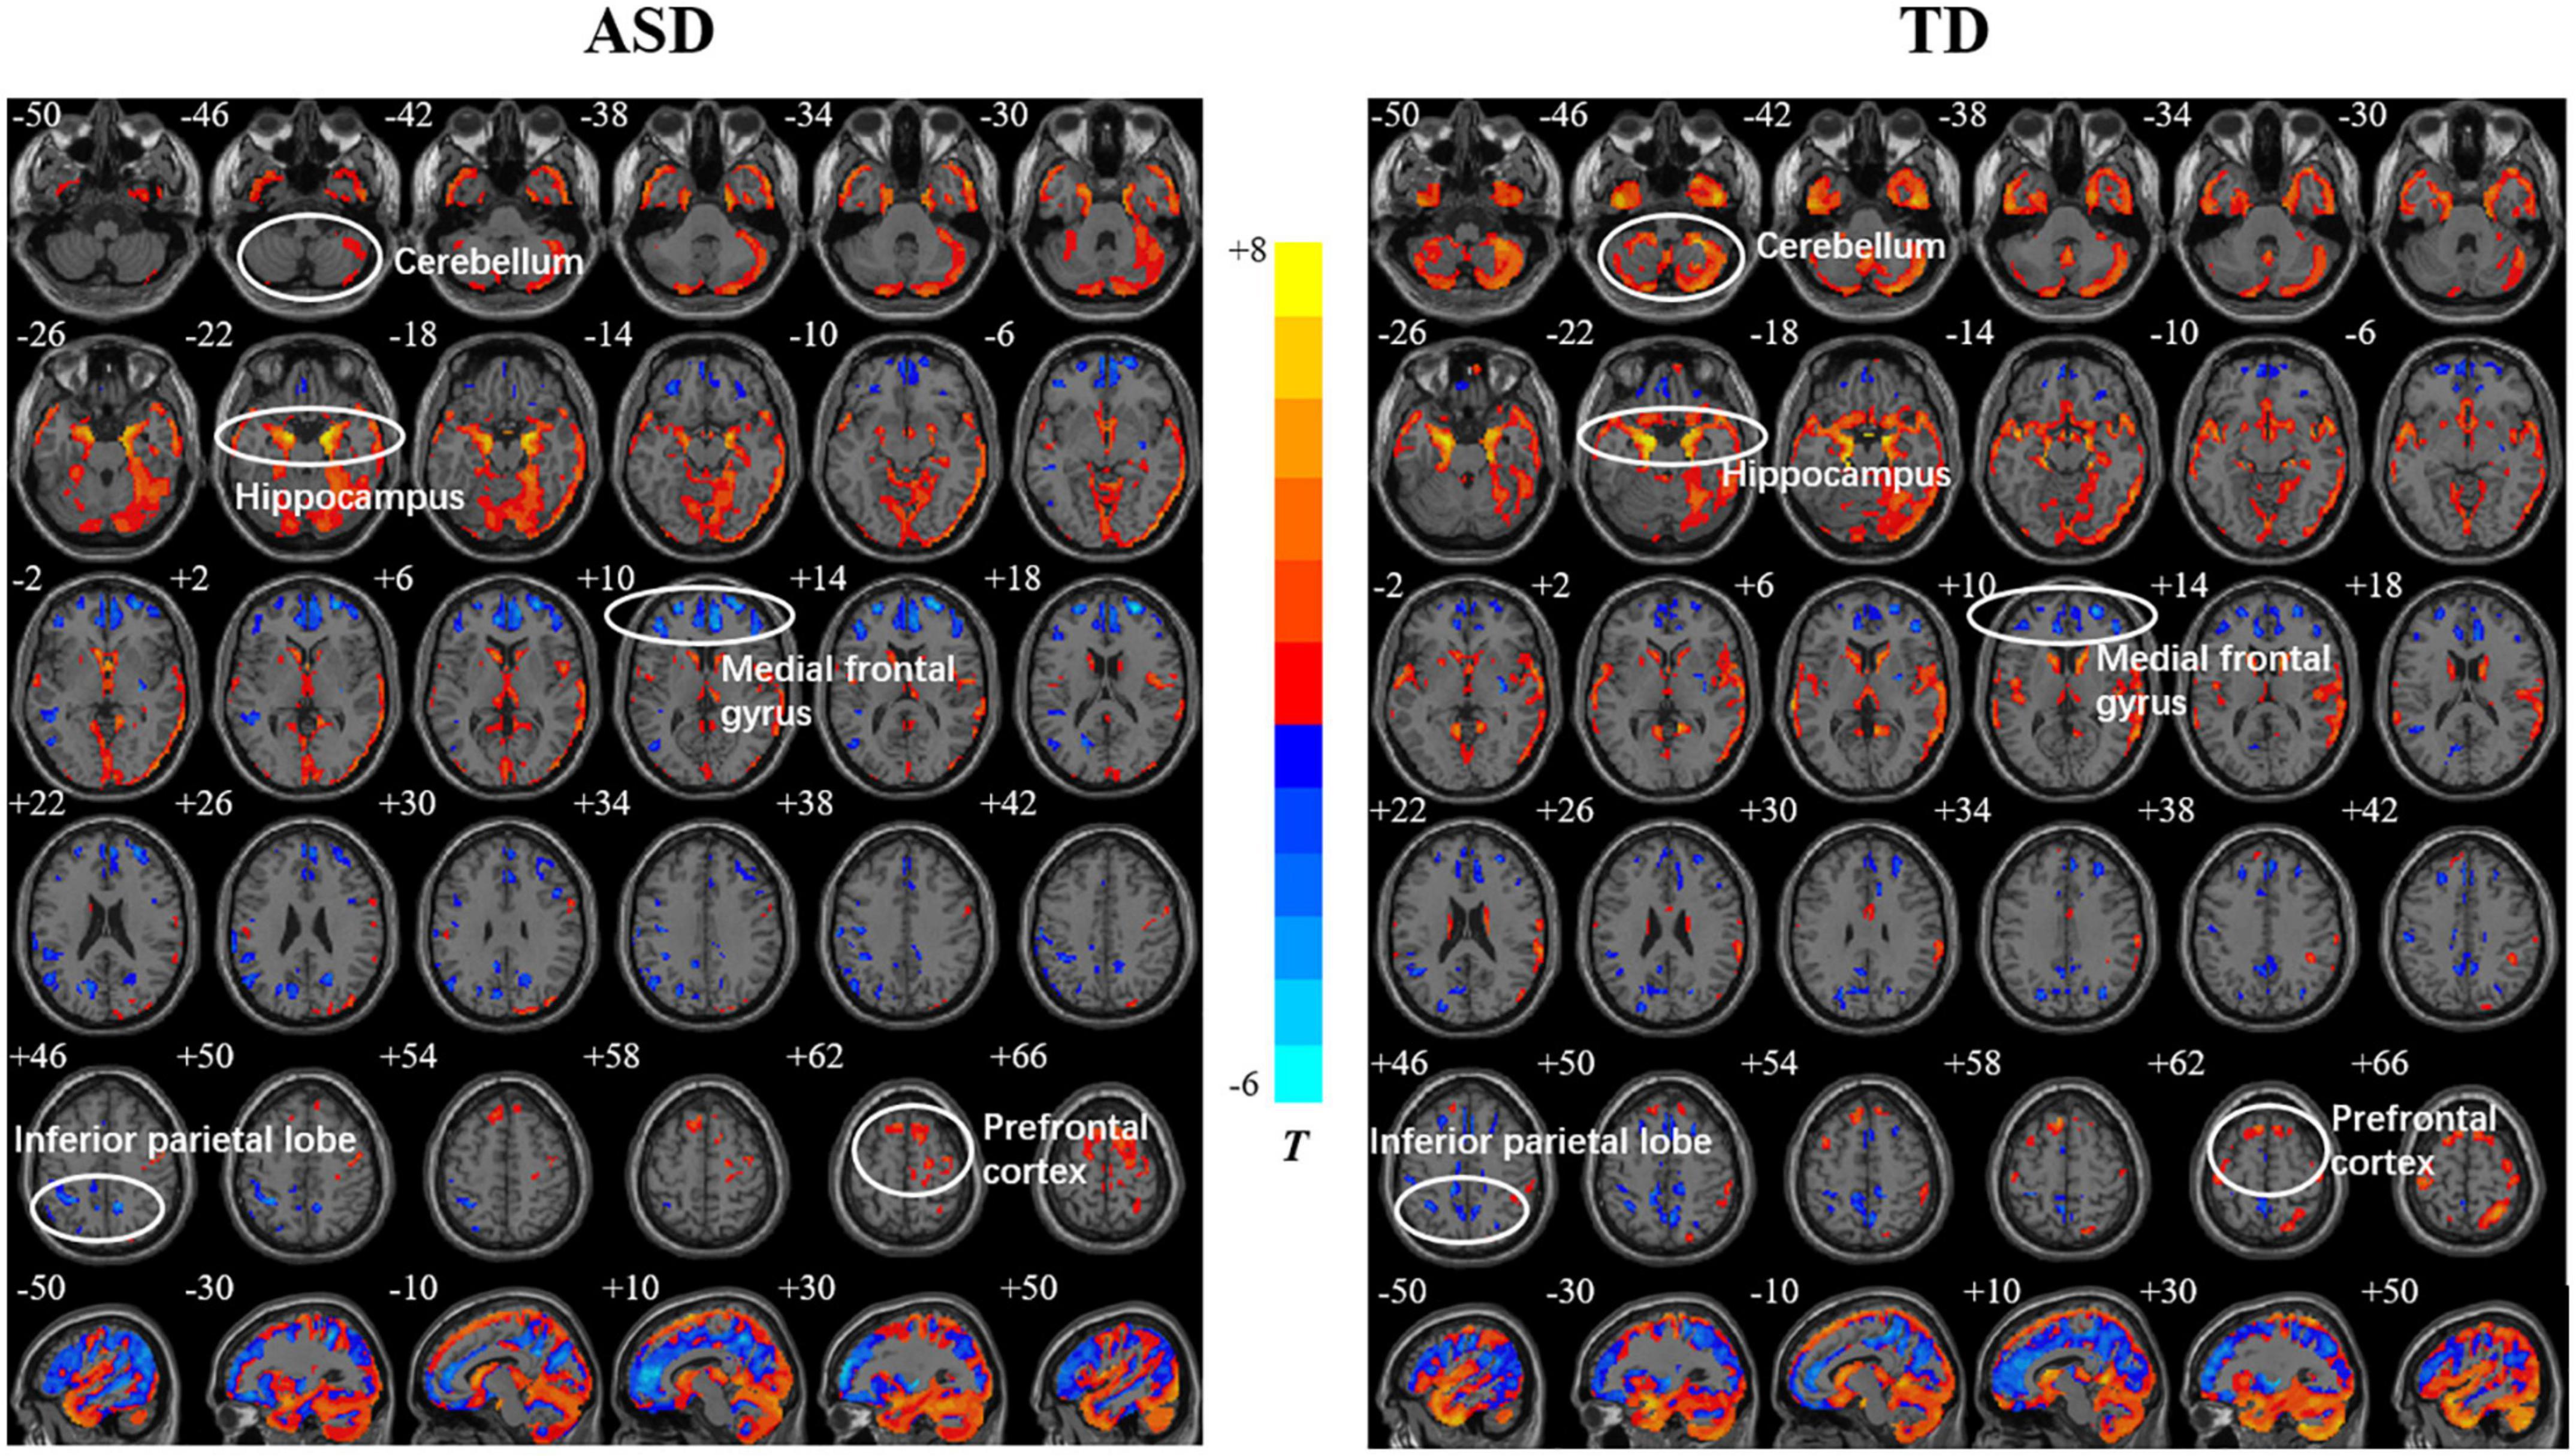
Figure 1. Relationships between age and gray matter density (GMD) in the autism spectrum disorder (ASD) and typically developing (TD) groups. The color bar shows the T value, in which warm and cold colors represent positive and negative correlations, respectively.
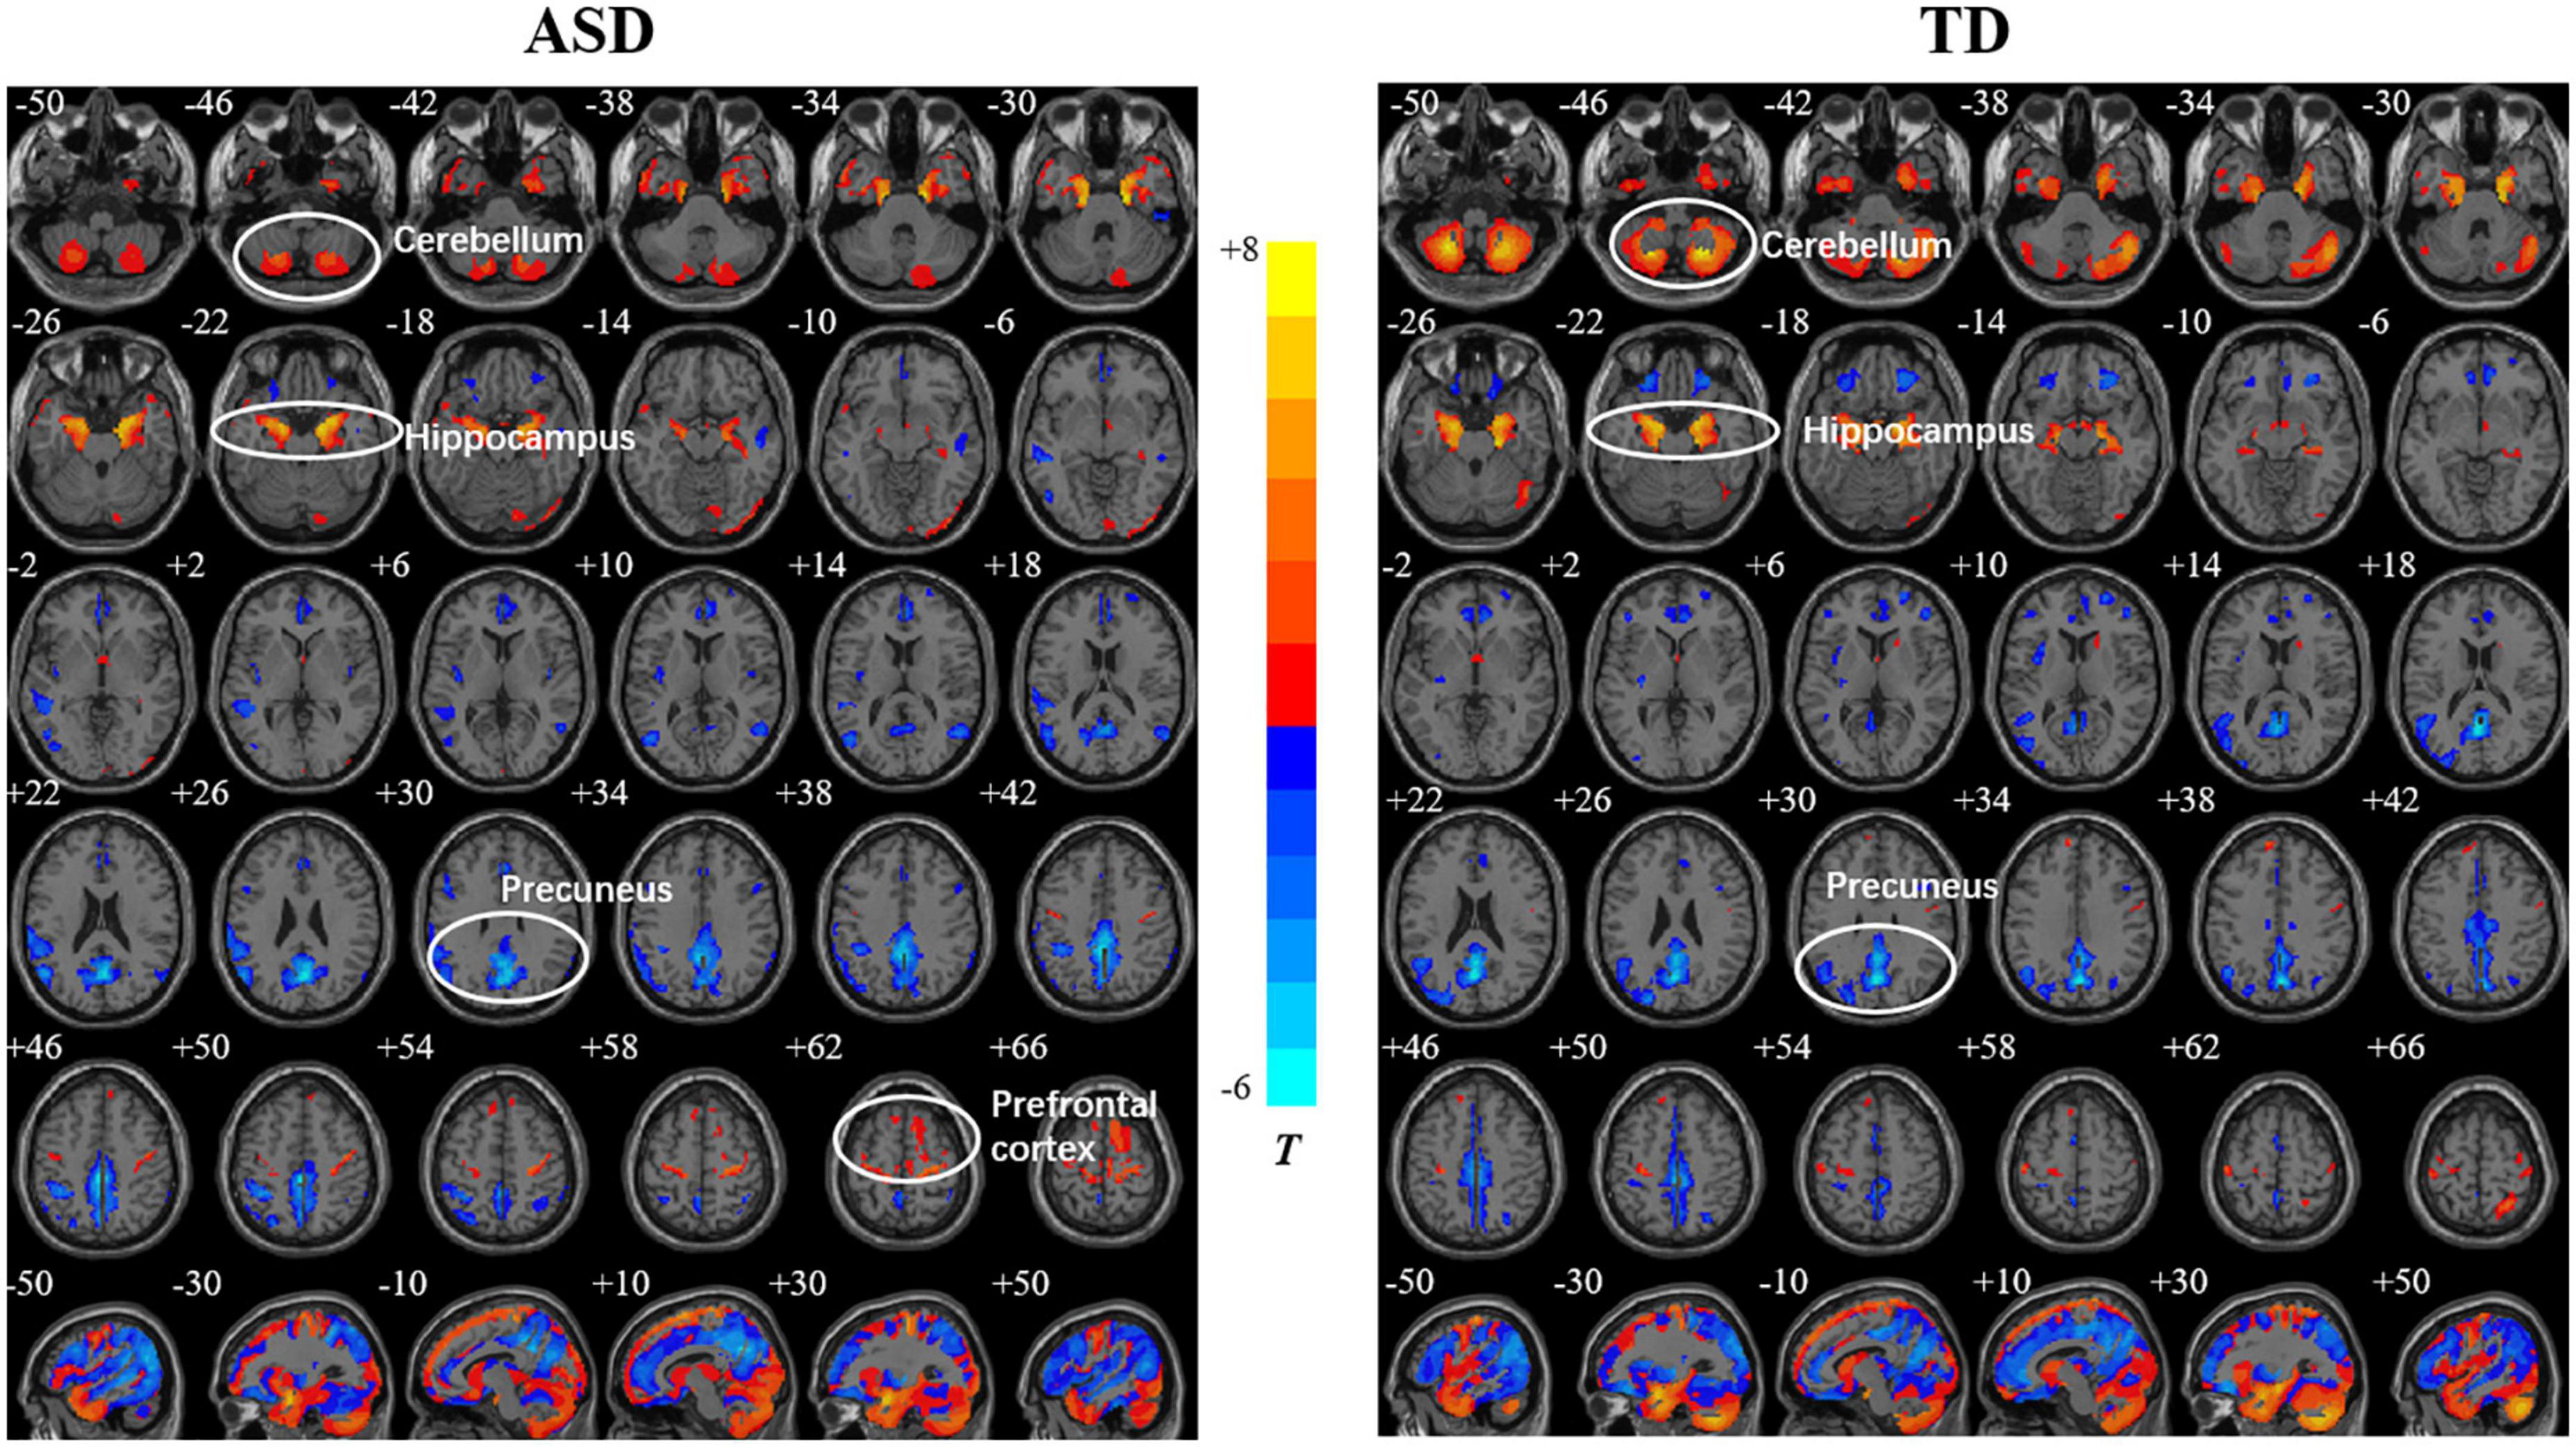
Figure 2. Relationships between age and gray matter volume (GMV) in the autism spectrum disorder (ASD) and typically developing (TD) groups. The color bar shows the T value, in which warm and cold colors represent positive correlation and negative correlations, respectively.
The comparisons between the groups found that compared with TD, the GMD of ASD showed stronger correlations with age in right PFC [precentral gyrus and supplementary motor area (SMA)], hippocampus, left IPL and supramarginal gyrus (SMG), and a weaker correlation in the right IPL (Figure 3, Table 3), while the GMV of ASD showed higher correlations with age in prefrontal cortex (bilateral SMA and left paracentral lobule), and right cerebellum (Figure 4, Table 3).
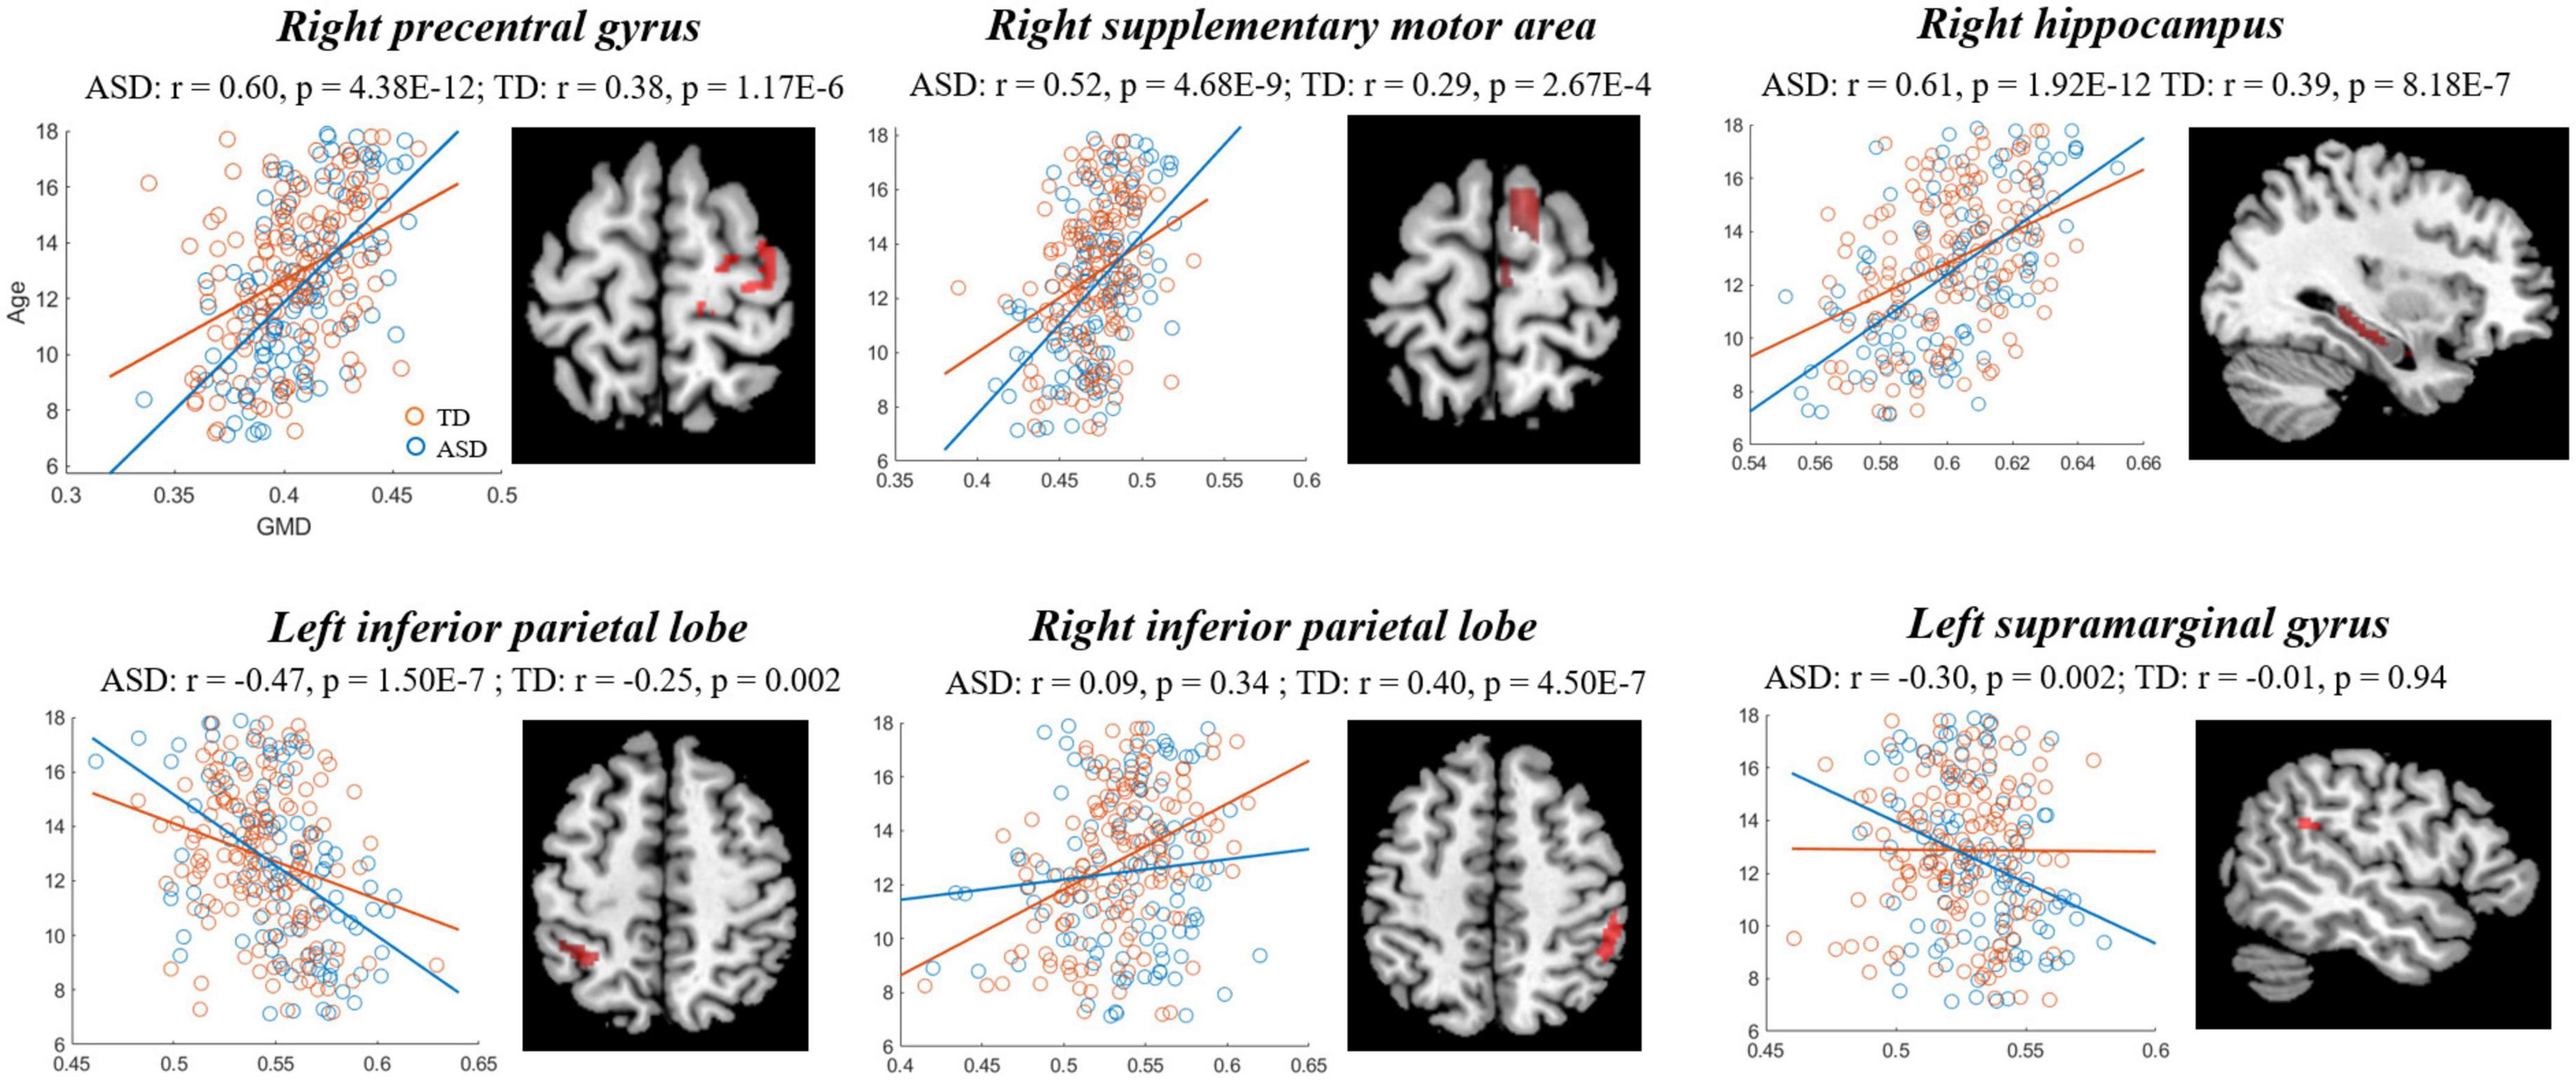
Figure 3. Correlations between gray matter density (GMD) and age showing significant differences between autism spectrum disorder (ASD) and typically developing (TD). Blue and red represent the ASD and TD, respectively.
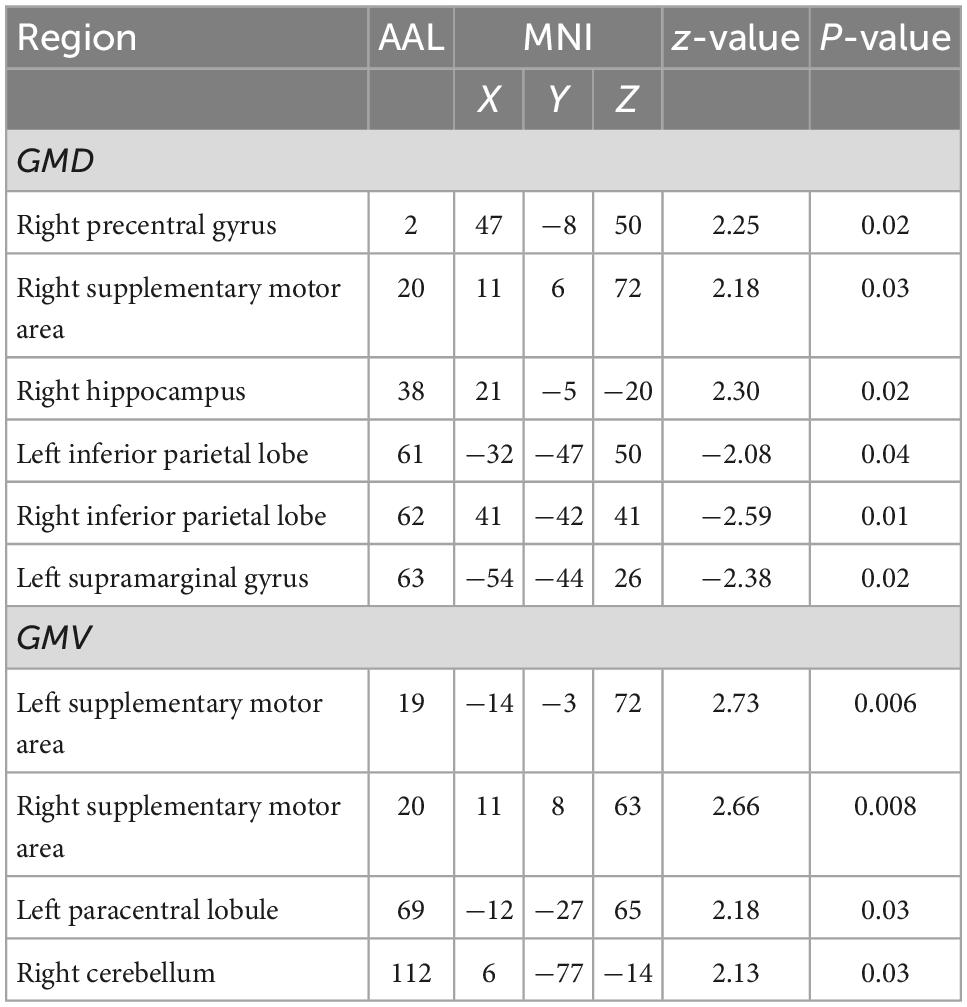
Table 3. Comparison of correlation between gray matter volume/density (GMV/GMD) and age.
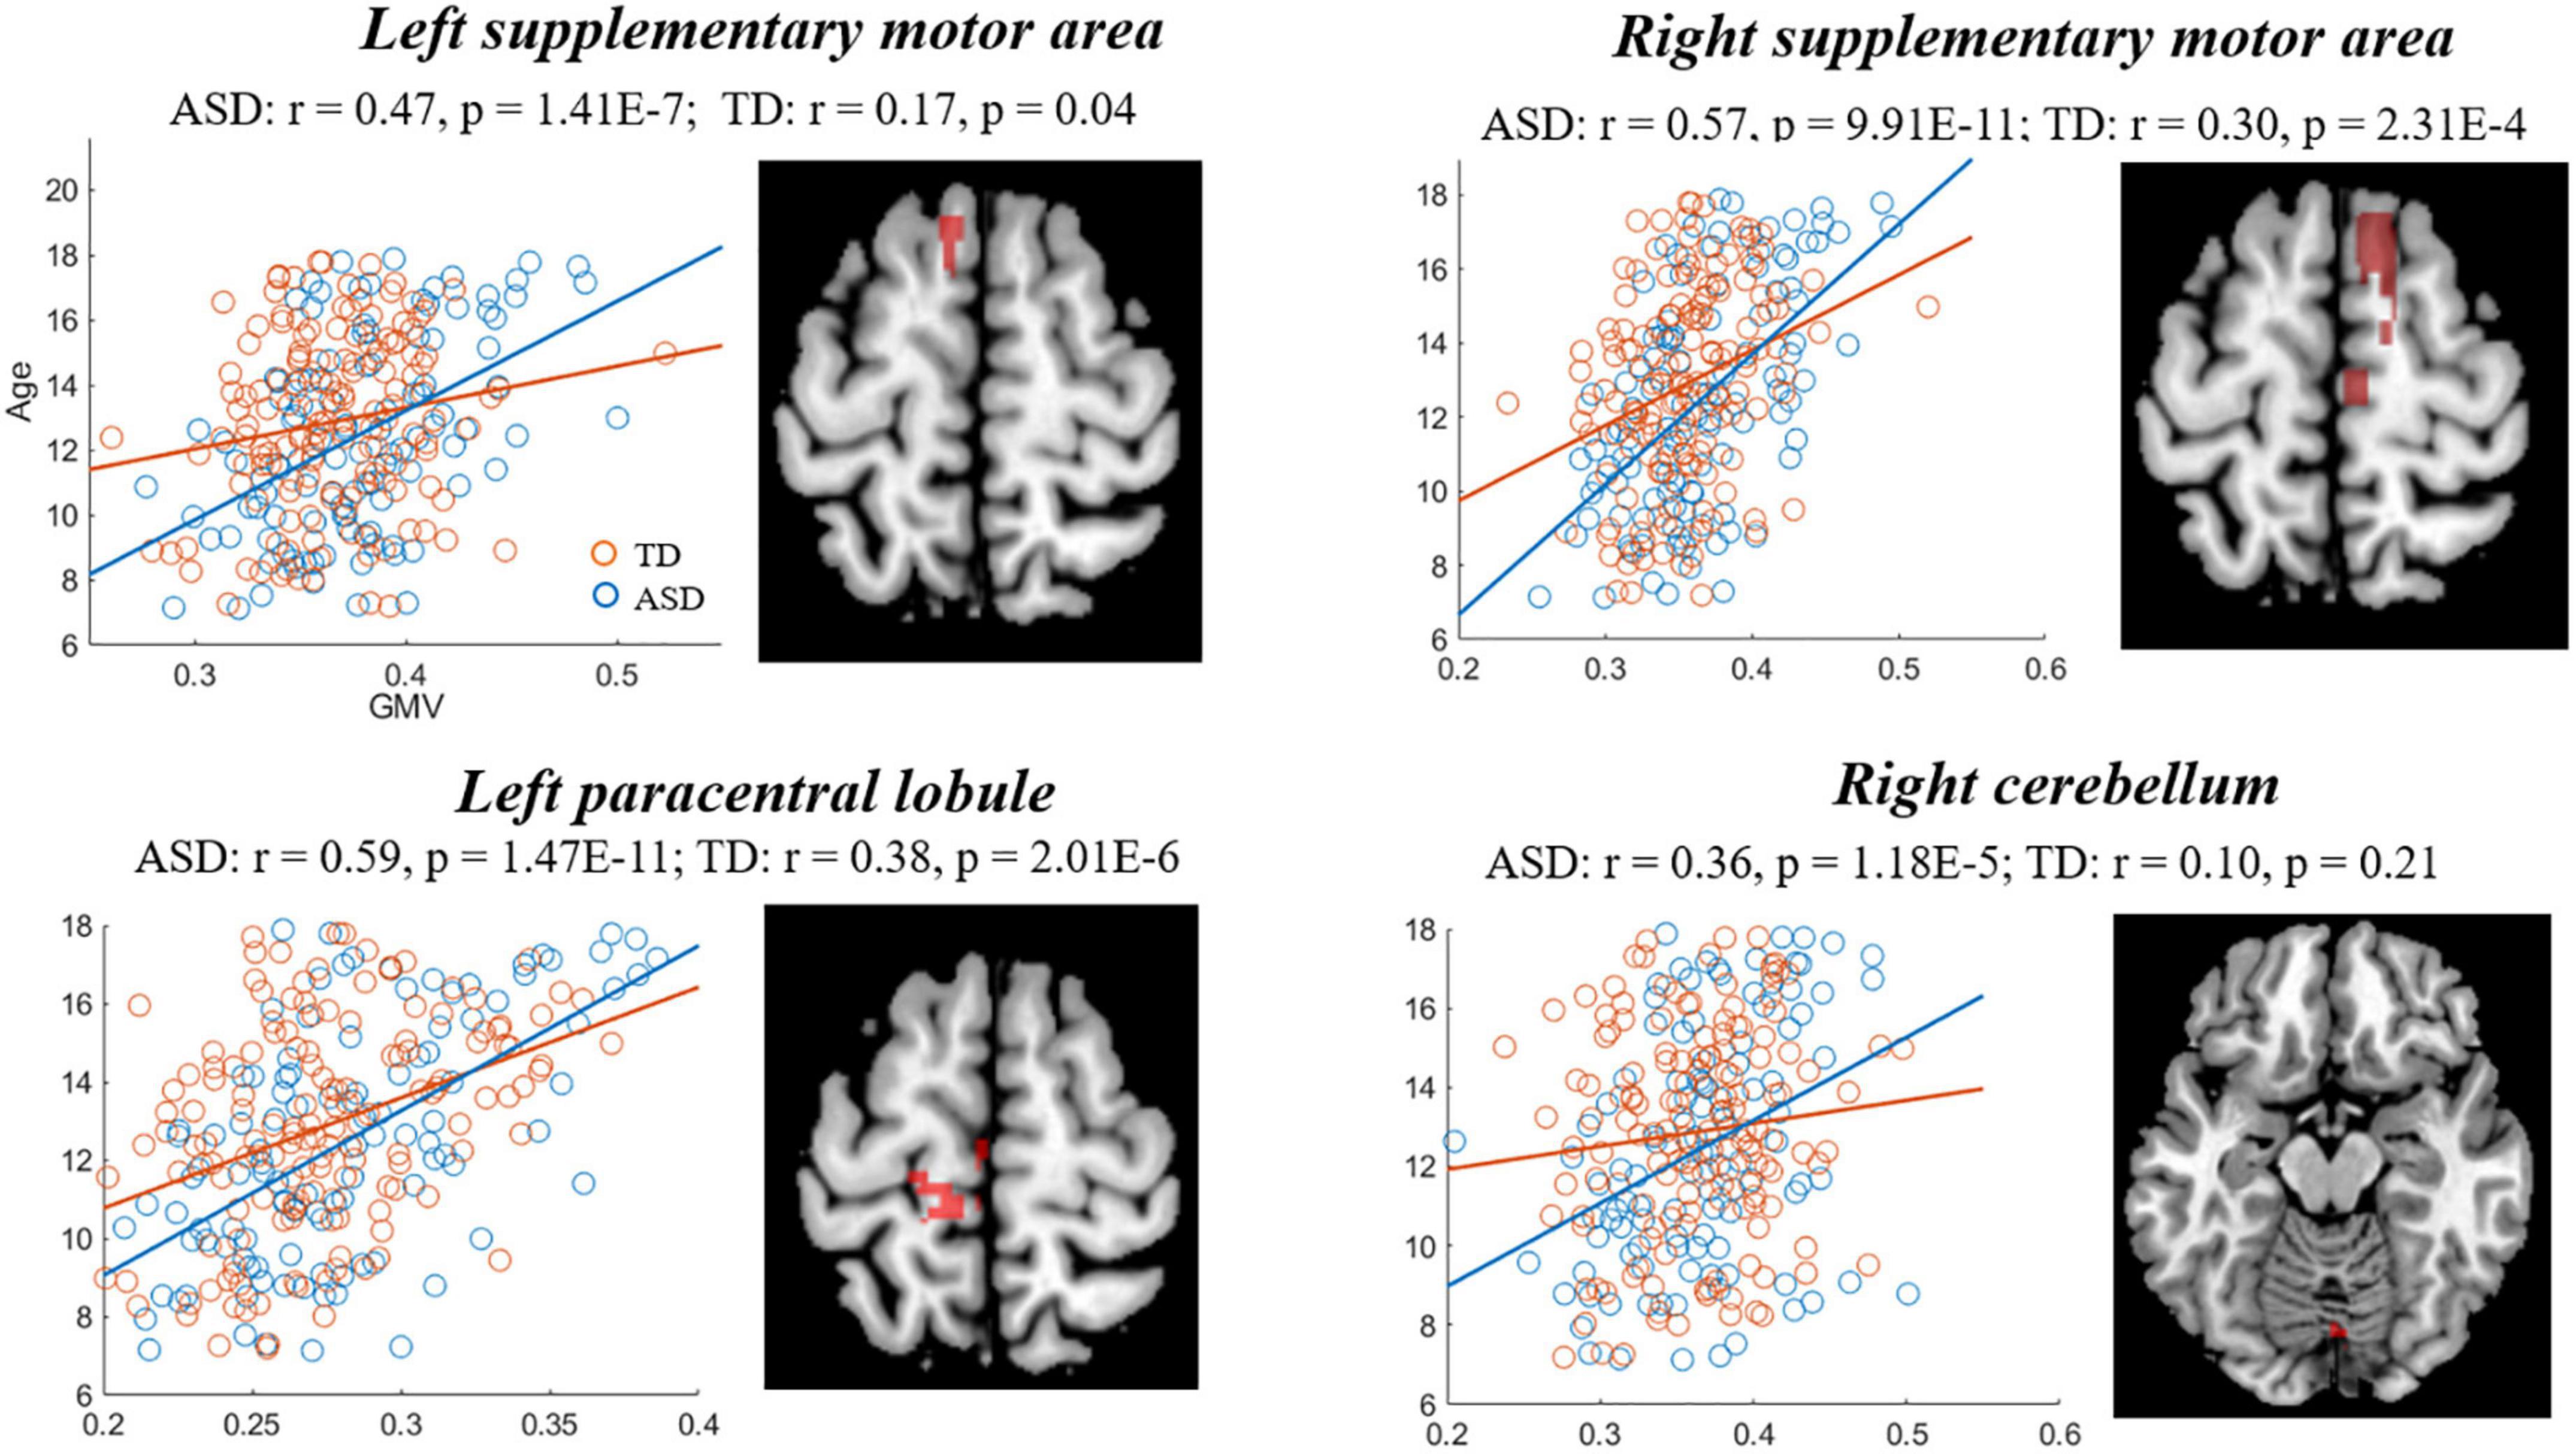
Figure 4. Correlations between gray matter volume (GMV) and age showing significant differences between autism spectrum disorder (ASD) and typically developing (TD). Blue and red represent the ASD and TD, respectively.
This study investigated the relationship between gray matter structure and age in children and adolescents with high-functioning ASD. We found that the gray matter structure of the bilateral PFC, left IPL and cerebellum in the ASD showed stronger correlations with age, whereas that of the right IPL showed a weaker correlation with age in the ASD compared with TD. These findings suggest that the structural development of gray matter in high-functioning ASD patients is abnormal during childhood and adolescence, which may be the underlying structural brain mechanism of patients’ dysfunctions.
The PFC is one of the abnormal brain regions most frequently reported in ASD patients and is the core brain region of the neural mechanism of theory of mind (the ability to recognize and predict the mind of others). It plays a key role in executive control, cognitive development, and behavioral processing (Li et al., 2021). A previous study found that, compared with normal controls, the GMV of the PFC in ASD patients aged 6–16 years increased with age (DeRamus and Kana, 2015). In another study of ASD patients aged 7–29 years, Lin et al. (2015) found that GMV in the PFC increased with age in ASD patients but decreased with age in healthy controls. Foster et al. (2015) found that children with ASD (mean age 12 years) showed increased GMV in the PFC relative to normally developing children. Consistent with these results, the present study also found stronger positive correlations between both GMV and GMD in the PFC and age in the ASD group compared with the TD group. Our recent study revealed that the GMD and GMV in the PFC were respectively correlated with the verbal communication scores and restricted and repetitive behavior scores on the ADI-R in the ASD group (Sun et al., 2022). Therefore, the differences between ASD and the TD group with regard to the relationship between gray matter structure and age in the PFC may suggest that executive control and communication dysfunctions of ASD patients were related to the abnormal development of this brain region.
The IPL is involved in sensory input, especially visual and spatial localization (Bremmer et al., 2001). Cheng et al. (2011) found that the GMV in bilateral IPL decreased with the increase of age in autistic adolescents, while it increased with the elevation of age in TD individuals. Scheel et al. (2011) revealed that the left IPL of autistic individuals was thinner than that of the TD individuals and tended to decrease with age. Moreover, a recent ASD study found that the GMV of IPL in early childhood (0–5 years old) increased with age and then gradually decreased with age (5–20 years old) (Levman et al., 2018). Another study found that the GMV in the right IPL in the autism group (6–12 years old) were smaller than those in the TD group, and the GMV in the left IPL in the autism group (13–18 years old) was larger than that in the TD group. These findings suggest that the gray matter changes of bilateral IPL in autistic individuals are correlated with age, which could be related to the involvement of the lateralization of this brain structure (Wang et al., 2022). Similarly, the present study found that the GMD of left IPL showed a stronger negative correlation with age, whereas that of right showed a weaker positive correlation with age in ASD group than TD group. Moreover, prior studies have demonstrated that the left IPL of ASD individuals was associated with the formation of social pathological networks (Venkataraman et al., 2015) and the reduction of GMV in right IPL in ASD patients was positively correlated with the severity of social disorders (Cheng et al., 2011). Therefore, the abnormal change in gray matter structure in the IPL with age may be the structural mechanism underlying the abnormal functions in social interaction, although no significant correlation between GMV/GMD in the IPL and social interaction score on the ADI-R was found in ASD patients in our recent study (Sun et al., 2022).
Additionally, increasing evidence has demonstrated that, in addition to motor function, the cerebellum is also involved in higher functions such as executive control and social cognition and is involved in the pathological mechanism of ASD (Tsatsanis et al., 2003; D‘Angelo and Casali, 2013). A previous study found that GMV in the cerebellum was negatively correlated with age in adults with ASD, and the reduction in GMV in this region was positively correlated with the severity of autism symptoms (Osipowicz et al., 2015; Yang et al., 2016). Moreover, studies have shown that GMV in the cerebellum increases with age in ASD patients during childhood (Hazlett et al., 2005) and adolescence (Traut et al., 2018) and is positively correlated with cognitive performance (Moore et al., 2017). Similarly, the present study found a stronger positive correlation between GMV in the right cerebellum and age in the ASD than TD groups, suggesting a overgrowth of the gray matter structure of the cerebellum in children and adolescents with ASD.
There are several limitations in the present study. First, the MRI data used in this study was scanned from multiple sites, and thus, we could not correct for the effect of the differences in scanning parameters, although we added the site as a covariate in our regression model. Second, our study was a cross-sectional design, so we could not directly capture the relationships between GMD/GMV and age. In the future, a single-site study with a large sample size is needed to validate our findings, and an ongoing longitudinal study will explore the development of gray matter structures with age in children and adolescents with ASD. Finally, the gender difference in GMV/GMD in ASD patients needs to be explored in the future.
In summary, the present study found that gray matter structure in the frontoparietal regions and cerebellum showed different correlations with age between the ASD and TD groups, suggesting that the structural abnormalities in these regions may be related to the neurobiological mechanism of ASD.
Publicly available datasets were analyzed in this study. This data can be found here: Autism Brain Imaging Data Exchange (ABIDE, http://fcon_1000.projects.nitrc.org/indi/abide/).
The studies involving human participants were reviewed and approved by the Local Ethics Committee at all sites from the Autism Brain Imaging Data Exchange (ABIDE) database. Written informed consent to participate in this study was provided by the participants or their legal guardian/next of kin.
FS designed and wrote the manuscript. YuC analyzed the data and wrote the manuscript. YH polished the language. JY collected the relevant literatures. YiC revised and improved the manuscript. All authors contributed to the article and approved the submitted version.
This work was supported by a grant sponsored by the Research Program of Zhejiang Federation of Humanities and Social Sciences Circles (2023N089).
The authors declare that the research was conducted in the absence of any commercial or financial relationships that could be construed as a potential conflict of interest.
All claims expressed in this article are solely those of the authors and do not necessarily represent those of their affiliated organizations, or those of the publisher, the editors and the reviewers. Any product that may be evaluated in this article, or claim that may be made by its manufacturer, is not guaranteed or endorsed by the publisher.
Baio, J., Wiggins, L., Christensen, D. L., Maenner, M. J., Daniels, J., Warren, Z., et al. (2018). Prevalence of autism spectrum disorder among children aged 8 years–autism and developmental disabilities monitoring network, 11 sites, United States, 2014. MMWR Surveill. Summ. 67, 1–23. doi: 10.15585/mmwr.ss6706a1
Braden, B. B., Smith, C. J., Thompson, A., Glaspy, T. K., Wood, E., Vatsa, D., et al. (2017). Executive function and functional and structural brain differences in middle-age adults with autism spectrum disorder. Autism Res. 10, 1945–1959. doi: 10.1002/aur.1842
Bremmer, F., Schlack, A., Duhamel, J.-R., Graf, W., and Fink, G. R. (2001). Space coding in primate posterior parietal cortex. Neuroimage 14, S46–S51. doi: 10.1006/nimg.2001.0817
Brugha, T. S., Spiers, N., Bankart, J., Cooper, S.-A., McManus, S., Scott, F. J., et al. (2016). Epidemiology of autism in adults across age groups and ability levels. Brit. J. Psychiatry 209, 498–503. doi: 10.1192/bjp.bp.115.174649
Cheng, Y., Chou, K., Fan, Y., and Lin, C. (2011). ANS: Aberrant neurodevelopment of the social cognition network in adolescents with autism spectrum disorders. PLoS One 6:e18905. doi: 10.1371/journal.pone.0018905
D‘Angelo, E., and Casali, S. J. (2013). Seeking a unified framework for cerebellar function and dysfunction: From circuit operations to cognition. Front. Neural Circuit 6:116. doi: 10.3389/fncir.2012.00116
DeRamus, T. P., and Kana, R. K. (2015). Anatomical likelihood estimation meta-analysis of grey and white matter anomalies in autism spectrum disorders. Neuroimage Clin. 7, 525–536. doi: 10.1016/j.nicl.2014.11.004
Dong, C., Wu, Q., Pan, Y., Yan, Q., Xu, R., and Zhang, R. (2021). Family resilience and its association with psychosocial adjustment of children with chronic illness: A latent profile analysis. J. Pediatr. Nurs. 60, e6–e12. doi: 10.1016/j.pedn.2021.02.010
Dong, H., Castellanos, F. X., Yang, N., Zhang, Z., Zhou, Q., He, Y., et al. (2020). Charting brain growth in tandem with brain templates at school age. Sci. Bull. 65, 1924–1934. doi: 10.1016/j.scib.2020.07.027
Foster, N. E., Doyle-Thomas, K. A., Tryfon, A., Ouimet, T., Anagnostou, E., Evans, A. C., et al. (2015). Structural gray matter differences during childhood development in autism spectrum disorder: A multimetric approach. Pediatr. Neurol. 53, 350–359. doi: 10.1016/j.pediatrneurol.2015.06.013
Hazlett, H. C., Poe, M., Gerig, G., Smith, R. G., Provenzale, J., Ross, A., et al. (2005). Magnetic resonance imaging and head circumference study of brain size in autism: Birth through age 2 years. Arch. Gen. Psychiatry 62, 1366–1376. doi: 10.1001/archpsyc.62.12.1366
Joseph, R. M., Tager-Flusberg, H., and Lord, C. (2002). Cognitive profiles and social-communicative functioning in children with autism spectrum disorder. J. Child Psychol. Psychiatry 43, 807–821. doi: 10.1111/1469-7610.00092
Levman, J., Vasung, L., MacDonald, P., Rowley, S., Stewart, N., Lim, A., et al. (2018). Regional volumetric abnormalities in pediatric autism revealed by structural magnetic resonance imaging. Int. J. Dev. Neurosci. 71, 34–45. doi: 10.1016/j.ijdevneu.2018.08.001
Li, C., Chen, L., and Xu, H. (2021). Resting-state functional brain imaging study of children with autism spectrum disorder of different genders. Chin. J. Neurol. 20, 188–195.
Lin, H., Ni, H., Lai, M., Tseng, W., and Gau, S. (2015). Regional brain volume differences between males with and without autism spectrum disorder are highly age-dependent. Mol. Autism 6, 1–18. doi: 10.1186/s13229-015-0022-3
Moore, D. M., D’Mello, A. M., McGrath, L. M., and Stoodley, C. J. (2017). The developmental relationship between specific cognitive domains and grey matter in the cerebellum. Dev. Cogn. Neurosci. 24, 1–11. doi: 10.1016/j.dcn.2016.12.001
Osipowicz, K., Bosenbark, D. D., and Patrick, K. E. (2015). Cortical changes across the autism lifespan. Autism Res. 8, 379–385. doi: 10.1002/aur.1453
Redcay, E., and Courchesne, E. J. (2005). When is the brain enlarged in autism? A meta-analysis of all brain size reports. Biol. Psychiatry 58, 1–9. doi: 10.1016/j.biopsych.2005.03.026
Rydzewska, E., Hughes-McCormack, L. A., Gillberg, C., Henderson, A., MacIntyre, C., Rintoul, J., et al. (2019). Age at identification, prevalence and general health of children with autism: Observational study of a whole country population. BMJ Open 9:e025904. doi: 10.1136/bmjopen-2018-025904
Scheel, C., Rotarska-Jagiela, A., Schilbach, L., Lehnhardt, F. G., Krug, B., Vogeley, K., et al. (2011). Imaging derived cortical thickness reduction in high-functioning autism: Key regions and temporal slope. Neuroimage 58, 391–400. doi: 10.1016/j.neuroimage.2011.06.040
Sun, F., Chen, Y., Gao, Q., and Zhao, Z. (2022). Abnormal gray matter structure in children and adolescents with high-functioning autism spectrum disorder. Psychiatry Res. Neuroimaging 27:111564. doi: 10.1016/j.pscychresns.2022.111564
Traut, N., Beggiato, A., Bourgeron, T., Delorme, R., Rondi-Reig, L., Paradis, A.-L., et al. (2018). Cerebellar volume in autism: Literature meta-analysis and analysis of the autism brain imaging data exchange cohort. Biol. Psychiatry 83, 579–588. doi: 10.1016/j.biopsych.2017.09.029
Tsatsanis, K. D., Rourke, B. P., Klin, A., Volkmar, F. R., Cicchetti, D., and Schultz, R. T. (2003). Reduced thalamic volume in high-functioning individuals with autism. Biol. Psychiatry 53, 121–129. doi: 10.1016/S0006-3223(02)01530-5
Van Rooij, D., Anagnostou, E., Arango, C., Auzias, G., Behrmann, M., Busatto, G. F., et al. (2018). Cortical and subcortical brain morphometry differences between patients with autism spectrum disorder and healthy individuals across the lifespan: Results from the ENIGMA ASD working group. Am. J. Psychiatry 175, 359–369. doi: 10.1176/appi.ajp.2017.17010100
Van Wijngaarden-Cremers, P., van Eeten, E., Groen, W. B., Van Deurzen, P. A., Oosterling, I. J., and Van der Gaag, R. J. (2014). Gender and age differences in the core triad of impairments in autism spectrum disorders: A systematic review and meta-analysis. J. Autism Dev. Disord. 44, 627–635.
Venkataraman, A., Duncan, J. S., Yang, D. Y.-J., and Pelphrey, K. A. (2015). An unbiased Bayesian approach to functional connectomics implicates social-communication networks in autism. Neuroimage Clin. 8, 356–366. doi: 10.1016/j.nicl.2015.04.021
Wang, H., Ma, Z., Xu, L., Yang, L., Ji, Z., Tang, X., et al. (2022). Developmental brain structural atypicalities in autism: A voxel-based morphometry analysis. Child Adolesc. Psychiatry Ment. Health 16:7. doi: 10.1186/s13034-022-00443-4
Yang, X., Si, T., Gong, Q., Qiu, L., Jia, Z., Zhou, M., et al. (2016). Brain gray matter alterations and associated demographic profiles in adults with autism spectrum disorder: A meta-analysis of voxel-based morphometry studies. Aust. N. Z. J. Psychiatry 50, 741–753. doi: 10.1177/0004867415623858
Zablotsky, B., Black, L. I., Maenner, M. J., Schieve, L. A., and Blumberg, S. J. (2015). Estimated prevalence of autism and other developmental disabilities following questionnaire changes in the 2014 national health interview survey. Nat. Health Stat. Rep. 87, 1–21.
Keywords: autism spectrum disorder (ASD), gray matter structure, children and adolescents, age, regression analysis
Citation: Sun F, Chen Y, Huang Y, Yan J and Chen Y (2023) Relationship between gray matter structure and age in children and adolescents with high-functioning autism spectrum disorder. Front. Hum. Neurosci. 16:1039590. doi: 10.3389/fnhum.2022.1039590
Received: 08 September 2022; Accepted: 15 December 2022;
Published: 06 January 2023.
Edited by:
Zhe Zhang, Hangzhou Normal University, ChinaReviewed by:
Lanxin Ji, New York University, United StatesCopyright © 2023 Sun, Chen, Huang, Yan and Chen. This is an open-access article distributed under the terms of the Creative Commons Attribution License (CC BY). The use, distribution or reproduction in other forums is permitted, provided the original author(s) and the copyright owner(s) are credited and that the original publication in this journal is cited, in accordance with accepted academic practice. No use, distribution or reproduction is permitted which does not comply with these terms.
*Correspondence: Yihong Chen,  Y2hlbnloX3hzcm1AMTYzLmNvbQ==
Disclaimer: All claims expressed in this article are solely those of the authors and do not necessarily represent those of their affiliated organizations, or those of the publisher, the editors and the reviewers. Any product that may be evaluated in this article or claim that may be made by its manufacturer is not guaranteed or endorsed by the publisher.
Research integrity at Frontiers
Learn more about the work of our research integrity team to safeguard the quality of each article we publish.