
94% of researchers rate our articles as excellent or good
Learn more about the work of our research integrity team to safeguard the quality of each article we publish.
Find out more
ORIGINAL RESEARCH article
Front. Hum. Neurosci. , 23 December 2020
Sec. Brain Imaging and Stimulation
Volume 14 - 2020 | https://doi.org/10.3389/fnhum.2020.598435
This article is part of the Research Topic Advanced Neuroimaging Methods in Brain Disorders View all 20 articles
 Ayushe A. Sharma1,2,3*
 Rodolphe Nenert3,4
 Christina Mueller1
 Andrew A. Maudsley5
 Jarred W. Younger1
 Jerzy P. Szaflarski2,3,4,6
Background: Magnetic resonance spectroscopic imaging (MRSI) is a neuroimaging technique that may be useful for non-invasive mapping of brain temperature (i.e., thermometry) over a large brain volume. To date, intra-subject reproducibility of MRSI-based brain temperature (MRSI-t) has not been investigated. The objective of this repeated measures MRSI-t study was to establish intra-subject reproducibility and repeatability of brain temperature, as well as typical brain temperature range.
Methods: Healthy participants aged 23–46 years (N = 18; 7 females) were scanned at two time points ~12-weeks apart. Volumetric MRSI data were processed by reconstructing metabolite and water images using parametric spectral analysis. Brain temperature was derived using the frequency difference between water and creatine (TCRE) for 47 regions of interest (ROIs) delineated by the modified Automated Anatomical Labeling (AAL) atlas. Reproducibility was measured using the coefficient of variation for repeated measures (COVrep), and repeatability was determined using the standard error of measurement (SEM). For each region, the upper and lower bounds of Minimal Detectable Change (MDC) were established to characterize the typical range of TCRE values.
Results: The mean global brain temperature over all subjects was 37.2°C with spatial variations across ROIs. There was a significant main effect for time [F(1, 1,591) = 37.0, p < 0.0001] and for brain region [F(46, 1,591) = 2.66, p < 0.0001]. The time*brain region interaction was not significant [F(46, 1,591) = 0.80, p = 0.83]. Participants' TCRE was stable for each ROI across both time points, with ROIs' COVrep ranging from 0.81 to 3.08% (mean COVrep = 1.92%); majority of ROIs had a COVrep <2.0%.
Conclusions: Brain temperature measurements were highly consistent between both time points, indicating high reproducibility and repeatability of MRSI-t. MRSI-t may be a promising diagnostic, prognostic, and therapeutic tool for non-invasively monitoring brain temperature changes in health and disease. However, further studies of healthy participants with larger sample size(s) and numerous repeated acquisitions are imperative for establishing a reference range of typical brain TCRE, as well as the threshold above which TCRE is likely pathological.
Neuroinflammation is increasingly implicated in the initiation and maintenance of a number of neurodegenerative diseases, including multiple sclerosis, Alzheimer's Disease, and epilepsy (Lucas et al., 2006; Amor et al., 2010; Maroso et al., 2010). In these disease states, neuroinflammatory cells (e.g., microglia) do not return to quiescence and instead become chronically activated, ultimately propelling a structural, functional, and biochemical neurodegenerative state (Devinsky et al., 2013; Albrecht et al., 2016; Chen et al., 2016). Elucidating what drives and sustains neuroinflammation is a critical goal in the field, especially in the disease states where chronic, low-level neuroinflammatory phenomena result in negative consequences. For example, as demonstrated by findings from studies of animal models of epilepsy and resected human epileptic tissue, sustained neuroinflammation causes chronic hyperexcitability, lower seizure threshold, and neuronal death (Aronica et al., 2010; Maroso et al., 2010; Ravizza et al., 2011; Vezzani and Friedman, 2011; Vezzani et al., 2019). A neuroimaging-based biomarker of neuroinflammation may allow tracking disease progression, treatment response, and associated comorbidities and cognitive impairments; such a tool may even identify a way to prevent these phenomena in the first place (Sharma and Szaflarski, 2020).
Structural magnetic resonance imaging (sMRI) is often considered the gold-standard for pinpointing neurological pathophysiology, but is frequently inadequate in localizing focal tissue abnormalities. For example, in treatment-resistant epilepsy patients, surgical resection of the epileptogenic zone is the only approach that can grant seizure freedom (Noe et al., 2013; Jehi, 2018). Surgical planning is straightforward in patients with sMRI-detectable lesions, but challenging in the 20–30% patients who are MR-negative (Salmenpera et al., 2007; Jobst and Cascino, 2015; Muhlhofer et al., 2017). Moreover, patients with sMRI-detectable lesions experience 2.5–2.9 times better surgical outcomes than those with normal sMRIs (Salmenpera et al., 2007; Giorgio and De Stefano, 2010; Téllez-Zenteno et al., 2010; Finke, 2018; Alberts et al., 2020; Sharma and Szaflarski, 2020). Despite sMRI's capacity to pinpoint major structural abnormalities (e.g., large ischemic lesions), the data demonstrate its diminished sensitivity and specificity for detecting the smaller, more focalized neuroinflammatory phenomena (Barr et al., 1997; Kälviäinen and Salmenperä, 2002; Blümcke et al., 2012; Sharma and Szaflarski, 2020). Therefore, there is a need to identify a sensitive and specific in vivo biomarker of neuroinflammatory pathophysiology. Other currently available approaches are invasive and/or costly (e.g., lumbar puncture, positron emission tomography [PET]). Further, PET relies on the use of radioisotopes that may localize key neuroinflammatory cells, but variable quantitative accuracy, limited bioavailability, and unclear specificity of ligand-target binding are critical gaps that limit its clinical utility (Vivash and OBrien, 2016; Best et al., 2019; Dickstein et al., 2019; Ghadery et al., 2019; Hamelin et al., 2019; Sharma and Szaflarski, 2020). Thus, the question remains: how can we non-invasively localize neuroinflammation in a living human brain?
Since the focal inflammatory response generates focal changes in temperature, brain temperature mapping may be a promising proxy for diagnosing and monitoring the progression of neurological diseases characterized by metabolic and homeostatic disruptions (Ene Mrozek et al., 2012; Wang et al., 2014). Brain temperature correlates well with systemic temperature during healthy states, generally measuring 0.5–1°C higher than core body temperature (Rossi et al., 2001; Wang et al., 2014). During pathological processes such as neuroinflammation, increased metabolic demands overwhelm the brain's already limited cooling mechanisms and drive brain temperature 1–2°C higher than core body temperature (Rossi et al., 2001). As neuroinflammatory phenomena such as leukocyte extravasation and accumulation, blood brain barrier permeability, and even cerebral edema increase, so does the brain temperature (Dietrich et al., 1996, 1998; Chatzipanteli et al., 2000; Sharma and Hoopes, 2003).
Of the ways we can measure brain temperature, magnetic resonance spectroscopic imaging (MRSI) is the most non-invasive and economical. Brain temperature can be derived from MRSI data by calculating the frequency difference between the temperature-sensitive water peak and one or more metabolite peaks that are temperature-insensitive (Maudsley et al., 2017). MRSI-based brain temperature (MRSI-t) measurement correlates well with the recordings of implanted probes, as indicated by phantom and experimental studies (Cady et al., 1995; Corbett et al., 1995). Brain temperature has already been approximated using MRSI in a number of contexts: healthy adults, ischemic stroke, neonatal encephalopathy, myalgic encephalitis/chronic fatigue syndrome, and rheumatoid arthritis (Maudsley et al., 2010; Mueller et al., 2019, 2020; Zhang et al., 2020). The majority of previous studies have performed MRSI-t measurements only at a single brain location or limited spatial region, but it has recently been demonstrated that the measurement can be obtained using a volumetric echo-planar spectroscopic imaging (EPSI) acquisition to create temperature maps over a large fraction of the brain volume (Maudsley et al., 2006, 2017). Limited data are available on the reproducibility and reliability of MRSI-t using volumetric EPSI. Previous work has established intra-subject reproducibility of serial EPSI acquisitions in a limited sample (N = 2) at 5 1-week intervals, as well as that of successive EPSI acquisitions (2 per session) in a larger sample (N = 32) (Maudsley et al., 2010; Veenith et al., 2014). However, the reproducibility and repeatability of MRSI-t using volumetric EPSI has only been established in a small sample (N = 10), with 3 acquisitions separated by 1-week intervals (Zhang et al., 2020). Thus, the available data do not mirror a real-life clinical situation in which participants are typically exposed to a treatment/intervention for 12–16 weeks before a second measurement is collected.
To date, no study has investigated whether intra-subject reproducibility is maintained in a larger sample of healthy control participants with longer duration between scans. Additionally, all previous studies have only reported the coefficient of variation (COV) and intraclass correlation coefficients as measures of reproducibility and repeatability; these data are useful, but the exact boundary at which a given region's brain temperature is normal vs. above-normal (i.e., areas of focal neuroinflammation or other pathophysiological phenomena) remains uncertain (Maudsley et al., 2010; Zhang et al., 2020). Before MRSI-t can be used as a clinical tool for in vivo assessment of neuroinflammation, we must determine whether MRSI-based brain temperature estimates are reliable and reproducible over typical study periods. In addition to establishing bounds of normal global and region-level brain temperature, it is critical that we determine the bounds at which brain temperature is above-normal in each region. The objective of this study was to establish intra-subject reproducibility and repeatability of brain temperature derivations in healthy participants scanned twice, ~12 weeks apart. In addition to establishing typical mean brain temperature across regions, we aimed to define the bounds of typical vs. atypical (i.e., possibly abnormal) brain temperature by calculating region-level measures of Minimum Detectable Change (MDC). We hypothesized that mean brain temperature would range from 37.0 to 37.5°C. We also hypothesized that MDC would indicate brain temperatures to be atypical if ≥ 0.5°C above mean brain temperature.
Healthy adult participants were recruited from the local area via word of mouth and IRB-approved study flyers. Interested participants contacted study personnel via phone or email. Participants were scheduled for their first study visit pending a phone screen for inclusion criteria and MR compatibility. The primary inclusionary criteria were: (1) age of 18–65 years, (2) no history of neurological disease or injury (e.g., traumatic brain injury), (3) ability to undergo MRI at 3-Tesla (e.g., no metal implants or claustrophobia), and (4) negative urine pregnancy test if female of childbearing potential. Of importance is that participants' self-reported history of neurological disease or injury was collected during phone screening; no neurological examinations were performed, and medical records were not reviewed unless patient history was questionable. Written informed consent was obtained from all participants before collecting any clinical measures or imaging data.
Participants completed two study visits scheduled at the University of Alabama at Birmingham (UAB) Civitan International Neuroimaging Laboratory housed in the UAB Highlands Hospital. For most participants (N = 14), visits were scheduled 10–12 weeks apart; for the last 4 participants recruited, the second study visit was delayed by 5–7 weeks due to COVID-19 research restrictions. The mean overall time between visits was 11.33 ± 2.59 weeks. During each study visit, participants completed 2 self-report questionnaires: the Hospital Anxiety and Depression Scale (HADS) and the Profile of Mood States (POMS) (Zigmond and Snaith, 1983; McNair et al., 1989). Prior to imaging, tympanic temperature measurements were collected using a Braun Pro 4000 ThermoScan aural thermometer; this measure was included due to evidence that tympanic temperature can reliably reflect brain temperature and to make sure there were no individual temperature elevations that could affect brain temperature measurements (Mariak et al., 2003).
Participants were scanned on a 3T Siemens Magnetom Prisma scanner using a 20-channel head coil. T1-weighted structural images were acquired using a magnetization-prepared rapid gradient echo sequence with the following parameters: repetition time (TR) = 2,400 ms; echo time (TE) = 2.22 ms; flip angle = 8°; 208 slices (0.8 mm thick); matrix = 256 × 256.
Whole-brain metabolite MRSI data were collected using a 3-dimensional EPSI sequence with spin-echo excitation with the following parameters: TR1 = 1,500 ms (TR for metabolite data), TR2 = 511 ms (TR for water reference data), TE = 17.6 ms, lipid inversion-nulling with TI = 198 ms; FOV = 280 × 280 × 180 mm, sampled with 50 × 50 × 18 k-space points. A separate MRSI dataset was acquired using an interleaved acquisition without water suppression and served as the water reference signal; with the exception of TR, these data were acquired with identical spatial and spectral parameters as the metabolite MRSI data. Spectral sampling used 1,000 sample points with 2,500 Hz spectral width; with resampling and combination of the odd and even echoes, this was reduced to 500 points and 1,250 Hz (Metzger and Hu, 1997). Prior to MRSI data acquisition, we performed off-resonance frequency correction, and shimming to reduce magnetic field inhomogeneities. Shimming consisted of a 3D automatic shim by the scanner, followed by an interactive shim to achieve a peak FWHM ≤ 30 Hz (Zeinali-Rafsanjani et al., 2018).
We also acquired 2D arterial spin labeling (ASL) perfusion scans to rule out perfusion-related contributions to brain temperature and metabolite concentration measurements (Zhu et al., 2009; Ene Mrozek et al., 2012; Rango et al., 2015). ASL data were acquired using a Proximal Inversion with Control of Off-Resonance Effects (PICORE) labeling scheme for background suppression. Sixty pairs of label/control ASL images were collected in the axial direction at a single inversion time of 1,800 ms, TR = 2500 sms, TE = 16.18 ms, 12 slices, 4 × 4 × 10 mm voxels.
Image reconstruction and spectral processing was completed within the Metabolite Imaging and Data Analysis System (MIDAS) software package (Maudsley et al., 2006). Raw metabolite and water MRSI data were reconstructed with interpolation to 50 × 50 × 36 voxels and spatial smoothing. This yielded 5.6 × 5.6 × 5 mm voxels, with a voxel volume of ~0.1568 cm3. Processing included B0 inhomogeneity correction and formation of individual metabolite maps using a parametric spectral modeling method to quantify relative peak areas and resonance frequencies for resonances of N-acetylaspartate (NAA), creatine (tCre), choline (tCho), and water, as described by Maudsley et al. (2006). For repeat studies, each MRSI dataset was spatially registered to the T1-weighted image of the first study. Voxel-level brain temperature was then calculated using the chemical shift difference between the creatine and water resonances (ΔH20−CRE; Figure 1), according to the equation TCRE = −102.61(ΔH20−CRE) + 206.1°C (Maudsley et al., 2017). The creatine resonance was selected for the frequency reference as it is broadly distributed within the cells and, as such, is less sensitive to cellular-level changes of magnetic susceptibility with neuronal orientation (Maudsley et al., 2017). We provide an example of raw MRSI metabolite and temperature data in Figure 2. The resultant MRSI-t maps were then spatially registered to Montreal Neurological Institute (MNI) template at 2 mm isotropic voxel resolution, which was also aligned with a modified version of the Automated Anatomical Labeling (AAL) atlas that delineated 47 regions of interest (ROIs) (Tzourio-Mazoyer et al., 2002; Maudsley et al., 2017).
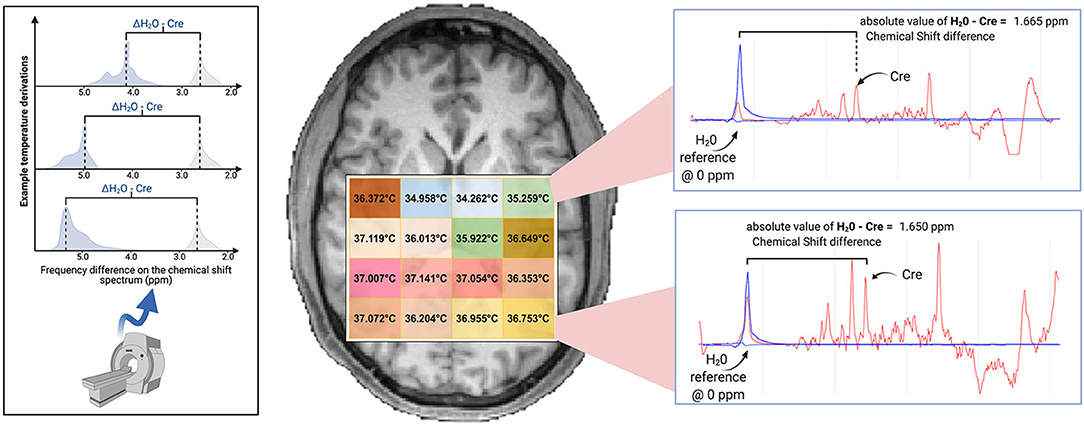
Figure 1. Brain temperature can be non-invasively derived from volumetric magnetic resonance spectroscopic imaging (MRSI) data by calculating the frequency difference between the temperature-sensitive water peak and one or more metabolite peaks that are temperature-insensitive (left*). When using creatine as the reference, voxel-level brain temperature can be calculated according to the following equation: TCRE = −102.61(ΔH20−CRE) + 206.1°C, ΔH20−CRE = chemical shift difference between the creatine and water resonances. Example TCRE calculations are provided for a participant's single tissue slice (right). Representative spectra illustrate ΔH20−CRE derivations, with plots depicting a water-suppressed metabolite spectrum (red line), with an overlay that indicates the location of the reference water signal (blue line). Spectral plots were created within the Metabolite Imaging and Data Analysis System (MIDAS) software package, and the figure was created using BioRender. *Adapted from Dehkharghani et al. (2015).
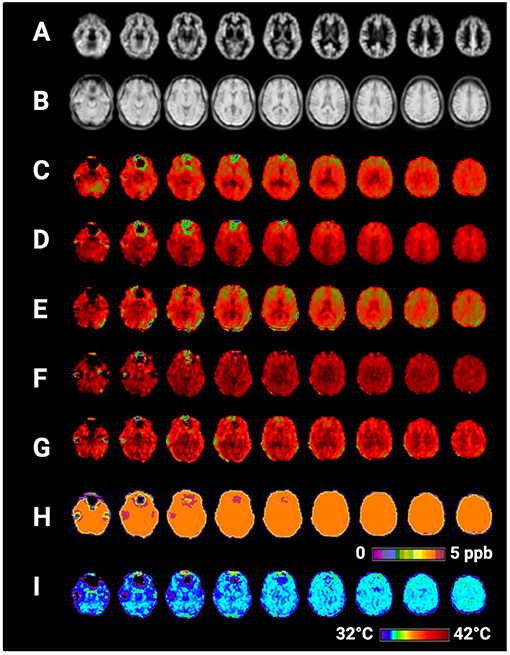
Figure 2. Selected axial slices showing raw metabolite and brain temperature maps derived from a single participant's volumetric magnetic resonance spectroscopic imaging data (MRSI) data. Shown are (A) normalized gray matter volumes, (B) water reference signal, (C) total creatine (creatine + phosphocreatine), (D) total choline, (E) NAA (N-acetylaspartate), (F) myo-inositol, (G) Glx (combined signal from glutamine and glutamate), (H) frequency difference between water and creatine (ΔH20−CRE), (I) brain temperature calculated according to the equation TCRE = −102.61(ΔH20−CRE) + 206.1°C. Raw MRSI data were visualized within the Metabolite Imaging and Data Analysis System (MIDAS) software package, and the figure was created using BioRender.
Following initial processing, the atlas was mapped into subject space using an inverse spatial transformation algorithm within the MIDAS Project Review and Analysis (PRANA) module (Maudsley et al., 2006). The Map Integrated Spectrum (MINT) module within MIDAS was then used to compute mean estimates of metabolite concentrations, metabolite ratios, and brain temperature within each of the atlas-defined brain regions. Spectral integration was limited to voxels that had a fitted metabolite linewidth between 2 and 12 Hz, and voxels were excluded if they had an outlying values of 2.5 times the standard deviation of all valid voxels in the image (Maudsley et al., 2006).
ASL data were processed using ASLtbx batch scripts with Statistical Parametric Mapping (SPM12; http://www.fil.ion.ucl.ac.uk) running in MatLab R2019b (The MathWorks, Inc., Natick, MA, USA) (Wang et al., 2008). Images were motion-corrected and smoothed with a 6 mm full-width-at-half-maximum (FWHM) Gaussian kernel to diminish motion artifacts and decrease noise for subsequent image subtraction. Cerebral blood flow (CBF) was quantified in ml/100 g/min using simple subtraction between each tag/control pair (120 smoothed volumes, 60 pairs). Each participant's mean CBF maps were then 1) registered to high-resolution structural space with affine registration, followed by 2) non-linear registration to MNI space.
Descriptive statistics and correlation analyses were conducted in IBM SPSS Version 26.0 (www.ibm.com/products/spss-statistics). Reproducibility of MRSI-t based TCRE was evaluated using the coefficient of variation for repeated measures (COVrep) (Shechtman, 2013). Reliability was evaluated with the Standard Error of Measurement (SEM = square root of the MSERROR term from 2-way mixed ANOVA used to compute Cronbach's Alpha) (Weir, 2005). Minimal Detectable Change (MDC) was then calculated from SEM to provide a clinically meaningful basis for evaluating TCRE changes over repeated measures. Standard MDC was calculated at the 68th confidence interval (CI) (Weir, 2005). To investigate temporal and spatial variation in TCRE, we performed a linear mixed effects analysis using GraphPad Prism version 8.0 for Mac (GraphPad Software, La Jolla, CA, USA, www.graphpad.com).
In a secondary analysis, the relationship between TCRE and brain metabolites and/or metabolite ratios implicated in neuroinflammatory disease was assessed. Metabolites were quantified within MIDAS as previously described, with metabolite concentrations corrected in reference to water and CSF percentage (Maudsley et al., 2009; Lecocq et al., 2015; Zhang et al., 2020). Since quantification did not account for metabolite and reference relaxation, our analyses were based on metabolite values in institutional units (I.U.) (Kreis et al., 1993; Maudsley et al., 2009). Metabolites of interest included myo-inositol, choline, NAA, and the combined signal of glutamine and glutamate (Glx) (Oz et al., 2014). Myo-inositol (MI) is a glial marker, with increased levels indicating glial activation or proliferation seen in neuroinflammation (Haris et al., 2011). Choline (total choline, tCho) is expressed in cell membranes, with increased levels indicating high cell turnover during inflammatory processes (Oz et al., 2014). NAA indicates neuronal health, with lower values representing axonal loss (Moffett et al., 2007; Oz et al., 2014). Due to evidence of creatine (total creatine, tCre) as a reference metabolite, metabolites were also evaluated on the basis of their ratios with tCre (Maudsley et al., 2017). Spearman's rho (rs) correlation coefficients were calculated between TCRE, each metabolite ratio of interest, and tympanic temperature using a two-tailed threshold of p < 0.05. Variables with rs >|0.5| were evaluated as predictors of TCRE in a multiple regression model. Independent samples t-tests assessed hemispheric (right vs. left) differences in region-level TCRE. Independent samples t-tests contrasting sex differences in global and region-level TCRE were planned but not performed due to unequal sex distribution in the final dataset. Data quality was evaluated on the basis of (1) number of accepted voxels (%) following processing and (2) spectral linewidth.
Paired samples t-tests of participants' mean CBF maps contrasted cerebral perfusion between the two time points. This served as a measure of whether brain temperature differences—if present—could be attributed to perfusion differences.
Twenty-one participants were recruited; 18 completed all study procedures and were included in the analyses (N = 7 females). The mean age was 30.39 ± 7.47 years (range 23–46 years). Descriptive statistics for study measures of temperature, blood flow, and inflammatory metabolite ratios were tabulated for both time points; global within-subject differences from time1 to time2 were computed with repeated measures t-tests (Table 1). The repeated measures t-tests revealed significant increase in HADS sub-scale Depression scores [t(17) = −4.12, p = 0.001], though this change was not clinically significant and scores remained in the normal range (0–7) for both time points (Zigmond and Snaith, 1983). Additionally, there was a global reduction in mean NAA/tCre, t(17) = 2.19, p = 0.04. Mean TCRE was 37.00°C at time1 and 37.40°C at time2, with a global mean TCRE of 37.2°C across both time points. Box-and-whisker plots of TCRE calculated at both time points are provided in Figure 3.
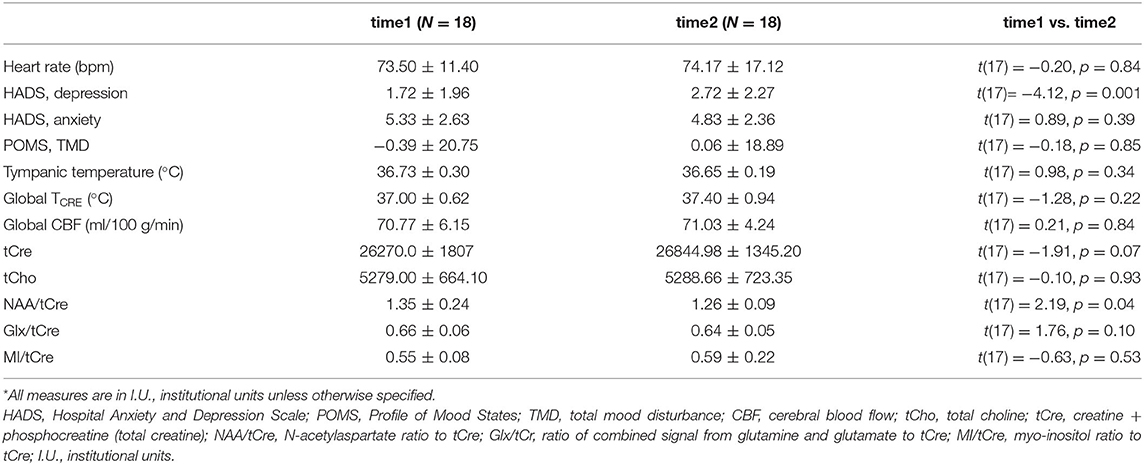
Table 1. Descriptive statistics for clinical and imaging-derived measures of temperature, blood flow, average metabolite values (in institutional units), and metabolite ratios.
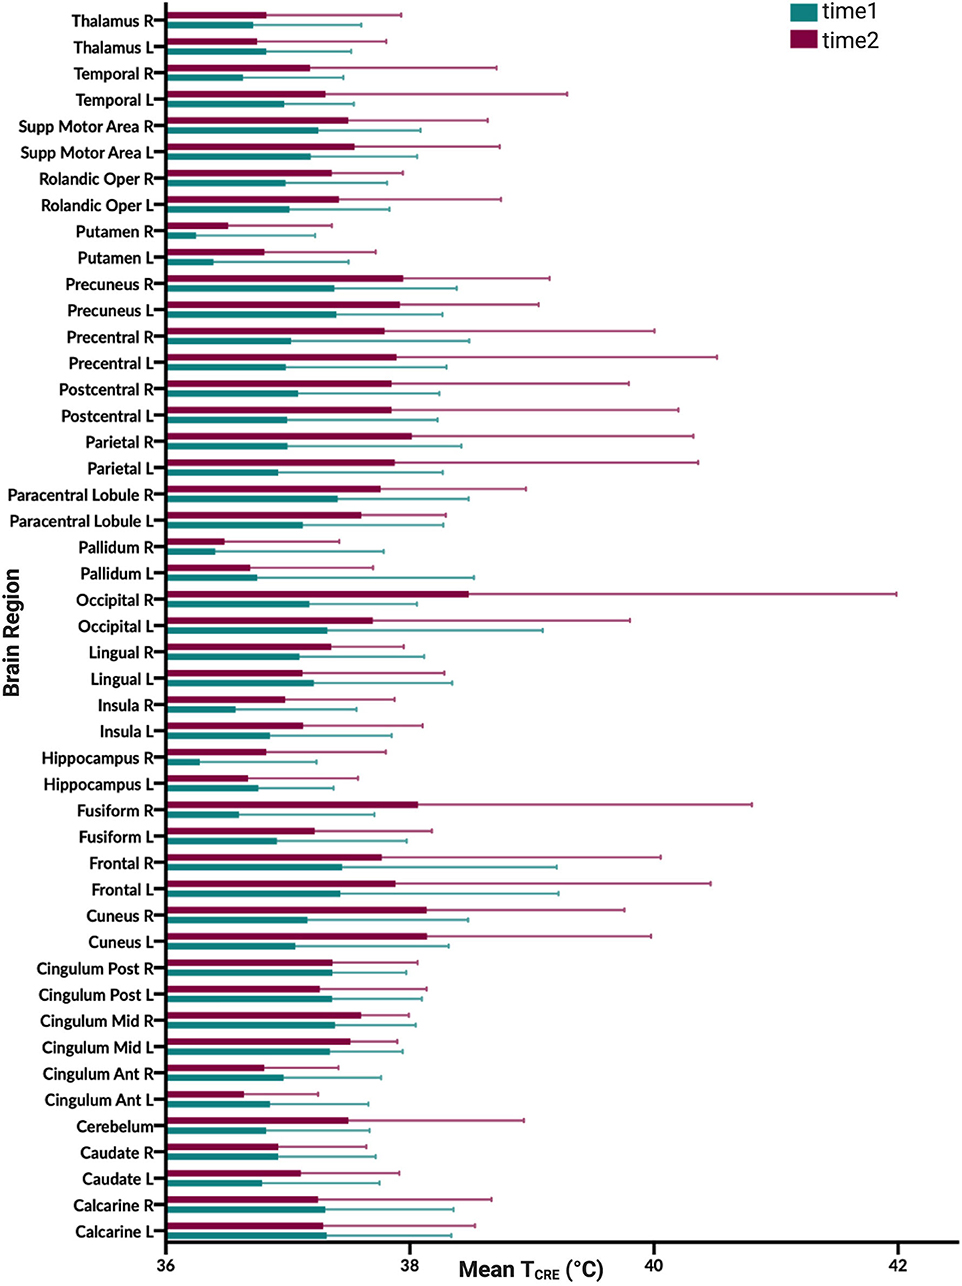
Figure 3. Graphical illustration of mean brain temperature for time1 (mean 37.0°C) and time2 (37.4°C) across 47 regions of interest (ROIs) delineated by the modified Automated Anatomical Labeling (AAL) atlas. Brain temperature was non-invasively derived from volumetric magnetic resonance spectroscopic imaging (MRSI) data, using the following equation: TCRE = −102.61(ΔH20−CRE) + 206.1°C, where ΔH20−CRE = chemical shift difference between the creatine and water resonances. For each brain region, colored bars (time1, teal; time2, burgundy), reflect the mean TCRE; whiskers indicate range of TCRE values beyond the mean. The mean global brain temperature over all subjects was 37.2°C with spatial variations across regions (37.57–41.49°C). There was a significant main effect for time [F(1, 1,591) = 37.0, p < 0.0001] and for brain region [F(46, 1,591) = 2.66, p < 0.0001]. The time*brain region interaction was not significant [F(46,1,591) =0.80, p = 0.83].
The COVrep, our measure of reproducibility, ranged from 0.81 to 3.08% (mean 1.92%) across 47 ROIs, with 30 ROIs having a COVrep <2.0%. SEM ranged from 0.365 to 2.713 (mean 1.295 ± 0.647) (Table 2). The highest COVrep (3.08%) was in the R Fusiform Gyrus. Mean brain temperature was the lowest in the R and L putamen, R and L pallidum, R and L hippocampus, L and R anterior cingulum, R and L thalamus, and R insula (Table 2). Mean brain temperature was highest in the R occipital lobe, L and R precuneus, R and L frontal lobes, and R and L cuneus.
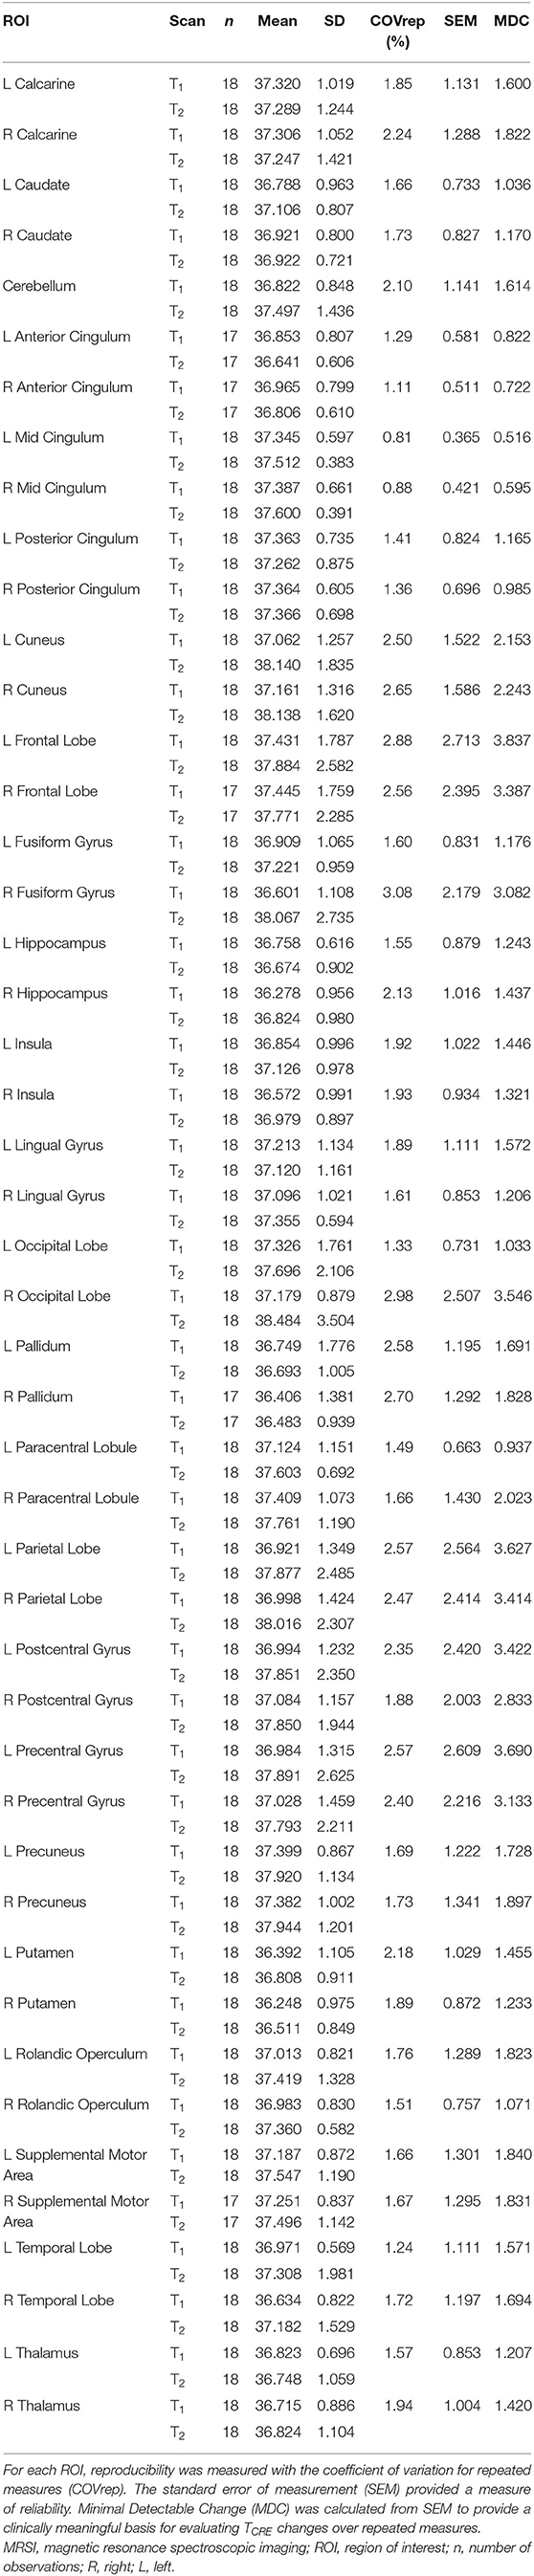
Table 2. Mean MRSI-based brain temperature (TCRE) in 47 ROIs for both time points time1 (T1) and time2 (T2), their standard deviations (SD), and corresponding reproducibility and reliability statistics.
Based on the MDC, the TCRE at which we consider brain temperature as atypical varies across brain regions (Table 2, Figure 4). When considering MDC computations at the 68th CI, the upper bounds of brain temperature indicating above-typical TCRE ranged from 37.57 to 41.49°C (mean 39.03 ± 1.14°C); the lower bounds indicating below-typical TCRE ranged from 33.74 to 36.91°C (mean 35.37 ± 0.80°C). According to MDC calculations, the TCRE at which values are considered above-typical were highest in the following regions: R and L frontal lobes (41.49, 40.99°C), R occipital lobe (41.38°C), L precentral gyrus (41.13°C), and L and R parietal lobes (40.92, 41.03°C) (Table 2, Figure 4). In addition to assessing these ROI-based measures, brain temperature maps visualized brain temperature changes within participants from time1 to time2 (Figure 5).
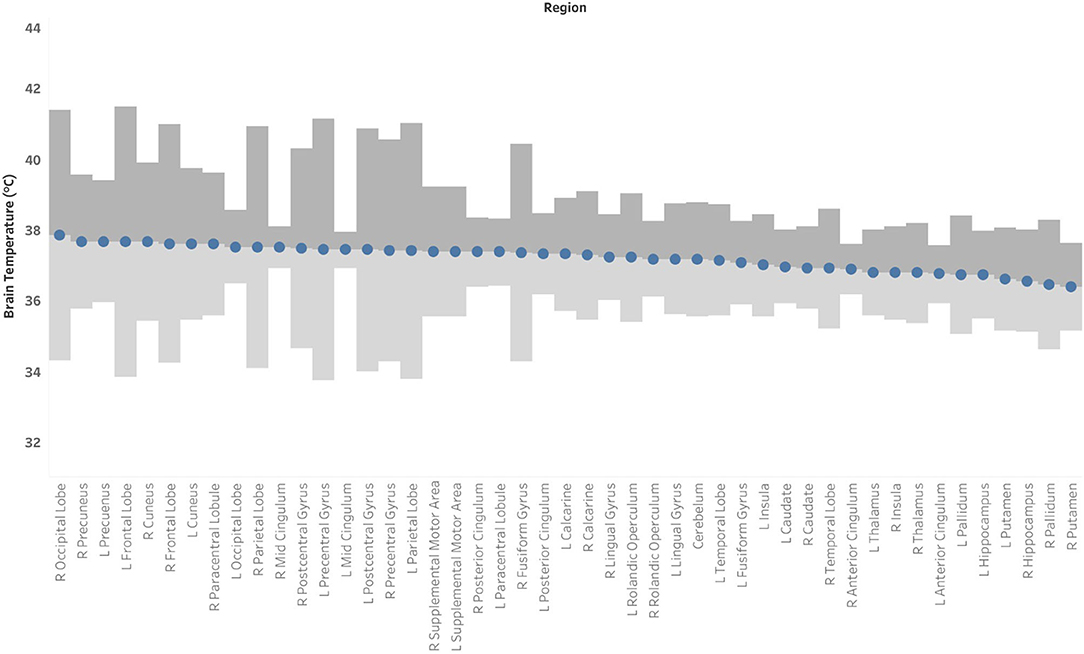
Figure 4. Mean brain temperature for 47 brain regions delineated by the Automated Anatomical Labeling (AAL) atlas, with estimates of the upper and lower bounds of Minimal Detectable Change (MDC) at which temperatures may be above- or below-typical, respectively. Brain temperature was non-invasively derived from volumetric magnetic resonance spectroscopic imaging (MRSI) data. Voxel-level brain temperature was calculated according to the following equation: TCRE = −102.61(ΔH20−CRE) + 206.1°C, where ΔH20−CRE = chemical shift difference between the creatine and water resonances. The upper bounds of MDC are indicated in dark gray bands, and the lower bounds of MDC are indicated in light gray bands.
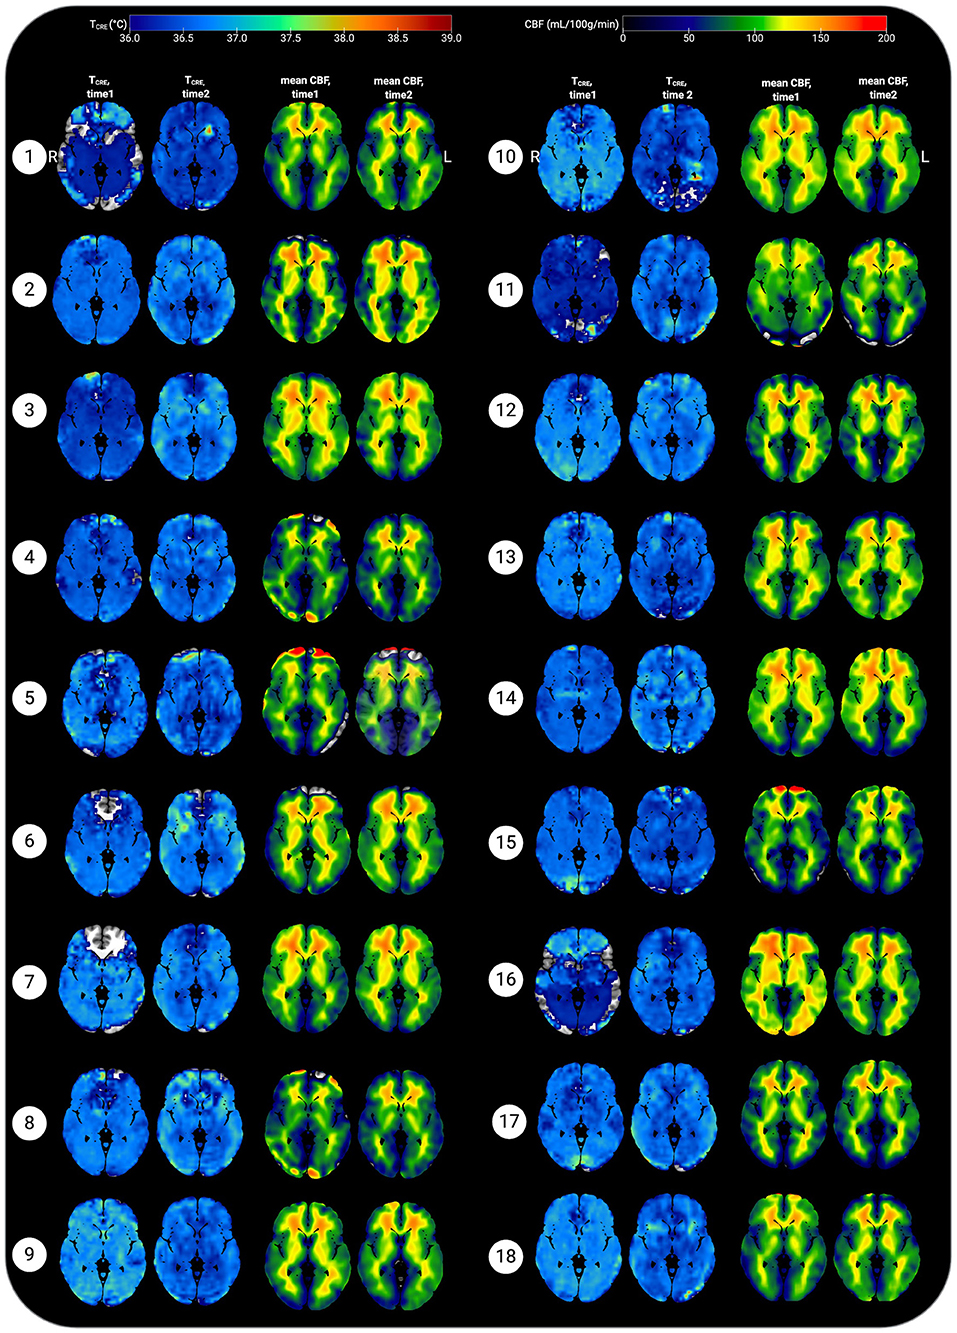
Figure 5. Representative axial slices showing brain temperature (TCRE) and cerebral blood flow (CBF) for 18 healthy participants at time 1 and time 2. Brain temperature was non-invasively measured using volumetric magnetic resonance spectroscopic imaging (MRSI) data, with calculation according to the following equation: TCRE = −102.61(ΔH20−CRE) + 206.1°C, ΔH20−CRE = chemical shift difference between the creatine and water resonances. Mean CBF maps (ml/100 g/min) were generated following processing of arterial spin labeling (ASL) data, with voxel-level CBF quantified using simple subtraction between each tag/control pair (120 smoothed volumes, 60 pairs) for 18 participants. Mean TCRE and CBF maps were resliced and co-registered to Montreal Neurological Institute template space with the Statistical Parametric Mapping (SPM12) toolbox running in MatLab R2019b. All data are visualized for axial view of the same slice (z = 8; L, left; R; right). The TCRE color scale ranges from 36.0 to 39°C, with dark to light blue coloring indicating TCRE values within the typical range. The majority of voxels demonstrate TCRE <37.5°C, with a mean of 37.0°C for time1 and 37.4°C for time2 (global mean of 37.2°C). As demonstrated by the time1 and time2 maps and the global COVrep of 1.92%, there was a minimal variation in participants' data from time1 to time2. For some participants' data, brain regions were excluded from analysis due to technical reasons; these areas are represented by regions where the template brain is exposed. Each participant's mean CBF maps for time1 and time 2 are visualized alongside TCRE maps; as with TCRE mean CBF varies little from time1 to time2. Spatial TCRE variations did not vary as a function of cerebral perfusion as indicated by mean CBF. The open-source software MRIcroGL (McCausland Center for Brain Imaging, University of South Carolina; https://www.mccauslandcenter.sc.edu/mricrogl/) was used to overlay mean TCRE and CBF maps on the MNI single-participant template for 3D renderings of participant data. The figure was created using BioRender.
A linear mixed effects model investigated the variation of TCRE across 47 brain regions over 2 time points. Fixed effects included time, brain region, and the interaction of time*brain region, with participants considered random effects. In the case of a statistically significant interaction, we planned follow-up tests to assess pairwise differences using simple effects analysis. P-values were corrected for multiple comparisons by controlling the False Discovery Rate (FDR=0.05) with the two-stage step-up method of Benjamini and Yekutieli (2001). The interaction of time*brain region was not significant [F(46, 1,591) = 0.80, p = 0.83]. There was a significant main effect for time [F(1, 1,591) = 37.0, p < 0.0001], and for brain region [F(46, 1,591) = 2.66, p < 0.0001].
Voxel-level repeated measures t-tests did not find significant within-subjects differences in mean CBF when comparing time1 vs. time 2; the same results were found when mean TCRE was included as a covariate. Further, participants' global CBF values did not change significantly from time1 to time2, as indicated by paired samples t-tests [t(17) = 0.21, p = 0.84]. At time1, mean global CBF was 70.77 ± 6.15 mL/100 g/min. At time2, mean global CBF was 71.03 ± 4.24 mL/100 g/min (Table 1). Mean CBF ranged from 56.66 to 79.99 mL/100 g/min (Figure 5). Each participant's mean CBF maps for time1 and time2 are visualized alongside TCRE maps (Figure 5). Mean CBF for all participants across both time points was 70.90 mL/100 g/min.
For major metabolites (tCre, tCho, NAA, and MI), COVrep (%) values are provided in Table 3. In contrast to TCRE, metabolite concentrations varied substantially across time. For tCho, mean COVrep was 12.49% (range 3.13–84.52%); with the removal of outlying values for the R Precentral Gyrus, the COVrep range for tCho became limited to 3.13–34.44%. For tCre, mean COVrep was 10.38% (range 4.35–22.08%). For NAA, mean COVrep was 6.93% (range 2.68–28.44%). Lastly, mean COVrep for MI was 16.05% (range 6.41–41.97%).
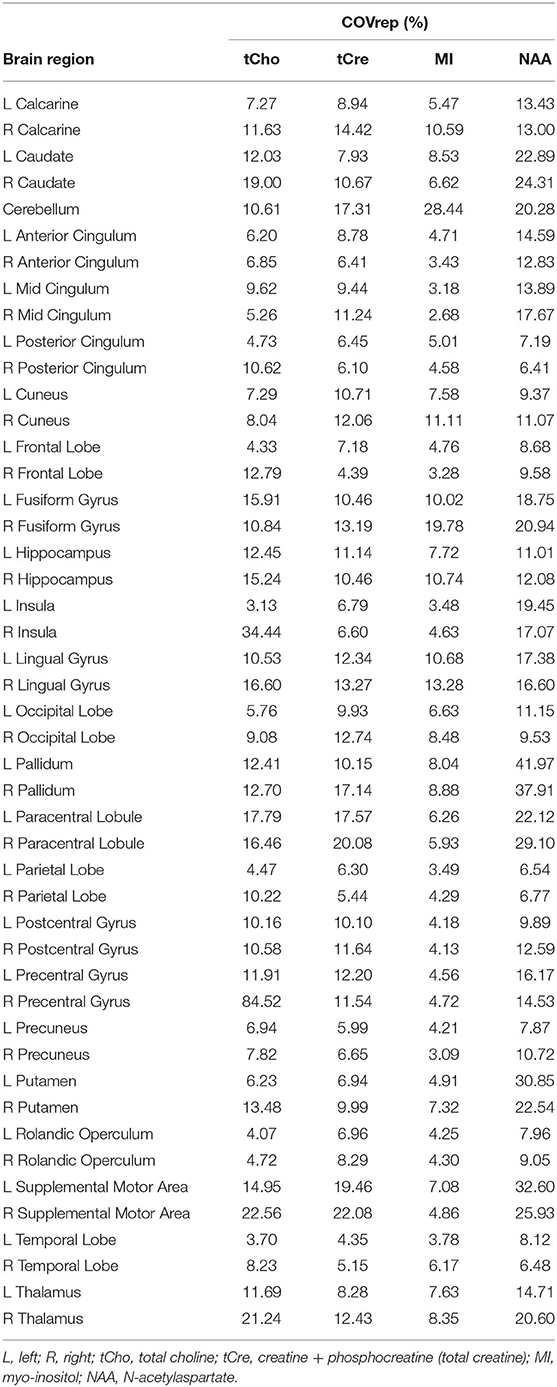
Table 3. Coefficient of variation (COVrep, %) for major metabolites.
Spearman correlations were run to test the relationship between TCRE and the ratios MI/tCre, NAA/tCre, and Glx/tCre (Table 4). There was a strong, positive correlation between TCRE and NAA/tCre (rs = 0.678, p < 0.0001), and a strong negative correlation between TCRE and tCho/tCre (rs = −0.575, p < 0.0001). There was a moderate, positive statistically significant correlation between TCRE and Glx/tCre, rs = 0.458, p = 0.001. Lastly, there was a weak, negative correlation of statistical significance between TCRE and MI/tCre, rs = −0.322, p = 0.027. Based on results of correlation analysis, a multiple regression was performed to predict TCRE from tCho/tCre, NAA/tCre, Glx/tCre, and MI/tCre. However, none of the metabolite ratios were significant predictors of TCRE. The mean distribution of tCho/tCre, NAA/tCre, Glx/tCre, and MI/tCre across regions at time1 is included in Figure 6.
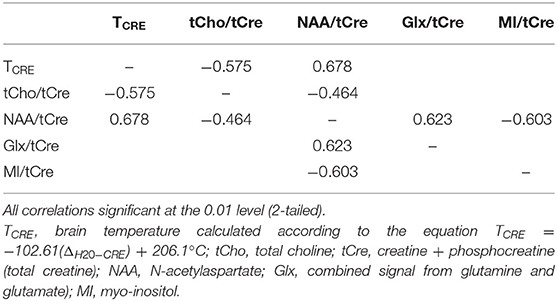
Table 4. Spearman correlations between metabolite ratios and brain temperature.
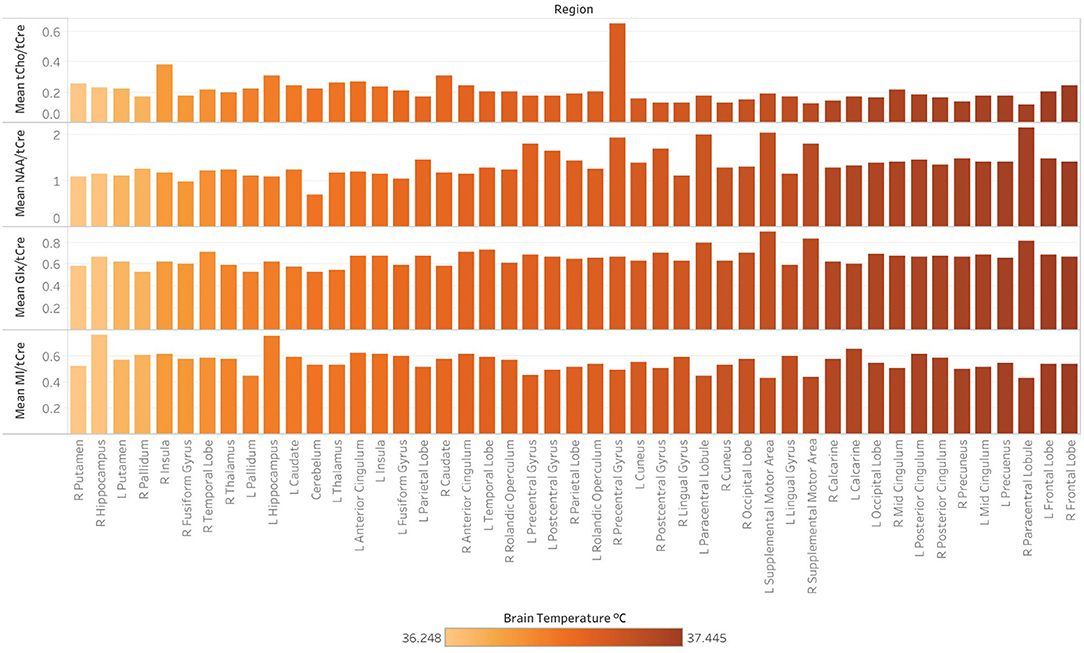
Figure 6. Regional differences in the concentration of major metabolites ratios, as indicated by magnetic resonance spectroscopic imaging (MRSI) data collected at 3-Tesla at a single timepoint (time1). Following the processing of MRSI data within the Metabolite Imaging and Data Analysis System (MIDAS) software package, metabolite ratios were quantified using the Map Integrated Spectrum (MINT) module within MIDAS. Spectral integration was limited to voxels that had a fitted metabolite linewidth between 2 and 12 Hz, and voxels were excluded if they had an outlying values of 2.5 times the standard deviation of all valid voxels in the image. Metabolite ratios were derived for 47 brain regions delineated by the Automated Anatomical Labeling (AAL) atlas. Ratios for the following metabolites in reference to creatine (tCre) are demonstrated: choline (tCho), N-acetylaspartate (NAA), Glx (combined signal from glutamine and glutamate), and myo-inositol (MI). Mean tCho/tCre, NAA/tCre, Glx/tCre, and MI/tCRE across regions at time1, with regions ordered (left to right) by ascending mean TCRE at time1 and corresponding coloring metabolite ratio data.
There were no significant differences in brain temperature when comparing left and right ROIs at p < 0.05, corrected for FDR. Due to unequal sex distribution of our participants in the final dataset, we did not perform independent samples t-tests to evaluate sex differences in global and regional TCRE.
Our data were of moderate to high quality as indicated by the spectral resolution and total percentage of voxels included in our final analysis. An average of 75.18% of voxels within the brain met quality criteria across both timepoints (76.47 ± 10.68% of voxels at T1, 73.89 ± 12.39% of voxels at T2), with a range of 48.13% to 89.53%. As indicated by the mean linewidth of 7.31 Hz (range, 6.39 to 8.69) our data also had high spectral resolution.
We performed post-hoc correlation analysis of SEM, COVrep, mean TCRE, and ROI size to determine if there was an association between reproducibility, repeatability, TCRE, and region size. ROI size was calculated by multiplying the mean # of voxels in each region (pre-processing) by the mean % accepted voxels after processing. To adjust for varying scale, SEM, COVrep, mean TCRE, and ROI size were z-transformed. Reproducibility and repeatability (COVrep*SEM) had a strong positive correlation (r = 0.805, p < 0.001) (Table 5). Mean TCRE had a moderate positive correlation with both SEM (r = 0.487, p < 0.001) and ROI size (r = 0.626, p < 0.001) (Table 5). Finally, in addition to its association with mean TCRE, ROI size had a moderate positive correlation with SEM (r = 0.524, p < 0.001) (Table 5).
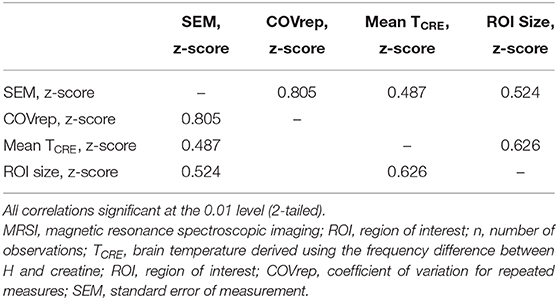
Table 5. Pearson correlations between measures of reproducibility and repeatability (SEM and COVrep), mean TCRE, and ROI size.
In this study, a global brain temperature of 37.2°C was found, with spatial variations across ROIs consistent with previous studies (Cady et al., 1995, 2011; Zhang et al., 2020). Also consistent with previous studies was a significant main effect for time [F(1, 1,591) = 37.0, p < 0.0001], and for brain region [F(46, 1,591) = 2.66, p < 0.0001]. The central aim of this study was to evaluate whether intra-subject reproducibility is maintained in a large sample of healthy participants with longer duration between scans than previously investigated. Though this study acquired MRSI-t data with a much greater time interval between acquisitions (~12 weeks apart), the COVrep ranged from 0.81 to 3.08% (mean COVrep = 1.92%), with 30 ROIs having a COVrep <2.0%. Thus, TCRE was stable across all 47 ROIs and paralleled results of previous studies of serial acquisitions or those separated by 1-week intervals (Maudsley et al., 2010; Thrippleton et al., 2014; Zhang et al., 2020). Another important question was whether timepoint has an impact on the mean brain temperature within a given ROI. Mixed effects analysis confirmed that the effect of time does not depend on ROIs, as indicated by the lack of a significant interaction [time*brain region, F(46, 1,591) = 0.80, p = 0.83)]. Thus, in the absence of neuropathology, the effect of time likely exerts a global change in brain temperature that equally impacts all brain regions. Interestingly, the highest TCRE was found in (1) posterior regions affected by anterior-posterior gradient effects (L and R occipital lobe, L and R cuneus, L and R precuneus), and 2) large peripheral cortical regions (L and R frontal lobes, R parietal, L and R occipital). Large posterior regions demonstrated higher TCRE with more within-subject variability and greater SEM. Based on MDC, atypical TCRE ranged from 37.57 to 41.49°C. MDC was calculated at the 68th confidence interval (CI), but future work with larger sample sizes and more repeated acquisitions may enable MDC calculation at the 90th or 95th CIs. Based on the aforementioned findings, our study confirms previous findings of spatial brain temperature variations from structure to structure; even if time has a significant effect, this effect is distributed over regions, and does not change in magnitude as a function of ROI.
Though TCRE correlated moderately with some of the neuroinflammatory metabolites, the regression model indicated that none were significant predictors. Thus, the relationship between TCRE and neuroinflammatory metabolites could not be fully assessed in this population, as would be expected for healthy participants without neuroinflammatory pathophysiology. Creatine was among the most stable brain metabolites (COVrep = 10.38%), though NAA still demonstrated far less variability between timepoints. Consistent with previous investigations, myo-inositol was the least stable across time points (COVrep = 16.05%) (Brooks et al., 1999; Wellard et al., 2005; Okada et al., 2007; Zhang et al., 2020). Myo-inositol quantification is technically challenging due to low signal-to-noise ratio, which primarily stems from the distributed signal of 6 hydrogen atoms and spectral overlap with spectra of other metabolites (e.g., Glx) (Haris et al., 2011). Previous studies have demonstrated substantial variability of MI globally and across regions. Choline demonstrated a wider range of COVrep across ROIs (range 3.13–84.52%), as compared to MI. This unexpected finding may result from scanner-specific anomalies, increased cellular or brain activity, or even undocumented physiological phenomena (e.g., injury or illness). Given the small body of repeatability data for volumetric MRSI, more studies are necessary before the reliability, variability, and expected range of metabolite and brain temperature values can be solidified for healthy populations or region to region.
Maudsley et al. previously established tCre as the reference metabolite for brain temperature derivations; this is because of its even distribution across cellular compartments (at least in the absence of disease), which renders tCre the least susceptible to gray matter (GM) and white matter (WM) tissue-dependency frequency shifts (Maudsley et al., 2017). Given the difficulty of separating GM and WM within each ROI, we used tCre as our reference metabolite. However, it is not always the case that tCre is well-distributed or best reference metabolite—especially when considering neurodegenerative conditions characterized by significant changes in bioenergetics/metabolism. The posterior regions that indicated higher brain temperature and greater variability could be the result of anterior-posterior gradient due to acquisition, but may also be the result of visual stimulation effects from watching movies during acquisition (Kauppinen et al., 2008; Rango et al., 2015). Future studies would benefit from acquiring data both with and without in-scanner visual stimulation.
Our study was limited by the heterogeneity of the participant population, limited age range (no participants >46 years), and acquisition-related methods that are inherently variable between- and within-participants. Additionally, we did not monitor or control for a number of variables that could alter brain temperature, including circadian rhythms, diurnal changes, hormonal variations (e.g., due to menstruation), or even environmental conditions (e.g., temperature in the scanner room). Our methodological limitations stem from two issues that critically impact all MRSI-t data: (1) magnetic field inhomogeneities and (2) interfering signal from water-containing structures (e.g., the aqueous humor of the eyes). Shimming during EPSI acquisition can substantially reduce magnetic field inhomogeneities and improve signal-to-noise ratio by adjusting spectral linewidth, but the process is time-consuming and difficult without substantial training. Due to investigators' extensive training in manual shimming, automated shimming was followed by interactive shimming to optimize signal resolution and data quality. All participants' data were acquired a peak FWHM ≤ 30 Hz as recommended (Zeinali-Rafsanjani et al., 2018). Though shimming greatly improves spectral linewidth, it cannot correct the spatial inhomogeneities present across structures and even within large brain regions—additionally, it is unclear whether these spatial inhomogeneities are truly artifact or a reflection of actual physiological processes. Signals from water-containing structures are typically masked with the placement of a saturation band placement during data acquisition. While this is effective to an extent, the saturation band is a 3D rectangular slab of fixed bounds and shape—it can only be angled to cover the eyes and sphenoidal sinuses, and there is currently no capacity for altering the curvature of the band. Depending on each participant's structural anatomy, the saturation band may cut off regions of cortex in the frontal areas. Additionally, the placement and angling of this slab cannot be replicated from subject-to-subject or even within a subject across time points. As with our own data, these issues can result in missing or even heavily contaminated metabolite and temperature data for impacted ROIs, as voxels may not contain sufficient information or signals of sufficient quality.
A countless number of phenomena could theoretically impact brain temperature and weaken the ability to maintain sufficient reproducibility and reliability. Functional activity, time of day, and even transient hormonal fluctuations such as menstruation may impact MRSI-t-based estimates (Ene Mrozek et al., 2012). Thrippleton et al. limited data acquisition to afternoon hours to minimize diurnal temperature variation, and went so far as to recruit only male subjects to avoid the hormonal fluctuations that may impact brain temperature in females (Thrippleton et al., 2014). They additionally instructed their participants to refrain from eating, drinking, exercising, or going outdoors within 1 h of scanning; even the temperature of the scanner room was regulated to obtain the most precise measurements (Thrippleton et al., 2014). These methods may be the reason for low error in repeated measurements (0.14°C), with less deviation between successive measurements. Of course, not all studies have the capacity to limit such phenomena, and one could argue that varied reference data in both sexes and across a varied number of experimental situations is imperative for fully understanding MRSI-t-based temperature estimates. Additionally, the calibrated equation we used for deriving TCRE was developed on a more dated scanner model than that used for our study. There is disagreement over whether a calibrated formula derived phantom data is a worthwhile endeavor (Verius et al., 2019; Annink et al., 2020). The difference is minimal for short TE MRSI-t, but significant for long TE MRSI-t, resulting in a mean difference between derivations of up to 0.15°C (Annink et al., 2020). Given this small but possibly significant difference, future studies would benefit from developing a calibrated temperature formula that accounts for conditions at their particular scanner. It is worth noting that a calibration would only impact the intercept of the temperature calculation, with no impact on the slope. Thus, calibration would have little impact on outcomes if all participants' data are acquired with the same sequence and identical temperature equation.
MRSI-t is a reliable and reproducible approach to measuring brain temperature, though future studies of larger sample size with more repeated acquisitions over long duration are necessary. We must also determine whether MRSI-t measurements of brain temperature are sensitive to the phenomenon we are attempting to visualize. Since this study included healthy participants only, the relationship between brain temperature and neuroinflammatory metabolites could not be fully assessed. Thus, the reference data this study provides must be applied to assessing patients with focal neuroinflammation. Before MRSI-t-based temperature can be utilized clinically, it is imperative to determine (1) if this tool can isolate focal brain temperature increases in regions of neuroinflammation and (2) if it can differentiate those with neuroinflammatory pathophysiology from those who are healthy.
The datasets presented in this article are not readily available because of participant privacy. De-identified data will be made available upon reasonable request with IRB and data sharing approvals in place. Requests to access the datasets should be directed to Ayushe Sharma, c2hhcm1hODdAdWFiLmVkdQ==.
All procedures involving human participants or their protected health information were conducted in accordance with study procedures approved by the University of Alabama at Birmingham Institutional Review Board. Written informed consent was obtained from all individual participants involved in the study.
AAS, RN, and JPS: methodology and writing – review and editing. AAS and RN: data acquisition and processing. AAS and AAM: methodology, data curation, and data visualization. CM, AAM, and JWY: review and editing. AAS: formal analysis and writing—original draft. JPS: project supervision, funding acquisition, conceptualization, review, and writing—review and editing. All authors: listed have made substantial, direct, and intellectual contributions to the work.
This work was supported by State of Alabama General Fund (Carly's Law) and the UAB Epilepsy Center supported this study. AAS is currently supported by an institutional training grant (T32-NS061788-13) from the National Institute of Neurological Disorders and Stroke (NINDS).
The authors declare that the research was conducted in the absence of any commercial or financial relationships that could be construed as a potential conflict of interest.
The authors thank Dr. Adam Goodman for helpful discussions regarding data analyses and visualization. This study was presented in part at the Annual Meeting of the Organization for Human Brain Mapping, Montreal, CA, 2020 (virtual presentation).
MRSI, Magnetic resonance spectroscopic imaging; MRSI-t, MRSI-based brain temperature; ROI(s), Region(s) of interest; COVrep, Coefficient of variation for repeated measures; SEM, Standard error of measurement; MDC, Minimal Detectable Change; TCRE, MRSI-based brain temperature calculated according to the equation TCRE = −102. 61(ΔH20−CRE) + 206.1°C; tCre, creatine + phosphocreatine (total creatine); tCho, total choline; NAA, N-acetylaspartate; Glx, combined signal from glutamine and glutamate; MI, myo-inositol.
Alberts, M. J., Faulstich, M. E., and Gray, L. (2020). Stroke With Negative Brain Magnetic Resonance Imaging. Available online at: http://ahajournals.org (accessed July 19, 2020).
Albrecht, D. S., Granziera, C., Hooker, J. M., and Loggia, M. L. (2016). In vivo imaging of human neuroinflammation. ACS Chem. Neurosci. 7, 470–483. doi: 10.1021/acschemneuro.6b00056
Amor, S., Puentes, F., Baker, D., and Van Der Valk, P. (2010). Inflammation in neurodegenerative diseases. Immunology 129, 154–169. doi: 10.1111/j.1365-2567.2009.03225.x
Annink, K. V., Groenendaal, F., Cohen, D., van der Aa, N. E., Alderliesten, T., Dudink, J., et al. (2020). Brain temperature of infants with neonatal encephalopathy following perinatal asphyxia calculated using magnetic resonance spectroscopy. Pediatr. Res. 88, 279–284. doi: 10.1038/s41390-019-0739-3
Aronica, E., Fluiter, K., Iyer, A., Zurolo, E., Vreijling, J., van Vliet, E. A., et al. (2010). Expression pattern of miR-146a, an inflammation-associated microRNA, in experimental and human temporal lobe epilepsy. Eur. J. Neurosci. 31, 1100–1107. doi: 10.1111/j.1460-9568.2010.07122.x
Barr, W. B., Ashtari, M., and Schaul, N. (1997). Bilateral reductions in hippocampal volume in adults with epilepsy and a history of febrile seizures. J. Neurol. Neurosurg. Psychiatry 63, 461–467. doi: 10.1136/jnnp.63.4.461
Benjamini, Y., and Yekutieli, D. (2001). The control of the false discovery rate in multiple testing under dependency. Ann. Stat. 29, 1165–1188. doi: 10.1214/aos/1013699998
Best, L., Ghadery, C., Pavese, N., Tai, Y. F., and Strafella, A. P. (2019). New and Old TSPO PET radioligands for imaging brain microglial activation in neurodegenerative disease. Curr. Neurol. Neurosci. Rep. 19:24. doi: 10.1007/s11910-019-0934-y
Blümcke, I., Coras, R., Miyata, H., and Özkara, C. (2012). Defining clinico-neuropathological subtypes of mesial temporal lobe epilepsy with hippocampal sclerosis. Brain Pathol. 22, 402–411. doi: 10.1111/j.1750-3639.2012.00583.x
Brooks, W. M., Friedman, S. D., and Stidley, C. A. (1999). Reproducibility of 1H-MRS in vivo. Magn. Reson. Med. 41, 193–197. doi: 10.1002/(SICI)1522-2594(199901)41:1<193::AID-MRM27>3.0.CO;2-P
Cady, E. B., D'Souza, P. C., Penrice, J., and Lorek, A. (1995). The estimation of local brain temperature by in vivo 1H magnetic resonance spectroscopy. Magn. Reson. Med. 33, 862–867. doi: 10.1002/mrm.1910330620
Cady, E. B., Penrice, J., and Robertson, N. J. (2011). Improved reproducibility of MRS regional brain thermometry by “amplitude-weighted combination.” NMR Biomed. 24, 865–872. doi: 10.1002/nbm.1634
Chatzipanteli, K., Alonso, O. F., Kraydieh, S., and Dietrich, W. D. (2000). Importance of posttraumatic hypothermia and hyperthermia on the inflammatory response after fluid percussion brain injury: biochemical and immunocytochemical studies. J. Cereb. Blood Flow Metab. 20, 531–542. doi: 10.1097/00004647-200003000-00012
Chen, W. W., Zhang, X., and Huang, W. J. (2016). Role of neuroinflammation in neurodegenerative diseases (Review). Mol. Med. Rep. 13, 3391–3396. doi: 10.3892/mmr.2016.4948
Corbett, R. J. T., Laptook, A. R., Tollefsbol, G., and Kim, B. (1995). Validation of a noninvasive method to measure brain temperature in vivo using 1H NMR spectroscopy. J. Neurochem. 64, 1224–1230. doi: 10.1046/j.1471-4159.1995.64031224.x
Dehkharghani, S., Mao, H., Howell, L., Zhang, X., Pate, K. S., Magrath, P. R., et al. (2015). Proton resonance frequency chemical shift thermometry: experimental design and validation toward high-resolution noninvasive temperature monitoring and in vivo experience in a non-human primate model of acute ischemic stroke. Am. J. Neuroradiol. 36, 1128–1135. doi: 10.3174/ajnr.A4241
Devinsky, O., Vezzani, A., Najjar, S., De Lanerolle, N. C., and Rogawski, M. A. (2013). Glia and epilepsy: excitability and inflammation. Trends Neurosci. 36, 174–184. doi: 10.1016/j.tins.2012.11.008
Dickstein, L. P., Liow, J., Austermuehle, A., Zoghbi, S., Inati, S. K., Zaghloul, K., et al. (2019). Neuroinflammation in neocortical epilepsy measured by PET imaging of translocator protein. Epilepsia 60:15967. doi: 10.1111/epi.15967
Dietrich, W. D., Alonso, O., Busto, R., Prado, R., Zhao, W., Dewanjee, M. K., et al. (1998). Posttraumatic cerebral ischemia after fluid percussion brain injury: an autoradiographic and histopathological study in rats. Neurosurgery 43, 585–593. doi: 10.1097/00006123-199809000-00105
Dietrich, W. D., Alonso, O., Halley, M., and Busto, R. (1996). Delayed posttraumatic brain hyperthermia worsens outcome after fluid percussion brain injury: a light and electron microscopic study in rats. Neurosurgery 38, 533–541. doi: 10.1227/00006123-199603000-00023
Ene Mrozek, S., Vardon, F., and Geeraerts, T. (2012). Brain temperature: physiology and pathophysiology after brain injury. Anesthesiol. Res. Pract. 2012:989487. doi: 10.1155/2012/989487
Finke, C. (2018). Diagnosing MRI-negative autoimmune diseases. Neurol. Neuroimmunol. Neuroinflammation 5:e457. doi: 10.1212/NXI.0000000000000457
Ghadery, C., Best, L. A., Pavese, N., Tai, Y. F., and Strafella, A. P. (2019). PET evaluation of microglial activation in non-neurodegenerative brain diseases. Curr. Neurol. Neurosci. Rep. 19:38. doi: 10.1007/s11910-019-0951-x
Giorgio, A., and De Stefano, N. (2010). Cognition in multiple sclerosis: relevance of lesions, brain atrophy and proton MR spectroscopy. Neurol. Sci. 31, S245–S248. doi: 10.1007/s10072-010-0370-x
Hamelin, L., Lagarde, J., Dorothé, G., Leroy, C., Labit, M., Comley, R. A., et al. (2019). Early and protective microglial activation in alzheimer's disease: a prospective study using 18 F-DPA-714 PET imaging. Brain 139, 1252–1264. doi: 10.1093/brain/aww017
Haris, M., Cai, K., Singh, A., Hariharan, H., and Reddy, R. (2011). In vivo mapping of brain myo-inositol. Neuroimage 54, 2079–2085. doi: 10.1016/j.neuroimage.2010.10.017
Jehi, L. (2018). The epileptogenic zone: concept and definition. Epilepsy Curr. 18, 12–16. doi: 10.5698/1535-7597.18.1.12
Jobst, B. C., and Cascino, G. D. (2015). Resective epilepsy surgery for drug-resistant focal epilepsy: a review. JAMA - J. Am. Med. Assoc. 313, 285–293. doi: 10.1001/jama.2014.17426
Kälviäinen, R., and Salmenperä, T. (2002). “Do recurrent seizures cause neuronal damage? A series of studies with MRI volumetry in adults with partial epilepsy,” in Progress in Brain Research (Elsevier), 279–295. doi: 10.1016/S0079-6123(02)35026-X
Kauppinen, R. A., Vidyasagar, R., Childs, C., Balanos, G. M., and Hiltunen, Y. (2008). Assessment of human brain temperature by1H MRS during visual stimulation and hypercapnia. NMR Biomed. 21, 388–395. doi: 10.1002/nbm.1204
Kreis, R., Ernst, T., and Ross, B. D. (1993). Absolute quantitation of water and metabolites in the human brain. II. metabolite concentrations. J. Magn. Reson. Ser. B 102, 9–19. doi: 10.1006/jmrb.1993.1056
Lecocq, A., Le Fur, Y., Maudsley, A. A., Le Troter, A., Sheriff, S., Sabati, M., et al. (2015). Whole-brain quantitative mapping of metabolites using short echo three-dimensional proton MRSI. J. Magn. Reson. Imaging 42, 280–289. doi: 10.1002/jmri.24809
Lucas, S.-M., Rothwell, N. J., and Gibson, R. M. (2006). The role of inflammation in CNS injury and disease. Br. J. Pharmacol. 147(Suppl. 1), S232–S240. doi: 10.1038/sj.bjp.0706400
Mariak, Z., White, M. D., Lyson, T., and Lewko, J. (2003). Tympanic temperature reflects intracranial temperature changes in humans. Pflugers Arch. Eur. J. Physiol. 446, 279–284. doi: 10.1007/s00424-003-1021-3
Maroso, M., Balosso, S., Ravizza, T., Liu, J., Aronica, E., Iyer, A. M., et al. (2010). Toll-like receptor 4 and high-mobility group box-1 are involved in ictogenesis and can be targeted to reduce seizures. Nat. Med. 16, 413–419. doi: 10.1038/nm.2127
Maudsley, A. A., Darkazanli, A., Alger, J. R., Hall, L. O., Schuff, N., Studholme, C., et al. (2006). Comprehensive processing, display and analysis for in vivo MR spectroscopic imaging. NMR Biomed. 19, 492–503. doi: 10.1002/nbm.1025
Maudsley, A. A., Domenig, C., Govind, V., Darkazanli, A., Studholme, C., Arheart, K., et al. (2009). Mapping of brain metabolite distributions by volumetric proton MR spectroscopic imaging (MRSI). Magn. Reson. Med. 61, 548–559. doi: 10.1002/mrm.21875
Maudsley, A. A., Domenig, C., and Sheriff, S. (2010). Reproducibility of serial whole-brain MR Spectroscopic Imaging. NMR Biomed. 23, 251–256. doi: 10.1002/nbm.1445
Maudsley, A. A., Goryawala, M. Z., and Sheriff, S. (2017). Effects of tissue susceptibility on brain temperature mapping. Neuroimage 146, 1093–1101. doi: 10.1016/j.neuroimage.2016.09.062
McNair, D., Lorr, M., and Doppleman, L. (1989). Profile of Mood States (POMS) Manual. San Diego, CA: Educational and Industrial Testing Service.
Metzger, G., and Hu, X. (1997). Application of interlaced fourier transform to echo-planar spectroscopic imaging. J. Magn. Reson. 125, 166–170. doi: 10.1006/jmre.1997.1114
Moffett, J., Ross, B., Arun, P., Madhavarao, C., and Namboodiri, A. (2007). N-Acetylaspartate in the CNS: from neurodiagnostics to neurobiology. Prog. Neurobiol. 81, 89–131. doi: 10.1016/j.pneurobio.2006.12.003
Mueller, C., Lin, J. C., Sheriff, S., Maudsley, A. A., and Younger, J. W. (2019). Evidence of widespread metabolite abnormalities in myalgic encephalomyelitis/chronic fatigue syndrome: assessment with whole-brain magnetic resonance spectroscopy. Brain Imaging Behav. 14, 562–572. doi: 10.1007/s11682-018-0029-4
Mueller, C., Lin, J. C., Thannickal, H. H., Daredia, A., Denney, T. S., Beyers, R., et al. (2020). No evidence of abnormal metabolic or inflammatory activity in the brains of patients with rheumatoid arthritis: results from a preliminary study using whole-brain magnetic resonance spectroscopic imaging (MRSI). Clin. Rheumatol. 39, 1765–1774. doi: 10.1007/s10067-019-04923-5
Muhlhofer, W., Tan, Y.-L., Mueller, S. G., and Knowlton, R. (2017). MRI-negative temporal lobe epilepsy-what do we know? Epilepsia 58, 727–742. doi: 10.1111/epi.13699
Noe, K., Sulc, V., Wong-Kisiel, L., Wirrell, E., Van Gompel, J. J., Wetjen, N., et al. (2013). Long-term outcomes after nonlesional extratemporal lobe epilepsy surgery. JAMA Neurol. 70, 1003–1008. doi: 10.1001/jamaneurol.2013.209
Okada, T., Sakamoto, S., Nakamoto, Y., Kohara, N., and Senda, M. (2007). Reproducibility of magnetic resonance spectroscopy in correlation with signal-to-noise ratio. Psychiatry Res. Neuroimaging 156, 169–174. doi: 10.1016/j.pscychresns.2007.03.007
Oz, G., Alger, J. R., Barker, P. B., Bartha, R., Bizzi, A., Boesch, C., et al. (2014). Clinical proton MR spectroscopy in central nervous system disorders. Radiology 270, 658–679. doi: 10.1148/radiol.13130531
Rango, M., Bonifati, C., and Bresolin, N. (2015). Post-activation brain warming: a 1-H MRS thermometry study. PLoS ONE 10:e0127314. doi: 10.1371/journal.pone.0127314
Ravizza, T., Balosso, S., and Vezzani, A. (2011). Inflammation and prevention of epileptogenesis. Neurosci. Lett. 497, 223–230. doi: 10.1016/j.neulet.2011.02.040
Rossi, S., Roncati Zanier, E., Mauri, I., Columbo, A., and Stocchetti, N. (2001). Brain temperature, body core temperature, and intracranial pressure in acute cerebral damage. J. Neurol. Neurosurg. Psychiatry 71, 448–454. doi: 10.1136/jnnp.71.4.448
Salmenpera, M., Symms, M. R., Rugg-Gunn, F. J., Boulby, P. A., Free, S. L., Barker, J., et al. (2007). Evaluation of quantitative magnetic resonance imaging contrasts in MRI-negative refractory focal epilepsy * §Tuuli. Epilepsia 48, 229–237. doi: 10.1111/j.1528-1167.2007.00918.x
Sharma, A. A., and Szaflarski, J. P. (2020). In vivo imaging of neuroinflammatory targets in treatment-resistant epilepsy. Curr. Neurol. Neurosci. Rep. 20:5. doi: 10.1007/s11910-020-1025-9
Sharma, H. S., and Hoopes, P. J. (2003). Hyperthermia induced pathophysiology of the central nervous system. Int. J. Hyperthermia. 19, 325–354. doi: 10.1080/0265673021000054621
Shechtman, O. (2013). The Coefficient of Variation as an Index of Measurement Reliability. (Berlin, Heidelberg: Springer), 39–49. doi: 10.1007/978-3-642-37131-8_4
Téllez-Zenteno, J. F., Ronquillo, L. H., Moien-Afshari, F., and Wiebe, S. (2010). Surgical outcomes in lesional and non-lesional epilepsy: a systematic review and meta-analysis. Epilepsy Res. 89, 310–318. doi: 10.1016/j.eplepsyres.2010.02.007
Thrippleton, M. J., Parikh, J., Harris, B. A., Hammer, S. J., Semple, S. I. K., Andrews, P. J. D., et al. (2014). Reliability of MRSI brain temperature mapping at 1.5 and 3 T. NMR Biomed. 27, 183–190. doi: 10.1002/nbm.3050
Tzourio-Mazoyer, N., Landeau, B., Papathanassiou, D., Crivello, F., Etard, O., Delcroix, N., et al. (2002). Automated anatomical labeling of activations in SPM using a macroscopic anatomical parcellation of the MNI MRI single-subject brain. Neuroimage 15, 273–289. doi: 10.1006/nimg.2001.0978
Veenith, T. V., Mada, M., Carter, E., Grossac, J., Newcombe, V., Outtrim, J., et al. (2014). Comparison of inter subject variability and reproducibility of whole brain proton spectroscopy. PLoS ONE 9:e115304. doi: 10.1371/journal.pone.0115304
Verius, M., Frank, F., Gizewski, E., and Broessner, G. (2019). Magnetic resonance spectroscopy thermometry at 3 tesla: importance of calibration measurements. Ther. Hypothermia Temp. Manag. 9, 146–155. doi: 10.1089/ther.2018.0027
Vezzani, A., Balosso, S., and Ravizza, T. (2019). Neuroinflammatory pathways as treatment targets and biomarkers in epilepsy. Nat. Rev. Neurol. 15, 459–472. doi: 10.1038/s41582-019-0217-x
Vezzani, A., and Friedman, A. (2011). Brain inflammation as a biomarker in epilepsy. Biomark. Med. 5, 607–614. doi: 10.2217/bmm.11.61
Vivash, L., and OBrien, T. J. (2016). Imaging microglial activation with TSPO PET: lighting up neurologic diseases? J. Nucl. Med. 57, 165–168. doi: 10.2967/jnumed.114.141713
Wang, H., Wang, B., Normoyle, K. P., Jackson, K., Spitler, K., Sharrock, M., et al. (2014). Brain temperature and its fundamental properties: a review for clinical neuroscientists. Front. Neurosci. 8:307. doi: 10.3389/fnins.2014.00307
Wang, Z., Aguirre, G. K., Rao, H., Wang, J., Fernández-Seara, M. A., Childress, A. R., et al. (2008). Empirical optimization of ASL data analysis using an ASL data processing toolbox: ASLtbx. Magn. Reson. Imaging 26, 261–269. doi: 10.1016/j.mri.2007.07.003
Weir, J. P. (2005). Quantifying test-retest reliability using the intraclass correlation coefficient and the SEM. J. Strength Cond. Res. 19, 231–240. doi: 10.1519/00124278-200502000-00038
Wellard, R. M., Briellmann, R. S., Jennings, C., and Jackson, G. D. (2005). Physiologic variability of single-voxel proton MR spectroscopic measurements at 3T. Am. J. Neuroradiol. 26, 585–590.
Zeinali-Rafsanjani, B., Faghihi, R., Mosleh-Shirazi, M. A., Moghadam, S.-M., Lotfi, M., Jalli, R., et al. (2018). MRS shimming: an important point which should not be ignored. J. Biomed. Phys. Eng. 8, 261–270.
Zhang, Y., Taub, E., Mueller, C., Younger, J., Uswatte, G., DeRamus, T. P., et al. (2020). Reproducibility of whole-brain temperature mapping and metabolite quantification using proton magnetic resonance spectroscopy. NMR Biomed. 33:e4313. doi: 10.1002/nbm.4313
Zhu, M., Ackerman, J. J. H., and Yablonskiy, D. A. (2009). Body and brain temperature coupling: The critical role of cerebral blood flow. J. Comp. Physiol. B Biochem. Syst. Environ. Physiol. 179, 701–710. doi: 10.1007/s00360-009-0352-6
Keywords: MRS, brain temperature, MR thermometry, neuroinflammation, neuroimaging
Citation: Sharma AA, Nenert R, Mueller C, Maudsley AA, Younger JW and Szaflarski JP (2020) Repeatability and Reproducibility of in-vivo Brain Temperature Measurements. Front. Hum. Neurosci. 14:598435. doi: 10.3389/fnhum.2020.598435
Received: 24 August 2020; Accepted: 30 November 2020;
Published: 23 December 2020.
Edited by:
Dajiang Zhu, University of Texas at Arlington, United StatesReviewed by:
Edith V. Sullivan, Stanford University, United StatesCopyright © 2020 Sharma, Nenert, Mueller, Maudsley, Younger and Szaflarski. This is an open-access article distributed under the terms of the Creative Commons Attribution License (CC BY). The use, distribution or reproduction in other forums is permitted, provided the original author(s) and the copyright owner(s) are credited and that the original publication in this journal is cited, in accordance with accepted academic practice. No use, distribution or reproduction is permitted which does not comply with these terms.
*Correspondence: Ayushe A. Sharma, c2hhcm1hODdAdWFiLmVkdQ==
Disclaimer: All claims expressed in this article are solely those of the authors and do not necessarily represent those of their affiliated organizations, or those of the publisher, the editors and the reviewers. Any product that may be evaluated in this article or claim that may be made by its manufacturer is not guaranteed or endorsed by the publisher.
Research integrity at Frontiers
Learn more about the work of our research integrity team to safeguard the quality of each article we publish.