 Jaeyoung Shin
- Department of Electronic Engineering, Wonkwang University, Iksan, South Korea
The feasibility of the random subspace ensemble learning method was explored to improve the performance of functional near-infrared spectroscopy-based brain-computer interfaces (fNIRS-BCIs). Feature vectors have been constructed using the temporal characteristics of concentration changes in fNIRS chromophores such as mean, slope, and variance to implement fNIRS-BCIs systems. The mean and slope, which are the most popular features in fNIRS-BCIs, were adopted. Linear support vector machine and linear discriminant analysis were employed, respectively, as a single strong learner and multiple weak learners. All features in every channel and available time window were employed to train the strong learner, and the feature subsets were selected at random to train multiple weak learners. It was determined that random subspace ensemble learning is beneficial to enhance the performance of fNIRS-BCIs.
Introduction
Ensemble learning has been applied actively in many different machine learning fields (Akram et al., 2015; Li et al., 2016; Ren et al., 2016; Hassan and Bhuiyan, 2017; Sagi and Rokach, 2018; Yaman et al., 2018; Zerrouki et al., 2018). It is defined as a type of machine learning technique that takes advantage of multiple weak (i.e., straightforward but fair performance) learners instead of a single strong (i.e., sophisticated and powerful performance) learner to make high-quality predictions. This implies that the principle of collective intelligence being superior to an elite can be applied in the field of machine learning. Ensemble learning approaches are typically categorized into (i) bootstrap aggregating (bagging), (ii) boosting, and (iii) random subspace (Breiman, 1996; Freund and Schapire, 1997; Ho, 1998). With respect to a structural perspective, which is different from other ensemble approaches mentioned earlier, stacking, namely meta-learning, can be included in ensemble learning.
Bagging algorithms generate multiple (tens or hundreds) bootstrap replicas of an original dataset to train multiple weak learners corresponding to bootstrap replicas. Each bootstrap replica is composed of N samples, where N is the same as the original dataset size, selected at random with replacement. The algorithm trains weak learners until every weak learner is trained. Boosting algorithms train weak learners sequentially by focusing on the data misclassified by a weak learner. The misclassified data and correctly predicted data increasingly possess higher and lower weights, respectively. The next weak learner is trained on the data with adjusted weights to reduce classification loss. Random subspace algorithm requires less computational cost than others because the method uses random subsets containing M features out of D features, where D is the total number of features. Each weak learner is trained using a random subset of m features until every weak learner is trained. Stacking algorithms construct multi-level learners. The gist of this algorithm is that outputs of base learners are used as training data for the higher-level meta-classifier.
In previous studies in the fields of neuroscience and neural engineering, ensemble learning proved its effectiveness in improving classification performance (Cho and Won, 2007; Sun et al., 2007; Kuncheva and Rodriguez, 2010; Kuncheva et al., 2010; Plumpton et al., 2012). Electroencephalography-based brain-computer interface (EEG-BCI) is one of the major topics in the field of neural engineering, and various ensemble methods have been employed successfully to enhance the EEG-BCI performance (Sun et al., 2008; Liyanage et al., 2013). Another case garnering considerable attention is a functional near-infrared spectroscopy-based brain-computer interface (fNIRS-BCI), which already demonstrated its potentials as an alternative to EEG-BCIs owing to its cost-effectiveness, portability, scalability, and convenience (Herrmann et al., 2003; Kubota et al., 2005; Irani et al., 2007; Sitaram et al., 2007; Ye et al., 2009; Zhang et al., 2009; Falk et al., 2011; Power et al., 2011, 2012; Holper et al., 2012; Naseer et al., 2014; Khan and Hong, 2015; Shin et al., 2016; Shin and Im, 2018). Because of their excellent performance and reliability, support vector machine (SVM) and linear discriminant analysis (LDA) are two popular machine learning approaches that implement fNIRS-BCI systems. According to Naseer and Hong (2015), SVM or LDA is utilized in over 65% of fNIRS-BCI studies as a machine learning method. It is noteworthy that only a few studies on ensemble learning for fNIRS-BCI have been conducted to date. Instead, hybrid EEG-fNIRS BCI, which recently proved excellent in BCI performance, plays a leading role in taking advantage of the benefits of ensemble learning for fNIRS-BCIs (Fazli et al., 2012; Shin et al., 2017b, 2018a,c,d, 2019; Von Lühmann et al., 2017; Kwon et al., 2020).
Although different types of fNIRS-BCI related studies have been introduced (Sereshkeh et al., 2019; Ghonchi et al., 2020; Nagasawa et al., 2020; Von Luhmann et al., 2020) Deep recurrent–convolutional neural network for classification of simultaneous EEG–fNIRS signals), surprisingly, little literature has covered the advantages of ensemble learning to improve the performance in terms of classification accuracy, information transfer rate, etc. (Shin and Im, 2020). In this study, the effectiveness of ensemble learning for fNIRS-BCIs is evaluated. For this, the random subspace method takes charge of the core of the ensemble learning algorithm used in this study. Classification accuracies that are yielded by a single strong learner and an ensemble of multiple weak learners are provided as proof of validation results.
Methods
Open-Access Dataset
An open-access fNIRS-BCI dataset was used in subsequent data analyses to secure the reproducibility and accuracy of results. The fNIRS-BCI dataset can be downloaded using the URL (Shin et al., 2019). The dataset included a 16-channel fNIRS data of 18 participants [10 males and eight females, 23.8 ± 2.5 years (mean ± standard deviation)]. Optical intensity changes (Δ[OD]) were collected by a multi-channel fNIRS device (LIGHTNIRS; Shimadzu Corp.; Kyoto, Japan) utilizing three wavelengths (780, 805, and 830 nm) at a sampling rate of 13.3 Hz. The location of fNIRS channels is presented in Figure 1 (Shin et al., 2018c). Participants performed: (i) mental arithmetic task (repetitive subtractions of a one-digit number from a three-digit number) and (ii) stayed in an idle state during the task period of 10 s and relaxed during the following rest period (24~26 s). Items (i) and (ii) were repeated 30 times. Sixty-trial fNIRS data were collected from each participant after data recording. The details can be found in Shin et al. (2018c).
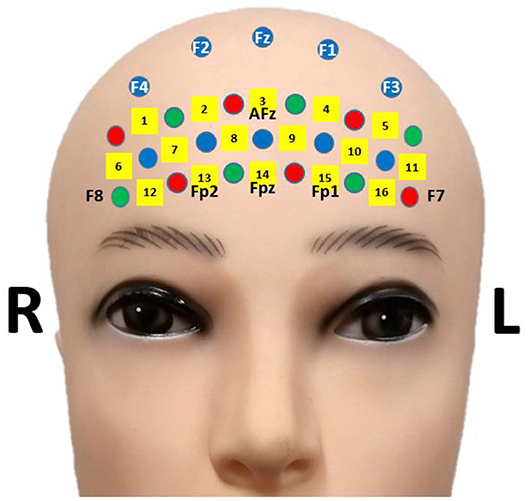
Figure 1. fNIRS channel location. The figure is adapted from Shin et al. (2018c) under CC-BY license.
Preprocessing
The collected Δ[OD] were converted to two types of fNIRS chromophore data (i.e., concentration changes in oxygenated hemoglobin Δ[HbO] and reduced hemoglobin Δ[HbR]) using the following formula which is given by Matcher et al. (1995):
where the subscript denotes a wavelength.
The converted data were band-pass filtered using a sixth-order Butterworth zero-phase filter with a pass-band of 0.01–0.09 Hz (Shin et al., 2017a, 2018b,c). The pass-band was selected to eliminate unwanted physiological noises and DC offsets (Zhang et al., 2007). Any motion artifact removal method was not applied because the fNIRS data were collected at the stationary state. The filtered data were segmented into epochs ranging from −1 to 15 s relative to task onset (0 s). Afterward, the segmented data were subjected to a baseline correction to subtract each channel offset in the reference interval (−1 to 0 s).
Classification
Features
A variety of features have been considered in fNIRS-BCI studies such as mean, slope, variance, etc. Among them, mean (average amplitude of fNIRS data; AVG) and slope (average rate of amplitude change of fNIRS data; SLP) were the most relevant features in previous fNIRS studies (Bhutta et al., 2015; Hong and Santosa, 2016; Hong et al., 2017; Shin et al., 2018c); therefore, four types of time windows were employed to extract AVG and SLP of the segmented Δ[HbO] and Δ[HbR] data ranging from 0 to 15 s. Each type of window subdivided the interval into 1, 3, 5, and 15.
i) TYPE 1: single time window with a length of 15 s.
ii) TYPE 2: three time windows with a length of 5 s: [0 5], [5 10], and [10 15] s.
iii) TYPE 3: five time windows with a length of 3 s: [0 3], [3 6], …, [12 15] s.
iv) TYPE 4: fifteen time windows with a length of 1 s: [0 1], [1 2], …, [14 15] s.
Feature vectors were constructed using both AVG and SLP as well as a single feature, either AVG or SLP. The dimensionality of feature vectors (i.e., the number of features, D) for each of the trials is given as:
where ntype, nchrm, nch, and nwin are the number of feature types (1 or 2), chromophores (2), channels (16), and time windows (1, 3, 5, or 15 for TYPE 1, 2, 3, or 4), respectively.
Strong Learner
As mentioned in the Introduction section, the two most popular machine learning algorithms (SVM and LDA) were employed. Feature vector standardization was applied to linear SVM to improve prediction performance while other miscellaneous hyperparameters were default values. However, the feature vector standardization was not applied to LDA because, as understood, the application of standardization does not significantly affect LDA prediction performance. The number of D features was used to train strong learners.
Random Subspace
LDA was chosen as a type of weak learner. Random subsets of M features out of D features were used to train N weak learners, where M = , [·] operator denotes the integer part of a number (e.g., M = {3, 5, 7, 9, 11}, D = 50, ), and N = {n | 1 ≤ n ≤ 100, n ∈ ℕ}. The basic rule of random subspace ensemble follows the steps below:
i) choose N subsets containing M features selected at random from D features.
ii) train N weak learners using each random subset.
iii) make a prediction by majority vote.
Cross-Validation
In the case of the strong learner, a 10 × 10-fold cross-validation was performed to estimate the generalized classification performance. A 60-trial training set for a single participant was divided into 10-folds. A training dataset and a test set were composed of 9-folds and the rest data, respectively. The strong learner was trained using the training set, and the classification performance was validated using the test set, which included unseen data during the training process. The validation was repeated until every fold was used at least once to estimate the classification performance. In the case of ensemble learning, while steadily increasing the number of weak learners up to N, ten repetitions of 10-fold cross-validation were performed using the training and test sets partitioned in the same way, as employed in the process of strong learning validation.
Test Statistic
Prediction performances of random subspace ensembles and strong learners were tested by repeated cross-validation tests. The assessment was conducted as follows:
i) compute differences between classification losses for kthfold of rth repetition of a random subspace ensemble and a strong learner:
ii) compute the average differences across K folds:
iii) compute average differences across R repetitions:
iv) compute variances of the differences:
v) compute average variances across R repetitions:
vi) compute overall variances of the differences:
A test statistic (t) for comparing classification losses of both random subspace ensemble and the strong learner is given by:
where df is a degree of freedom and was assigned 10 in this study (Bouckaert and Frank, 2004; Wang et al., 2017).
Statistical Test
Parametric statistical methods, such as analysis of variance (ANOVA) and t-test, were adopted because the Anderson-Darling test for classification accuracies returned a test decision indicating that the classification accuracies were from a population with a normal distribution.
Results
Strong Learners
Figure 2 shows grand averages (over all participants) of LDA and SVM classification accuracies according to the time window type for constructing feature vectors. Variance analysis (ANOVA) was employed to test whether a significant difference existed among single-trial classification accuracies corresponding to each of the feature vectors. The significant variability of SVM classification accuracy by different time window and feature types (One-Way ANOVA, p = 0.991) was not observed; in other words, the SVM prediction power was not significantly influenced by the number of dimensions (i.e., how many features) and type of features that were considered, at least in this study. Instead, for SVM: AVG at TYPE 5, the best grand average classification accuracy yielded a result of 80.8 ± 8.4% (mean ± std), although this is not statistically significant, considering the highest-dimensional feature vectors. However, statistically, different prediction performances were observed among LDA classifiers (One-Way ANOVA, p < 0.001). In the case of TYPE 5, LDA classification accuracies, estimated by a single type of feature (AVG: 65.3 ± 7.9%, SLP: 65.3 ± 10.5%), decreased steeply below the effective binary BCI threshold [commonly, 70.0% (Dickhaus et al., 2009; Allison and Neuper, 2010; Vidaurre and Blankertz, 2010)].
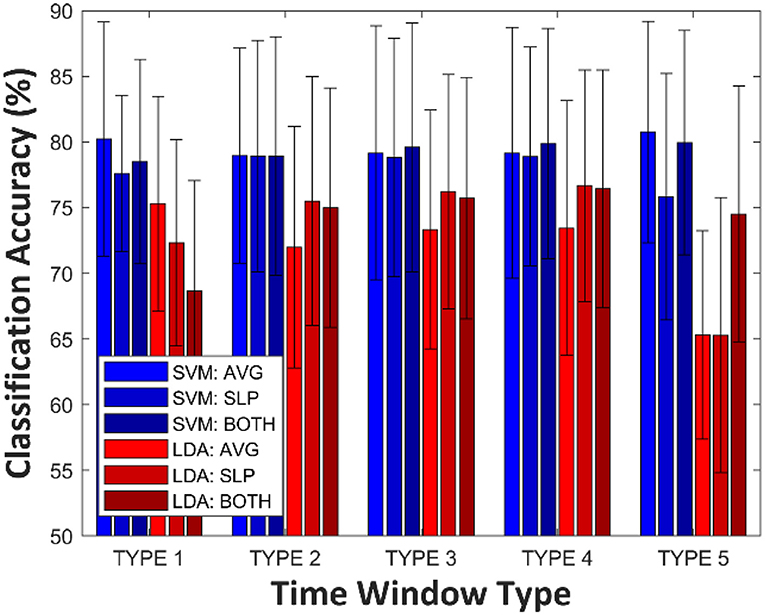
Figure 2. Grand averages (over all participants) of LDA and SVM classification accuracies according to time window type. The error-bar indicates standard deviation.
Random Subspace Ensemble
Classification accuracies of random subspace ensemble classifiers varied as a function of the number of weak learners as shown in Figure 3. Typically, classification accuracies were drastically improved until the 20 weak classifiers were involved in the ensemble. Afterward, it was confirmed that the classification accuracy gradually increased as the number of weak learners increased. The classification enhancement rate distinctly became lower in the regions where the ensemble included around 80 or more weak learners.
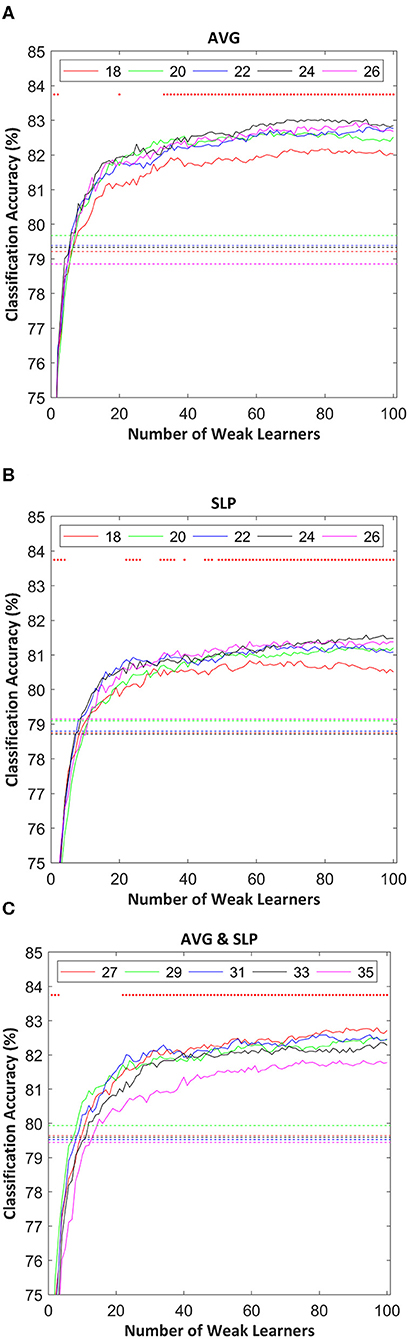
Figure 3. Random subspace ensemble classification accuracies estimated using: (A) AVG, (B) SLP, and (C) AVG and SLP features as a function of the number of weak learners. Dotted lines indicate SVM (strong learner) classification accuracy, estimated using the same 10-fold cross-validation partition used to validate the classification performance of the random subspace ensemble classifier. The random subset size for each weak learner is shown in the legend. Red dots in the upper part of each subfigure indicate the significance of differences in the classification accuracy between ensembles and strong leaners (t-test with false discovery rate corrected-p < 0.05).
Overall, ensembles with 10+ weak learners outperformed a single strong learner, and this improvement was significantly observed in the areas where the number of weak learners was > 20 (paired t-test with false discovery rate corrected-p < 0.05). The highest ensemble classification accuracy was often yielded where the subset size was relatively larger; however, its consistency was not observed. Table 1 shows the highest individual random subspace ensemble classification accuracies, estimated using the fittest subset size. Using either AVG or SLP feature, a classification accuracy of 84.5 ± 6.2 or 83.0 ± 6.4%, respectively, was obtained on average. By using both features simultaneously, 84.4 ± 6.5% classification accuracy was obtained on average. The difference in classification accuracy among these three cases was not significant (One-Way ANOVA, p = 0.746). It was rarely displayed that N was <20 (3 out of 54 cases), while diverse M-values were selected depending on each participant to obtain the highest classification accuracy for each participant.
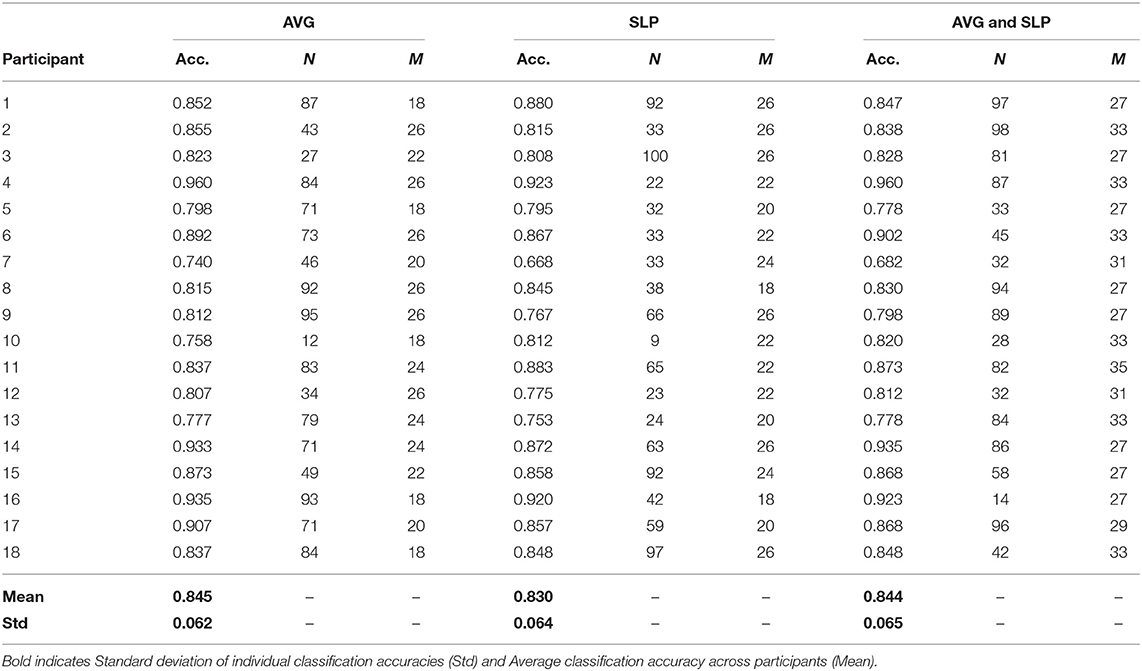
Table 1. The best classification accuracy of the ensemble that contains N weak learners, which were trained using random feature subsets of the fittest size (M).
Discussion
Dimensionality
For classification problems, it is generally acknowledged that as the dimensionality of the feature vector is much larger than the training set size, prediction performance can be adversely affected. This is called the “curse of dimensionality.” In areas where only AVG or SLP was used in this study, the ratio of the dimensionality of a feature vector to the training set size was 8.9 approximately (dimensionality: 32 × 15, training set size: 56 based on 10-fold cross-validation partition). The SVM prediction performance did not sensitively suffer from the “curse of dimensionality.” In contrast, a high-dimensional feature vector significantly influenced LDA prediction in consideration of poor classification accuracies in the TYPE 5 case. Regularization can be a viable option to mitigate the adverse effects of high-dimensional feature vectors. If the dimensionality of feature vectors exceeds a training set size, the parameter estimations required for LDA can be highly unstable (e.g., poor covariance matrix estimator; Friedman, 1989). By employing the regularization factor, one can improve the parameter estimations to be more plausible. In such cases, it is essential to select the regularization factor appropriately. It is noted that this approach is often iterative and requires heavy computation. SVM classification performance, at least in this study, was not sensitive to the negative effect of high-dimensional feature vectors. Therefore, if SVM is chosen, regularization, feature selection, and dimension reduction methods need not be applied to alleviate the “curse of dimensionality.”
Within-Fold Comparison
In terms of the classification accuracy improvement at the group level (i.e., grand average classification accuracy), a strong statistical proof, which infers that ensemble learning is more beneficial than a strong classifier, was provided. On the other hand, fold-wise comparisons of classification accuracies of SVM and random subspace ensemble to investigate classification accuracy improvement at the individual level results in somewhat different statistical results. The degree of improvement is not revealed as statistically significant for most individual cases. Figure 4 shows the within-fold differences in classification accuracy between ensemble and strong learner. As shown in Figure 3, while significant within-group differences in classification accuracy were observed, 14 out of 18 individual cases in Figure 4 showed insignificant within-fold differences in classification accuracy. These individual cases were presented (repeated cross-validation t-test, p > 0.05) because the test statistic was more likely to yield a conservative test decision (i.e., strict to false-positive cases). The null hypothesis is rejected only if the within-fold differences in classification accuracy are consistent. This type of test statistic has not typically been employed for comparison of classifier performance in existing fNIRS-BCI studies. The test statistic might suit cases where the dataset size is too small.
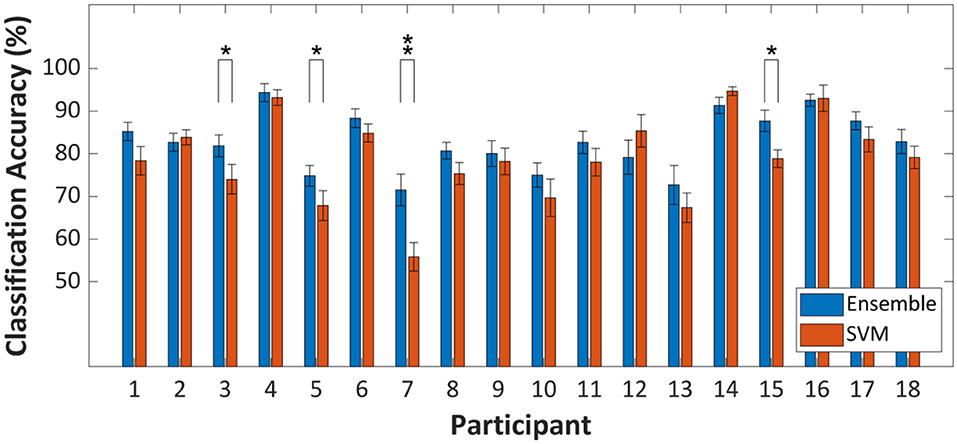
Figure 4. Within-fold differences of prediction performance between random subspace ensemble and strong learner (SVM) assessed by ten repetitions of a 10-fold cross-validation-based t-test. *p < 0.05, **p < 0.01. Error-bars represent the standard deviation.
Features
The main advantage of the random subspace method is to randomly select feature subsets, resulting in low-correlated multiple weak learners. It is well known that prediction performance is usually enhanced where predictions are determined with the help of low-correlated multiple weak learners. However, if most of the features are highly correlated, randomly selected features contained in a feature subset are also likely to be highly correlated. In many fNIRS-BCI studies, features extracted in the time domain such as mean, maximum, variance, and slope are correlated (Hwang et al., 2014). Moreover, because NIRS signals are slowly-varying continuous signals, features extracted from different time windows are likely to be correlated as well (Cui et al., 2010a,b). As seen in Table 2, random subspace ensemble learners trained using features extracted in different numbers and sizes of time windows show very similar prediction performance to one another (One-Way ANOVA, p = 0.995). Features extracted in different ways can be added by gaining higher prediction performance, rather than by typical algebraic methods in the time domain.
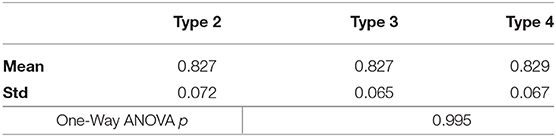
Table 2. Comparison of random subspace ensemble classification accuracies according to type of time window (AVG, N = 100, M = 22).
Future Prospects
The ensemble classifier has better classification accuracy; however, the ensemble method that requires far more computing power will not be absolutely the first option in any case. It is anticipated that a conventional single strong learner, such as SVM, LDA, etc., could be a more proper option under the circumstance like a real-time system with low computational resources. However, where the computing power is sufficient, ensemble learning methods have the immanent potential to replace the existing single strong learner. Even though deep learning has been receiving much attention recently, it is very difficult to collect enough data for fNIRS deep learning to improve classification performance, and thereby it lacks practicality. Recent findings showed the feasibility of deep learning on fNIRS-studies. However, their finding is not enough to be accepted generally and to be proven rigorously. Hence, ensemble learning as an alternative to deep learning is also likely to attract attention to improve fNIRS-BCIs.
Conclusion
In this study, the enhanced prediction performance of random subspace ensemble learning was validated to investigate the feasibility of ensemble learning based on the random subspace method. The two most popular types of temporal fNIRS signal features called AVG and SLP were employed to estimate the classification performance of both single strong learners and ensembles based on the random subspace method. Ensembles containing more than 20 LDA weak learners outperformed SVM strong learners significantly. The use of different single temporal features such as AVG and SLP did not make a significant difference in the prediction performance of ensembles. This study is expected to be helpful in the comprehension and use of ensemble learning in future fNIRS-BCI studies.
Data Availability Statement
The datasets analyzed in this study can be found at the following source: https://doi.org/10.6084/m9.figshare.9198932.v1.
Author Contributions
JS managed all works for this study. The author confirms being the sole contributor of this work and has approved it for publication.
Funding
This paper was supported by Wonkwang University in 2019.
Conflict of Interest
The author declares that the research was conducted in the absence of any commercial or financial relationships that could be construed as a potential conflict of interest.
Supplementary Material
The Supplementary Material for this article can be found online at: https://www.frontiersin.org/articles/10.3389/fnhum.2020.00236/full#supplementary-material
References
Akram, F., Han, S. M., and Kim, T. S. (2015). An efficient word typing P300-BCI system using a modified T9 interface and random forest classifier. Comput. Biol. Med. 56, 30–36. doi: 10.1016/j.compbiomed.2014.10.021
Allison, B. Z., and Neuper, C. (2010). “Could anyone use a BCI?,” in Brain-Computer Interfaces: Applying Our Minds to Human-Computer Interaction, eds D. S. Tan and A. Nijholt (London: Springer London), 35–54.
Bhutta, M. R., Hong, M. J., Kim, Y. H., and Hong, K. S. (2015). Single-trial lie detection using a combined fNIRS-polygraph system. Front. Psychol. 6:709. doi: 10.3389/fpsyg.2015.00709
Bouckaert, R. R., and Frank, E. (2004). “Evaluating the replicability of significance tests for comparing learning algorithms,” in Advances in Knowledge Discovery and Data Mining, eds H. Dai, R. Srikant, and C. Zhang, (Berlin; Heidelberg: Springer) 3–12.
Cho, S. B., and Won, H. H. (2007). Cancer classification using ensemble of neural networks with multiple significant gene subset's. Appl. Intell. 26, 243–250. doi: 10.1007/s10489-006-0020-4
Cui, X., Bray, S., and Reiss, A. L. (2010a). Functional near infrared spectroscopy (NIRS) signal improvement based on negative correlation between oxygenated and deoxygenated hemoglobin dynamics. Neuroimage 49, 3039–3046. doi: 10.1016/j.neuroimage.2009.11.050
Cui, X., Bray, S., and Reiss, A. L. (2010b). Speeded near infrared spectroscopy (NIRS) response detection. PLoS ONE 5:15474. doi: 10.1371/journal.pone.0015474
Dickhaus, T., Sanelli, C., Müller, K.-R., Curio, G., and Blankertz, B. (2009). Predicting BCI performance to study BCI illiteracy. BMC Neuroscience 10:P84. doi: 10.1186/1471-2202-10-S1-P84
Falk, T. H., Guirgis, M., Power, S., and Chau, T. (2011). Taking NIRS-BCIs outside the lab: towards achieving robustness against environment noise. IEEE Trans. Neural Syst. Rehabil. Eng. 19, 136–146. doi: 10.1109/TNSRE.2010.2078516
Fazli, S., Mehnert, J., Steinbrink, J., Curio, G., Villringer, A., Müller, K.-R., et al. (2012). Enhanced performance by a hybrid NIRS-EEG brain computer interface. Neuroimage 59, 519–529. doi: 10.1016/j.neuroimage.2011.07.084
Freund, Y., and Schapire, R. E. (1997). A decision-theoretic generalization of on-line learning and an application to boosting. J. Comput. Syst. Sci. 55, 119–139. doi: 10.1006/jcss.1997.1504
Friedman, J. H. (1989). Regularized discriminant analysis. J. Am. Stat. Assoc. 84, 165–175. doi: 10.1080/01621459.1989.10478752
Ghonchi, H., Fateh, M., Abolghasemi, V., Ferdowsi, S., and Rezvani, M. (2020). Deep recurrent–convolutional neural network for classification of simultaneous EEG–fNIRS signals. IET Signal Process 14, 142–153. doi: 10.1049/iet-spr.2019.0297
Hassan, A. R., and Bhuiyan, M. I. H. (2017). An automated method for sleep staging from EEG signals using normal inverse Gaussian parameters and adaptive boosting. Neurocomputing 219, 76–87. doi: 10.1016/j.neucom.2016.09.011
Herrmann, M. J., Ehlis, A. C., and Fallgatter, A. J. (2003). Prefrontal activation through task requirements of emotional induction measured with NIRS. Biol. Psychol. 64, 255–263. doi: 10.1016/S0301-0511(03)00095-4
Ho, T. K. (1998). The random subspace method for constructing decision forests. IEEE Trans. Pattern Anal. Mach. Intell. 20, 832–844. doi: 10.1109/34.709601
Holper, L., Scholkmann, F., and Wolf, M. (2012). Between-brain connectivity during imitation measured by fNIRS. Neuroimage 63, 212–222. doi: 10.1016/j.neuroimage.2012.06.028
Hong, K. S., Bhutta, M. R., Liu, X. L., and Shin, Y. I. (2017). Classification of somatosensory cortex activities using fNIRS. Behav. Brain Res. 333, 225–234. doi: 10.1016/j.bbr.2017.06.034
Hong, K. S., and Santosa, H. (2016). Decoding four different sound-categories in the auditory cortex using functional near-infrared spectroscopy. Hear. Res. 333, 157–166. doi: 10.1016/j.heares.2016.01.009
Hwang, H.-J., Lim, J.-H., Kim, D.-W., and Im, C.-H. (2014). Evaluation of various mental task combinations for near-infrared spectroscopy-based brain-computer interfaces. J. Biomed. Opt. 19, 077005. doi: 10.1117/1.JBO.19.7.077005
Irani, F., Platek, S. M., Bunce, S., Ruocco, A. C., and Chute, D. (2007). Functional near infrared spectroscopy (fNIRS): an emerging neuroimaging technology with important applications for the study of brain disorders. Clin. Neuropsychol. 21, 9–37. doi: 10.1080/13854040600910018
Khan, M. J., and Hong, K.-S. (2015). Passive BCI based on drowsiness detection: an fNIRS study. Biomed. Opt. Express 6, 4063–4078. doi: 10.1364/BOE.6.004063
Kubota, Y., Toichi, M., Shimizu, M., Mason, R. A., Coconcea, C. M., Findling, R. L., et al. (2005). Prefrontal activation during verbal fluency tests in schizophrenia—a near-infrared spectroscopy (NIRS) study. Schizophr. Res. 77, 65–73. doi: 10.1016/j.schres.2005.01.007
Kuncheva, L. I., and Rodriguez, J. J. (2010). Classifier ensembles for fMRI data analysis: an experiment. Magn. Reson. Imaging 28, 583–593. doi: 10.1016/j.mri.2009.12.021
Kuncheva, L. I., Rodriguez, J. J., Plumpton, C. O., Linden, D. E. J., and Johnston, S. J. (2010). Random subspace ensembles for fMRI classification. IEEE Trans. Med. Imaging 29, 531–542. doi: 10.1109/TMI.2009.2037756
Kwon, J., Shin, J., and Im, C.-H. (2020). Toward a compact hybrid brain-computer interface (BCI): Performance evaluation of multi-class hybrid EEG-fNIRS BCIs with limited number of channels. PLoS ONE 15:e0230491. doi: 10.1371/journal.pone.0230491
Li, Y. J., Guo, H. X., Liu, X., Li, Y. A., and Li, J. L. (2016). Adapted ensemble classification algorithm based on multiple classifier system and feature selection for classifying multi-class imbalanced data. Knowl. Based Syst. 94, 88–104. doi: 10.1016/j.knosys.2016.09.014
Liyanage, S. R., Guan, C. T., Zhang, H. H., Ang, K. K., Xu, J. X., and Lee, T. H. (2013). Dynamically weighted ensemble classification for non-stationary EEG processing. J. Neural Eng. 10:7. doi: 10.1088/1741-2560/10/3/036007
Matcher, S. J., Elwell, C. E., Cooper, C. E., Cope, M., and Delpy, D. T. (1995). Performance comparison of several published tissue near-infrared spectroscopy algorithms. Anal. Biochem. 227, 54–68. doi: 10.1006/abio.1995.1252
Nagasawa, T., Sato, T., Nambu, I., and Wada, Y. (2020). fNIRS-GANs: data augmentation using generative adversarial networks for classifying motor tasks from functional near-infrared spectroscopy. J. Neural Eng. 17:016068. doi: 10.1088/1741-2552/ab6cb9
Naseer, N., and Hong, K.-S. (2015). fNIRS-based brain-computer interfaces: a review. Front. Hum. Neurosci. 9:3. doi: 10.3389/fnhum.2015.00003
Naseer, N., Hong, M. J., and Hong, K.-S. (2014). Online binary decision decoding using functional near-infrared spectroscopy for the development of brain–computer interface. Exp. Brain Res. 232, 555–564. doi: 10.1007/s00221-013-3764-1
Plumpton, C. O., Kuncheva, L. I., Oosterhof, N. N., and Johnston, S. J. (2012). Naive random subspace ensemble with linear classifiers for real-time classification of fMRI data. Pattern Recognit. 45, 2101–2108. doi: 10.1016/j.patcog.2011.04.023
Power, S. D., Kushki, A., and Chau, T. (2011). Towards a system-paced near-infrared spectroscopy brain–computer interface: differentiating prefrontal activity due to mental arithmetic and mental singing from the no-control stated. J. Neural Eng. 8:066004. doi: 10.1088/1741-2560/8/6/066004
Power, S. D., Kushki, A., and Chau, T. (2012). Automatic single-trial discrimination of mental arithmetic, mental singing and the no-control state from prefrontal activity: toward a three-state NIRS-BCI. BMC Res. Notes 5:141. doi: 10.1186/1756-0500-5-141
Ren, Y., Zhang, L., and Suganthan, P. N. (2016). Ensemble classification and regression-recent developments, applications and future directions. IEEE Comput. Intell. Mag. 11, 41–53. doi: 10.1109/MCI.2015.2471235
Sagi, O., and Rokach, L. (2018). Ensemble learning: a survey. Wiley Interdiscipl. Rev. Data Min. Know. Discov. 8:1249. doi: 10.1002/widm.1249
Sereshkeh, A. R., Yousefi, R., Wong, A. T., Rudzicz, F., and Chau, T. (2019). Development of a ternary hybrid fNIRS-EEG brain-computer interface based on imagined speech. Brain Comp. Inter. 6, 128–140. doi: 10.1080/2326263X.2019.1698928
Shin, J., and Im, C.-H. (2018). Performance prediction for a near-infrared spectroscopy-brain–computer interface using resting-state functional connectivity of the prefrontal Cortex. Int. J. Neural. Syst. 28, 1850023. doi: 10.1142/S0129065718500235
Shin, J., and Im, C.-H. (2020). Performance improvement of near-infrared spectroscopy-based brain-computer interface using regularized linear discriminant analysis ensemble classifier based on bootstrap aggregating. Front. Neurosci. 14:168. doi: 10.3389/fnins.2020.00168
Shin, J., Kim, D.-W., Müller, K.-R., and Hwang, H.-J. (2018a). Improvement of information transfer rates using a hybrid EEG-NIRS brain-computer interface with a short trial length: offline and pseudo-online analyses. Sensors 18:1827. doi: 10.3390/s18061827
Shin, J., Kwon, J., Choi, J., and Im, C.-H. (2017a). Performance enhancement of a brain-computer interface using high-density multi-distance NIRS. Sci. Rep. 7:16545. doi: 10.1038/s41598-017-16639-0
Shin, J., Kwon, J., Choi, J., and Im, C. H. (2018b). Ternary near-infrared spectroscopy brain-computer interface with increased information transfer rate using prefrontal hemodynamic changes during mental arithmetic, breath-Holding, and idle State. IEEE Access 6, 19491–19498. doi: 10.1109/ACCESS.2018.2822238
Shin, J., Kwon, J., and Im, C.-H. (2018c). A ternary hybrid EEG-NIRS brain-computer interface for the classification of brain activation patterns during mental arithmetic, motor imagery, and idle state. Front. Neuroinform. 12:5. doi: 10.3389/fninf.2018.00005
Shin, J., Kwon, J., and Im, C.-H. (2019). A Ternary Hybrid EEG-NIRS Brain-Computer Interface for the Classification of Brain Activation Patterns during Mental Arithmetic, Motor Imagery, and Idle State. Available online at: https://doi.org/10.6084/m9.figshare.9198932.v1 (accessed July 31 2019).
Shin, J., Müller, K.-R., and Hwang, H.-J. (2016). Near-infrared spectroscopy (NIRS) based eyes-closed brain-computer interface (BCI) using prefrontal cortex activation due to mental arithmetic. Sci. Rep. 6:36203. doi: 10.1038/srep36203
Shin, J., Müller, K.-R., Schmitz, C. H., Kim, D.-W., and Hwang, H.-J. (2017b). Evaluation of a compact hybrid brain-computer interface system. Biomed Res. Int. 2017:11. doi: 10.1155/2017/6820482
Shin, J., Muller, K. R., and Hwang, H. J. (2018d). Eyes-closed hybrid brain-computer interface employing frontal brain activation. PLoS ONE 13:e0196359. doi: 10.1371/journal.pone.0196359
Sitaram, R., Zhang, H., Guan, C., Thulasidas, M., Hoshi, Y., Ishikawa, A., et al. (2007). Temporal classification of multichannel near-infrared spectroscopy signals of motor imagery for developing a brain-computer interface. Neuroimage 34, 1416–1427. doi: 10.1016/j.neuroimage.2006.11.005
Sun, S. L., Zhang, C. S., and Lu, Y. (2008). The random electrode selection ensemble for EEG signal classification. Pattern Recognit. 41, 1663–1675. doi: 10.1016/j.patcog.2007.10.023
Sun, S. L., Zhang, C. S., and Zhang, D. (2007). An experimental evaluation of ensemble methods for EEG signal classification. Pattern Recognit. Lett. 28, 2157–2163. doi: 10.1016/j.patrec.2007.06.018
Vidaurre, C., and Blankertz, B. (2010). Towards a cure for BCI illiteracy. Brain Topogr. 23, 194–198. doi: 10.1007/s10548-009-0121-6
Von Luhmann, A., Ortega-Martinez, A., Boas, D. A., and Yucel, M. A. (2020). Using the general linear model to improve performance in fNIRS single trial analysis and classification: a perspective. Front. Hum. Neurosci. 14:30. doi: 10.3389/fnhum.2020.00030
Von Lühmann, A., Wabnitz, H., Sander, T., and Müller, K.-R. (2017). M3BA: a mobile, modular, multimodal biosignal acquisition architecture for miniaturized EEG-NIRS based hybrid BCI and monitoring. IEEE Trans. Biomed. Eng. 64, 1199–1210. doi: 10.1109/TBME.2016.2594127
Wang, Y., Li, J. H., and Li, Y. F. (2017). Choosing between two classification learning algorithms based on calibrated balanced 5 x 2 cross-validated f-test. Neural Process. Lett. 46, 1–13. doi: 10.1007/s11063-016-9569-z
Yaman, M. A., Subasi, A., and Rattay, F. (2018). Comparison of random subspace and voting ensemble machine learning methods for face recognition. Symmetry-Basel 10:651. doi: 10.3390/sym10110651
Ye, J. C., Tak, S., Jang, K. E., Jung, J., and Jang, J. (2009). NIRS-SPM: statistical parametric mapping for near-infrared spectroscopy. Neuroimage 44, 428–447. doi: 10.1016/j.neuroimage.2008.08.036
Zerrouki, N., Harrou, F., Sun, Y., and Houacine, A. (2018). Vision-based human action classification using adaptive boosting algorithm. IEEE Sens. J. 18, 5115–5121. doi: 10.1109/JSEN.2018.2830743
Zhang, Q., Brown, E., and Strangman, G. (2007). Adaptive filtering for global interference cancellation and real-time recovery of evoked brain activity: a Monte Carlo simulation study. J. Biomed. Opt. 12:4714. doi: 10.1117/1.2754714
Keywords: brain-computer interface, ensemble learning, functional near-infrared spectroscopy, linear discriminant analysis, random subspace, support vector machine
Citation: Shin J (2020) Random Subspace Ensemble Learning for Functional Near-Infrared Spectroscopy Brain-Computer Interfaces. Front. Hum. Neurosci. 14:236. doi: 10.3389/fnhum.2020.00236
Received: 10 February 2020; Accepted: 28 May 2020;
Published: 17 July 2020.
Edited by:
Selina C. Wriessnegger, Graz University of Technology, AustriaReviewed by:
M. Raheel Bhutta, Sejong University, South KoreaDang Khoa Nguyen, Université de Montréal, Canada
Usman Ghafoor, Pusan National University, South Korea
Xiaolong Liu, University of Electronic Science and Technology of China, China
Copyright © 2020 Shin. This is an open-access article distributed under the terms of the Creative Commons Attribution License (CC BY). The use, distribution or reproduction in other forums is permitted, provided the original author(s) and the copyright owner(s) are credited and that the original publication in this journal is cited, in accordance with accepted academic practice. No use, distribution or reproduction is permitted which does not comply with these terms.
*Correspondence: Jaeyoung Shin, anlzaGluMzQmI3gwMDA0MDt3a3UuYWMua3I=