

- 1Department of Experimental Psychology, University of Oxford, Oxford, UK
- 2Institut National de la Santé et de la Recherche Médicale, Paris, France
- 3Center for NeuroImaging Research, University Pierre and Marie Curie (Paris 6), Paris, France
An observer detecting a noisy sensory signal is biased by the costs and benefits associated with its presence or absence. When these costs and benefits are asymmetric, sensory, and economic information must be integrated to inform the final choice. However, it remains unknown how this information is combined at the neural or computational levels. To address this question, we asked healthy human observers to judge the presence or absence of a noisy sensory signal under economic conditions that favored yes responses (liberal blocks), no responses (conservative blocks), or neither response (neutral blocks). Economic information biased fast choices more than slow choices, suggesting that value and sensory information are integrated early in the decision epoch. More formal simulation analyses using an Ornstein–Uhlenbeck process demonstrated that the influence of economic information was best captured by shifting the origin of evidence accumulation toward the more valuable bound. We then used the computational model to generate trial-by-trial estimates of decision-related evidence that were based on combined sensory and economic information (the decision variable or DV), and regressed these against fMRI activity recorded whilst participants performed the task. Extrastriate visual regions responded to the level of sensory input (momentary evidence), but fMRI signals in the parietal and prefrontal cortices responded to the decision variable. These findings support recent single-neuron data suggesting that economic information biases decision-related signals in higher cortical regions.
Introduction
An extensive literature has considered how humans and other primates make decisions about uncertain perceptual information. In laboratory tasks, participants will often be asked to judge the presence of absence of a sensory signal embedded in random noise. Observers might receive feedback signaling whether their response was correct or not, and may even receive extra remuneration for good performance. However, they are rarely motivated to consider the relative value of the different perceptual alternatives (Swets et al., 1964; McCarthy and Davison, 1984). This contrasts sharply with the situation in the wild, where choices made to noisy or ambiguous stimuli must invariably be weighted by the costs and benefits associated with each perceptual alternative. Consider, for example, an animal judging whether an ambiguous noise is caused by the approach of a predator, or simply the innocuous rustling of the wind. Unnecessary flight (a “false alarm”) may incur a minor cost, but far more serious negative consequences may follow from ignoring the threat of a real attack (a “miss”). When perceptual judgments incur asymmetric outcomes, subjects must integrate two distinct sources of information – (1) an estimate of the strength of the sensory signal, and (2) information about the likely economic value of the perceptual alternatives.
Signal detection theory has characterized perceptual judgments of this nature as a statistical decision problem (Swets et al., 1964). For example, subjects judging whether a sensory signal was “present” or “absent” will employ a decision criterion that reflects the relative probability that the stimulus is drawn from the distribution of evidence levels associated with (1) noise alone or (2) a combination of signal and noise. Signal detection theory also offers a formal account of how the decision criterion should be adjusted in order to maximize outcome when perceptual alternatives incur asymmetric loss. Empirical evidence reveals that observers will indeed shift their criterion in order to improve their payoff, and, under repeated testing, humans (Trommershauser et al., 2008; Whiteley and Sahani, 2008) and other primates (Feng et al., 2009; Rorie et al., 2010) may even integrate information about signal strength and value in a near-optimal fashion.
However, although signal detection theory offers a simple and elegant account of an observer’s perceptual choices, it provides no framework for understanding how long the observer will deliberate before committing to one choice or another. A related but more elaborate class of model, of which one successful variant is called the “drift-diffusion model,” proposes that noisy sensory input (“momentary” evidence) is sampled in a sequential fashion, accumulating stochastically over successive cycles of decision time (Link and Heath, 1975; Ratcliff, 1978), to form a running tally known as the “decision variable” [DV] (Gold and Shadlen, 2007). This class of model allows predictions about both choices and decision latencies, because deliberation is terminated when the DV exceeds a fixed threshold or “bound.” Under the framework of the diffusion model, there are at least two mechanisms by which perceptual decisions may be biased by a rewarding or penalizing outcome. (1) Under the drift model (Figure 1A), a constant value is added to or subtracted from the DV on each successive cycle, such that evidence accumulates faster in favor of the more valuable alternative. Thus, even when momentary evidence for the presence of a sensory signal is weak or ambiguous, the DV may still be driven across the bound for the more valuable option. Under this model, sensory information will be the main determinant of choices when signal levels are high, but economic information will bias choices when sensation is a weak or ambiguous indicator of how to respond. (2) Under the prior model (Figure 1B), the origin of the dynamic evidence accumulation process is shifted toward the boundary for the favored option; in other words, prior evidence in favor of the stimulus being present is increased. Under this model, observers are thus biased to report the more valuable alternative early in the trial, or even before it is presented (Bogacz et al., 2006).
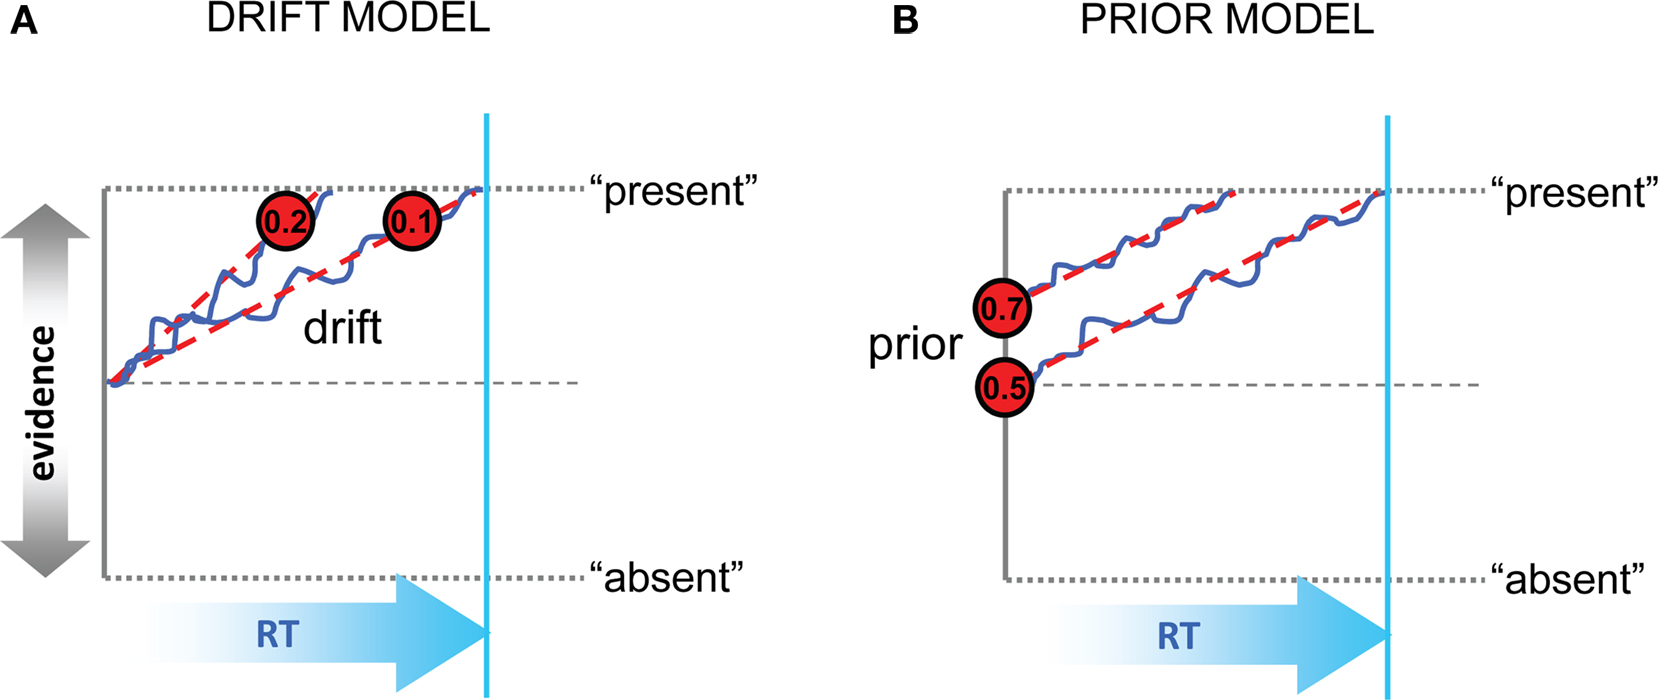
Figure 1. Schematic representation of the drift and prior models. (A) In the drift model, decisions are biased toward the more valuable option (here, “present”) by increasing the rate of evidence accumulation. Values inside the red circles show representative gain values; blue trace and red dashed trace show evidence accumulation with and without noise. Evidence toward “present” or “absent” is represented on the vertical axis, and time (RT or cycles) on the horizontal axis. The bound is represented with dashed gray lines top and bottom; another dashed line signals the equilibrium point between choices. RT for the slower of the two scenarios is shown with a cyan vertical line. (B) In the prior model, the initial estimates of evidence in favor of the more valuable option are increased, even before the onset of accumulation. Values in the red circles denote possible prior values in units of probability (i.e., p = 0.5 reflects equilibrium between the two choices). Otherwise as (A).
Recent behavioral studies that have considered the question of whether economic value biases prior or drift parameters during perceptual decisions have yielded contradictory results. Two recent papers by Newsome and colleagues support the prior model, showing that non-human primates discriminating the net direction of randomly moving dots will adjust their prior in order to maximize payoff; indeed, the monkeys seem to do so in a near-optimal fashion (Feng et al., 2009; Rorie et al., 2010). However, a psychophysical study involving human observers provides additional support for the drift account, reporting that economic concerns bias both stages of a two-step motor [two-alternative forced-choice saccadic decision] and “perceptual” [two-interval forced-choice decision, made with a button press] task. These data imply that monetary incentives act both early (before the addition of performance-limiting noise, i.e., as predicted by the prior model) and later (at a subsequent motor stage, as predicted by the drift model) (Liston and Stone, 2008). Finally, an alternative account, in which attention is switched from the payoff to the signal information in turn, has been invoked to account for psychophysical data from a same/different judgment task (Diederich and Busemeyer, 2006; Diederich, 2008). Consensus is lacking, thus, in the question of how perceptual decisions are biased by asymmetric rewards.
A related question concerns the neural mechanisms by which economic information intervenes in the sensorimotor processing stream. It could be, for example, that stimulus value is combined with signal strength early, for example in extrastriate regions such as area MT (during motion discrimination); or the two could be integrated later, at motor output stages. However, recent single-cell recordings in the non-human primate have demonstrated that neurons at an intermediate stage – the lateral intraparietal cortex (LIP) – respond additively to sensory evidence and relative reward value (Rorie et al., 2010). This finding builds upon earlier evidence that LIP firing rates are influenced by reward value when the perceptual component of the decision is trivial (Platt and Glimcher, 1999), and makes the parietal cortex an excellent candidate for integrating sensory and reward information during perceptual decision-making. Nevertheless, it remains unknown (1) whether this finding extends to human observers, and (2) whether other brain regions, such as the prefrontal cortex, might contribute to the integration of sensory and economic information. Here, using a combination of psychophysical measurements, computational modeling, and functional magnetic resonance imaging (fMRI), we ask whether (1) economic value biases perceptual decisions in humans by changing the prior or the drift of accumulation; and (2) which brain regions are involved in combining signal strength and value during perceptual decisions.
Materials and Methods
Subjects
Twenty-one neurologically normal individuals with normal or corrected-to-normal vision were recruited on campus at the Université Pierre et Marie Curie in Paris, France. Subjects all gave informed consent during an interview with our on-site physician, and were paid 240€ for their participation in three behavioral sessions and one fMRI session which took place on different days (yielding about 2,300 trials over approximately 180 min of testing).
Stimuli and procedure: behavioral sessions (1–3)
All stimuli were generated and presented using PsychToolBox (Brainard, 1997), and appeared on a uniform gray background. Each of 36 blocks was initiated with a white, square frame subtending 3.8° visual arc, followed 2 s later by the train of 16 imperative stimuli (Figure 2A). On each trial, a randomly oriented Gabor patch (a sinusoidal grating of 1.6 cycles/degree enclosed within a Gaussian envelope) embedded in 25% white noise (signal present trials, n = 288/session) or a phase-scrambled version of the Gabor patch embedded in 25% white noise (signal absent trials, n = 288/session) was presented within the frame. Gabor patch contrast varied in four intervals of 0.78%. Subjects indicated whether the Gabor patch was present or absent with a button press (deadline 1500 ms). A bonus screen, indicating winnings or losses, was shown for 2 s at the end of the block, followed by a blank screen for 3 s (Figure 2A).
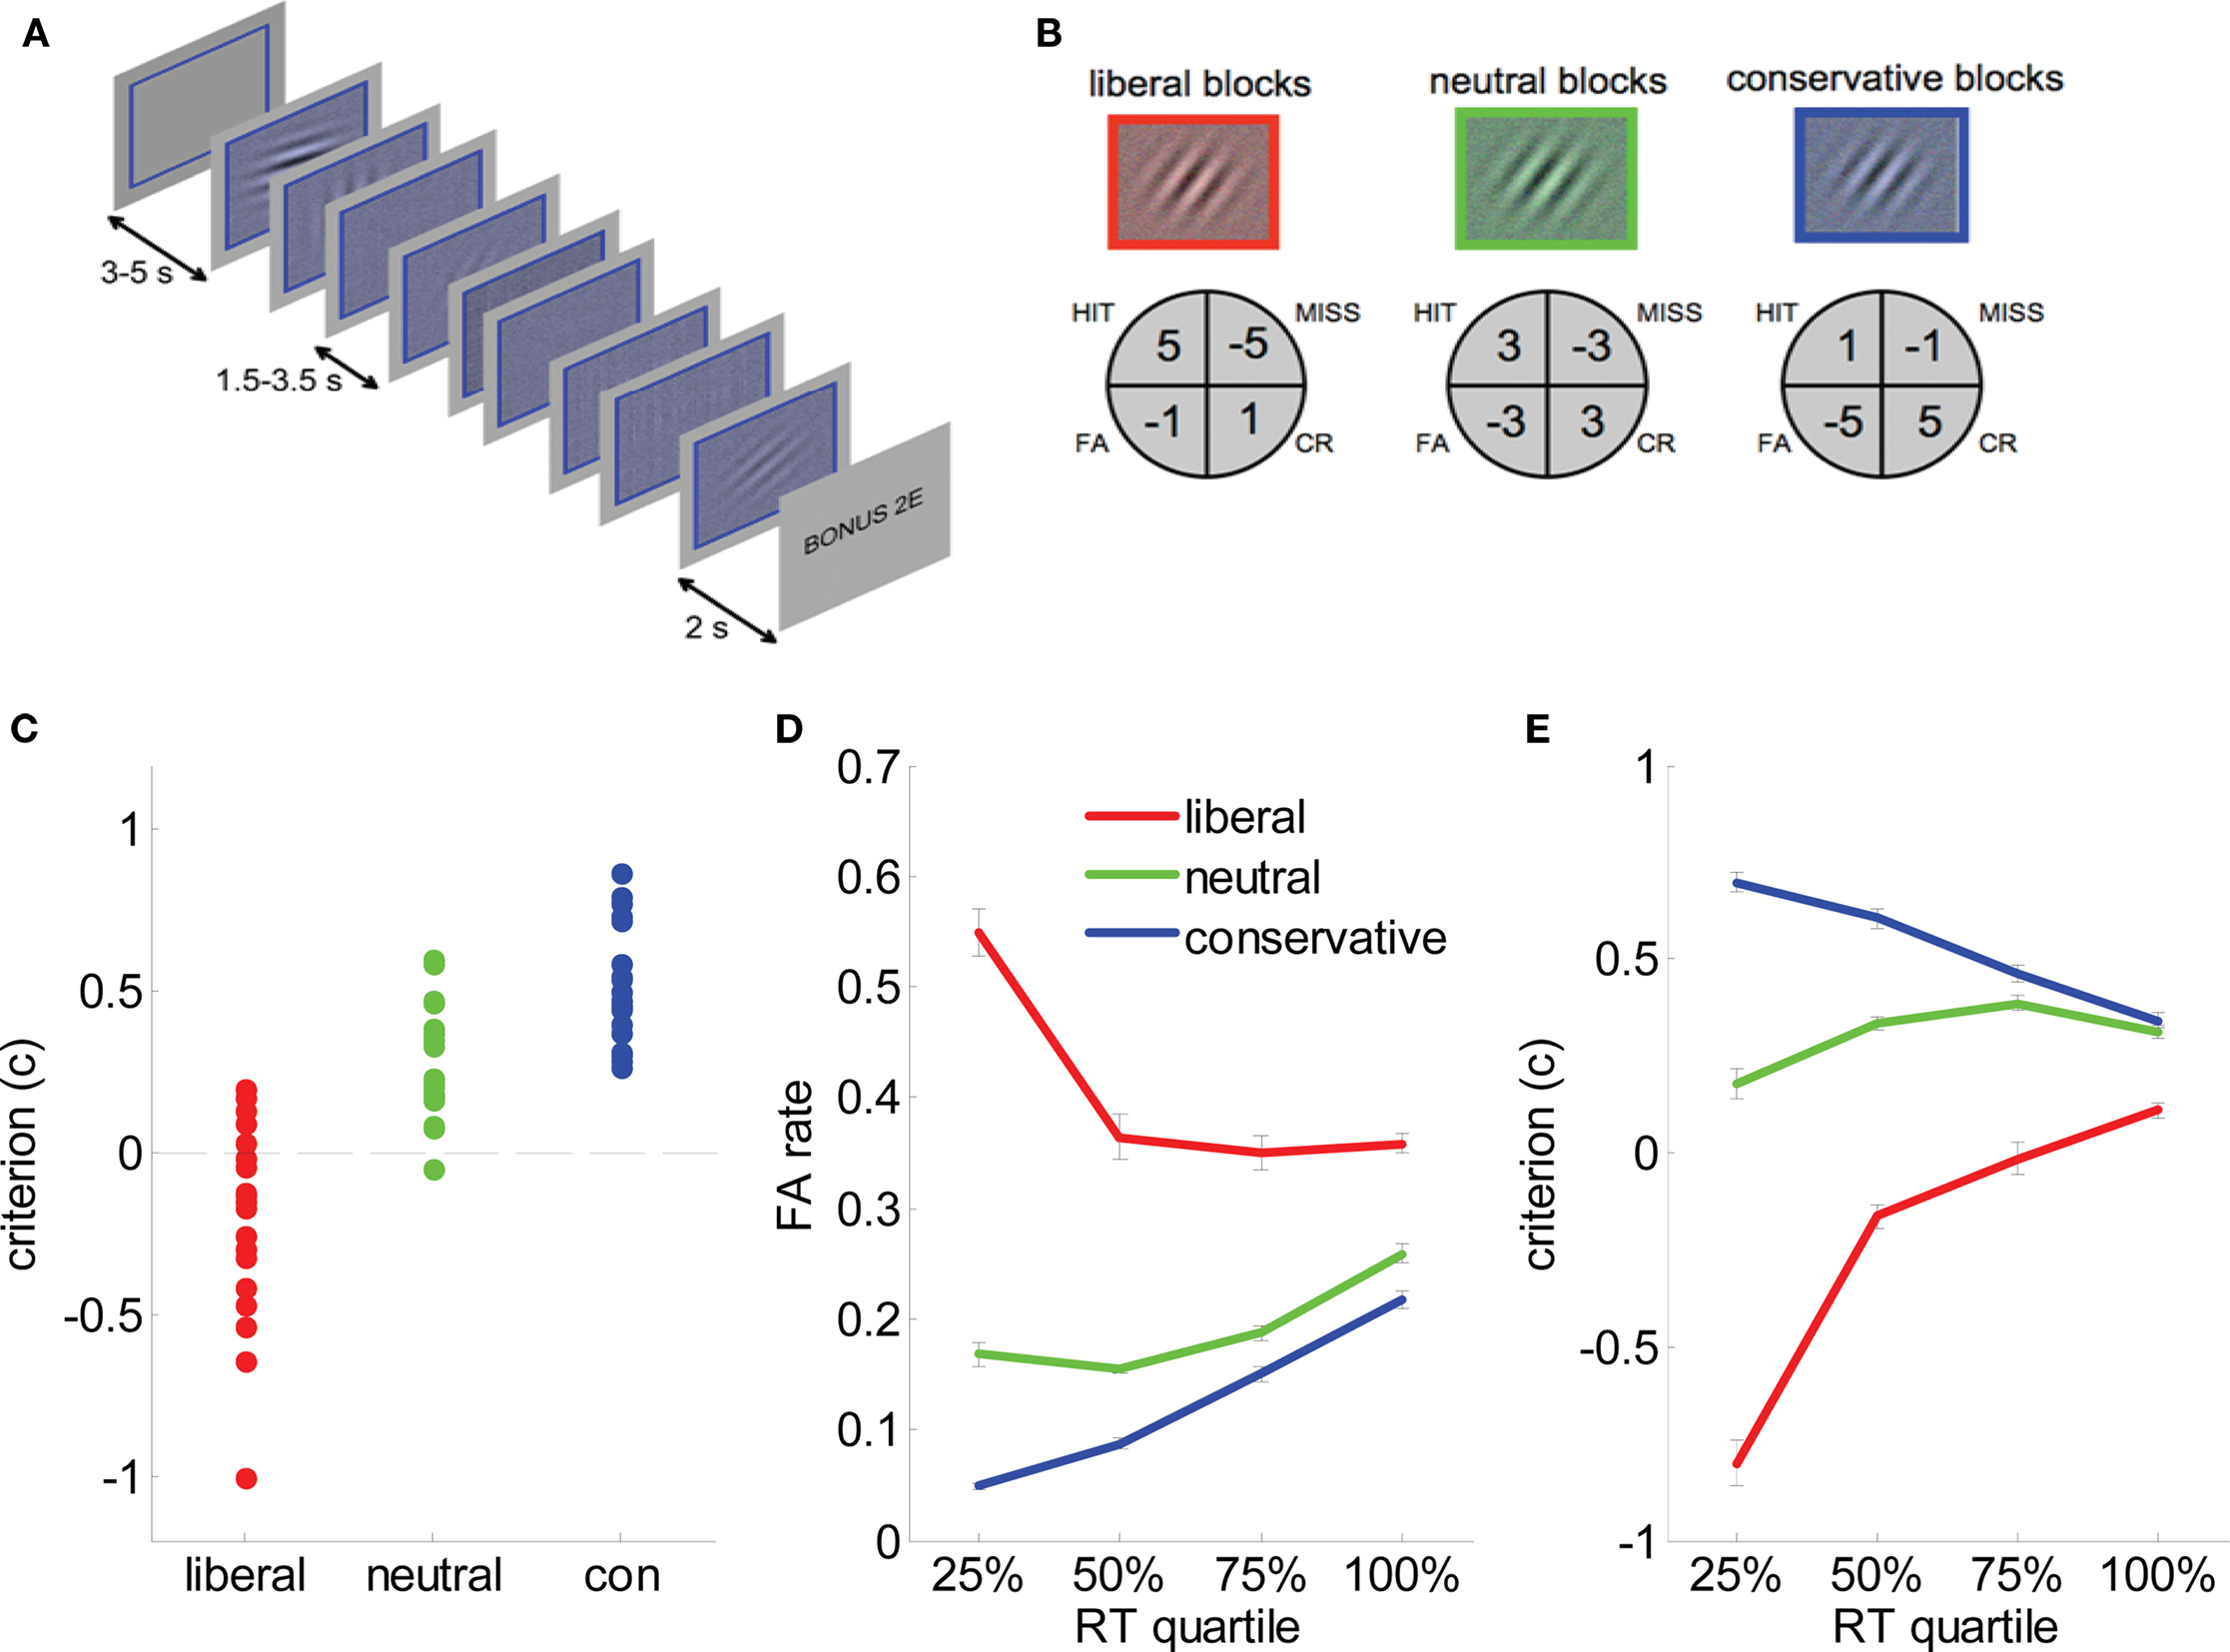
Figure 2. Task and behavioral data. (A) Experimental paradigm. Each block consisted of 8 (or 16 in behavioral sessions) successive presentations of low-contrast Gabor patches in visual noise. A colored frame and tint to the stimulus denoted bias condition (here, blue). Subjects received auditory feedback at the offset of each trial, and each block closed with a bonus screen informing the subject of their winnings/losses. In behavioral sessions on days 1 and 2, subjects additionally received visual feedback in the form of an advancing or receding “payment bar” immediately underneath the stimulus. (B) Payoff matrices for each condition. Subjects received the indicated values for hits, misses, false alarms (FA) and correct rejections (CR). (C) Estimates of criterion (c) for each individual subject in liberal (red dots), neutral (green dots), and conservative (blue dots) blocks. Black dashed line represents c = 0, i.e., no bias. (D) False alarm rate plotted as a function of reaction time quantile for liberal (red lines), neutral (green lines) and conservative (blue lines) blocks. Bars are standard error of the mean (SEM). (E). Criterion (c) plotted as a function of reaction time quantile for liberal (red lines), neutral (green lines), and conservative (blue lines) blocks. Bars are standard error of the mean (SEM).
Gabor patches carried a colored tint (red, green, or blue) denoting the relevant payoff matrix for that block (Figure 2B). We operated a token economy in which correct responses were rewarded and errors penalized with explicit feedback under asymmetric payoff conditions: liberal blocks favored “yes” responses, with hits more highly rewarded (+5 points) than CRs (+1), and misses more heavily penalized (−5) than FAs (−1). The payoff matrix was inverted on conservative blocks to favor “no” over “yes” responses; on neutral blocks all rewards and penalties were ±3 points (Figure 2B). Auditory feedback (a train of ascending [correct] or descending [incorrect] beeps corresponding to the number of points won) followed trial offset. In the first two sessions only, a virtual “piggy bank” appeared below the Gabor patch and frame, filled with five horizontally arranged gray circles which were gradually effaced to reveal gold coins (or fractions thereof), returning to gray as points were lost. Colors and the response button were fully counterbalanced across subjects.
Stimuli and procedure: fMRI session (4)
The fMRI session comprised 72 blocks of eight stimuli spread over six runs of ∼8 min, with points-per-trial doubled to maintain reward probability within block. Each run began and ended with a gray screen for 10 s; jitter was introduced between the initial frame and the onset of imperative stimuli (∼3 s, range 2–4 s), the interval among stimuli (∼2.5 s, range 1.5–3.5), and the interval between blocks (∼5 s, interval 3–7 s). No visual feedback was given in the fMRI session.
Behavioral Analyses
Data from all four sessions were pooled for behavioral analyses. RT distributions were analyzed by sorting all trials collapsed across conditions into four bins (quartiles). These quartiles captured choices that were made with latencies 0 < RT < 580 ms (25%), 580 < RT < 660 ms (50%), 660 < RT < 760 ms (75%), and 1500 > RT > 760 ms (100%). Trials with RT > 1500 were excluded from the analysis (<3%). Accuracy and RT were compared with ANOVAs and t-tests, and one-tailed alpha of 0.05 was used for all statistical analyses. Where H and F are hit rate and false alarm rate respectively, sensitivity (d prime or d′) values were calculated as

and criterion (c) values are derived from the following equation:

such that c values < 0 signaled a bias toward “yes” responses.
Model parameterization
We simulated detection judgments using a standard two-choice decision model based on the Ornstein–Uhlenbeck (OU) process (Busemeyer and Townsend, 1993). In this model, prior to the first cycle (n = 0), perceptual evidence I on each simulated trial is initiated at a value αt, drawn from a distribution of origin values with mean α and variance 0.01, corresponding to the prior level of evidence in favor of stimulus presence (in the unbiased case, α = 0). Evidence accumulation begins in earnest following an “initial wait” period w, during which evidence remained at its initial value, so that for any cycle n < w:

Subsequently, I is updated at each successive cycle t as follows:

In Eq. 2, A represents the average increase in evidence per unit time due to incoming stimulus energy (momentary evidence), cW represents Gaussian noise with mean 0 and variance c2, δ is an independent drift term, and λ scales the extent to which the rate of change depends on its current value. Positive values of λ will lead to attractor states, i.e., evidence will accumulate faster in favor of hypotheses which are already partially confirmed. Using two parameters to model the rate of accumulation (A and δ) provides a simple means of separately modeling the influence of sensory input from the stimulus (A) and other factors that might bias the rate of accumulation (δ) (e.g., economic value).
Decisions occur when I crosses one of two thresholds Z1 and Z2 such that:

Setting bounds Z1 and Z2 to 2.944 and −2.944 (log odds ratio values for p = 0.05 and p = 0.95 respectively) allowed us to easily convert any value of I to a p-value falling within the typical (two-tailed) bounds for rejecting the null hypothesis. Trial length was fixed at 1500 cycles, such that each cycle n corresponded to 1 ms of decision time in our task (see Figure 4B).
Model fitting
We searched exhaustively for combinations of α, A, δ, c, w, and λ that best described subjects’ behavioral data on liberal, neutral, and conservative blocks. Because our experiment included both signal present and signal absent trials, we generated simulated RT distributions with each combination of parameters twice: once with sensory gain A set to its current value (i.e., signal present trials, hits, and misses), and once with A = 0 (i.e., signal absent trials, FAs and CRs). Both simulations were conducted with 5000 diffusion traces (i.e., simulated trials).
We tested the hypotheses that differences in bias between liberal, neutral, and conservative conditions were due to (1) variations in prior evidence, i.e., α (prior model) (2) variations in drift rate, i.e., δ (drift model); or (3) variations in both α and δ (hybrid model). To compare among these hypotheses, we first set the remaining parameters w, c, A, and λ to those values that provided the overall best fit when held constant across conditions (w = 300 ms, c = 0.01, and A = 0.003, λ = 0.05). We then tested each model in turn by allowing the key parameter(s) under test (e.g., α, δ, or both α and δ) to vary freely across the three conditions, whilst fixing the remaining test parameters at a constant value. For example, when testing the prior model, we fixed δ to the single, best-fitting value that maximized the fit across all conditions, whilst searched for the three values of α that maximized the fit for each bias condition separately. We repeated this process for each of the three models. To ensure independence, best-fitting parameters were estimated using odd trials, and statistics comparing the fit between models were estimated using even trials.
fMRI data acquisition
Magnetic resonance images were acquired with a Siemens (Erlangen, Germany) Allegra 3.0T scanner to acquire gradient echo T2*-weighted echo-planar images with blood oxygenation level-dependent (BOLD) contrast as an index of local increases in synaptic activity. The image parameters used were as follows: matrix size, 64 × 64; voxel size, 3 × 3 mm; echo time, 40 ms; repetition time, 2000 ms. A functional image volume comprised 32 contiguous slices of 3 mm thickness (with a 1-mm interslice gap), which ensured that the whole brain was within the field of view.
fMRI data preprocessing
Data were preprocessed using SPM2 (Wellcome Department of Cognitive Neurology, London). Following correction for head motion and slice acquisition timing, functional data were spatially normalized to a standard template brain. Images were resampled to 3-mm cubic voxels and spatially smoothed with a 8-mm full-width at half maximum isotropic Gaussian kernel. A 256-s temporal high-pass filter was applied in order to exclude low-frequency artifacts. Temporal correlations were estimated using restricted maximum likelihood estimates of variance components using a first-order autoregressive model. The resulting non-sphericity was used to form maximum likelihood estimates of the activations.
fMRI data: regressors for momentary evidence and the DV
We introduce a new technique that uses the output of the drift-diffusion model to identify brain regions responding to momentary evidence (i.e., sensory input to the decision system) and to the decision variable (DV; integrated evidence over time). In our task, momentary evidence is simply reflected by the level contrast in the stimulus. We thus identified voxels responding to momentary evidence by creating a parametric regressor that encoded stimulus contrast. Identifying brain voxels responding to the DV, however, is more complicated. Drawing upon previous research (Ratcliff and McKoon, 2008), we assume that the DV is composed of (1) momentary evidence A, (2) Gaussian noise (cW), and (3) an additional component, comprising information that biases the tally of accumulated evidence. In our model (c.f. Eq. 4), these biases could arise at the origin of integration (i.e., α), or reflect drift (δ) or attraction (λ) processes that evolve during evidence accumulation. Our DV regressor is intended to identify voxels whose activity levels vary in concert with this additional bias component (3). Given that our behavioral and modeling analyses strong suggest that we can account for subjects’ decisions in the current task by biasing α toward the more rewarding option (Figure 3), in what follows we do this by varying α in our simulations. Importantly however, a similar regressor would be obtained if the bias were introduced at a point later than t = 0, or introduced gradually (e.g., if the δ model were superior).
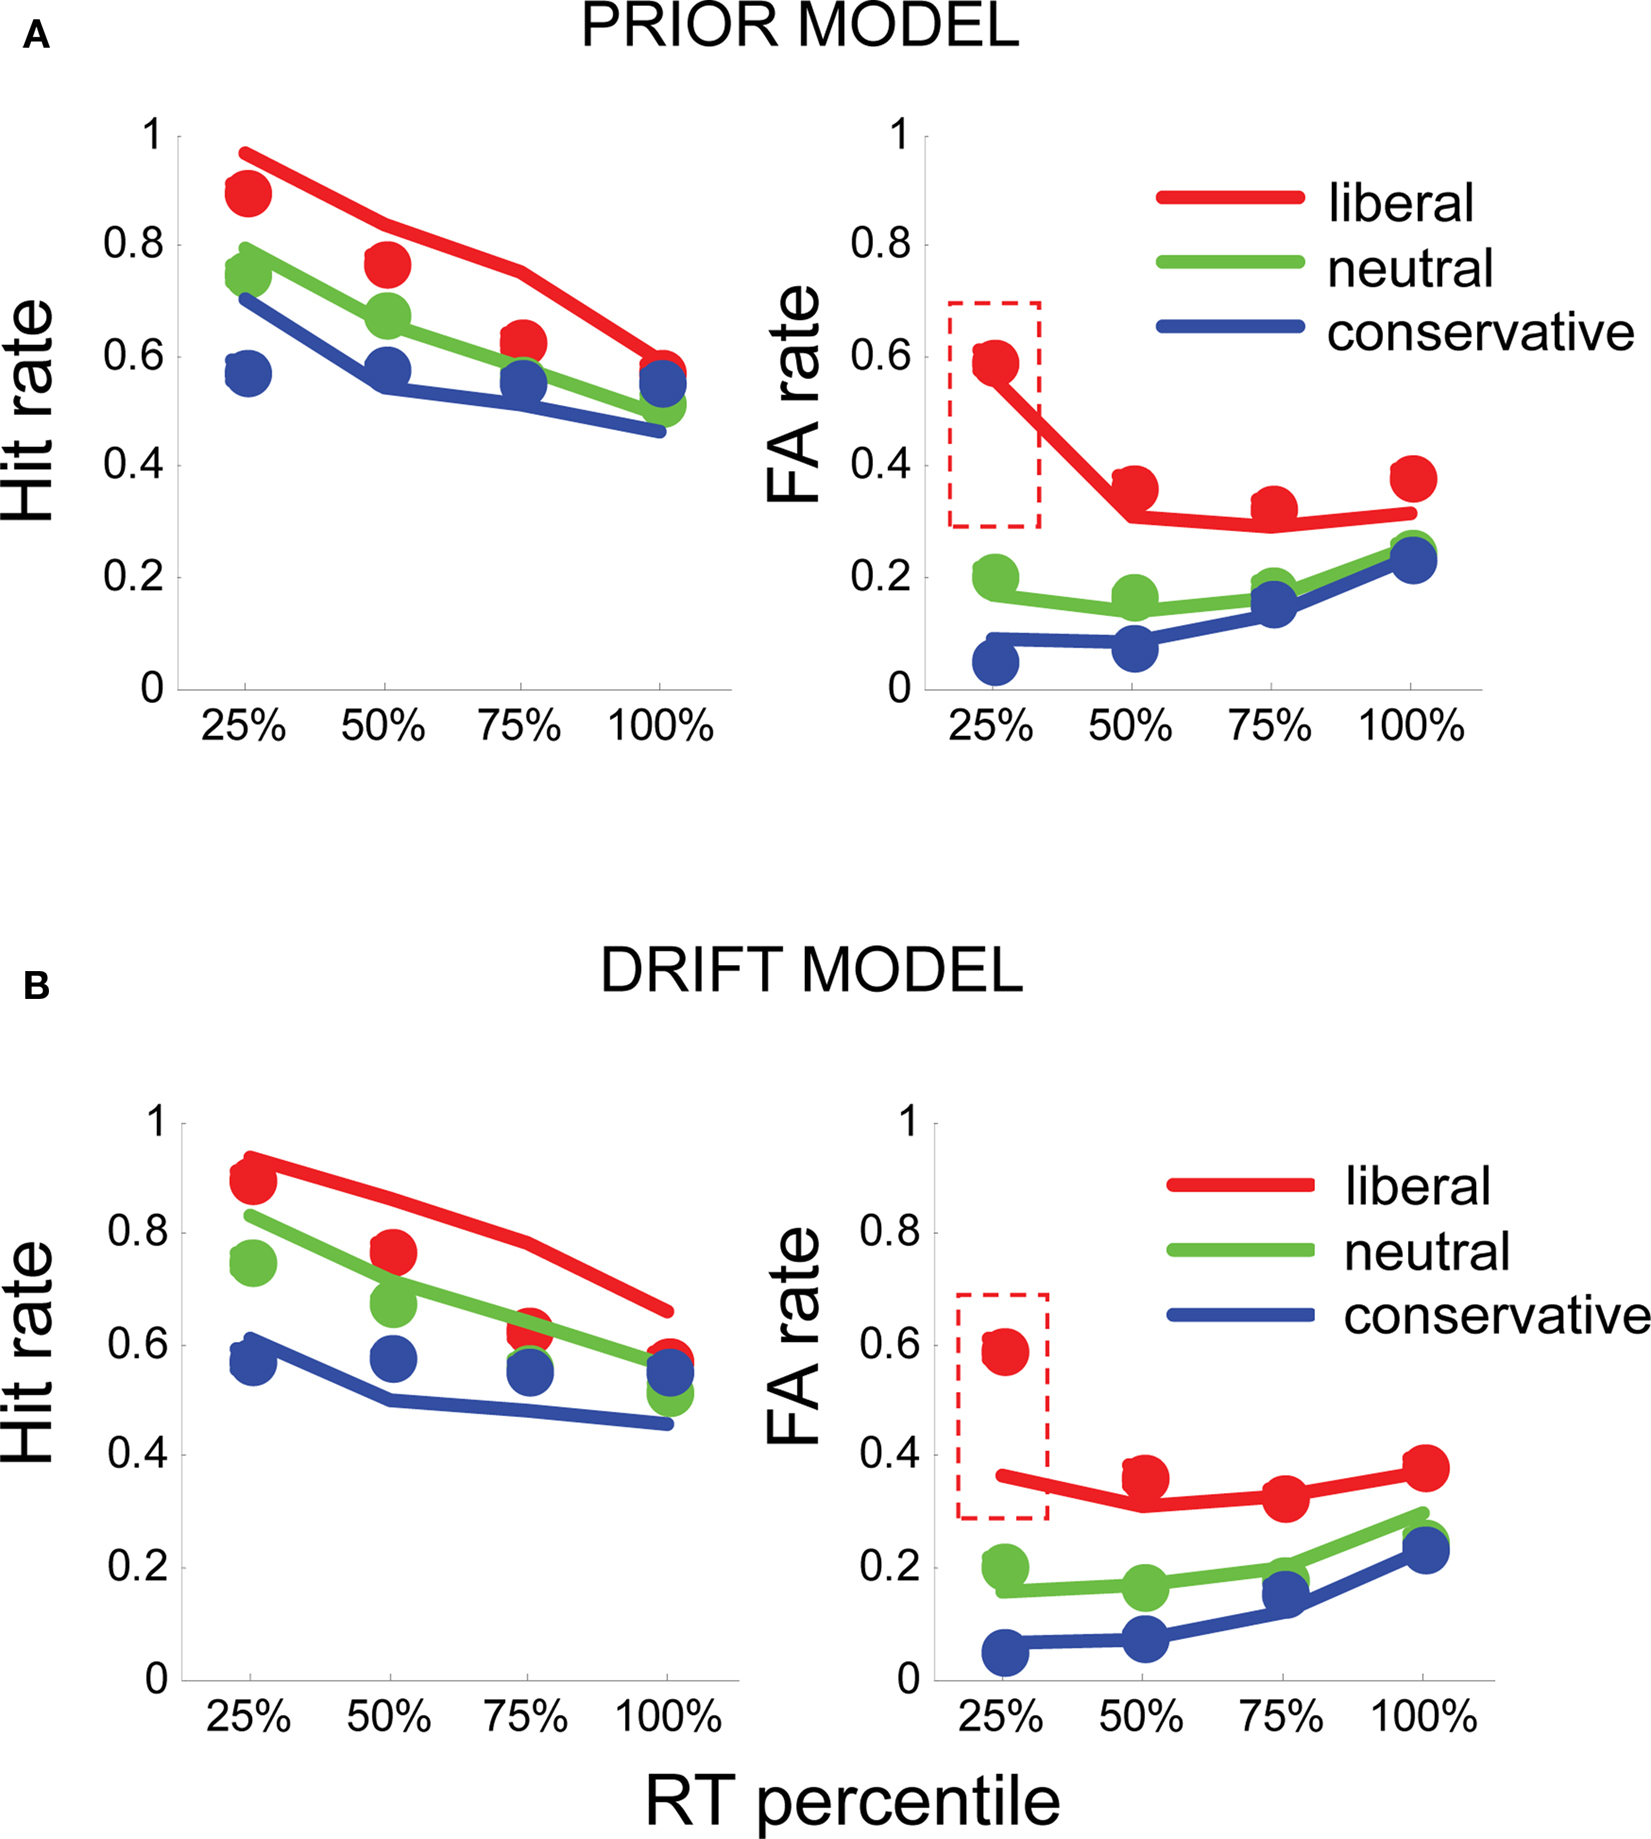
Figure 3. (A) Fits of the prior model to human hit rates (left panel) and false alarm (FA) rates (right panel), plotted for RT quartiles (fastest 25, 25–50, 50–75, and >75%) in liberal (red), neutral (green), and conservative (blue) conditions. Circles plot the mean of human subject data; lines plot the simulated data from each model variant. (B) Similarly, fits for the drift model (bottom panel) to hit rates and FA rates. Dashed red boxes highlight the fast, liberal false alarms, which are poorly fit by this model.
Our technique for building the DV regressor comprised five steps. (1) we carried out repeated simulations with our O–U model, with parameters A, c, δ, w, and λ set to the values that best described observers’ overall performance (Figure 4A), but α varying between 0.1 and 0.9. (2) Across simulations, we plotted the relationship between α and RT independently for each trial type (hits, misses, FAs, and CRs). These plots are shown in Figure 4C. (3) We found the function that best described the relationship between α and simulated RT for each trial type (a third order polynomial provided the best fit in each case). These functions are represented by the black lines in Figure 4C. (4) We used these functions to estimate values of α for each choice made by human observers in the fMRI experiment, on the basis of whether the trial was classified a hit, miss, FA or CR, and its decision latency (RT). (5) We used these values to generate a parametric regressor in which the height of the BOLD response on each trial was scaled by the relevant value of α.
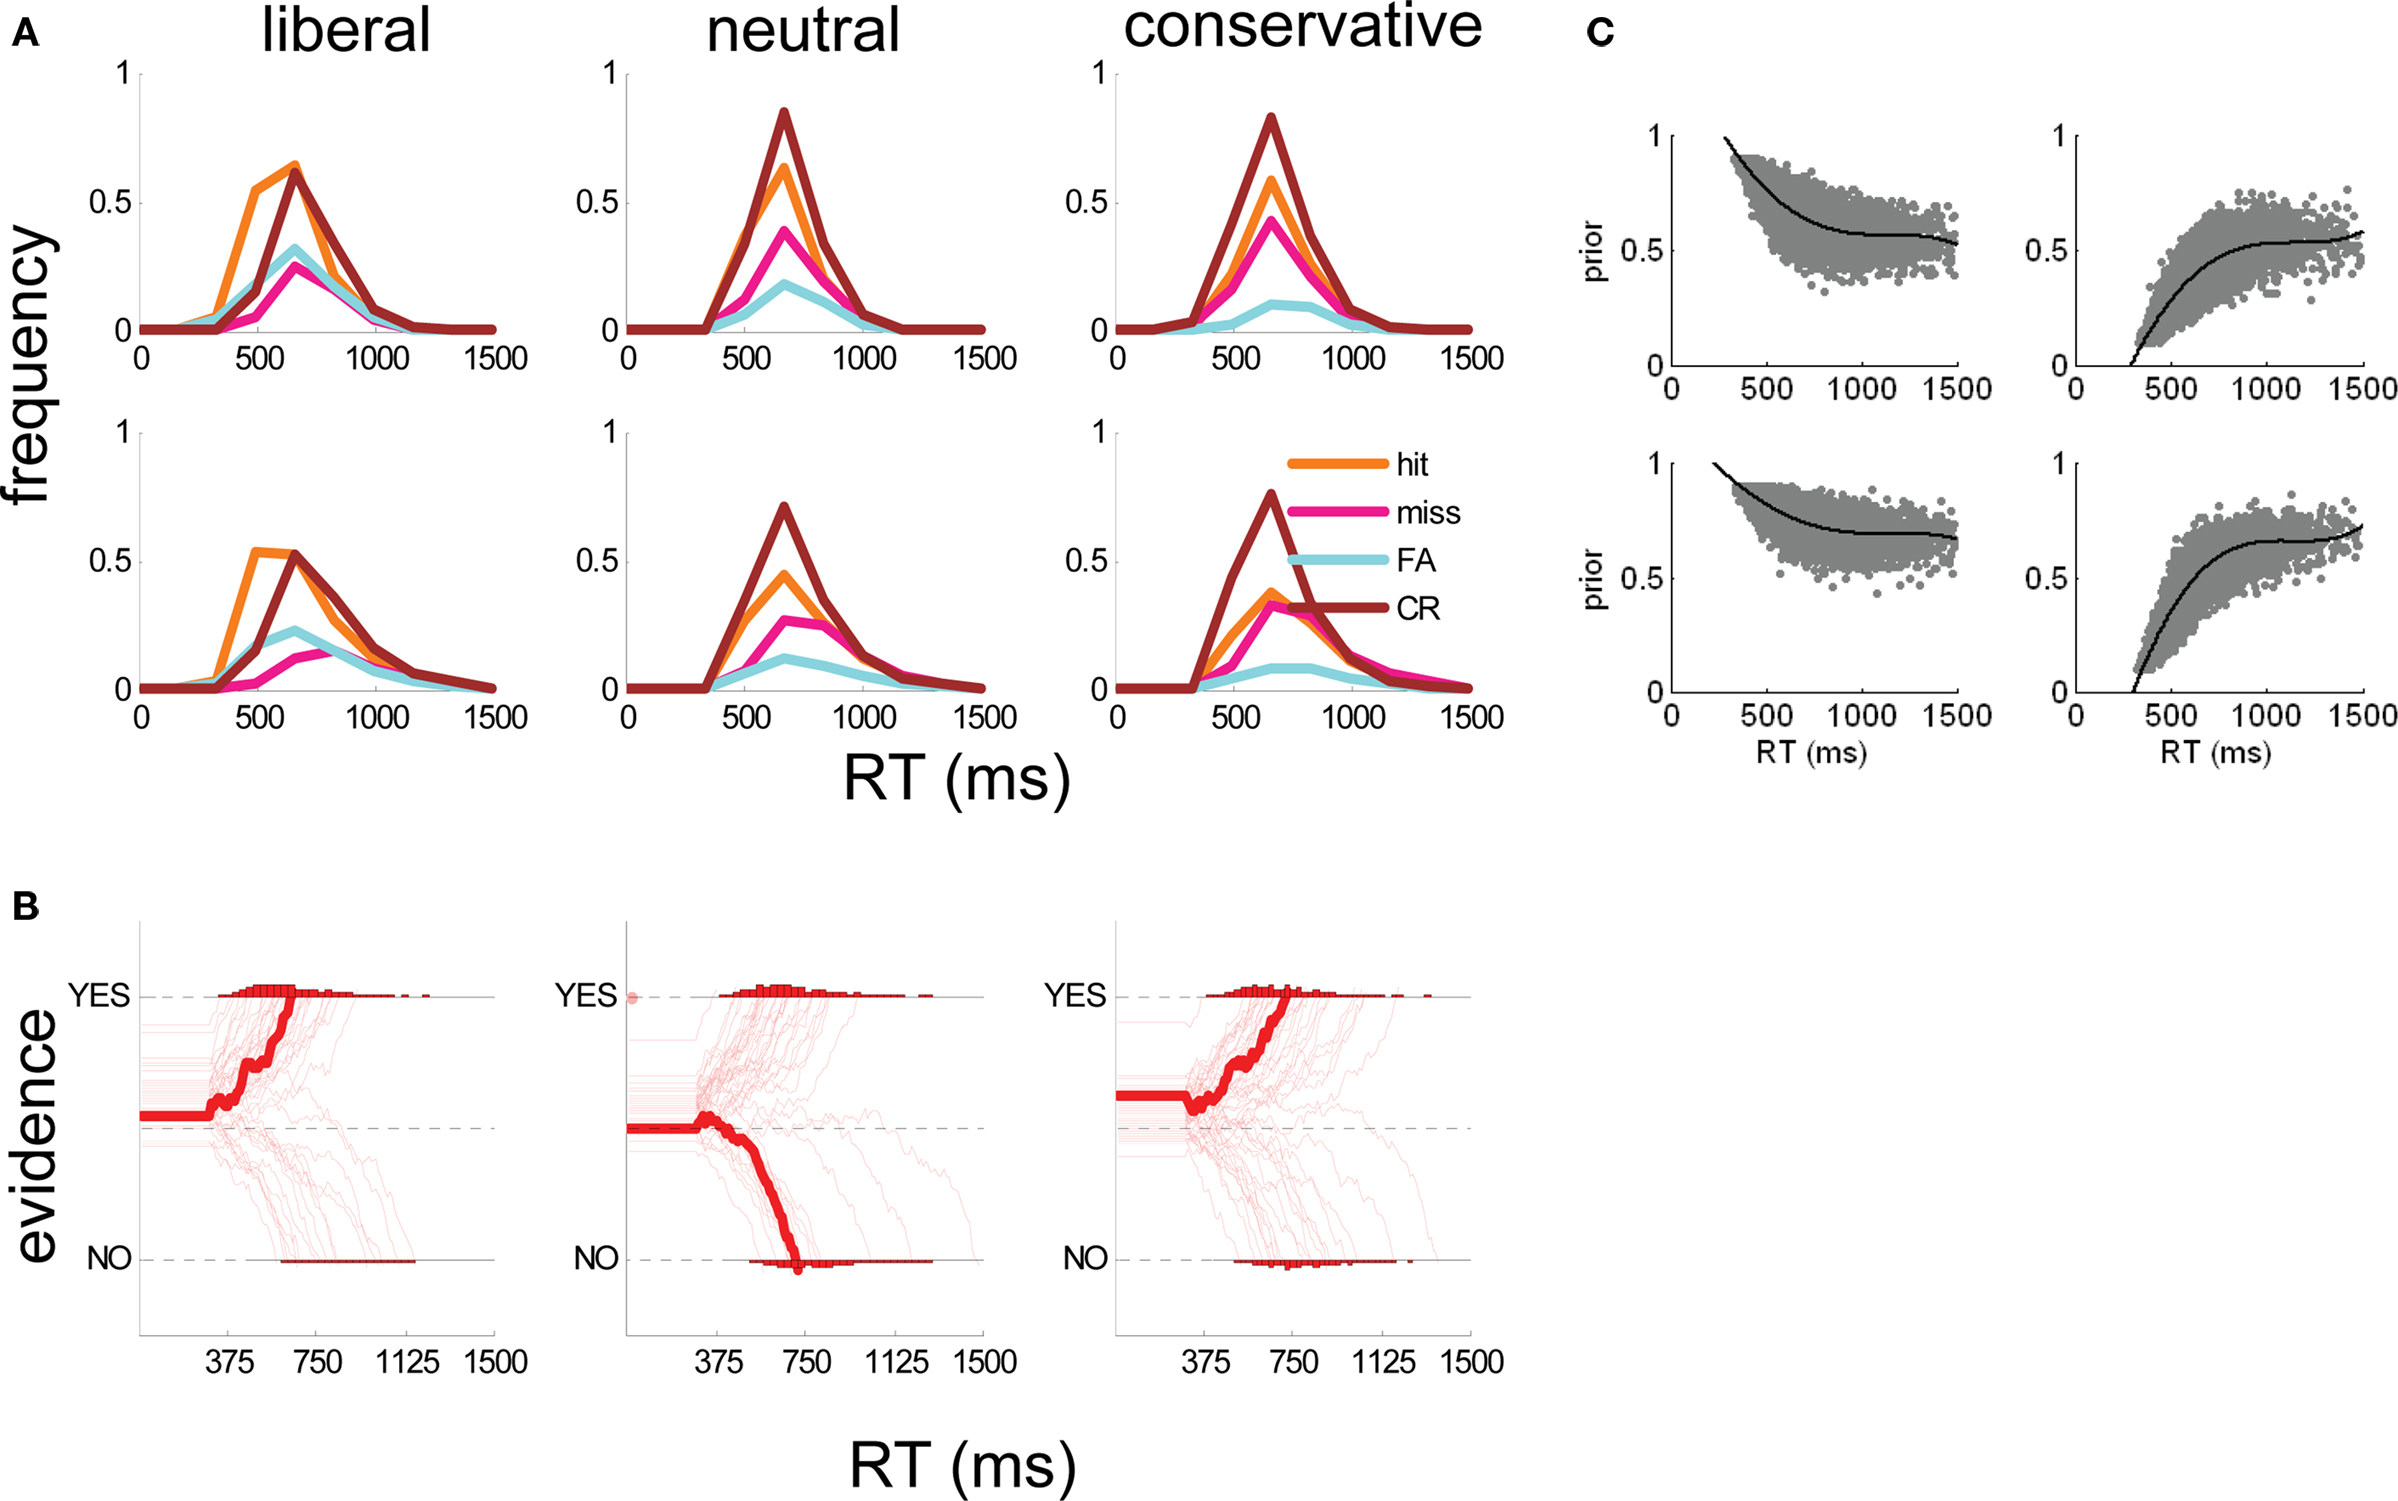
Figure 4. (A) Human subject (top panels) and simulated (bottom panels) RT distributions for hits (orange lines), misses (pink lines), false alarms (cyan lines), and correct rejections (brown lines) in liberal (left panels), neutral (middle panels), and conservative (right panels) conditions. RT distributions are normalized to reflect proportions of trials. (B) Example simulated evidence accumulation traces from the best-fitting model (signal-present trials only) in liberal (left panel), neutral (middle panel), and conservative (right panel) conditions. Each trace represents one simulated trial; the thicker trace is the median of all trials. Simulated time is shown on the x-axis and evidence (I) on the y-axis. Dashed lines indicate upper and lower bounds (for “yes” and “no” respectively) and the central dashed line represents equilibrium between the two choices. Traces bend toward either axis because the best-fitting model included an attractor value (λ) of 0.05. (C) Scatter plot of simulated α (y-axis) with RT under the parameters of the best-fitting model, for hits (top left panel), misses (top right panel), FA (bottom left), and CR (bottom right) trials. The black line shows the best fit of a 3rd order polynomial to the data for each trial type.
fMRI data: statistical analyses
This DV regressor was then entered into the design matrix alongside four other parameters of interest: (1) the main effect of stimulus (a regressor encoding every trial); and further parametric regressors encoding (2) momentary evidence, i.e., each event scaled by its contrast (3) RT and (4) reward obtained (number of points per trial) Each of these was a parametric regressor that modeled each trial as an event of duration 0s convolved with the canonical hemodynamic response, and scaled by the relevant trial-by-trial values. Additionally, we entered several nuisance regressors aimed at capturing variance in the BOLD response associated with events that were not of interest to us, such as (1) onset of the frame for each block and (2) the bonus screen signaling total reward obtained in a block, as well as further nuisance regressors (3) derived from the fMRI signal averaged across 1000 randomly selected voxels from outside the brain, and (4–9) realignment parameters from motion correction. No orthogonalization of regressors was employed. The DV regressor was not reliably correlated with any of the other parameters of interest (all r-values < 0.35, p-values > 0.05). The statistical significance of each regressor at each voxel was assessed at the second (between-subjects) level with mass t-tests. The resulting SPMs were all corrected for multiple comparisons using the False Discovery Rate method (Genovese et al., 2002) or uncorrected p < 0.001, whichever was the more conservative threshold.
In order to explore further how the brain regions identified by these parametric regressors responded during the task, we conducted more conventional factorial ANOVA analyses on the data averaged across those voxels significantly activated by the prior evidence regressor, with bias condition (liberal, neutral, conservative), and trial type (hit, miss, FA, CR) as orthogonal factors (Figures 5B,C). Importantly, because these ANOVA analyses are reported for the peak voxel selected from the parametric analyses described above, they are not independent from these analyses, and as such, were not intended to support new statistical claims concerning the relevant clusters (Kriegeskorte et al., 2009). The likelihood that the identification of these clusters reflects a type-1 error has already been assessed by the earlier analyses in conjunction with a stringent method for correcting for multiple comparisons (Genovese et al., 2002). Rather, the point of these subsequent analyses is to determine why the regressors were responding to the DV regressor generated above. This type of analysis is particularly important when brain regions are identified by their correspondence with a regressor derived from a computational model, which might be correlated with other experimental factors. For example, in our experiment, cortical activation in concert with the DV regressor could reflect a preference for liberal over conservative conditions, or a preference for “yes” over “no” responses, or a combination of these factors. For these ANOVA analyses, a new design matrix was constructed with 12 regressors, corresponding to hit, miss, FA, and CR trials in liberal, neutral and conservative conditions. The nuisance regressors described above were also included. Parameter estimates were calculated for each of the 12 regressors of interest for each subject; and factorial ANOVAs were performed to assess statistical reliability of bias condition or trial type.
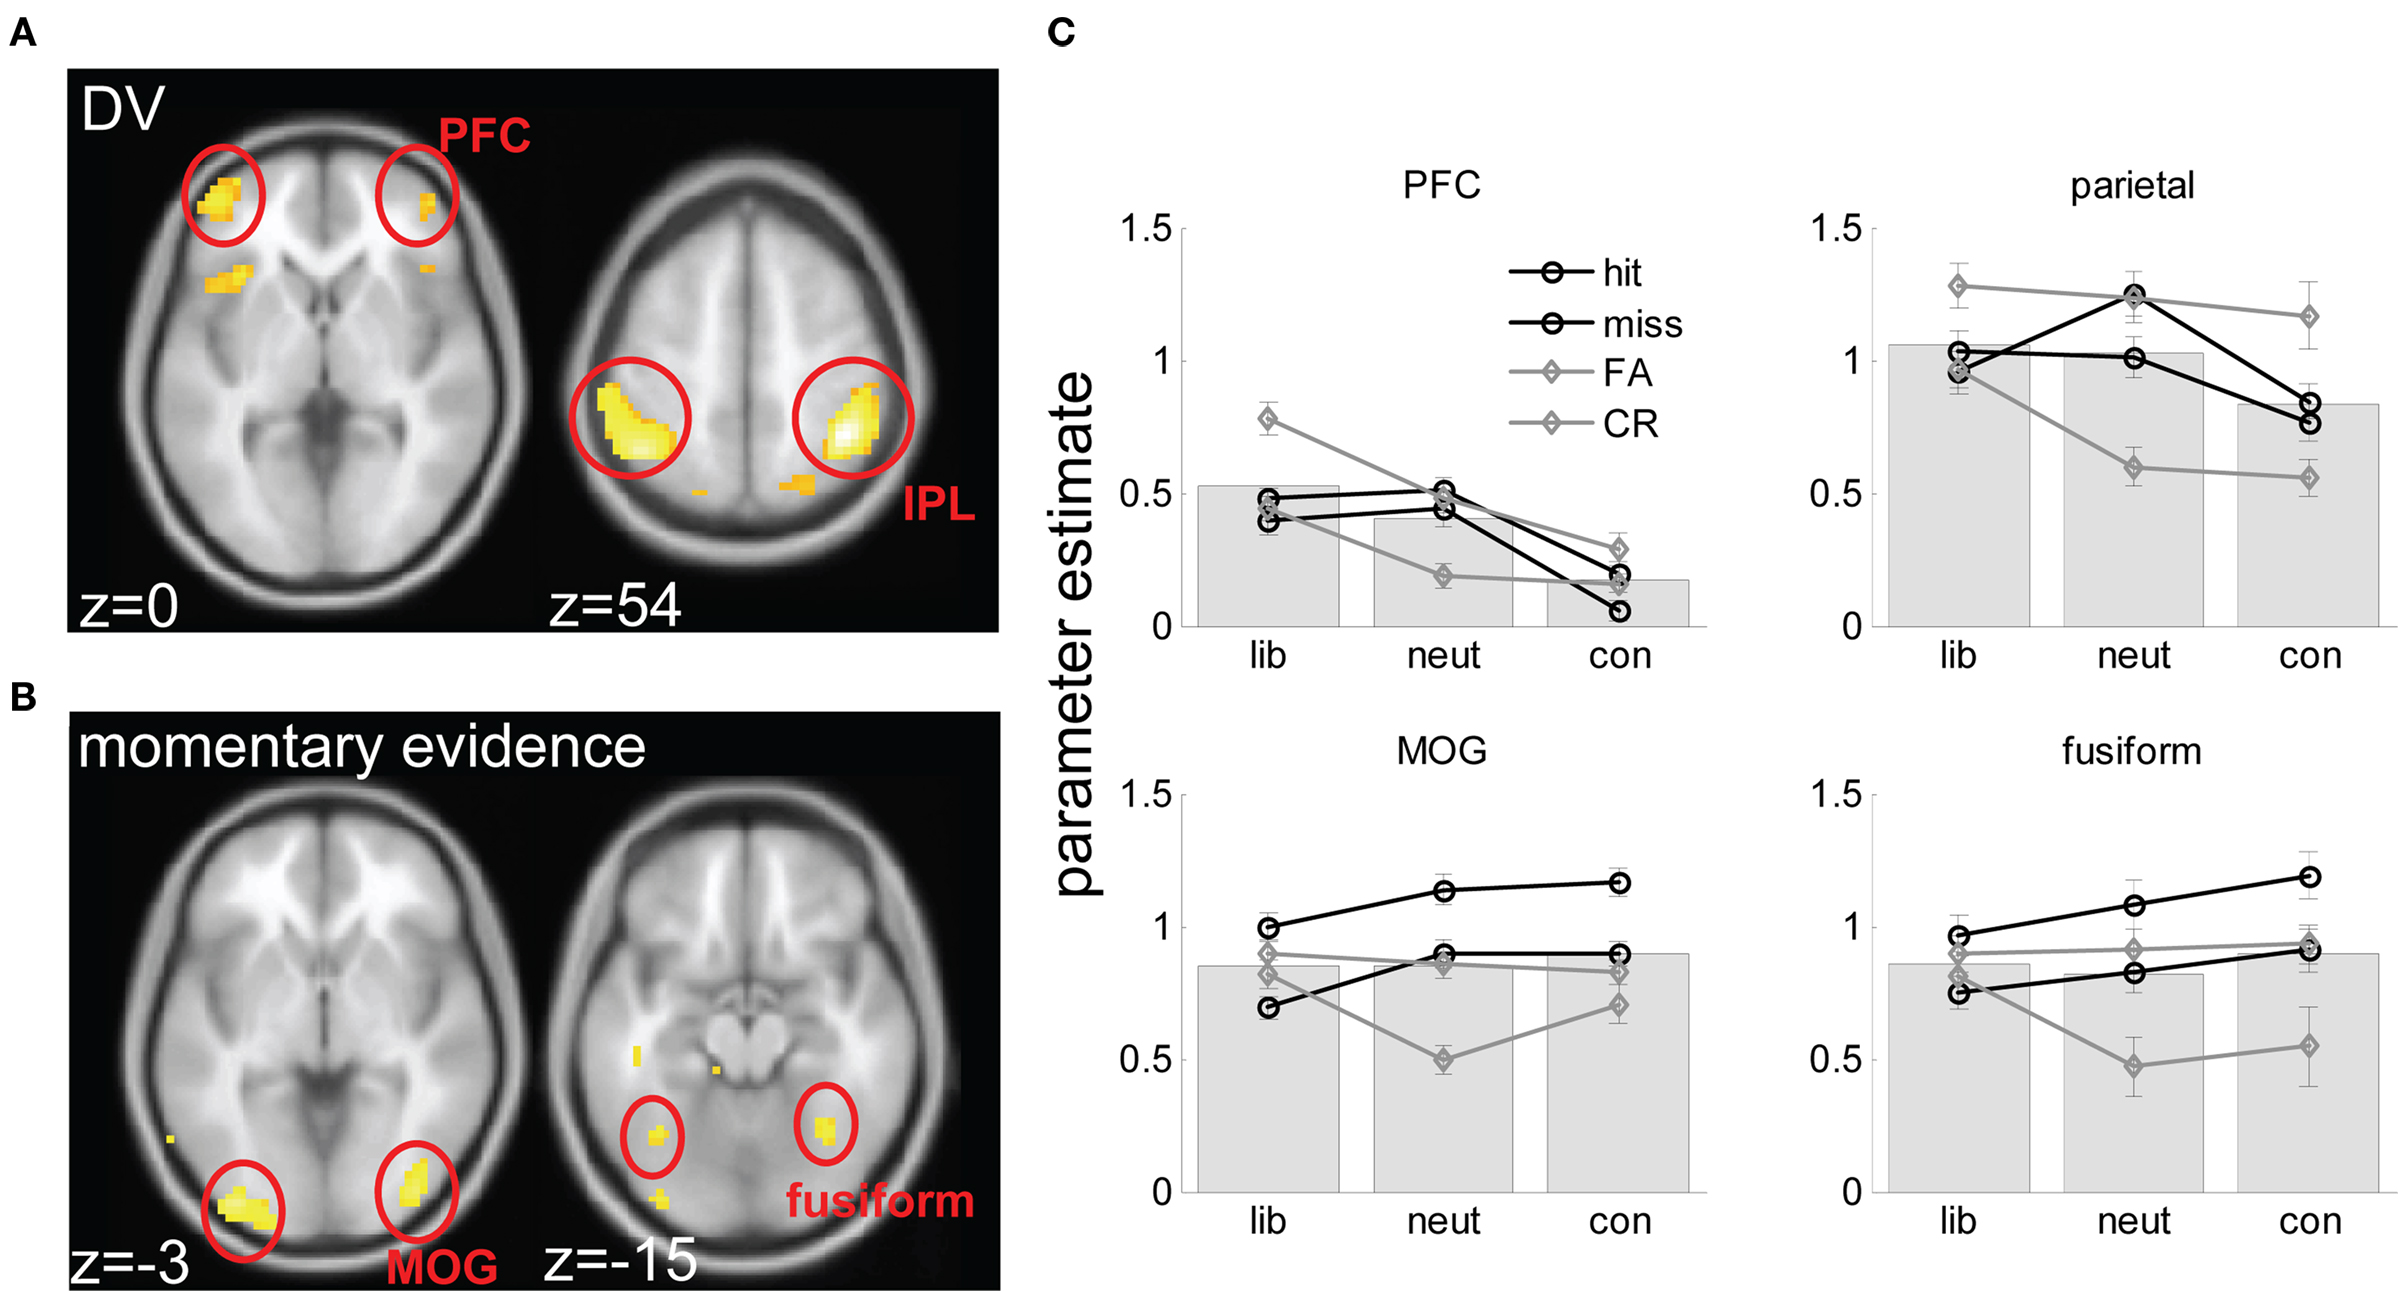
Figure 5. Brain imaging results. (A) axial views of voxels responding to the DV rendered onto a standard brain in the space of the Montreal Neurological Institute (MNI), at an FDR-corrected threshold of p < 0.05. Slices are labeled with their coordinates in the z plane at the bottom left-hand corner. (B) A comparable plot for voxels responding to momentary evidence. (C) Parameter estimates (from factorial ANOVA analyses) for hits, misses, FA and CR trials in liberal, neutral and conservative blocks, averaged across voxels in each of the four clusters (prefrontal cortex – PFC; intraparietal lobule – IPL; middle occipital gyrus – MOG, and fusiform gyrus. Gray lines are for signal absent trials, black lines for signal present trials; full lines for “yes” responses, dashed lines for “no” responses. Underlying bars illustrate mean parameter estimates for liberal, neutral and conservative blocks.
Results
Behavioral Data
Human sensitivity (d′) and criterion (c) measures were derived in a standard fashion from normalized hit and FA rates (Macmillan and Creelman, 1991) (see methods). For a d′ of 1.06 ± 0.14 overall, c values were −0.2 ± 0.29, 0.28 ± 0.17, and 0.51 ± 0.18 for liberal, neutral and conservative blocks respectively (F = 62.7, p < 1 × 10⁻⁷), indicating that the payoff manipulation successfully induced a bias toward “yes” responses on liberal blocks, and toward “no” responses on conservative blocks (Figure 2C). Bias was strongest for those trials with the shortest reaction times (RT). Dividing RTs for each block into quantiles, FA rates rose to about 60% for the fastest 25% of trials (RT < 580 ms) on liberal blocks. Significant quartile × condition interactions were observed for FA rate (F(6,120) = 19, p < 1 × 10⁻⁹), hit rate (F(6,120) = 18, p < 1 × 10⁻⁹) and criterion (F(6,120) = 49, p < 1 × 10⁻⁹) (Figures 2D,E). These fast liberal “yes” responses were not particularly likely to be preceded by another “yes” response (p > 0.3), indicating that unlike “express” saccades (Carpenter and Williams, 1995), impulsive responses were not merely fast response repetitions (Anderson et al., 2008). Subjects’ overall perceptual sensitivity also varied across blocks, with subjects performing better in conservative (d′ = 1.28 ± 0.14) than in neutral (d′ = 1.15 ± 0.14) or liberal (d′ = 0.98 ± 0.14) blocks. No overall differences in RT were observed between conditions (p > 0.1).
Model fitting
An exhaustive search of parameter space revealed that the best-fitting solution in which c, w, A, and λ were held constant across conditions was w = 300, c = 0.01, A = 0.0003, and λ = 0.05). These correspond to non-decision time of 300 ms, and an accumulation process that proceeds in steps that have a mean of log odds = 0.003 and a standard deviation of log odds = 0.01 (per millisecond of simulated decision time), and an additional increment of 5% of current evidence added or subtracted from the total on each step, according to whether the trace was currently closer to the upper or lower bound.
Model comparison
The prior model, in which prior evidence (α) was free and drift (δ) was fixed, provided a good description of the data. α values that best fit the data were α = 0.58, liberal blocks, α = 0.32, in neutral blocks, and α = 0.28 in conservative blocks (these correspond to a priori probabilities of signal presence of 0.64, 0.58, and 0.56, where 0.5 reflects an equilibrium between “yes” and “no”). This model accurately captured the pattern of early bias in the liberal condition, as well as providing a good account of the hit rates and d′ observed in the experiment (Figure 3A).
Moreover, the prior model performed favorably in comparison with the drift model, in which drift rate (δ) was allowed to vary freely, but α was fixed at its best value for all conditions. The drift model yielded drift parameters of δ = −0.002 (liberal blocks), δ = −0.003 (neutral blocks), and δ = −0.004 (conservative blocks). However, although this model captured the overall total false alarm rate in each condition, it was unable to account for the early, liberal false alarms observed in the human data (Figure 3B). Accordingly, log-likelihood values for the drift model totaled −84, whereas those for the prior model totaled −79.1, indicating that varying the prior offered a better description of the data than varying the drift (χ2 = 9.8, p < 0.009). Unsurprisingly, the hybrid model, in which both δ and α were free, also provided a good fit to the data (log likelihood = −78.7) but despite the extra-free parameter, this model did not outperform the prior model (p = 0.67). For completeness, in Figure S2 in Supplementary Material, we show fits to overall mean reaction times in each condition.
Functional brain imaging
At what stage in the sensory processing stream might signal strength and value be combined to form a decision variable? We conducted fMRI analyses geared to identifying brain regions involved in representing (1) momentary evidence (i.e., level of sensory input), and (2) accumulated evidence (i.e., the decision variable; see Materials and Methods). In line with previous findings, we predicted that whereas momentary evidence would activate the extrastriate visual cortex, neural correlates of the DV would be found in the parietal cortex (Platt and Glimcher, 1999; Hanks et al., 2006; Rorie et al., 2010).
Brain imaging analyses supported both of these predictions. Momentary evidence, corresponding to the contrast of the stimulus in our paradigm, correlated strongly with BOLD activity in the extrastriate visual cortex, falling on the middle/inferior occipital gyri (MOG) and peaking at coordinates −36, −87, −9 (T = 5.90, p < 0.00001) and 39, −81, −6 (T = 5.18, p < 0.0001) on the left and right respectively. A cluster was also found more anteriorly, on the fusiform/lingual gyrus bilaterally, with peaks at −36, −60, −15 (T = 3.98, p < 0.001) and 27, −48, −21 (T = 5.51, p < 0.0001) on the left and right respectively. Only one cluster outside the visual cortex, on the left parahippocampal gyrus, survived thresholding at p < 0.001 uncorrected (peak: −24, −3, −21; T = 4.15, p < 0.001).
By contrast, the parametric regressor encoding estimates of the DV (see Materials and Methods) correlated with voxels in the parietal cortex (peak left: −48, −48, 45, T = 6.65, p < 0.00001; peak right: 48, −33, 45, T = 5.41, p < 0.0001). These clusters fell principally on the inferior parietal lobule (IPL) (76% of activated voxels) but distinct clusters in the superior parietal lobule (SPL) were also identified (left: −21, −72, 48, T = 4.69, p < 0.0001; right: 27, −69, 48, T = 4.61, p < 0.0001). In the prefrontal cortex, the DV regressor activated voxels falling on the border of the lateral frontopolar and orbitofrontal cortices (BA 10/11). Maxima for these clusters fell symmetrically at 45, 51, 0 (T = 4.15, p < 0.001) and −45, 51, 0 (T = 4.60, p < 0.0001) respectively. Additional clusters were found in the bilateral anterior insular cortex at −30, 21, −6 (T = 4.69, p < 0.0001) and 42, 24, −6 (T = 4.57, p < 0.0001).
Factorial analyses of brain imaging data
As noted above, correlation with the DV regressor might be driven by a preference for yes > no trials, or for liberal > conservative trials, or a combination of these effects and others. We used ANOVA-based analyses to determine more clearly why voxels responding to the DV regressor did so, and in particular to rule out spurious explanations, such as the possibility that parietal cortex and PFC correlation with the DV regressor could be accounted for by a response on any condition requiring integration of perceptual and reward information (i.e., both liberal and conservative > neutral trials). Note that these analyses are not independent from the parametric analyses described above (see Materials and Methods for a fuller discussion of this point). Combined bar and line plots of fMRI responses averaged over activated voxels in the visual cortex, IPL, and PFC clusters are shown in Figure 5B. As can be seen, the IPL showed a pattern of liberal > neutral > conservative blocks (F(2,40) = 6.28, p < 0.006) with individual contrasts for liberal > neutral (t(20) = 2.39, p < 0.05) and neutral > conservative (t(20) = 3.42, p < 0.01) reaching significance. Similar results were observed in the PFC (F(2,40) = 18.6, p < 0.00001; liberal > neutral, n.s.; liberal > conservative (t(20) = 2.97, p < 0.01; neutral > conservative, t(20) = 2.99, p < 0.01). These factorial analyses rule out the possibility that parietal correlation with the prior evidence regressor is a spurious artifact of its activation by both liberal and conservative blocks. Both IPL and PFC clusters additionally showed an effect of yes > no (IPL: t(20) = 4.24, p < 0.001; PFC t(20) = 4.7, p < 0.0001). These results suggest that the involvement of the IPL and PFC regions in biased perceptual decision-making is driven both by a propensity to respond more on liberal than neutral or conservative blocks, and to respond more “yes” than “no” trials.
Adopting the same ANOVA approach for visual regions responding to the momentary evidence regressor, no differences between conditions (liberal vs. neutral vs. conservative) were observed. Rather, both the fusiform and MOG regions responded reliably to trial type, with greater responses observed for hits than for misses, FAs or CRs (all p-values < 0.01).
fMRI responses to reward and RT
Brain regions correlated positively with RT were found in the pre-supplementary motor area and anterior insula bilaterally; and signal increases in the ventral striatum, ventromedial prefrontal cortex, and posterior cingulate cortex varied positively with the reward obtained. These results (which are described in detail in accompanying Figure S1 in supplementary material) confirm established findings, and are not discussed here in further detail.
Discussion
Our behavioral data indicate that (1) asymmetric rewards principally bias the fastest, not the slowest, perceptual judgment trials; and that (2) this phenomenon is best explained by a prior decision model, in which reward biases the origin of evidence accumulation, rather than a (later) drift toward either bound. A general interpretation of the success of the prior model is that observers first consider the value of the perceptual alternatives (perhaps even before the stimulus has been presented) and that the accumulation of sensory evidence takes place in the context of the likely reward or punishment associated with each choice. This finding runs contrary to established theories of detection and recognition proposing that response options are weighted by their probable outcome only once evidence accumulation is complete (Henderson and Hollingworth, 1999; Lu and Dosher, 2008).
At first glance, it might appear curious that rewards bias the origin of diffusion, given that, under the OU model, this parameter can be interpreted as indicating the prior probability of occurrence of each perceptual alternative (which does not change as a function of choice economic outcome). However, it has been demonstrated that under the drift-diffusion model generally, and the OU model specifically, varying the prior is the optimal policy under asymmetric loss, even if additional variation of the drift parameter might be required to optimize reward harvesting when the coherence levels are randomly intermixed within a block, as here (Bogacz et al., 2006). Notably, we found no evidence that the hybrid model, in which both prior and drift parameters were allowed to vary, provided a statistically better fit to the data than the prior model. Our results are thus consistent with recent reports indicating that the prior model offers the best explanation of how rewards bias perceptual decisions (Feng et al., 2009; Rorie et al., 2010).
Admittedly, certain features of our task complicate the comparison between our data and previous research. For example, in our task, payoff remained constant only over short blocks of 8 or 16 trials, requiring subjects to switch policy rapidly. This feature may have contributed to the finding that our subjects under-shifted rather than over-shifted (Rorie et al., 2010) their prior – i.e., they were “sluggish” to adapt their new policy to the demands of the current block. Additionally, we imposed trial deadline (at 1500 ms). Recent modeling work has calculated the optimal decision policy for decisions with finite but uncertain temporal horizons, revealing that subjects should decide sooner under conditions when more time has elapsed, or under conditions where the deadline is more uncertain, or breaching the deadline is more costly (Frazier and Yu, 2008). It is likely that the imposition of a penalizing deadline encouraged our subjects to respond more urgently, given temporal uncertainty about the time elapsed. A formal analysis of this problem is beyond the scope of this paper. However, although previous experiments did not impose an explicit deadline, in much primate research a comparable deliberation cost may be evident in the mounting likelihood that the animal will inadvertently break fixation and abort the trial. In the wild, too, deliberation carries with it an increasing likelihood that the available opportunities will be withdrawn, or the costs multiplied, if a decision is not reached quickly. For example, when driving down a winding road at night, failure to decide whether the road veers to the left or the right can be just as fatal as making an erroneous choice. Given that deliberation invariably carries a cost of its own, it may be that fast, early biasing mechanisms have evolved to meet the challenges of an unstable, unpredictable environment that favors intuitive or “snap” decisions during reward harvesting.
A second goal of our experiment was to establish where in the sensory processing hierarchy reward-induced biases are likely to intervene. One possibility is that the reward system biases early sensory processing via “top-down” cortico-cortical connectivity, engendering a biasing of baseline visual responding akin to that described during selective attention (Kastner et al., 1999; Serences and Boynton, 2007) or visual feature “matching” (Motter, 1994; Summerfield and Koechlin, 2008). However, the data reported here argue against this mechanism as the basis for reward-guided perceptual biases, as we found no evidence that visual regions varied as a function of liberal, neutral, or conservative condition. This concurs with recent study that found weak or equivocal evidence that face- and scene-sensitive extrastriate regions respond more robustly when subjects are biased toward reporting that that category was present (Fleming et al., 2010). Thus, although visual regions are sensitive to signal value (Serences, 2008), it is not clear whether economic information is combined with signal strength to form a DV in the sensory cortices. A second possibility is that reward merely biases the motor output signal. However, we also failed to observe an effect of bias in motor regions activated during responding.
The alternative favored by the data described here is that the reward system biases decision-making at the intermediate stage, in parietal cortex. Neurons in parietal area LIP (overlapping with the parietal zone identified in our fMRI study) are proposed to integrate momentary evidence into a DV (Shadlen and Newsome, 2001; Hanks et al., 2006; Gold and Shadlen, 2007) as signaled by a ramping of their firing rates with a slope that tracks the level of momentary evidence in the stimulus. Critically, these LIP responses arbitrate between two responses even when momentary evidence is absent (i.e., where there is no information in the stimulus), implying that they encode additional information that biases a perceptual choice over and above sensory input. The origin of this information in studies where observers are not biased toward one option over another is not clear. However, it is likely that subjects’ propensity to choose one alternative over another varies stochastically from trial to trial. In our modeling, this is reflected in the trial-to-trial variability in the quantity α that encodes the origin of the accumulation process. Indeed, previous modeling work has demonstrated that variability in α is required to model the relative mean latency of correct and incorrect decisions under the framework of the drift-diffusion model (Ratcliff and Rouder, 1998).
Single-neuron studies have also demonstrated that LIP neurons respond to expected payoff under asymmetric reward, both where the sensory signal is strong and clearly visible (Platt and Glimcher, 1999) and where it is corrupted by noise (Rorie et al., 2010). In support of this view, we observed bilateral clusters of activity in parietal cortex that correlated with trial-by-trial estimates of the DV, a combined decision signal incorporating bias toward the percept with the higher payoff as well as accumulated sensory evidence. Given our behavioral findings, it may be that parietal integrator neurons are themselves are biased early on in the diffusion process, with their baseline firing rates brought closer to threshold before evidence accumulation has begun in earnest. This finding not only replicates previous work in the monkey (Rorie et al., 2010), but is also consisted with another report that across a subject cohort, parietal activity correlates with the extent to which order of presentation alters discrimination judgments in 2-interval forced choice vibrotactile judgments, an effect that depends on subjects’ prior estimates of mean signal strength (Preuschhof et al., 2009). Our findings in the parietal cortex thus agree with a corpus of primate electrophysiology studies, conferring prima facie validity on our new methods for identifying decision-related signals with fMRI.
Finally, we also observed activity tracked the DV in symmetric bilateral clusters lying on the border between the anterior PFC and OFC, in lateral BA10/11. Whereas previous imaging studies have implicated the medial portion of the OFC in the representation of the value of goods and/or actions (Kable and Glimcher, 2007; Plassmann et al., 2007; Hare et al., 2008); for a review, see (Kable and Glimcher, 2009), the contribution of the lateral OFC/PFC region identified in our study remains more elusive. Some authors have emphasized the contribution of frontopolar regions to complex decisions involving the integration of multiple sources of evidence (Christoff et al., 2001), or in arbitrating between currently active task goals (Koechlin et al., 1999). Others have suggested that this region is involved in triggering the choice to explore away from an option offering maximal reward (Daw et al., 2006), in the representation of the value of the value of unchosen option (Boorman et al., 2009), or in the learning of specific outcome-choice associations (Walton et al., 2010). In a different literature, the lateral OFC and frontal pole have been implicated in fast, top-down modulation of perceptual choices (Thorpe et al., 1996; Bar et al., 2001, 2006). Our results suggest that lateral OFC activity is highest under conditions where subjects have the greatest degree of prior evidence that an anticipated percept will be present – and in particular, when observers make a false alarm in the liberal condition. This is in accord with the idea the OFC regions may be involved in generating a rapid “initial guess” about the identity of a percept (Kveraga et al., 2007). However, it may also be the case that the activation of this region reflects the need to arbitrate between competing multiple concerns – i.e., both sensory and economic - during the decision, or the heightened lateral OFC activation may occur when the choice is more influenced by stimulus value than by sensory evidence (for example in liberal false alarms). Nevertheless, this account remains speculative, and the precise role of the lateral OFC in biased decision-making, and its potential interactions with the parietal cortex, remain to be more fully described.
In conclusion, we demonstrate that economic value biases uncertain perceptual choices early in the decision epoch, and does so by shifting initial estimates of evidence in favor of the more valuable perceptual alternative, perhaps before evidence integration has begun. Using fMRI, we report a correlate of the decision variable (DV), comprising both momentary evidence and other factors that might bias the decision, in the parietal and prefrontal cortices. These findings complement key findings from single-cell recordings in the non-human primate, i.e., that parietal neurons integrate decision-related information (Shadlen and Newsome, 2001; Gold and Shadlen, 2007), and that rewards bias the firing rates of these cells early in the decision epoch (Rorie et al., 2010).
Conflict of Interest Statement
The authors declare that the research was conducted in the absence of any commercial or financial relationships that could be construed as a potential conflict of interest.
Acknowledgments
We thank Tobias Egner, Dick Passingham, and Matthew Rushworth for comments on an earlier version of this manuscript.
References
Anderson, A. J., Yadav, H., and Carpenter, R. H. (2008). Directional prediction by the saccadic system. Curr. Biol. 18, 614–618.
Bar, M., Kassam, K. S., Ghuman, A. S., Boshyan, J., Schmid, A. M., Dale, A. M., Hamalainen, M. S., Marinkovic, K., Schacter, D. L., Rosen, B. R., and Halgren, E. (2006). Top-down facilitation of visual recognition. Proc. Natl. Acad. Sci. U.S.A. 103, 449–454.
Bar, M., Tootell, R. B., Schacter, D. L., Greve, D. N., Fischl, B., Mendola, J. D., Rosen, B. R., and Dale, A. M. (2001). Cortical mechanisms specific to explicit visual object recognition. Neuron 29, 529–535.
Bogacz, R., Brown, E., Moehlis, J., Holmes, P., and Cohen, J. D. (2006). The physics of optimal decision making: a formal analysis of models of performance in two-alternative forced-choice tasks. Psychol. Rev. 113, 700–765.
Boorman, E. D., Behrens, T. E., Woolrich, M. W., and Rushworth, M. F. (2009). How green is the grass on the other side? Frontopolar cortex and the evidence in favor of alternative courses of action. Neuron 62, 733–743.
Busemeyer, J. R., and Townsend, J. T. (1993). Decision field theory: a dynamic-cognitive approach to decision making in an uncertain environment. Psychol. Rev. 100, 432–459.
Carpenter, R. H., and Williams, M. L. (1995). Neural computation of log likelihood in control of saccadic eye movements. Nature 377, 59–62.
Christoff, K., Prabhakaran, V., Dorfman, J., Zhao, Z., Kroger, J. K., Holyoak, K. J., and Gabrieli, J. D. (2001). Rostrolateral prefrontal cortex involvement in relational integration during reasoning. Neuroimage 14, 1136–1149.
Daw, N. D., O’Doherty, J. P., Dayan, P., Seymour, B., and Dolan, R. J. (2006). Cortical substrates for exploratory decisions in humans. Nature 441, 876–879.
Diederich, A. (2008). A further test of sequential-sampling models that account for payoff effects on response bias in perceptual decision tasks. Percept. Psychophys. 70, 229–256.
Diederich, A., and Busemeyer, J. R. (2006). Modeling the effects of payoff on response bias in a perceptual discrimination task: bound-change, drift-rate-change, or two-stage-processing hypothesis. Percept. Psychophys. 68, 194–207.
Feng, S., Holmes, P., Rorie, A., and Newsome, W. T. (2009). Can monkeys choose optimally when faced with noisy stimuli and unequal rewards? PLoS Comput. Biol. 5, e1000284, doi: 10.1371/journal.pcbi.1000284.
Fleming, S. M., Whiteley, L., Hulme, O. J., Sahani, M., and Dolan, R. J. (2010). Effects of category-specific costs on neural systems for perceptual decision-making. J. Neurophysiol. 103, 3238–3247.
Frazier, P., and Yu, A. J. (2008). Sequential hypothesis testing under stochastic deadlines. Adv. Neural Inf. Process Syst. 20, 465–472.
Genovese, C. R., Lazar, N. A., and Nichols, T. (2002). Thresholding of statistical maps in functional neuroimaging using the false discovery rate. Neuroimage 15, 870–878.
Gold, J. I., and Shadlen, M. N. (2007). The neural basis of decision making. Annu. Rev. Neurosci. 30, 535–574.
Hanks, T. D., Ditterich, J., and Shadlen, M. N. (2006). Microstimulation of macaque area LIP affects decision-making in a motion discrimination task. Nat. Neurosci. 9, 682–689.
Hare, T. A., O’Doherty, J., Camerer, C. F., Schultz, W., and Rangel, A. (2008). Dissociating the role of the orbitofrontal cortex and the striatum in the computation of goal values and prediction errors. J. Neurosci. 28, 5623–5630.
Henderson, J. M., and Hollingworth, A. (1999). High-level scene perception. Annu. Rev. Psychol. 50, 243–271.
Kable, J. W., and Glimcher, P. W. (2007). The neural correlates of subjective value during intertemporal choice. Nat. Neurosci. 10, 1625–1633.
Kable, J. W., and Glimcher, P. W. (2009). The neurobiology of decision: consensus and controversy. Neuron 63, 733–745.
Kastner, S., Pinsk, M. A., De Weerd, P., Desimone, R., and Ungerleider, L. G. (1999). Increased activity in human visual cortex during directed attention in the absence of visual stimulation. Neuron 22, 751–761.
Koechlin, E., Basso, G., Pietrini, P., Panzer, S., and Grafman, J. (1999). The role of the anterior prefrontal cortex in human cognition. Nature 399, 148–151.
Kriegeskorte, N., Simmons, W. K., Bellgowan, P. S., and Baker, C. I. (2009). Circular analysis in systems neuroscience: the dangers of double dipping. Nat. Neurosci. 12, 535–540.
Kveraga, K., Ghuman, A. S., and Bar, M. (2007). Top-down predictions in the cognitive brain. Brain Cogn. 65, 145–168.
Link, S. W., and Heath, R. A. (1975). The relative judgement theory of two choice response times. J. Math. Psychol. 12, 114–135.
Liston, D. B., and Stone, L. S. (2008). Effects of prior information and reward on oculomotor and perceptual choices. J. Neurosci. 28, 13866–13875.
Lu, Z. L., and Dosher, B. A. (2008). Characterizing observers using external noise and observer models: assessing internal representations with external noise. Psychol. Rev. 115, 44–82.
Macmillan, N. A., and Creelman, G. D. (1991). Detection Theory: A User’s Guide. Cambridge: Cambridge University Press.
McCarthy, D., and Davison, M. (1984). Isobias and alloiobias functions in animal psycophysics. J. Exp. Psychol. Anim. Behav. Process. 10, 390–409.
Motter, B. C. (1994). Neural correlates of feature selective memory and pop-out in extrastriate area V4. J. Neurosci. 14, 2190–2199.
Plassmann, H., O’Doherty, J., and Rangel, A. (2007). Orbitofrontal cortex encodes willingness to pay in everyday economic transactions. J. Neurosci. 27, 9984–9988.
Platt, M. L., and Glimcher, P. W. (1999). Neural correlates of decision variables in parietal cortex. Nature 400, 233–238.
Preuschhof, C., Schubert, T., Villringer, A., and Heekeren, H. R. (2009). Prior Information biases stimulus representations during vibrotactile decision making. J. Cogn. Neurosci. 22 875–887.
Ratcliff, R., and McKoon, G. (2008). The diffusion decision model: theory and data for two-choice decision tasks. Neural. Comput. 20, 873–922.
Ratcliff, R., and Rouder, J. N. (1998). Modeling response times for two-choice decisions. Psychol. Sci. 9, 347–356.
Rorie, A. E., Gao, J., McClelland, J. L., and Newsome, W. T. (2010). Integration of sensory and reward information during perceptual decision-making in lateral intraparietal cortex (LIP) of the macaque monkey. PLoS ONE 5, e9308, doi: 10.1371/journal.pone.0009308.
Serences, J. T., and Boynton, G. M. (2007). Feature-based attentional modulations in the absence of direct visual stimulation. Neuron 55, 301–312.
Shadlen, M. N., and Newsome, W. T. (2001). Neural basis of a perceptual decision in the parietal cortex (area LIP) of the rhesus monkey. J. Neurophysiol. 86, 1916–1936.
Summerfield, C., and Koechlin, E. (2008). A neural representation of prior information during perceptual inference. Neuron 59, 336–347.
Swets, J. A., Tanner, W. P., and Birdsall, T. G. (1964). “Decision processes in perception,” in Signal Detection and Recognition, ed. J. A. Swets (New York, NY: Wiley), 3–57.
Thorpe, S., Fize, D., and Marlot, C. (1996). Speed of processing in the human visual system. Nature 381, 520–522.
Trommershauser, J., Maloney, L. T., and Landy, M. S. (2008). Decision making, movement planning and statistical decision theory. Trends Cogn. Sci. 12, 291–297.
Walton, M. E., Behrens, T. E., Buckley, M. J., Rudebeck, P. H., and Rushworth, M. F. (2010). Separable learning systems in the macaque brain and the role of orbitofrontal cortex in contingent learning. Neuron 65, 927–939.
Keywords: perceptual decision-making, bias, reward, computational modeling, fMRI, parietal cortex, prefrontal cortex
Citation: Summerfield C and Koechlin E (2010) Economic value biases uncertain perceptual choices in the parietal and prefrontal cortices. Front. Hum. Neurosci. 4:208. doi: 10.3389/fnhum.2010.00208
Received: 30 July 2010;
Accepted: 08 October 2010;
Published online: 17 November 2010.
Edited by:
Francisco Barcelo, University of Illes Balears, SpainCopyright: © 2010 Summerfield and Koechlin. This is an open-access article subject to an exclusive license agreement between the authors and the Frontiers Research Foundation, which permits unrestricted use, distribution, and reproduction in any medium, provided the original authors and source are credited.
*Correspondence: Christopher Summerfield, Department of Experimental Psychology, University of Oxford, South Parks Road, Oxford, UK. e-mail: christopher.summerfield@psy. ox.ac.uk