 Sha Luo
 Li Wen1
 Jingxu Xu
 Chencui Huang
 Zhang Dong
 Guangxian Wang
94% of researchers rate our articles as excellent or good
Learn more about the work of our research integrity team to safeguard the quality of each article we publish.
Find out more
ORIGINAL RESEARCH article
Front. Neurol., 19 June 2024
Sec. Applied Neuroimaging
Volume 15 - 2024 | https://doi.org/10.3389/fneur.2024.1398225
This article is part of the Research TopicRecent insights in Neuroimaging: advancements in therapeutic studies and early diagnosisView all 7 articles
Background: It is vital to accurately and promptly distinguish unstable from stable intracranial aneurysms (IAs) to facilitate treatment optimization and avoid unnecessary treatment. The aim of this study is to develop a simple and effective predictive model for the clinical evaluation of the stability of IAs.
Methods: In total, 1,053 patients with 1,239 IAs were randomly divided the dataset into training (70%) and internal validation (30%) datasets. One hundred and ninety seven patients with 229 IAs from another hospital were evaluated as an external validation dataset. The prediction models were developed using machine learning based on clinical information, manual parameters, and radiomic features. In addition, a simple model for predicting the stability of IAs was developed, and a nomogram was drawn for clinical use.
Results: Fourteen machine learning models exhibited excellent classification performance. Logistic regression Model E (clinical information, manual parameters, and radiomic shape features) had the highest AUC of 0.963 (95% CI 0.943–0.980). Compared to manual parameters, radiomic features did not significantly improve the identification of unstable IAs. In the external validation dataset, the simplified model demonstrated excellent performance (AUC = 0.950) using only five manual parameters.
Conclusion: Machine learning models have excellent potential in the classification of unstable IAs. The manual parameters from CTA images are sufficient for developing a simple and effective model for identifying unstable IAs.
With the increasing availability and quality of noninvasive imaging modalities, a growing number of intracranial aneurysms (IAs) are being detected (1, 2). Computed tomography angiography (CTA) remains the first-line imaging modality due to its features of being noninvasive, fast, cost-effective and wide availability. Most IAs are asymptomatic, but once ruptured, they can lead to subarachnoid hemorrhage (SAH). The mortality and morbidity of aneurysmal SAH are high worldwide, and the 1-year mortality rate can reach 65% (untreated), while approximately half of the survivors are left with permanent neurological deficits (3, 4). Prophylactic treatment of unruptured IAs via endovascular therapy (EVT) or neurosurgical therapy (NST) can decrease the risk of SAH. However, a systemic review revealed that the clinical complication risk and case fatality rate from EVT were 4.96 and 0.30%, respectively, and those from NST were 8.34 and 0.10%, respectively (5). Therefore, the risk of an unruptured IA treatment should be balanced with the risk of rupture.
The processes leading to IA development and rupture are poorly understood. However, the rupture rate of growing unruptured IAs is significantly increased, and patients with IA growth should be strongly considered for treatment (1, 2, 6, 7). In addition, patients with symptomatic unruptured IAs and a history of aneurysmal SAH also have a significantly increased risk of rupture (1, 7–10). Hence, in clinical work, it is vital to accurately and promptly distinguish unstable from stable IAs to facilitate treatment optimization and avoid unnecessary treatment.
In recent years, machine learning and radiomics-based studies have been used to identify risk factors for IA. Furthermore, various rupture and instability classification models for IAs have been proposed (11–18). These studies indicate that machine learning models may help identify potentially ruptured IAs. However, only a few studies have constructed models for the stability of IAs (11, 13). Hence, the purpose of this study was to develop a simple and effective classification model using machine learning based on patient clinical information and CTA images to assist in the clinical evaluation of the stability of IAs. The main steps of this study framework are shown in Figure 1.
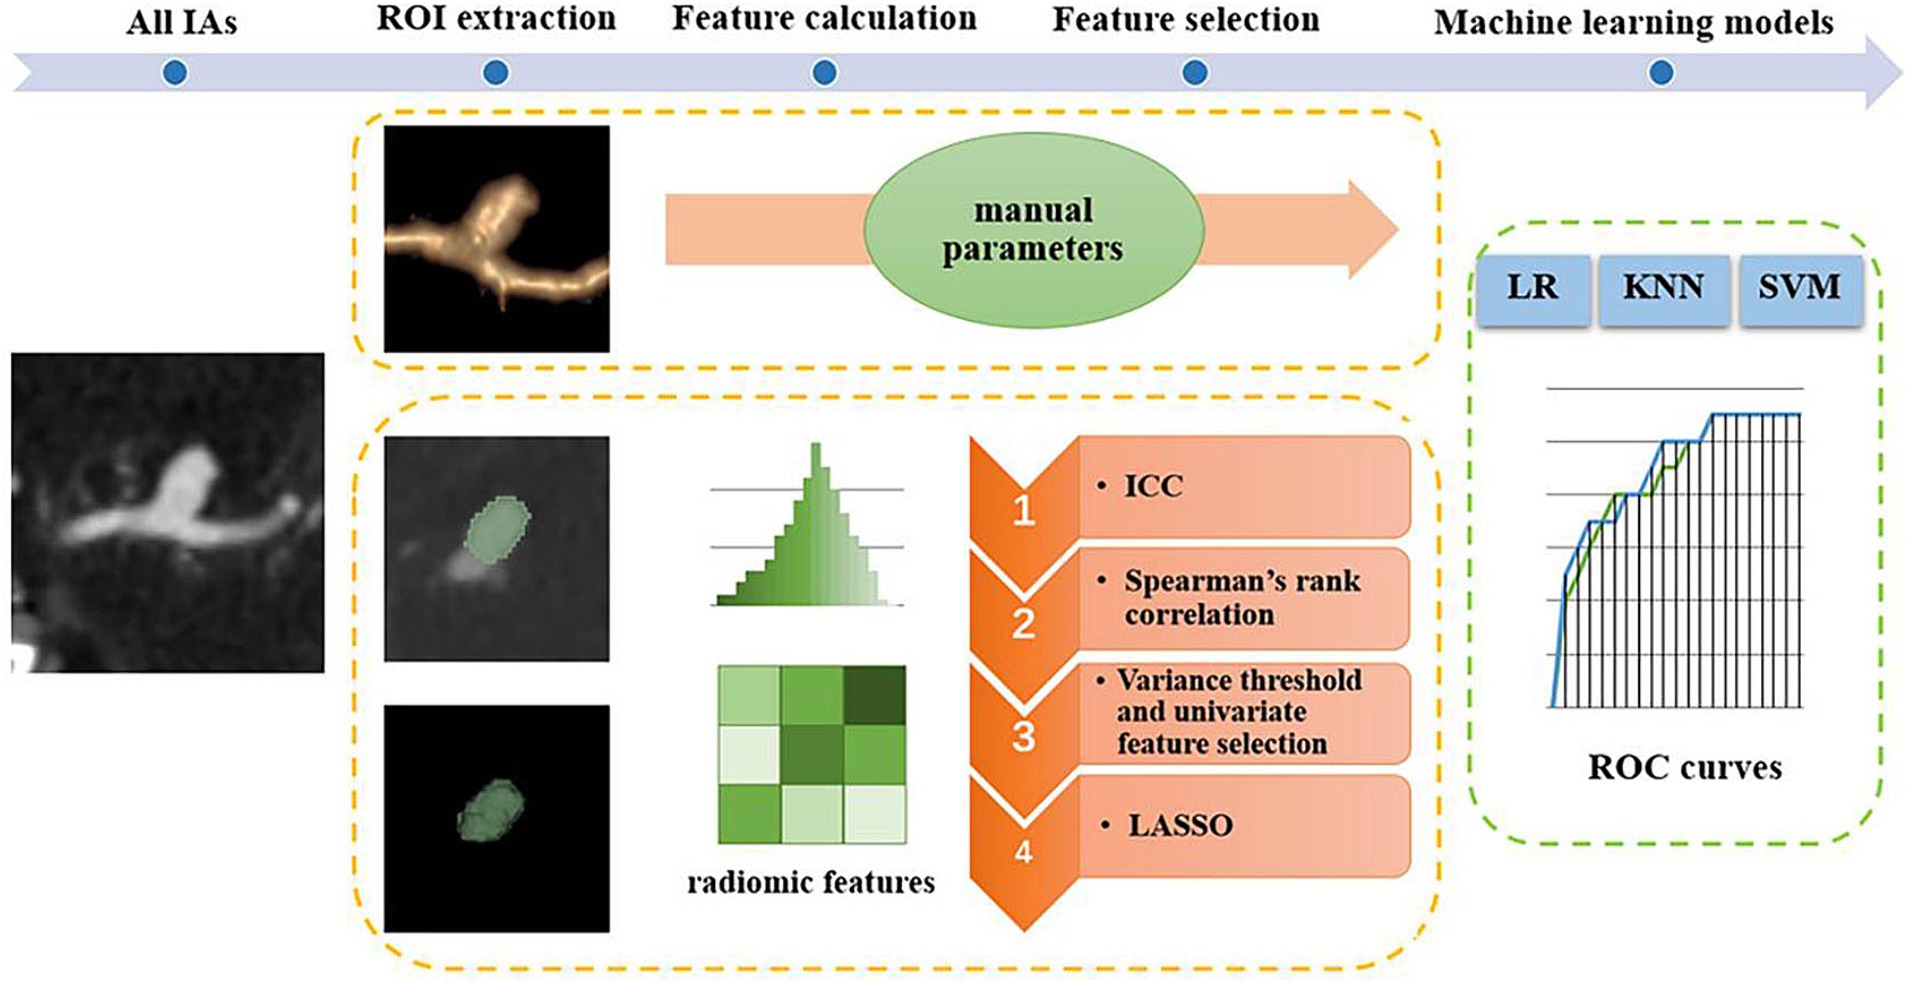
Figure 1. Main steps of the study framework. IAs, intracranial aneurysms; ROI, region of interest; ICC, intraclass correlation coefficient; LASSO, least absolute shrinkage selection operator; ROC, receiver operating characteristic; LR, logistic regression; KNN, k-nearest neighbors; SVM, support vector machine.
This retrospective study was approved by our institutional ethics committees, and the requirement for informed consent was waived. We retrospectively reviewed the medical records and imaging data in our hospitals from August 2011 to May 2021. The inclusion criteria were as follows: (1) aged older than 18 years, (2) had a diagnosis of saccular IA, and (3) had accessible clinical and radiological data. The exclusion criteria were as follows: (1) a diagnosis of an infectious, traumatic, fusiform, or dissecting IAs; (2) combined with other vascular diseases (e.g., moyamoya disease and arteriovenous malformations); and (3) absence of clinical data or high-quality radiological data and surgery or interventional therapy prior to the CTA examination.
All IAs met the aforementioned inclusion criteria and were divided into 2 groups: stable IAs and unstable IAs. The criteria for unstable IAs included (1) a history of SAH (ruptured but untreated), (2) rupture, growth or gross evolution (e.g., formation of blebs and lobes) during follow-up, and (3) neurologic symptoms (e.g., sudden headache or blepharoptosis) related to the IA. The ruptured IA was confirmed based on operative findings, angiography, or hemorrhage patterns of nonenhanced CT. When patients with multiple IAs and clinical symptoms, but could not determine which IA caused the symptoms, ruling out other causes of symptoms, the largest IA was then identified as the responsible IA for the patients’ neurological symptoms (1, 7–10, 19, 20). For IAs discovered by chance, stable IAs were diagnosed by follow-up of ≥3 months using magnetic resonance angiography (MRA) or CTA (11, 13). Clinical information, such as hypertension or diabetes mellitus, were collected. Finally, a total of 1,053 patients with 1,239 IAs (683 unstable, 556 stable) were retrospectively enrolled to develop classification models, and 197 patients from another hospital with 229 IAs (106 unstable, 123 stable) were used as the external validation set.
All the CTA images were acquired from a 64-channel multidetector CT scanner with a section thickness of 0.625 mm and a reconstruction interval of 0.625 mm. The images were subsequently transferred to a GE Advantix workstation (Advantage Windows 4.5) to generate 3D volume renderings (VRs) and maximum intensity projections (MIPs). Manual parameters were measured directly from 3-dimensional CTA images according to previous definitions (19, 20). All the images were examined by two experienced neuroradiologists. Continuous data were calculated as the means, while any differences in categorical data were reassessed by a third reader (an observer with 20 years of experience in neuroradiology) for subsequent statistical analysis. And Inter-rater interclass correlation (ICC) was used to evaluate the inter-observer reproducibility.
Twenty-one manually identified and measured parameters (called manual parameters herein) were obtained from the CTA images of each IA: multiplicity; location, which was divided into 6 categories [internal carotid artery (ICA), middle cerebral artery (MCA), anterior cerebral artery (ACA), anterior communicating artery (ACoA), posterior communicating artery (PCoA), and posterior circulation artery (PCA)]; IA size (neck width, depth, width, height, maximum size); IA morphology (irregular shape, which was defined as one that was not smooth or that presented with lobular or daughter sac); and 8 secondary geometric morphology indices: aspect ratio (AR, depth/neck width), AR1 (height/neck width), size ratio (SR, depth/parent artery diameter), SR1 (depth/mean artery diameter), SR2 (maximum size/mean artery diameter), SR3 (maximum size/parent artery diameter), depth-to-width ratio (DW, depth/width) and bottleneck factor (BF, width/neck width); IA origin (sidewall or bifurcation); and parameters related to the parent artery, including the parent artery diameter, mean artery diameter and the flow angle (FA) (13, 19, 20).
Each IA was defined as a region of interest (ROI) and manually segmented by 2 experienced neuroradiologists who were aware of the location of the IA on each slice of the CTA images. Then, 30 aneurysms were randomly selected to be re-segmented by another neuroradiologist. We calculated the inter-rater interclass correlation ICC to evaluate the inter-observer reproducibility. All ROIs were segmented slice by slice on three orthogonal views using the Dr. Wise Multimodal Research Platform.1 Subsequently, 2,107 radiomic features were automatically extracted for each ROI using the open-source “PyRadiomics” Python package (21). In this study, radiomics features were divided into two parts: 14 radiomic shape features and a large number of radiomic non-shape features. The radiomic non-shape features were as follows: 18 first-order features, 22 gray-level cooccurrence matrix (GLCM) features, 16 gray-level size zone matrix (GLSZM) features, 16 gray-level run length matrix (GLRLM) features, 14 gray-level dependence matrix (GLDM) features, 5 neighboring gray-tone difference matrix (NGTDM) features, and a total of 2002 higher-order features. These features were calculated from the above features using filters (including exponent, gradient transform, wavelet, Laplace-Gauss, square root, logarithm, and local binary mode transform). All radiomic features were standardized by z score transformation to eliminate the unit limits of each feature. All the calculation equations and the pipeline can be found at https://pyradiomics.readthedocs.io/en/latest/.
First, patients with a total of 1,239 IAs (683 unstable, 556 stable) were randomly sampled into a training set and an internal validation set at a 7:3 ratio. Thus, 867 IAs (478 unstable and 389 stable) were randomly selected as the training set for feature selection and classification model construction. The remaining 372 IAs (205 unstable, 167 stable) composed the internal validation set, which was only used to test the model. In addition, an external validation set (106 unstable, 123 stable) was used to ultimately evaluate the effectiveness of the model.
R software (version 4.0.3; Boston, MA, USA) was used in the analyses for all clinical information and manual parameters. Categorical variables are expressed as frequencies, and the Chi-square test was used to evaluate the differences between groups. Continuous variables are expressed as the means. The Shapiro–Wilk test was used to assess the normality of the distribution. The Mann–Whitney U test or two-tailed independent Student’s t test was used to assess continuous variables as appropriate. Then, only statistically significant variables at the p < 0.05 level in univariate analysis were selected as input variables for the machine learning models for all clinical information. The variance threshold (threshold = 0.8), and the least absolute shrinkage selection operator (LASSO) were used to screen for the optimal manual parameters. If the predictive model contained too many parameters, a maximum of 10 parameters with the highest weight were retained. Similar methods were used to screen the radiomic shape features.
The radiomic non-shape features selection steps were as follows: (1) The interrater reliability of the morphology measurements was assessed by the intraclass ICC. Features with an ICC > 0.8 were selected for further analysis. (2) Spearman’s rank correlation was employed to eliminate high-dimensional feature redundancy (for the remaining features after removing 3D-based shape features). If the correlation coefficient was >0.9 for two features, then one of the features was excluded; (3) the variance threshold was set to 0.8 was used; (4) and the LASSO was used and regularized by 10-fold cross-validation to ensure the robustness of the results. Fourteen 3D-based radiomic shape features were filtered out via LASSO regression. Moreover, the 10 features with the highest weights were selected from the other features filtered by LASSO regression (if there were not 10 features in the final LASSO result, all were selected) as the radiomics signature, which was incorporated into the predictive models built using machine learning algorithms.
Four classification models, Model A (manual parameters), Model B (manual parameters + radiomic shape features), Model C (radiomic non-shape features), and Model D (manual parameters + radiomic non-shape features) were developed to identify unstable and stable IAs. Three machine learning algorithms were used to find the optimal classifier for stable and unstable IA classification: logistic regression (LR), k-nearest neighbors (KNN), and support vector machine (SVM) classifiers; these algorithms are widely used in clinical classification and prediction research and have shown good performance (15, 16, 19). The model with the highest classification performance among Models A-D was subsequently reconstructed by adding useful clinical information to obtain Model E. The performance of all the models was assessed by using the area under the receiver operating characteristic (ROC) curve (AUC), accuracy, precision, sensitivity and specificity. The performance of all the models was evaluated in a separate internal validation set and an external validation set.
Canonical correlation analysis (CCA) is a statistical method used to address the relationship between two random vectors and has been widely used in data analysis, information fusion and other fields (22). CCA was used to explore the associations between the radiomic features of the radiomics signature and manual parameters.
Table 1 shows the clinical information and manual parameters of the IAs. The results showed that patients with unstable IAs were younger than were those with stable IAs (p = 0.001). Hypertension, heart disease, diabetes mellitus and cerebral vascular sclerosis were more prevalent in the stable group (p = 0.012, p < 0.001, p = 0.001, and p < 0.001, respectively).
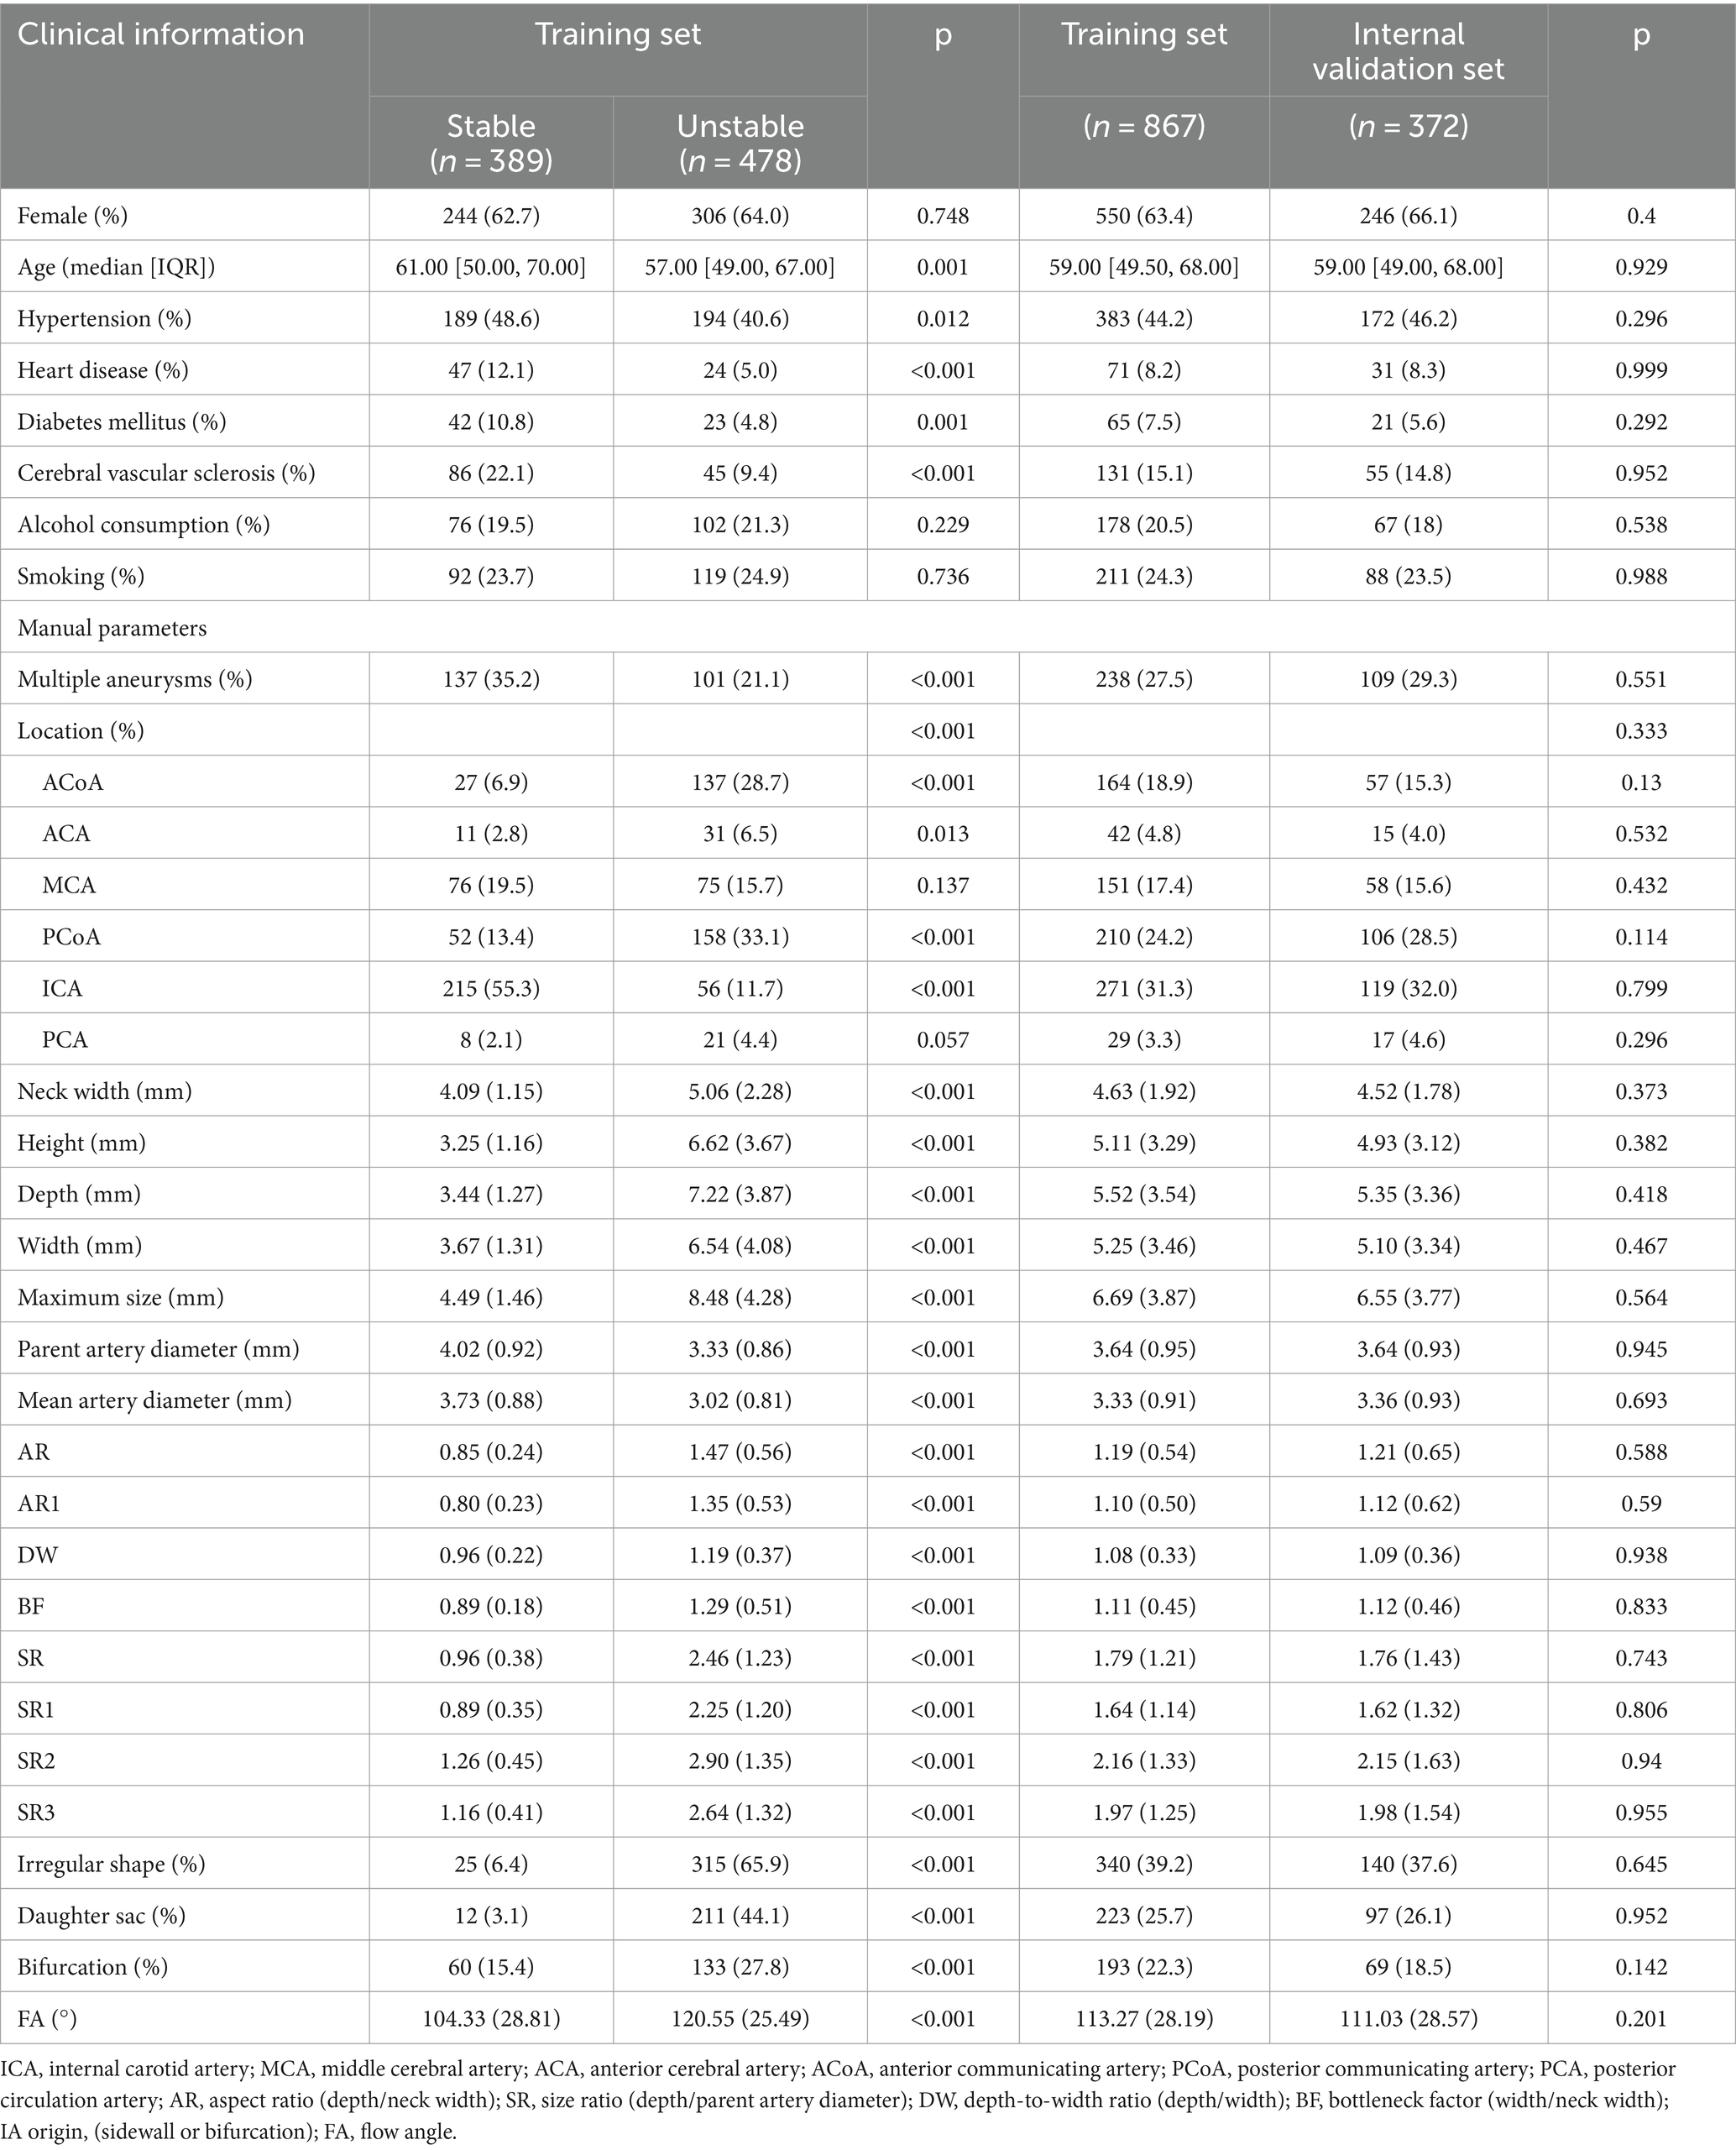
Table 1. Clinical information and manual parameters of the IAs.
For manual parameters, the mean Inter-rater ICC value was 0.81. All the manual parameters were significantly associated with IA stability (p < 0.001). Multiple IAs were more common in the stable group than in the unstable group (35.2% vs. 21.1%). IA stability was significantly associated with location: unstable IAs were significantly more common than stable IAs in the ACA, ACoA and PCoA (p = 0.013, p < 0.001, and p < 0.001, respectively). In contrast, stable IAs were more prevalent than unstable IAs in the ICA (p < 0.001). The sizes (neck width, depth, width, height, maximum size) of the stable IAs were smaller than those of the unstable IAs. Irregular shape, daughter sac and bifurcation type were more common in the unstable group than in the stable group. Moreover, the 8 secondary geometric morphology indices (AR, AR1, DW, BF, SR, SR1, SR2, and SR3) of the unstable IAs were greater than those of the stable IAs. The 10 highest weighted manual parameters are shown in Supplementary Table S1. IA stability was also significantly associated with parameters related to the parent artery. The parent artery diameter and mean artery diameter were greater in the stable than in the unstable IAs. Moreover, there were no significant differences between the training set and the internal validation set. For more information of the IAs in the external validation set, please refer to Supplementary Table S2.
A total of 1,698 radiomic features and 12 radiomic shape features showed high interobserver agreement (ICC > 0.8). Finally, 10 radiomic features and 4 radiomic shape features remained after LASSO regression, as shown in the Supplementary Tables S3, S4. The coefficient–lambda graph and error–lambda graph was shown in Supplementary Figure S1.
The accuracy, precision, sensitivity, and specificity of each model are listed in Supplementary Tables S5–S7. The performance of each model in the external validation set is listed in Table 2. With respect to the external validation set, the results showed that all the machine learning models had outstanding classification ability (all AUCs >0.80). Model B (built by manual parameters and radiomic shape features) showed the best classification performance among models A-D. At the same time, among the four models, the AUC of the LR algorithm was the highest. The AUC values of Model B for the LR, SVM, and KNN algorithms were 0.960 (95% CI 0.939–0.978), 0.952 (95% CI 0.925–0.973), and 0.930 (95% CI 0.900–0.956), respectively. Then, we constructed Model E by adding 5 clinical characteristics, 10 manual parameters, and 4 radiomic shape features, and LR was used to develop this model. LR Model E had an AUC of 0.963 (95% CI 0.943–0.980), an accuracy of 91.7%, a precision of 92.2%, a sensitivity of 89.6%, and a specificity of 93.5%. The ROC curve and AUC of LR Model B and Model E are shown in Figure 2. Nineteen variables in Model E and their importance are shown in Table 3. The p-values from the DeLong test of the statistical comparison of the ROC curves in external validation set are given in Supplementary Table S8. The confusion matrix for Model E in the external validation set is shown in Supplementary Figure S2.
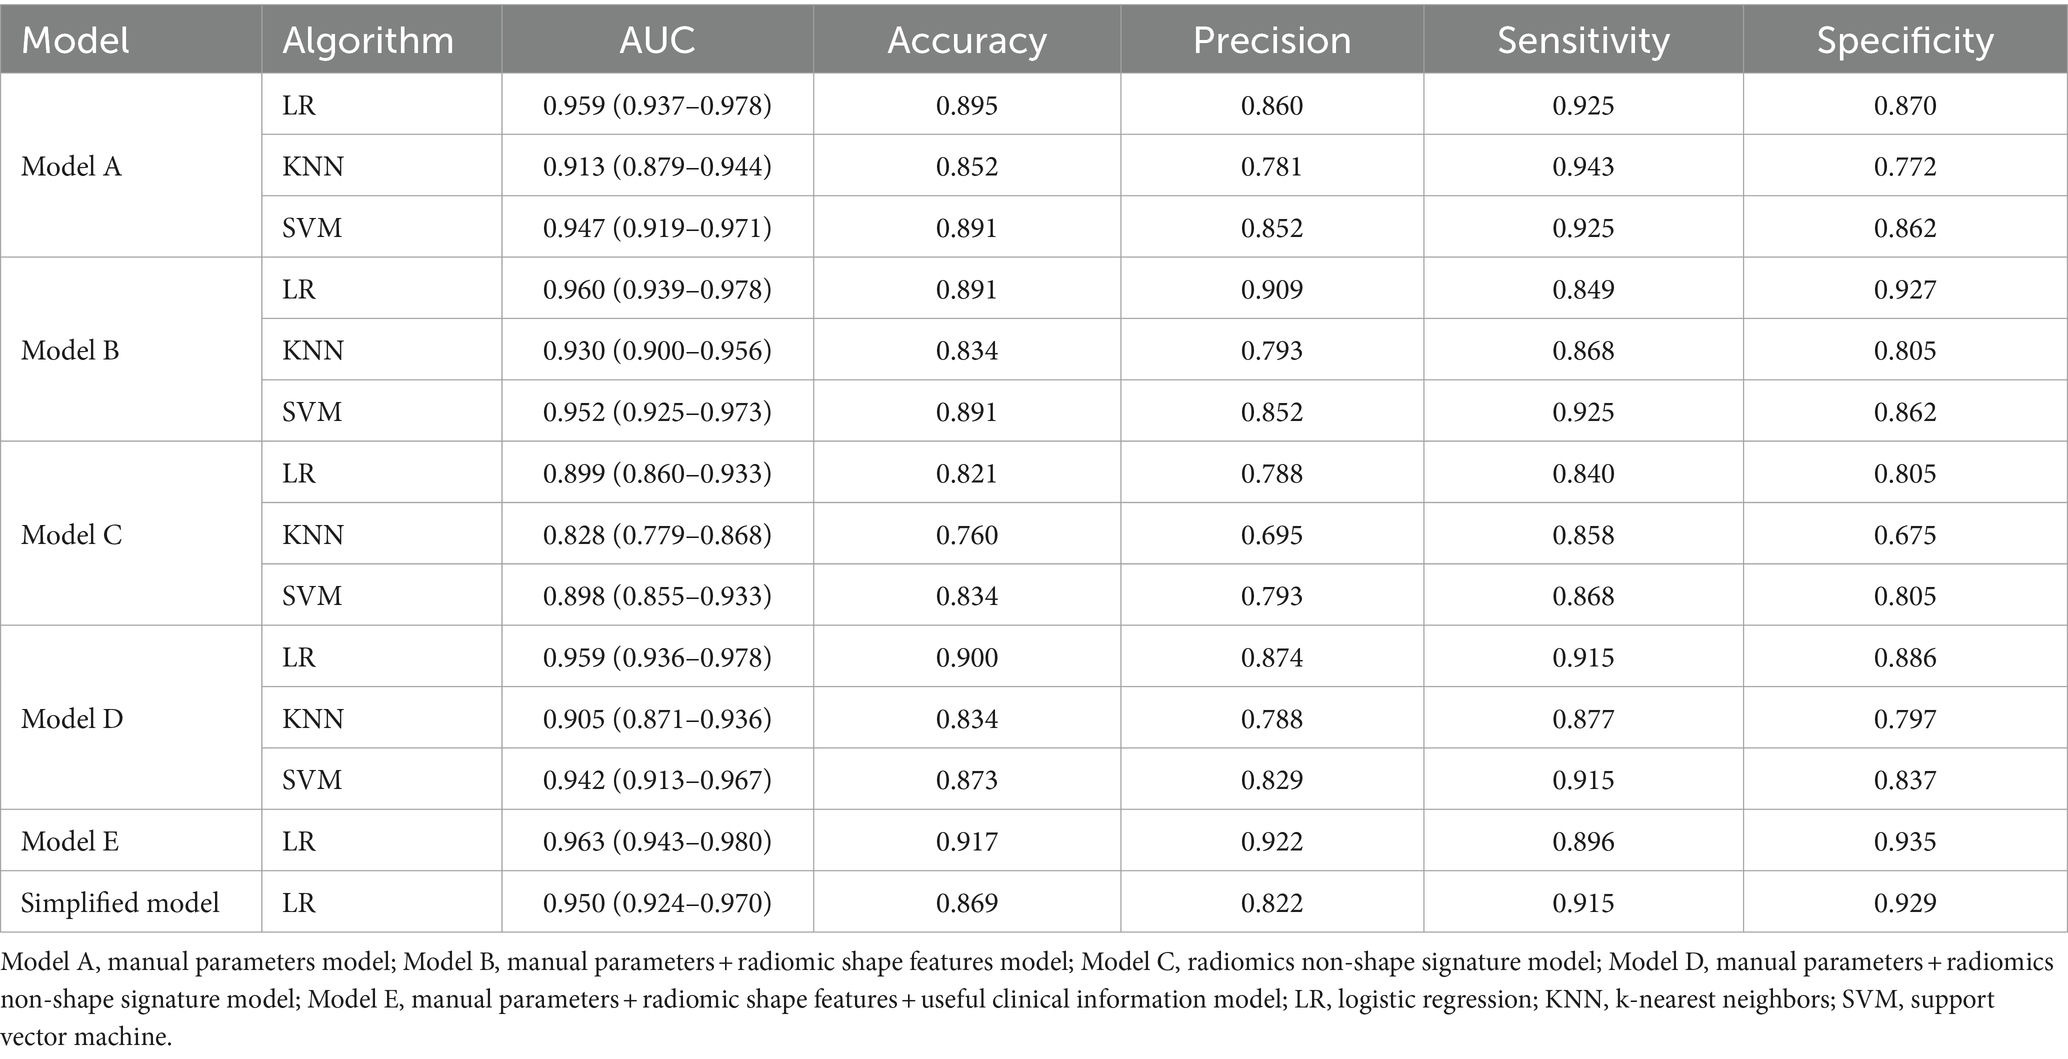
Table 2. The performance of each model in the external validation set.
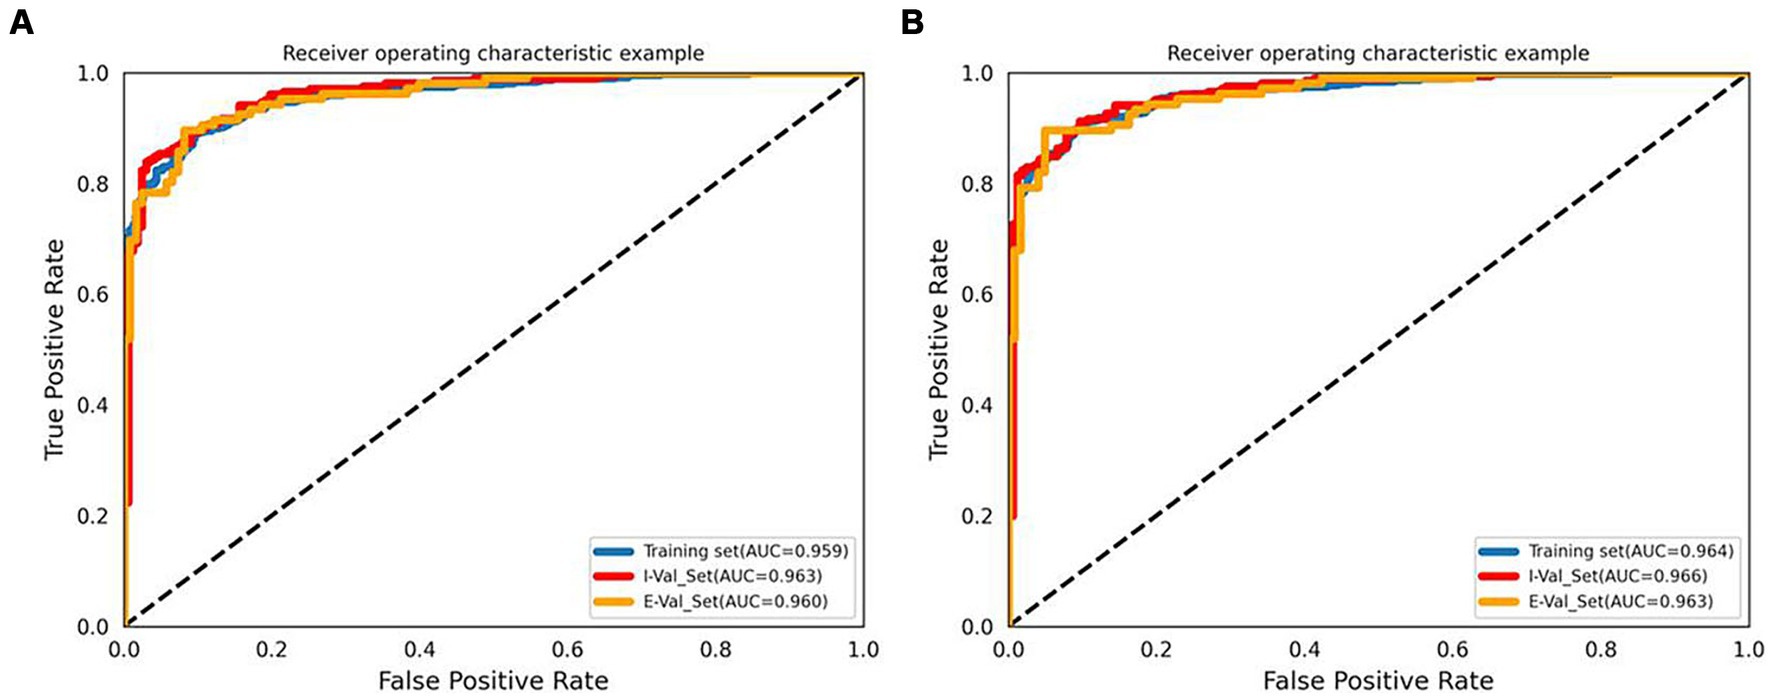
Figure 2. ROC curves and AUCs of the LR Model B (A) and Model E (B). I-Val set, internal validation set; E-Val set, external validation set.
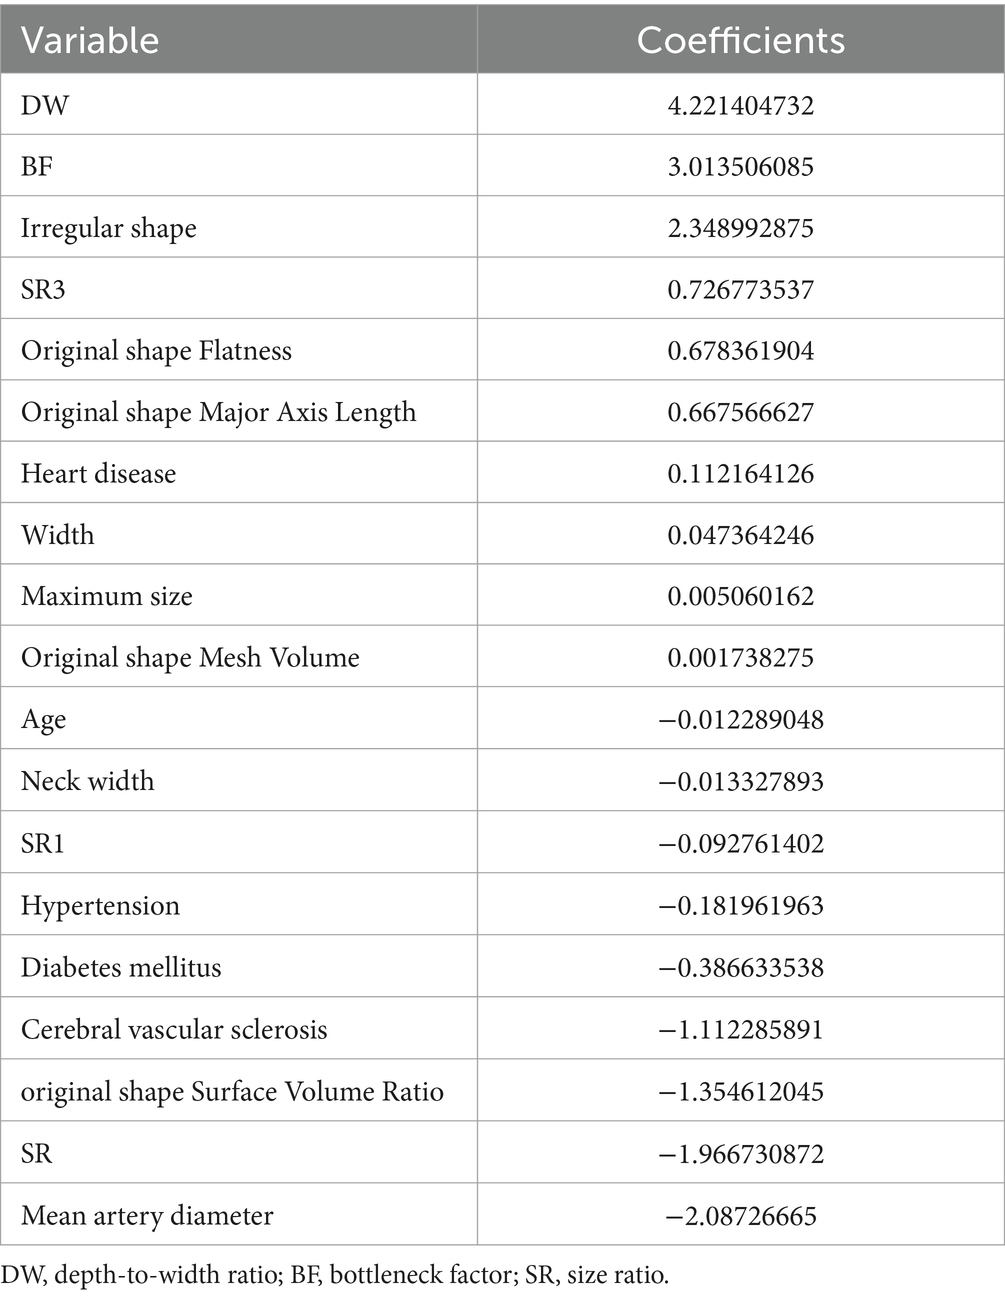
Table 3. Nineteen variables and their coefficients in Model E.
Model E consists of 19 variables, and too many variables can limit its practical use in clinical settings. Therefore, based on the coefficients (variable importance) of each variable, a simplified model with only 5 manual parameters (absolute coefficients ≥2) was derived, and a nomogram was drawn. The 5 parameters are as follows: irregular shape, DW, BF, mean artery diameter, and SR. The simplified model had an AUC of 0.950 (95% CI 0.924–0.970), an accuracy of 86.9%, a precision of 82.2%, a sensitivity of 91.5%, and a specificity of 82.9%. The DeLong test showed that there is no statistical difference between the Model E and simplified model (p = 0.245, in the external validation set). The nomogram of the simplified model is shown in Figure 3.
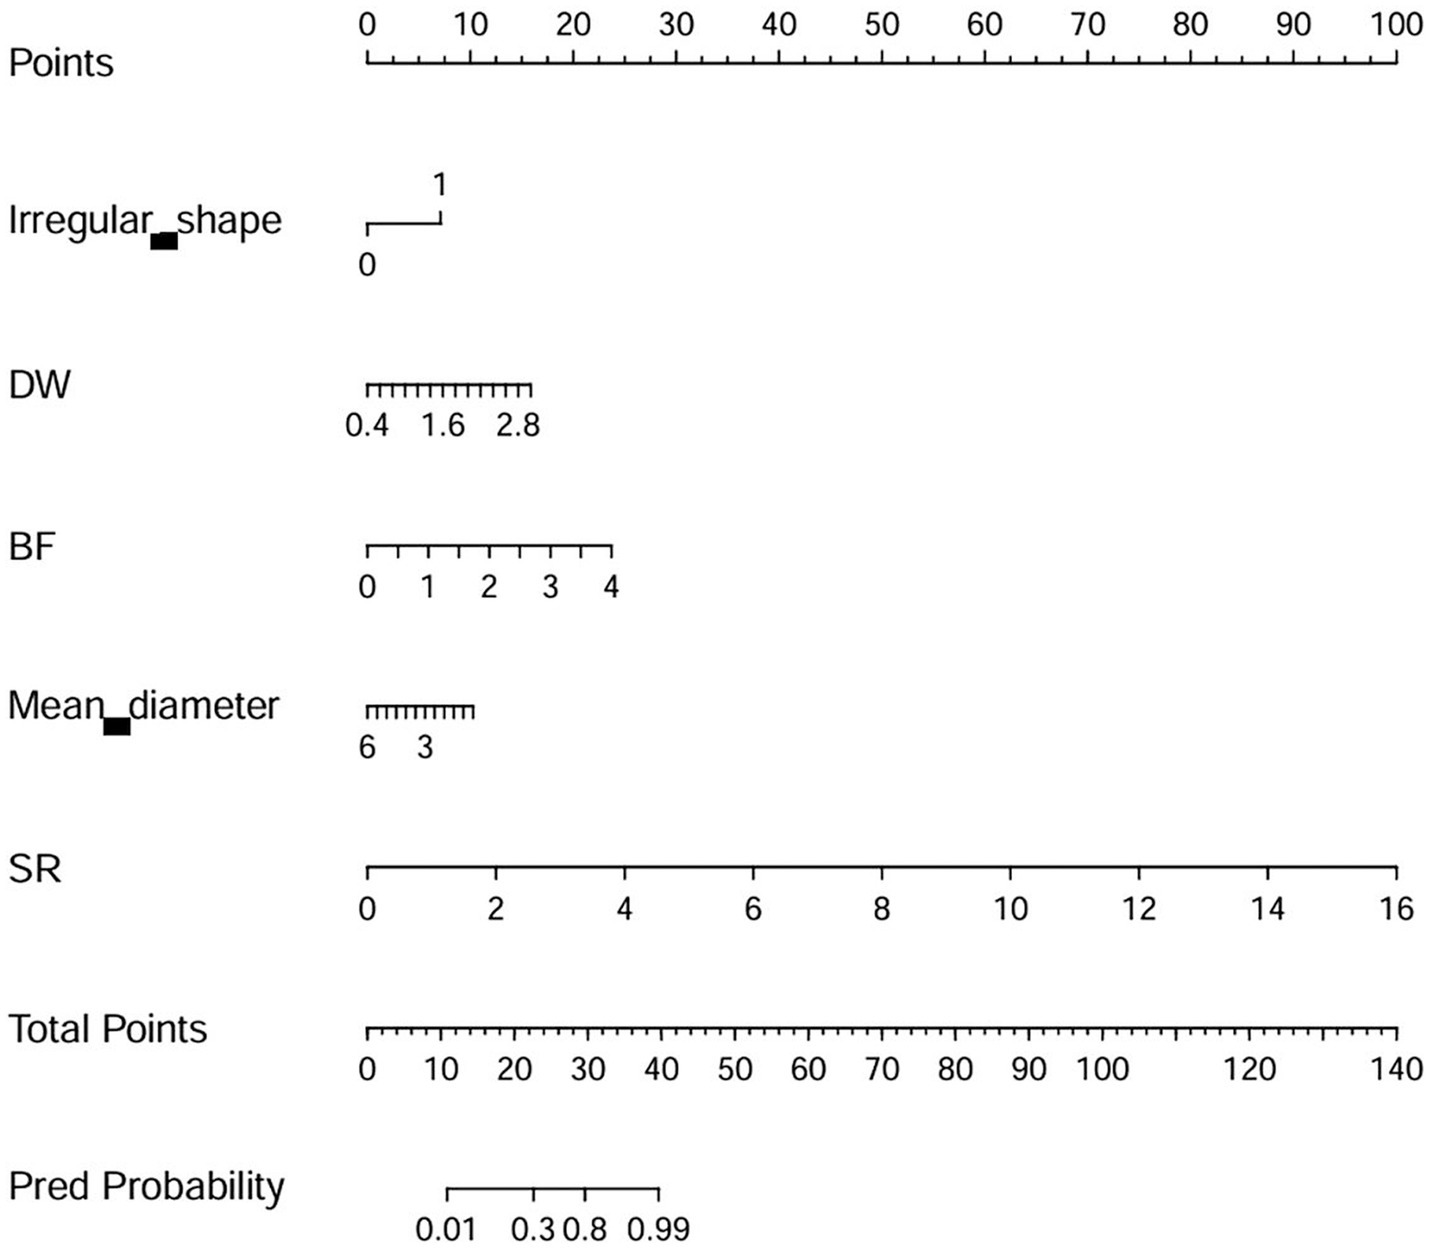
Figure 3. The nomogram of the simplified model. DW, depth-to-width ratio (depth/width); BF, bottleneck factor (width/neck width); SR, size ratio (depth/parent artery diameter).
The CCA analysis results showed that there was a strong correlation between the radiomic features of the radiomics signature and manual parameters, with a correlation coefficient of 0.822.
In this study, we constructed multiple machine learning models for unstable and stable IAs and evaluated their classification performance; all the machine learning models were found to exhibit good classification ability. The simplified model demonstrated excellent performance (AUC = 0.950) using only five manual parameters.
Machine learning and radiomics are powerful tools that can increase the power of decision support models (23). In this study, our results indicated that all the machine learning models had great potential in classifying unstable IAs. Further analysis of the external validation set revealed that the LR algorithm was superior to the SVM and KNN algorithms among all the models. Similarly, a Chinese multicenter study showed that the KNN and SVM methods cannot outperform conventional LR in prediction models for ruptured IAs (24, 25). Interestingly, the AUC of the LR algorithm was not optimal in the training set or internal validation set; however, the final external validation results were better than those of the KNN and SVM algorithms. This highlights the importance of external validation and the potential advantages of LR.
Currently, most IA studies that apply both machine learning and radiomics have built and assessed classification models for ruptured or unruptured IAs (12, 14, 17, 18). However, simple classification of IAs based on ruptured or unruptured cases is no longer applicable. The rupture rate of growing unruptured IAs significantly increases, and enlargement should replace rupture as an indicator of IA risk (1, 2, 6, 7). Therefore, a portion of unruptured IAs are unstable. For IAs, grouping them based on stability seems to have more clinical significance. This may also explain why the stability classification models of IAs exhibited excellent performance in this study.
To date, few studies have used machine learning to classify IA stability (11, 13). Both of these studies used 3D digital subtraction angiography images. In these studies, the criteria for an unstable IA included rupture within 1 month and growth on sequential imaging follow-up (11, 13). However, growth or overall evolution is not necessarily linear and is sometimes random and discontinuous (2). Some IAs that take longer than 1 month to rupture are also unstable. Thus, given the potentially catastrophic consequences of misdiagnosing unstable IAs as stable with a low risk of rupture, the classification of unstable IAs in this study may be more favorable for patients.
The simplified model also demonstrated excellent classification performance and used only 5 manual parameters, which are the top 5 variables in Model E. Notably, although Model A’s classification ability is slightly lower than that of Model B, Model A only uses manual parameters from CTA images. This means that the parameters from CTA images are sufficient to construct a classification model for identifying unstable IAs. Theoretically, manually measured diameters are semi objective because the results may differ among different raters, and these indices are insufficient for delineating the overall morphological features of the IA. However, manual delineation of ROIs for extracting radiomic features is also currently needed. Furthermore, the rupture risk of an IA and the treatment strategy used are closely related to the IA itself and its parent artery (such as location, flow angles, and bifurcation) (1, 4, 26). For example, for medium and small IAs, the size of the neck is related to the choice of surgical method (27, 28). However, delineating the IA itself as the only ROI would eliminate all parent artery information, and the location and size of the IA neck would not be identified. Our simplified model with only 5 manual parameters (irregular shape, DW, BF, mean artery diameter, and SR) contains important information about the IA and its parent artery. Determine the morphological parameters related to IA rupture by measuring them the risk of rupture of this IA is the ultimate goal of morphological measurement. Our research results also fit this purpose perfectly.
This study has several limitations. First, although ruptured IAs were indeed unstable and a previous study reported that unruptured IAs do not shrink when they rupture (29), post-rupture morphology should not be considered an adequate surrogate for pre-rupture morphology, which may generate a possible bias in our results (30). Second, the IA size was not further graded in this study. The measurement and delineation of ROIs for small IAs may be debatable depending on different observers. Third, incidentally discovered IAs with no apparent symptoms are classified as stable, which may lead to misclassification of some unstable IAs. In the future, our aim is to develop a decision-making tool for use in practical clinical environments and to further validate the large number of enrolled patients using prospective, multicenter designs before use in a real clinical setting.
Machine learning models have excellent potential in the classification of unstable IAs. This approach will facilitate the rapid and accurate identification of unstable IAs in clinical practice. Compared to manual parameters, radiomic features did not significantly improve the identification of unstable IAs, and the manual parameters from CTA images are sufficient for developing a simple and effective model for identifying unstable IAs. The accuracy of this simple model needs to be further verified through the use of additional data and randomized controlled studies with multicenter data.
The original contributions presented in the study are included in the article/Supplementary material, further inquiries can be directed to the corresponding author.
The studies involving humans were approved by the Institutional Ethics Committee of Banan hospital and Xinqiao hospital. The studies were conducted in accordance with the local legislation and institutional requirements. The ethics committee/institutional review board waived the requirement of written informed consent for participation from the participants or the participants’ legal guardians/next of kin because this is a retrospective study.
SL: Data curation, Investigation, Writing – original draft. LW: Data curation, Investigation, Writing – review & editing. YJ: Formal analysis, Writing – review & editing. JX: Investigation, Methodology, Writing – review & editing. CH: Investigation, Methodology, Writing – review & editing. ZD: Conceptualization, Resources, Writing – review & editing. GW: Conceptualization, Funding acquisition, Methodology, Writing – review & editing.
The author(s) declare that financial support was received for the research, authorship, and/or publication of this article. This study was supported by the Science and Technology Research Program of Chongqing Municipal Education Commission (KJQN202200407); Banan District Science and Technology Bureau of Chongqing City, China (KY202208135759002); and Talent project of Chongqing, China (ZD, CQYC202103075).
YJ was employed by Huiying Medical Technology Co., Ltd. JX and CH were employed by Beijing Deepwise & League of PHD Technology Co., Ltd.
The remaining authors declare that the research was conducted in the absence of any commercial or financial relationships that could be construed as a potential conflict of interest.
All claims expressed in this article are solely those of the authors and do not necessarily represent those of their affiliated organizations, or those of the publisher, the editors and the reviewers. Any product that may be evaluated in this article, or claim that may be made by its manufacturer, is not guaranteed or endorsed by the publisher.
The Supplementary material for this article can be found online at: https://www.frontiersin.org/articles/10.3389/fneur.2024.1398225/full#supplementary-material
1. Brown, RD Jr, and Broderick, JP. Unruptured intracranial aneurysms: epidemiology, natural history, management options, and familial screening. Lancet Neurol. (2014) 13:393–404. doi: 10.1016/S1474-4422(14)70015-8
2. Etminan, N, and Rinkel, GJ. Unruptured intracranial aneurysms: development, rupture and preventive management. Nat Rev Neurol. (2016) 12:699–713. doi: 10.1038/nrneurol.2016.150
3. Korja, M, Kivisaari, R, Rezai, JB, and Lehto, H. Natural history of ruptured but untreated intracranial aneurysms. Stroke. (2017) 48:1081–4. doi: 10.1161/STROKEAHA.116.015933
4. Connolly, ES, Rabinstein, AA, Carhuapoma, JR, Derdeyn, CP, Dion, J, Higashida, RT, et al. Guidelines for the management of aneurysmal subarachnoid hemorrhage a guideline for healthcare professionals from the American Heart Association/American Stroke Association. Stroke. (2012) 43:1711–37. doi: 10.1161/STR.0b013e3182587839
5. Algra, AM, Lindgren, A, Vergouwen, MDI, Greving, JP, van der Schaaf, IC, van Doormaal, TPC, et al. Procedural clinical complications, case-fatality risks, and risk factors in endovascular and neurosurgical treatment of unruptured intracranial aneurysms. JAMA Neurol. (2018) 76:282–93. doi: 10.1001/jamaneurol.2018.4165
6. Villablanca, JP, Duckwiler, GR, Jahan, R, Tateshima, S, Martin, NA, Frazee, J, et al. Natural history of asymptomatic unruptured cerebral aneurysms evaluated at CT angiography: growth and rupture incidence and correlation with epidemiologic risk factors. Radiology. (2013) 269:258–65. doi: 10.1148/radiol.13121188
7. Backes, D, Rinkel, GJE, Greving, JP, Velthuis, BK, Murayama, Y, Takao, H, et al. ELAPSS score for prediction of risk of growth of unruptured intracranial aneurysms. Neurology. (2017) 88:1600–6. doi: 10.1212/WNL.0000000000003865
8. Wermer, MJH, van der Schaaf, IC, Algra, A, and Rinkel, GJE. Risk of rupture of unruptured intracranial aneurysms in relation to patient and aneurysm characteristics: an updated meta-analysis. Stroke. (2007) 38:1404–10. doi: 10.1161/01.STR.0000260955.51401.cd
9. Greving, JP, Wermer, MJH, Brown, RD, Morita, A, Juvela, S, Yonekura, M, et al. Development of the PHASES score for prediction of risk of rupture of intracranial aneurysms: a pooled analysis of six prospective cohort studies. Lancet Neurol. (2014) 13:59–66. doi: 10.1016/S1474-4422(13)70263-1
10. Headache Classification Committee of the International Headache Society (IHS) the International Classification of Headache Disorders, 3rd edition. Cephalalgia. (2018) 38:1–211. doi: 10.1177/0333102417738202
11. Liu, Q, Jiang, P, Jiang, Y, Ge, H, Li, S, Jin, H, et al. Prediction of aneurysm stability using a machine learning model based on PyRadiomics-derived morphological features. Stroke. (2019) 50:2314–21. doi: 10.1161/STROKEAHA.119.025777
12. Ou, C, Chong, W, Duan, CZ, Zhang, X, Morgan, M, and Qian, Y. A preliminary investigation of radiomics differences between ruptured and unruptured intracranial aneurysms. Eur Radiol. (2020) 31:2716–25. doi: 10.1007/s00330-020-07325-3
13. Zhu, W, Li, W, Tian, Z, Zhang, Y, Wang, K, Zhang, Y, et al. Stability assessment of intracranial aneurysms using machine learning based on clinical and morphological features. Transl Stroke Res. (2020) 11:1287–95. doi: 10.1007/s12975-020-00811-2
14. Zhu, D, Chen, Y, Zheng, K, Chen, C, Li, Q, Zhou, J, et al. Classifying ruptured middle cerebral artery aneurysms with a machine learning based, radiomics-morphological model: a multicentral study. Front Neurosci. (2021) 15:21268. doi: 10.3389/fnins.2021.721268
15. Tong, X, Feng, X, Peng, F, Niu, H, Zhang, B, Yuan, F, et al. Morphology-based radiomics signature: a novel determinant to identify multiple intracranial aneurysms rupture. Aging. (2021) 13:13195–210. doi: 10.18632/aging.203001
16. Ludwig, CG, Lauric, A, Malek, JA, Mulligan, R, and Malek, AM. Performance of Radiomics derived morphological features for prediction of aneurysm rupture status. J Neurointerv Surg. (2021) 13:755–61. doi: 10.1136/neurintsurg-2020-016808
17. An, X, He, J, di, Y, Wang, M, Luo, B, Huang, Y, et al. Intracranial aneurysm rupture risk estimation with multidimensional feature fusion. Front Neurosci. (2022) 16:813056. doi: 10.3389/fnins.2022.813056
18. Alwalid, O, Long, X, Xie, M, Yang, J, Cen, C, Liu, H, et al. CT angiography-based radiomics for classification of intracranial aneurysm rupture. Front Neurol. (2021) 12:619864. doi: 10.3389/fneur.2021.619864
19. Philipp, LR, McCracken, DJ, McCracken, CE, Halani, SH, Lovasik, BP, Salehani, AA, et al. Comparison between CTA and digital subtraction angiography in the diagnosis of ruptured aneurysms. Neurosurgery. (2017) 80:769–77. doi: 10.1093/neuros/nyw113
20. Park, A, Chute, C, Rajpurkar, P, Lou, J, Ball, RL, Shpanskaya, K, et al. Deep earning–asasisted diagnosis of cerebral aneurysms using the HeadXNet model. JAMA Netw Open. (2019) 2:e195600. doi: 10.1001/jamanetworkopen.2019.5600
21. van Griethuysen, JJM, Fedorov, A, Parmar, C, Hosny, A, Aucoin, N, Narayan, V, et al. Computational radiomics system to decode the radiographic phenotype. Cancer Res. (2017) 77:e104–7. doi: 10.1158/0008-5472.CAN-17-0339
22. Gao, L, Qi, L, Chen, E, and Guan, L. Discriminative multiple canonical correlation analysis for information fusion. IEEE Trans Image Process. (2018) 27:1951–65. doi: 10.1109/TIP.2017.2765820
23. Obermeyer, Z, and Emanuel, EJ. Predicting the future–big data, machine learning, and clinical medicine. N Engl J Med. (2016) 375:1216–9. doi: 10.1056/NEJMp1606181
24. Chen, G, Lu, M, Shi, Z, Xia, S, Ren, Y, Liu, Z, et al. Development and validation of machine learning prediction model based on computed tomography angiography–derived hemodynamics for rupture status of intracranial aneurysms: a Chinese multicenter study. Eur Radiol. (2020) 30:5170–82. doi: 10.1007/s00330-020-06886-7
25. Lin, M, Xia, N, Lin, R, Xu, L, Chen, Y, Zhou, J, et al. Machine learning prediction model for the rupture status of middle cerebral artery aneurysm in patients with hypertension: a Chinese multicenter study. Quant Imaging Med Surg. (2023) 13:4867–78. doi: 10.21037/qims-22-918
26. Thompson, BG, Brown, RD, Amin-Hanjani, S, Broderick, JP, Cockroft, KM, Connolly, ES Jr, et al. Guidelines for the management of patients with unruptured intracranial aneurysms. Stroke. (2015) 46:2368–400. doi: 10.1161/STR.0000000000000070
27. Chalouhi, N, Starke, RM, Koltz, MT, Jabbour, PM, Tjoumakaris, SI, Dumont, AS, et al. Stent-assisted coiling versus balloon remodeling of wide-neck aneurysms: comparison of angiographic outcomes. AJNR Am J Neuroradiol. (2013) 34:1987–92. doi: 10.3174/ajnr.A3538
28. Jalbert, JJ, Isaacs, AJ, Kamel, H, and Sedrakyan, A. Clipping and coiling of unruptured intracranial aneurysms among Medicare beneficiaries, 2000 to 2010. Stroke. (2010) 46:2452–7. doi: 10.1161/STROKEAHA.115.009777
29. Rahman, M, Ogilvy, CS, Zipfel, GJ, Derdeyn, CP, Siddiqui, AH, Bulsara, KR, et al. Unruptured cerebral aneurysms do not shrink when they rupture: multicenter collaborative aneurysm study group. Neurosurgery. (2011) 68:155–61. doi: 10.1227/NEU.0b013e3181ff357c
Keywords: unstable intracranial aneurysms, machine learning, CT angiography, radiomics, stability
Citation: Luo S, Wen L, Jing Y, Xu J, Huang C, Dong Z and Wang G (2024) A simple and effective machine learning model for predicting the stability of intracranial aneurysms using CT angiography. Front. Neurol. 15:1398225. doi: 10.3389/fneur.2024.1398225
Edited by:
Kyoko Fujimoto, GE HealthCare, United StatesReviewed by:
Huilin Zhao, Shanghai Jiao Tong University, ChinaCopyright © 2024 Luo, Wen, Jing, Xu, Huang, Dong and Wang. This is an open-access article distributed under the terms of the Creative Commons Attribution License (CC BY). The use, distribution or reproduction in other forums is permitted, provided the original author(s) and the copyright owner(s) are credited and that the original publication in this journal is cited, in accordance with accepted academic practice. No use, distribution or reproduction is permitted which does not comply with these terms.
*Correspondence: Guangxian Wang, d2d4bG92ZTEyMzRAMTYzLmNvbQ==
Disclaimer: All claims expressed in this article are solely those of the authors and do not necessarily represent those of their affiliated organizations, or those of the publisher, the editors and the reviewers. Any product that may be evaluated in this article or claim that may be made by its manufacturer is not guaranteed or endorsed by the publisher.
Research integrity at Frontiers
Learn more about the work of our research integrity team to safeguard the quality of each article we publish.