 Susan Seddiq Zai
 Roshan das Nair
 Christoph Heesen
 Carsten Buhmann4
 Anya Pedersen
 Jana Pöttgen
94% of researchers rate our articles as excellent or good
Learn more about the work of our research integrity team to safeguard the quality of each article we publish.
Find out more
ORIGINAL RESEARCH article
Front. Neurol., 28 February 2024
Sec. Multiple Sclerosis and Neuroimmunology
Volume 15 - 2024 | https://doi.org/10.3389/fneur.2024.1369143
Background and objectives: Research on driving ability in people with multiple sclerosis (MS) suggests that they might be at risk for unsafe driving due to MS-related motor, visual, and cognitive impairment. Our first aim was to investigate differences in driving ability and performance between people with MS (PwMS) and those without any neurologic or psychiatric disease (“controls”). Secondly, we determined disease-related factors influencing driving ability in PwMS.
Methods: We prospectively compared standardized performance in a driving simulator between 97 persons with early MS [mean (SD) = 6.4 (7.3) years since diagnosis, mean (SD) Expanded Disability Status Scale (EDSS) = 2.5 (1.4)] and 94 group-matched controls. Participants completed an extensive examination comprising questionnaires and assessments regarding driving, cognitive and psychological factors, as well as demographic and disease-related measures. Between-group comparisons of driving-relevant neuropsychological tests and driving performance were done. Correlations were performed to define demographic and disease-related factors on driving performance in MS.
Results: In a driving simulator setting, PwMS had more driving accidents [T(188) = 2.762, p = 0.006], reacted slower to hazardous events [T(188) = 2.561, p = 0.011], made more driving errors [T(188) = 2.883, p = 0.004] and had a worse Driving Safety Score (DSS) [T(188) = 3.058, p = 0.003] than controls. The only disease-related measure to be associated with most driving outcomes was the Wechsler Block-Tapping test (WMS-R) backward: number of accidents (r = 0.28, p = 0.01), number of driving errors (r = 0.23, p = 0.05) and DSS (r = −0.23, p = 0.05).
Conclusion: Driving performance in a simulator seems to be reduced in PwMS at an early stage of disease compared to controls, as a result of increased erroneous driving, reduced reaction time and higher accident rate. MS-related impairment in mobility, vision, cognition, and in psychological and demographic aspects showed no or only minimal association to driving ability, but impairment in different areas of cognition such as spatial short-term memory, working memory and selective attention correlated with the number of accidents, and might indicate a higher risk for driving errors and worse performance. These results show that driving ability is a complex skill with involvement of many different domains, which need further research.
Multiple sclerosis (MS) is a chronic neurodegenerative disease and one of the most common neurological diseases in young adults (1). MS frequently leads to severe disabilities in varying areas such as vision, mobility in upper and lower limbs, and cognition (2–4).
Even at an early stage of disease people with MS (PwMS) show impairments across domains (5). PwMS demonstrate significant differences in most sub-domains of cognition within the first five years of diagnosis when compared to controls (5), with up to 61% of PwMS showing some form of cognitive decline within the first ten years of diagnosis (6). Additionally, there has been evidence of significant physical impairment in early MS, especially walking impairment (5). Walking disabilities have been linked to the worsening ability to perform complex activities of daily living such as driving (7) while simultaneously increasing patients’ dependency on driving in their daily lives (8).
Driving, however, is a complex task, involving many cognitive, visual, and motor domains and impairment in those domains may affect driving ability and driving safety (9, 10). Research shows that 6 to 38% of PwMS fail an on-road driving assessment (11–21). PwMS also make more mistakes while driving (22), are more likely to be involved in an automobile accident, and are 3.4 times more likely to have visits to emergency departments because of automobile accidents than controls (23). However, most PwMS are not aware that they may have deficits in driving at all (24).
Cognitive impairment, which can occur in the early stages of MS (2, 6), may play a role in deciding whether PwMS should cease driving or not. The research on the link between cognition and driving in MS, however, is inconclusive. Most studies indicate a significant relationship (11, 12, 16–18, 21, 25–31), with cognitive impairment in more than one area, or in combination with visual impairment predicting driving ability (11–13, 17, 18, 21, 26). However, some studies have reported that cognitive impairment does not have an impact on driving (32, 33). The impact of comorbidities, such as depression and fatigue in PwMS, has rarely been studied (34). Altogether, a clear understanding of differences in driving ability in MS compared to those without MS is still lacking. Additionally, little is known about whether and how PwMS with and without impairment in domains such as cognition, mobility, and fatigue differ from each other in driving ability.
Little is known regarding problems with specific driving parameters in MS, such as control of speed, tracking stability, recognition of dangerous situations (35). Standardized measures to assess driving ability and standardized evaluation thresholds do not exist or vary across countries, and are largely not evidence-based (36). Additionally, real-world on-road driving assessments can potentially be unsafe for PwMS, assessors, and other road users (32), and do not allow for the creation of standardized reproducible driving settings for group comparisons. It may also be difficult and expensive to evaluate performance details in driving evaluations without modified vehicles (33), especially to assess challenges with a high risk for crashes (37). Therefore, driving simulators present an option to safely and continuously monitor driving performance in PwMS over standardized routes (33).
The aim of this study was to (1) compare driving ability and driving performance of PwMS and controls in a standardized driving simulation, and (2) evaluate the impact of impairment in mobility, vision, cognition, and psychological factors on driving ability in PwMS.
PwMS were recruited from the MS outpatient clinic in the University Medical Center Hamburg-Eppendorf and through advertisements in our MS-specific newsletter. Control participants were recruited through advertisements (i.e., the hospital newsletter for all employees, hospital Instagram page, and the local newspaper). All participants had to be over 17 years old, have a valid driver’s license and driving experience in the last 6 months. Additionally, the MS group needed to have a confirmed MS diagnoses based on McDonald criteria (38). All MS-subtypes were included. There was no criteria relating to time since diagnosis for PwMS. Participants were excluded if they had a history of other neurological disorders, severe psychiatric disorders (e.g., schizophrenia) and severe simulator sickness (e.g., vomiting or severe vertigo).
Participants were recruited between September 2019 and September 2022, completed a comprehensive examination (see Measures) and the evaluation in the driving simulator. All participants received the study information, and written informed consent was obtained. Participants were asked to complete the questionnaires online, and neuropsychological and visual testing was conducted on site. Driving was assessed in a driving simulator. Overall, assessment time was app. 3 h.
MS-related patient data (i.e., MS type, disease duration, medication, Expanded Disability Status Scale (EDSS)) were obtained from our clinical database. Beck Depression Inventory (BDI) (39) with recommended cut-offs was used to assess depression. The Fatigue Scale for Motor and Cognitive Functions (FSMC) was used to assess fatigue (40). PwMS additionally completed a questionnaire to assess other features (e.g., medication, MS subtype, quality of life, mobility). Visual acuity was measured via an eye chart. We used Early Treatment Diabetic Retinopathy charts (ETDRS charts) to estimate high contrast visual acuity (in decimal format) at 5 meters (41). Each eye was tested separately, and the use of visual aid (e.g., glasses, contact lenses) was allowed.
Before the driving assessment, participants undertook the following neuropsychological examinations:
1. Brief International Cognitive Assessment for Multiple Sclerosis (BICAMS) (42). The BICAMS comprises: (1) the oral version Symbol Digit Modalities Test (SDMT) (43) to measure information processing speed, (2) the immediate recall subtest of the Brief Visuospatial Memory Test-Revised (BVMT-R) (44) to assess visuospatial learning, and (3) the German “Verbal learning and memory test” (Verbaler Lern- und Merkfähigkeitstest, VLMT) (45) to evaluate the short-term memory (supraspan) and verbal learning.
2. Trail Making Test (TMT) Part A and B (46). Part A evaluates visuo-motor function and visual processing speed whereas part B assesses working memory, cognitive flexibility, executive functioning and visual–spatial capabilities.
3. Wechsler Block-Tapping test (WMS-R block span) (47) forward (fw) and backward (bw) was used to measure the spatial short-term (fw) and working memory (bw).
4. The German “Test battery for attentiveness testing for Mobility” (Testbatterie zur Aufmerksamkeitsprüfung, TAP-M, vers. 2.1./2007) (48) to assess attentional capabilities. Four driving-relevant subdomains were evaluated: (1) alertness (median of reaction time (RT) in milliseconds (ms)), (2) divided attention (median of RT to auditory signals, median of RT to visual signals, number of missed signals, number of errors), (3) visual scanning (median of RT to critical stimuli [a target symbol (a square open at the top) slightly differing from the other symbols (squares with openings either on one of the sides or at the bottom) displayed], median of RT to non-critical stimuli [only non-target symbols displayed], number of missed critical stimuli and number of errors), (4) Go-No-Go to assess selective attention (median of RT, number of missed signals and number of errors).
We used the driving simulator Foerst Model F10-P (Dr.-Ing. Reiner Foerst GmbH, Wiehl; Germany). The driving simulator provides a realistic driver’s cabin of a recreated Ford Fiesta (see Figure 1), with a steering wheel, pedals (brake, accelerator, clutch) and a shift stick. The simulator could be driven either on automatic or manually. A wide screen (2,95 m X 0,55 m, divided into 3 parts) projected the driving scenarios. The screens additionally showed the windscreen, the rear-view mirror and the side mirrors, so the traffic behind could be observed. The dashboard contained a speedometer showing the velocity in km/h; windshield wiper, lights and indicator could be activated manually. An integrated sound system simulated motor, velocity and collision sounds and was used to give directions to the participants. A camera recorded movements of the head as well as the participants’ line of gaze.
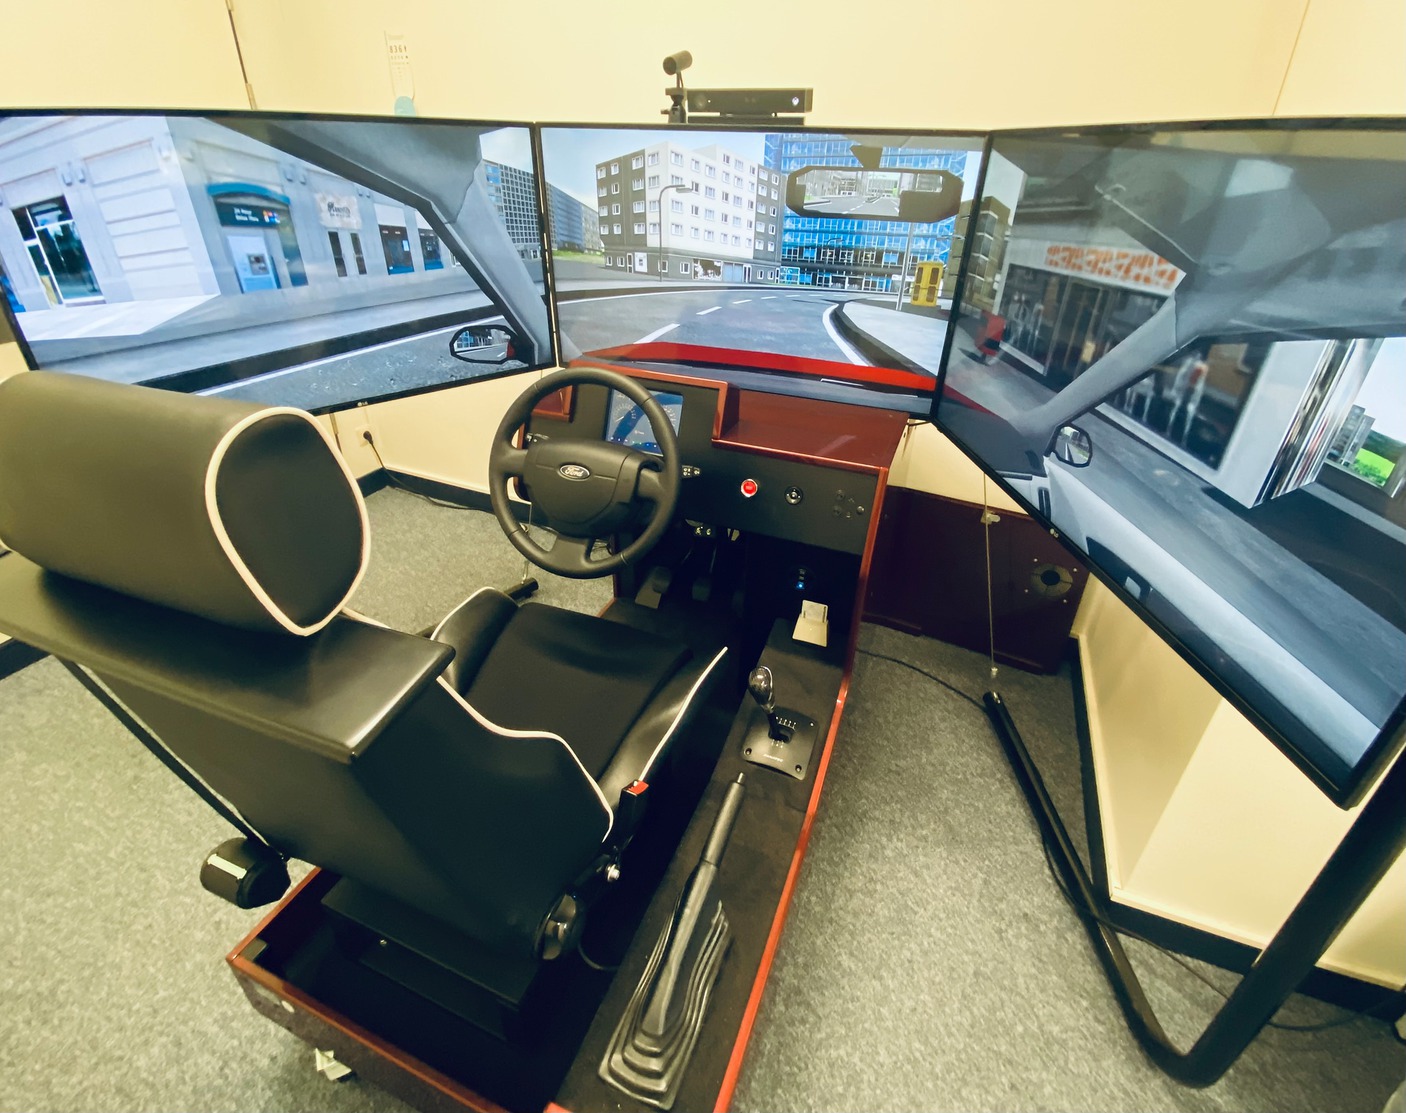
Figure 1. The driving simulator Foerst Model F10-P that was used in our study is shown here.
The two driving scenarios (training route and main route) consisted of a drive on a rural and an urban road during daylight with good weather conditions. The routes had different hazards implemented, which forced participants to hit the brakes as fast as possible to avoid crashing:
• A car pulling out unexpectedly
• A person running onto the street
• A deer running onto the street
• A parked car on the right side has its door opened unexpectedly.
Depending on individual speed, the training route took approximately 3–6 min, and the main route took 8–13 min.
The following parameters were evaluated to assess participants’ individual driving performance:
1. Number of accidents
2. Mean reaction time (mRT) in seconds (s) to a hazardous event on the road. The sum of all RTs was divided by the number of registered RTs.
3. Driving errors: Thirteen pre-defined typical driving errors were calculated (see Table 1) (49). The driving errors were detected and recorded automatically (log file) by the simulator. The driving errors were used to determine the Number of Driving Errors (NDE) and the Driving Safety Score (DSS). The NDE is the sum of all driving errors. The DSS is a composite score considering both the frequency and the seriousness of driving errors. The seriousness of the driving errors are scored with a severity factor weighted according to safety-clinical relevance with errors like not using a turn signal and driving a little slow rated as less severe, and errors like missing a red light or getting into an accident rated as severe.
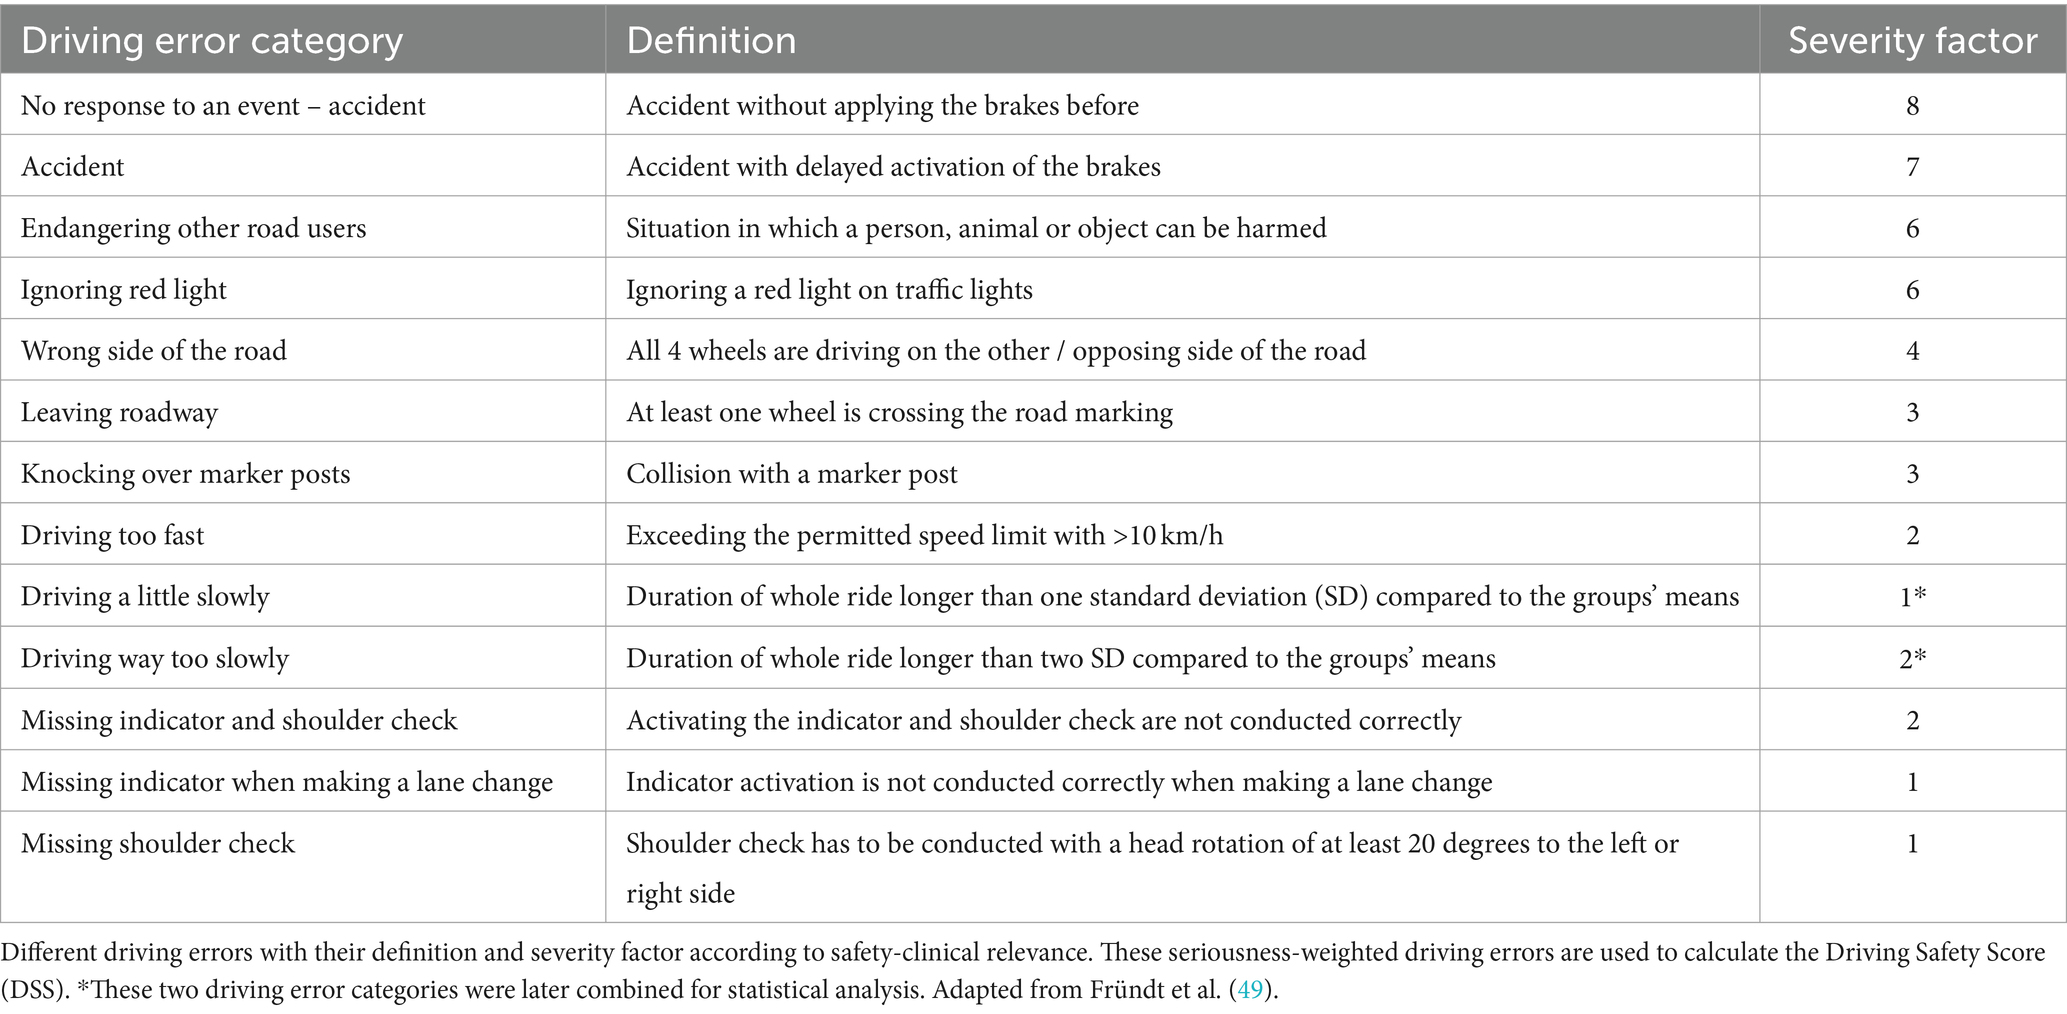
Table 1. Definition and severity factor of driving errors.
The driving data were recorded in a simulator-provided log file and transformed into a SPSS file. The results of demographic and MS-specific data, questionnaires/scores and neuropsychiatric tests were added afterwards. IBM SPSS version 29 was used for all statistical analysis.
Descriptive analyses of demographic and clinical data were performed. Quantitative variables are described by their mean (M) and standard deviation (SD). Qualitative variables are expressed in percentages. Group comparisons (between PwMS and controls) were performed using t-tests of means and Welch-test, chi-square tests (χ2) were used to analyze qualitative variables, and to compare quantitative variables. Effect sizes (ES) were calculated with Cohen’s d.
Correlations were performed using Pearson’s (for linear variables) and Spearman’s (for ordered variables) correlation coefficient to investigate associations between all measures (i.e., demographic data, MS-specific data, results of the neuropsychiatric and neuropsychological tests) and driving performance.
To identify differences in PwMS, exploratory extreme value analyses were performed. For the extreme values, we used the lowest and the highest quartile of data (age, EDSS) in the group of PwMS and conducted t-tests for independent measures. To identify differences between the groups related to fatigue vs. non-fatigue and moderate/severe depression vs. non-depression, we used the appropriate cut-offs.
We conducted one-way ANCOVAs with the different driving outcomes (mRT, number of accidents, NDE or DSS) as the dependent variable, group (PwMS vs. controls) as the independent variable and depression, fatigue and visual acuity as covariates, since we found significant group differences regarding these outcomes.
A significance value of α = 5% (p < 0.05) was used in all analyses.
The study was approved by the local ethics committee and is in accordance with the Declaration of Helsinki (Votum No. 11/2019-PTK-HH).
A total of 247 people were recruited (121 PwMS and 126 age-and gender-matched controls). 97 PwMS and 94 controls completed the main route driving scenario. 23 PwMS and 32 controls were excluded from the analysis because they could not finish the driving scenario due to motion sickness, two participants (one PwMS and one control participant) were excluded for not having a valid driving license at the time of testing.
PwMS (39 ± 11.07 years, 51% women, 49% men, 69% relapsing remitting MS (RRMS)) and controls (37 ± 15.27 years, 60% women, 40% men) did not differ on any demographic data (Table 2). Both groups differed in visual acuity [T(181) = −11.86, p < 0.001], with PwMS having poorer eyesight than controls.
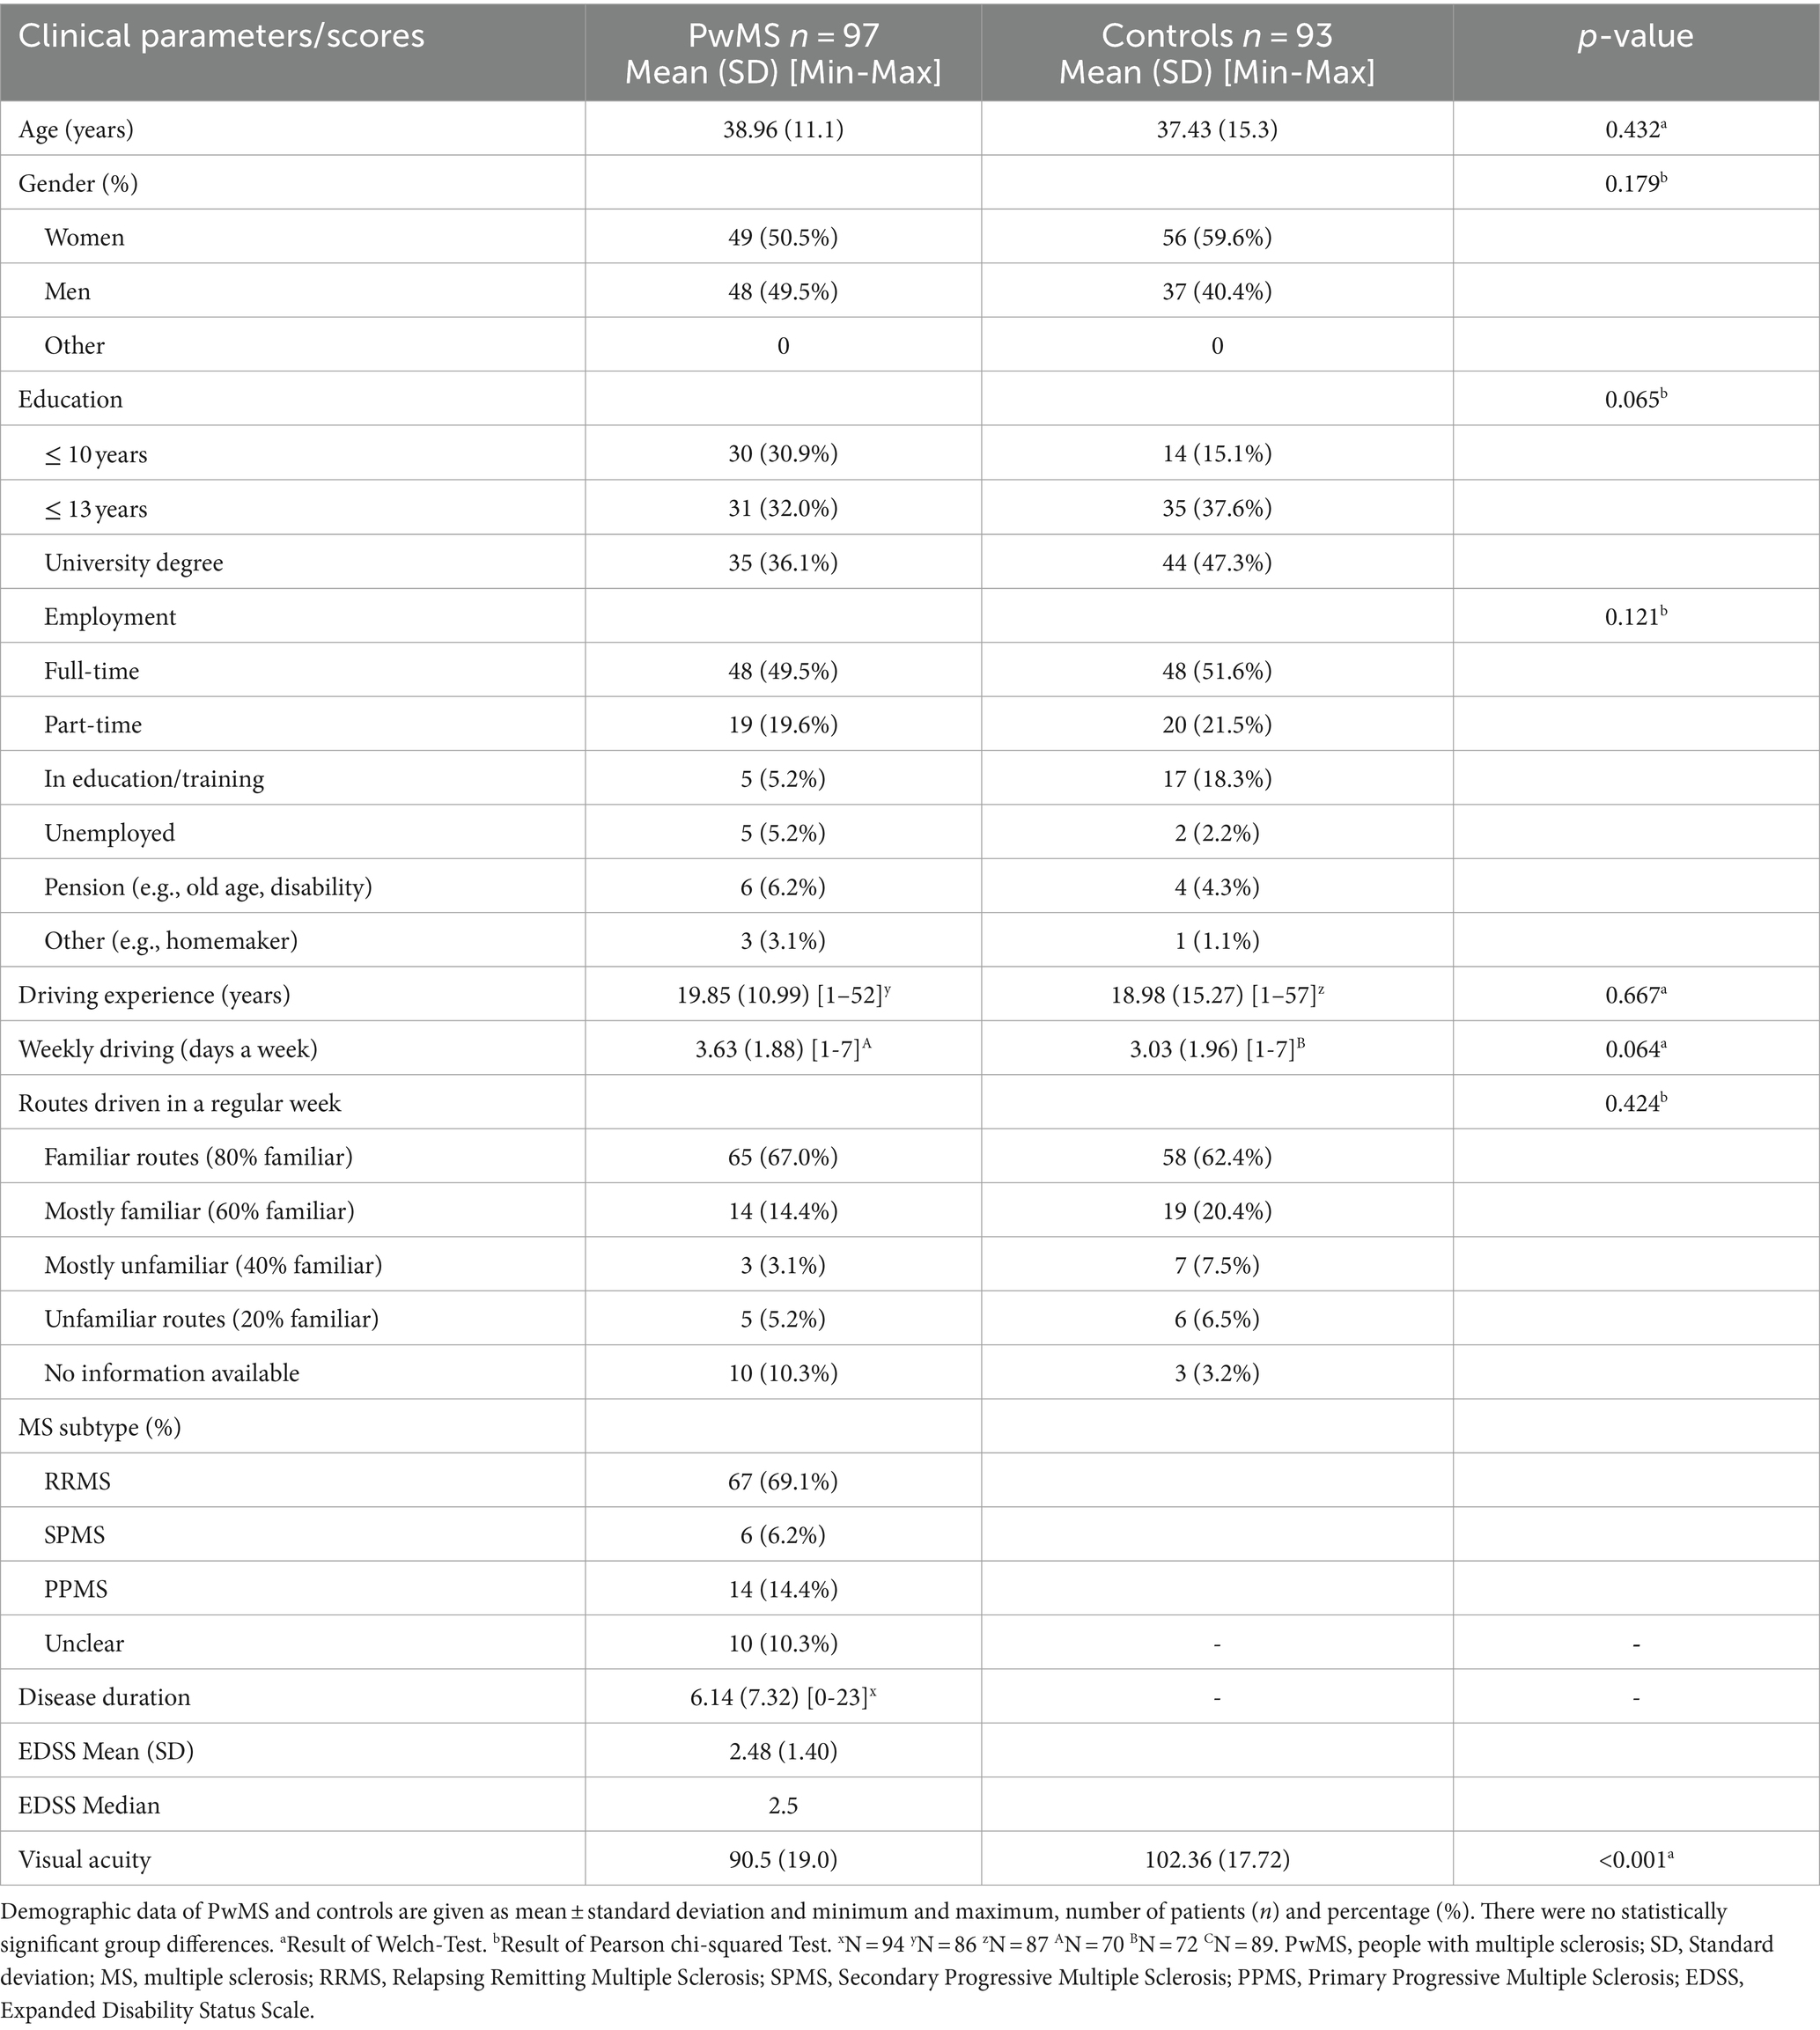
Table 2. Demographic and clinical data of PwMS and controls.
The results of the neuropsychological and psychological assessment are reported in Table 3. The groups differed on TAP-M Alertness; PwMS had slower reaction times (RT) [T(169.25) = 5.617, p < 0.001] than controls. For TAP-M Visual Scanning, the groups showed differences for their RTs to critical stimuli [T(187) = 3.651, p < 0.001] and non-critical stimuli [T(187) = 2.705, p = 0.007], with PwMS having reduced RTs compared to controls. For the TAP-M Go-No-go, testing selective attention, PwMS had reduced RT [T(178.84) = 5.297, p < 0.001] than controls. For TAP-M divided attention, PwMS and controls only differed in their RT for visual stimuli, with PwMS reaction slower than controls [T(177.31) = 2.773, p = 0.006]. There were no significant differences for the RT to auditory stimuli on TAP-M divided attention or the number of misses or errors in any of the TAP-M tests.
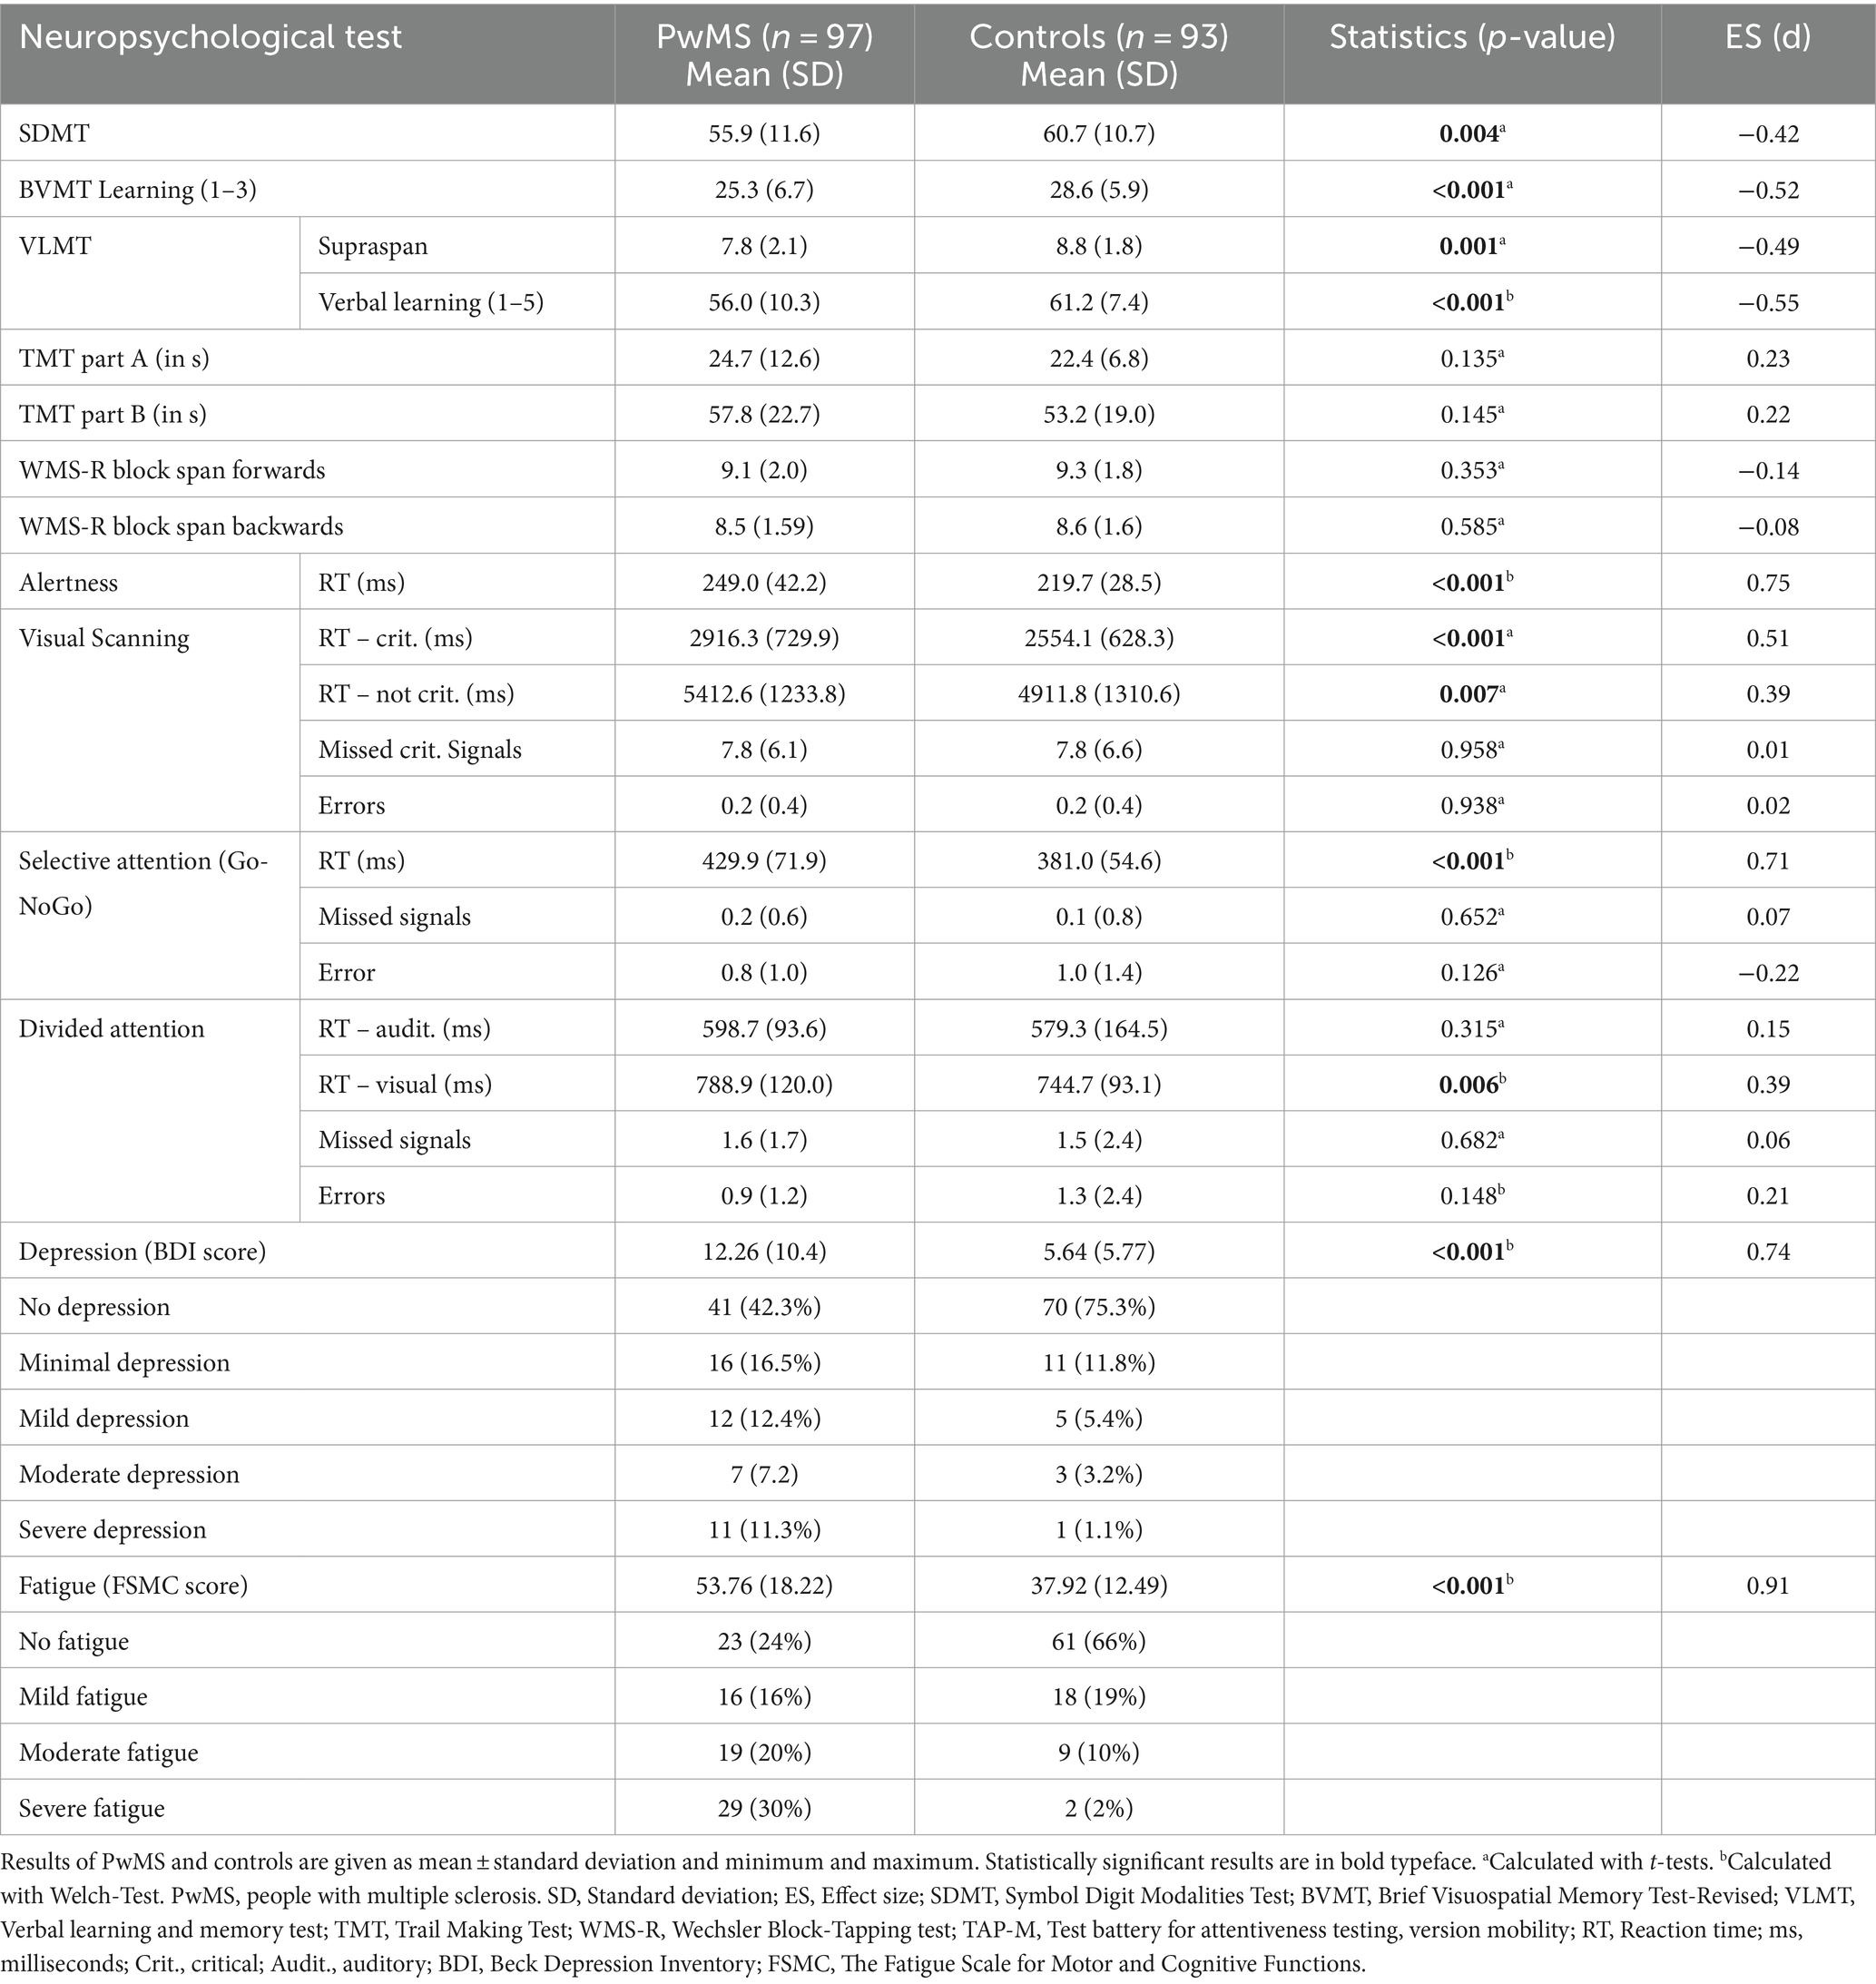
Table 3. Results of neuropsychological and psychological tests.
PwMS and controls also differed on SDMT [T(186) = −2.909, p = 0.004], BVMT [T(188) = −3.702, p < 0.001], VLMT supraspan [T(185) = −3.483, p = 0.001], and VLMT verbal learning [T(173,60) = −3.967, p < 0.001], with PwMS performing worse than controls. We did not find a significant between-group difference in TMT-A, TMT-B, WMS-R block span forwards, and WMS-R block span backwards (all p > 0.05).
41 PwMS (42%) and 70 controls (75%) did not show signs of depression according to BDI-II cut-off scores. Overall, PwMS were more depressed than controls [T(133.41) = 6.620, p > 0.001]. 61 controls (66%) and 23 PwMS (24%) did not show any signs of fatigue. 29 (30%) PwMS were classified as having severe fatigue while only 2 (2%) controls reported severe fatigue. PwMS scored higher on the FSMC [T(151.63) = 15.836, p > 0.001] measuring fatigue, indicating higher levels of persistent tiredness and exhaustion in the MS-group than in controls.
The results of the main driving parameters (i.e., mRT, number of accidents, DSS and NDE) are given in Table 4. PwMS reacted slower to hazardous events (mRT) [T(188) = 2.561, p = 0.011], had more accidents [T(188) = 2.762, p = 0.006], higher NDE [T(188) = 2.883, p = 0.004], and higher DSS [T(188) = 3.058, p = 0.003] than controls.
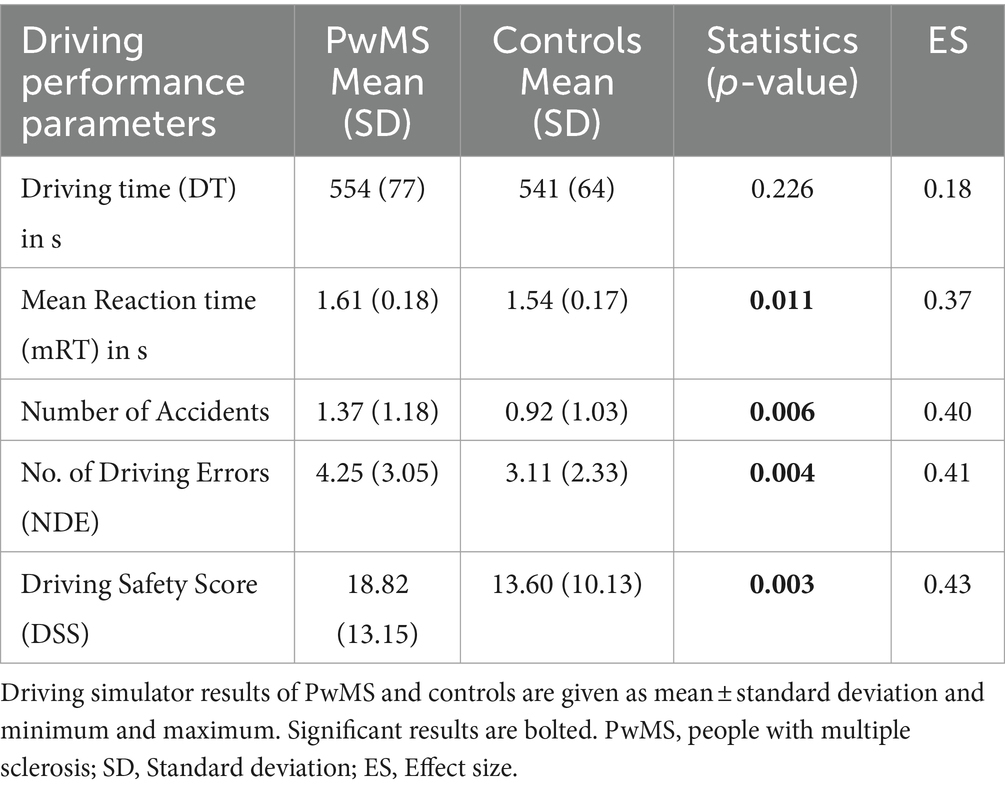
Table 4. Driving performance results.
Since we found differences between the groups on visual acuity (see Table 2), depression and fatigue (see Table 3), we conducted one-way ANCOVAs to determine the difference between PwMS and controls on the driving outcomes, controlling for visual acuity, depression and fatigue.
After adjusting for depression, the interaction between the groups (PwMS vs. controls) and the driving outcomes remained significant, indicating that depression had no significant interaction in the group differences. PwMS still showed slower mRT [F(1, 174) = 6.16, p = 0.014, η2 = 0.034], had more accidents [F(1, 174) = 8.557, p = 0.004, η2 = 0.047], higher NDE [F(1, 174) = 6.758, p = 0.010, η2 = 0.038] and higher DSS [F(1, 174) = 9.427, p = 0.002, η2 = 0.051] than controls.
Similarly, the interaction between both groups remained significant when controlled for fatigue. PwMS reacted slower [F(1, 174) = 5.22, p = 0.024, η2 = 0.029], made more accidents [F(1, 174) = 6.298, p = 0.013, η2 = 0.035], had higher NDE [F(1, 174) = 7.724, p = 0.006, η2 = 0.043] and higher DSS [F(1, 174) = 6.470, p = 0.012, η2 = 0.036] than controls.
Adjusting for visual acuity, the interaction between PwMS and controls remained significant for the number of accidents [F(1, 180) = 9.802, p = 0.002, η2 = 0.052], NDE [F(1, 180) = 13.753, p = 0.000, η2 = 0.071] and DSS [F(1, 180) = 13.096, p = 0.000, η2 = 0.068]. No significant interaction was found for mRT [F(1, 180) = 3.083, p = 0.081, η2 = 0.017] when adjusted for visual acuity, showing that visual acuity has a significant interaction in the group difference for mRT.
To explore whether cognitive impairment in MS relates to driving ability, we computed correlations between the neuropsychological measures and the driving outcomes (Table 5).
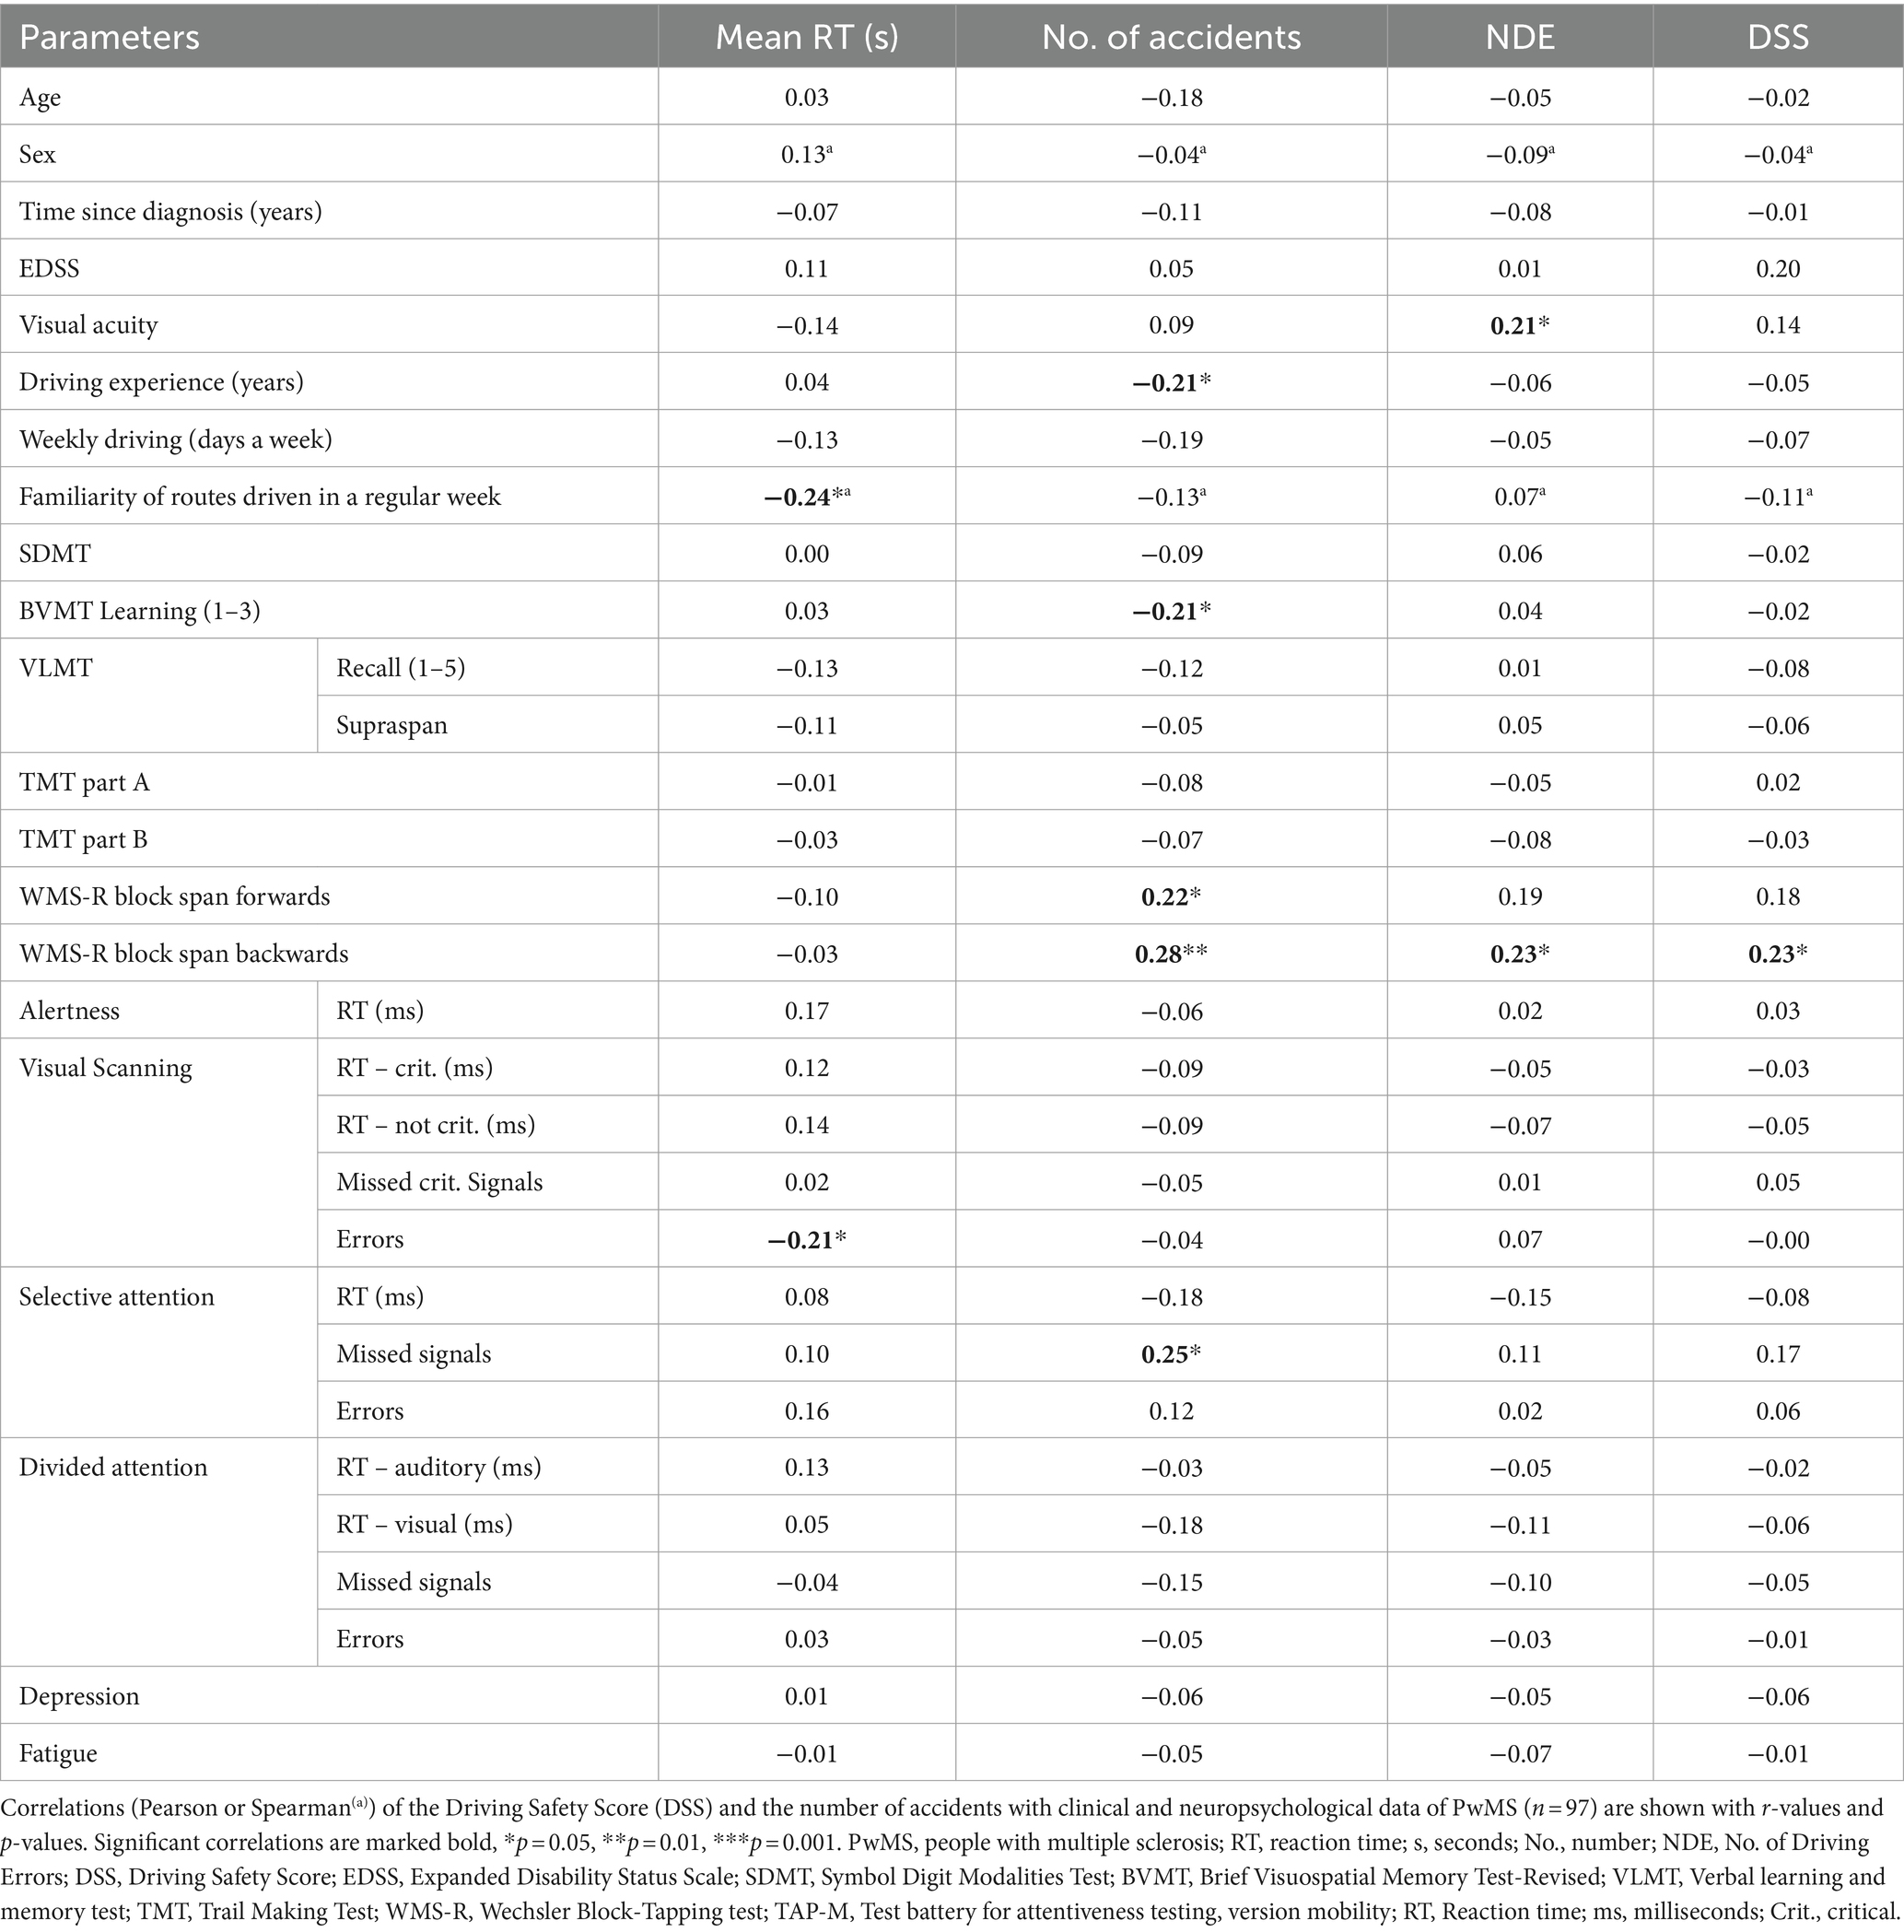
Table 5. Correlations with driving-related outcomes (PwMS).
A negative correlation was shown between mRT and the number of errors in TAP-M Visual scanning (r = −0.21, p = 0.05) and mRT and the familiarity of routes driven in a regular week (r = −0.24, p = 0.026), indicating PwMS who regularly drove more unfamiliar routes reacted quicker to hazardous events than PwMS who drove unfamiliar routes less often.
Significant positive correlations were found between the number of accidents and missing the stimuli in TAP-M Go-No-go (r = 0.254, p = 0.012), Wechsler Block-Tapping test (WMS-R) block span forwards (r = 0.225, p = 0.031), WMS-R block span backwards (r = 0.281, p = 0.007) and the mRT to hazardous events (mRT) (r = 0.277, p = 0.006). Significant negative correlations were found between the number of accidents and driving experience in years (r = −0.213, p = 0.049) and BVMT (r = −0.208, p = 0.041), indicating that PwMS who have more accidents have less driving experience, remember less in BVMT.
The NDE correlated with visual acuity (r = 0.21, p = 0.05) and WSM-R blockspan backward (r = 0.23, p = 0.05). For DSS, significant positive correlations were found only with the WMS-R block span backwards (r = 0.234, p = 0.025).
No correlation remained significant when controlled for multiple comparisons.
An exploratory analysis of the data for the extreme groups in reaction time, number of accidents, NDE and DSS was conducted. We found no significant differences in driving outcomes for age, EDSS, cognitive impairment and depression.
Results of the correlations between all measures (i.e., demographic, cognitive and psychological measures) and the driving outcomes in controls can be found in the Supplementary material. The only significant correlations found for controls were between the number of accidents and driving experience in years (r = −0.228, p = 0.033), between mRT and the number of errors in TAP-M Go-No-go (r = 0.210, p = 0.043), and mRT and the number of errors in TAP-M divided attention (r = −0.241, p = 0.020).
This is one of the few studies that investigated differences in driving ability between PwMS and controls in a standardized driving simulation, and evaluated the impact of impairment in different functional areas such as mobility, vision, cognition and psychological factors on driving performance in PwMS. To our knowledge, this is the largest study of PwMS assessed in a driving simulator addressing these specific associations.
PwMS performed worse in a driving simulator compared to controls. This supports previous findings assessing driving in PwMS (27–29, 32, 37). PwMS reacted slower to hazardous events, had more accidents, made more driving errors (NDE), and had higher severe errors (DSS) than controls, indicating poorer driving ability within the simulator setting.
Most accidents occurred when the participants were driving fast (on a country road without speed limits) or when they faced sudden critical challenges (e.g., a child obscured by a truck suddenly stepping onto the street or a car door opening unexpectedly). This suggests that delayed reaction time resulting in late braking is the main cause of accidents in MS patients. Another study found the increased accident rate in PwMS particularly in monotonous driving situations and attributed this to a lower arousal rate compared to controls (28). However, in our study, accidents occurred in both monotonous and non-monotonous situations.
PwMS also made more NDE and had more DSS than controls, which shows that the slower reaction time alone may not be the only reason for the higher number of accidents in PwMS. In other studies assessing driving performance in a simulated setting, PwMS were also shown to have performed worse in different areas of driving, such as the standard deviation of lateral position (27, 29), adjustments to stimuli errors (32, 37), greater variability in speed maintenance (29), and a greater number of concentration faults (28). While those errors do not completely translate to the scores used in this study, aspects of all of them can be found in the NDE and the DSS, with speed, lateral position and stimuli errors being taken into account in both scores. The use of different driving simulators with different settings, scores and driving performance measures make it difficult to compare others’ findings with ours, but they indicate (almost consistently across studies) that driving performances is impaired in PwMS.
Both groups did not differ on demographic parameters (e.g., age, sex, employment, etc.). However, differences were found in visual acuity, in neuropsychological scores (e.g., subtests of the TAP-M, SDMT, BVMT, VLMT) and psychological measures (depression and fatigue), which is understandable, considering MS can have an impact on those areas (2, 3, 8). MS-specific impairment seems to have an impact on driving ability in PwMS, however, as shown previously, the extent of the impact remains unclear and somewhat inconsistent (34).
In prior research, different MS-related impairments in terms of mobility, vision, cognition, and in psychological and demographic aspects were found to negatively impact driving ability, but the data were inconsistent (34, 35).
In our study, no demographic features were associated with driving outcomes, except for driving experience. Driving experience was related to the number of accidents – PwMS with less driving experience had more accidents than those with more experience. The same association was found for controls, and was the only significant correlation for both PwMS and controls. Prior research showed that drivers with 6–10-year driving experience had the most number of accidents, followed by drivers with 3-year, while drivers with 20+ years driving experience account for the lowest number of accidents (50). This demonstrates that this is also perhaps a complex (non-linear) association, with more accidents happening initially due to lack of experience in dealing with hazardous events, and a subsequent increase in accidents with increased confidence in driving but not with associated skills, followed by a reduction with improved confidence and skills.
No significant relations were found between EDSS and any of the driving outcomes, which is in line with previous research on driving ability in PwMS, demonstrating that (mild) physical disability has no or only partial impact on driving performance (34, 35).
Visual acuity was related only to NDE, with PwMS with higher visual acuity making more mistakes than PwMS with less visual acuity. This is especially interesting, as multiple studies have found lower visual acuity to have a significant impact on driving ability in PwMS (14, 16, 26). A possible reason for this result could be that in our study we only checked for farsightedness due to social distancing rules during the COVID-19 pandemic. Checking nearsightedness and other visual functions (e.g., contrast sensitivity, glare recovery, depth perception) would have been important, especially considering that watching a monitor (on which the driving simulation was shown) requires good nearsightedness and contrast sensitivity. It is possible that participants with good farsightedness are more likely to have problems with nearsightedness, which would explain the positive relation to NDE. A main effect was found for visual acuity and mRT, indicating that PwMS reacting slower to hazardous events may be a result of worse visual acuity. PwMS differed significantly in visual acuity from controls, so a reason for their slower reaction time could be that they did not immediately see the hazardous event. No main effect or interaction was found between visual acuity and the other driving outcomes.
Our MS group showed clinically relevant and increased fatigue compared to controls. However, we did not find fatigue to have an impact on driving performance, which is in line with prior research (12, 25–27). Additionally, no differences were found between PwMS and controls in the driving outcomes, when we controlled for fatigue. A possible reason for these results could be the brevity of the driving assessment (about 9 min). Longer driving sessions may reveal differences between PwMS with and without fatigue better. On the other hand, a study, which had PwMS drive on a standardized road for 45 min, found that fatigue had no impact on driving performance (12). Therefore, perhaps PwMS have learnt to compensate or deal with their fatigue while driving.
Depression was not related to any of the driving outcomes. While some research has suggested that driving performance may be affected in individuals with depression (51), others have found inconclusive evidence of this association in PwMS (34). Since PwMS and controls significantly differed in depression, we investigated the group differences in the driving outcomes and controlled them for depression. No main effect or interaction was found in this study, indicating that while PwMS were more depressed than controls, differences in driving ability were not a result of depression. Prior research has also shown that PwMS who have symptoms of depression tend to have higher levels of cognitive impairment (52, 53). In our study, cognitive impairment was also greater in PwMS in some of the neuropsychological tests than in controls.
Whether cognitive impairment relates to driving ability is unclear, because prior research has shown the data to be inconsistent and contradictory (34, 35), with some studies suggesting cognitive impairment can predict driving ability (11–13, 17, 18, 21, 26), while other no impact on driving (32, 33). Studies reporting an impact of cognitive impairment on driving ability have differed in which areas of cognition are important, with contradictory results (34, 35). Similarly, our results on the impact of cognition on driving ability were inconsistent. We did find all driving outcomes (mean reaction time, number of accidents, NDE and DSS) to correlate with at least one neuropsychological measure but no test was consistently associated with all driving outcomes. The only test score that correlated with 3 out of 4 of the driving outcomes was the WMS-R block span. But, it should be noted that no correlation remained significant when controlled for multiple comparisons.
The results of the correlations of the WMS-R block span forward and backward showed that visual–spatial short-term and working memory are associated with having more accidents. The WMS-R block span backward also showed a positive correlation to NDE and DSS, indicating that a better performance in the test means making more driving errors and having more severe driving errors. We would have hypothesized that a good performance in the WMS-R would indicate the opposite: fewer accidents, lower NDE and lower DSS. A possible explanation for these results could be that implicit awareness of good visual–spatial short-term and working memory might make PwMS more confident in their own ability, which in turn might lead to driving less carefully. A prior study showed that PwMS drove more and had more driving incidents (e.g., accidents and traffic violations) if they felt they did not have cognitive deficits for which they needed to compensate (24).
For all other measures that were related to a driving outcome the association was as hypothesized, with worse performance in the test being related to worse driving performance. PwMS who had more accidents remembered less in BVMT and missed more signals in the selective attention test, while PwMS who reacted more slowly to hazardous events made more errors in the visual scanning test.
Overall, many of the neuropsychological measures only showed minimal to no association to driving ability, especially scores frequently used in studies investigating driving ability like TMT-A, TMT-B and SDMT. Generally, prior research on driving performance in other cohorts (such as older drivers or those with Parkinson’s disease) has found cognitive impairment to be a strong predictor for impaired driving for those groups (54). In PwMS, those results were, similar to the results of this study, less convincing (34, 35). A reason for this might be that the PwMS tested in this study were relatively young and had early MS. And, while PwMS did significantly differ from controls in some of the neuropsychological tests in this study, there was no sign of impairment in others (e.g., TMT-A and B, WMS-R fw and bw), indicating cognitive impairment is still mild in this cohort. Prior studies found older PwMS to have more impairment in cognition than young and middle-aged PwMS (55) and that PwMS show a greater decline in physical ability than in cognition in the first 10 years of their disease (56). Therefore, the MS cohort may have been too young and not cognitively impaired enough to show significant differences. Although, it is also possible that the tests used were not sensitive enough to show the differences.
While this, to our knowledge, is the largest study to assess cognition, related clinical and psychological factors and driving ability in a simulator, we acknowledge that there are some limitations. Firstly, the driving simulator setting might not exactly reflect real-life driving. For instance, in such a study setting, where people are being closely monitored, they may be extra vigilant or nervous compared to unobserved on-road driving. However, research has shown that driving simulators, like the one we used, closely mimic on-road driving behaviors and reflect on-road driving properly (57).
Secondly, while we tried to explore different cognitive and neuropsychological domains by using different tests, we acknowledge that there is an overlap in domains assessed in each of these tests (58). For instance, while the WMS-R block span purportedly assesses visuospatial memory, it also relies on attention and concentration abilities. Therefore, the precise nature of the effect of each of these cognitive domains should be treated with some caution.
Also, it should be noted, that most of our MS participants, being early on in their MS journey, only had low levels of physical and cognitive disability. It is possible that most of the MS-impairment did not show an association on driving ability because the population was not impaired enough.
Our results show that PwMS, even those with early MS, had more accidents, slower reaction time to hazardous events, made more driving errors and had more severe mistakes in a driving simulation than controls, which could indicate that PwMS have more difficulties to drive safely compared to controls. Unfortunately, as of now, there is no validated tool to identify PwMS who might not be able to drive safely without extensive testing because there is a lack of validated predictive test batteries for driving ability (34). As the extent of impact MS-specific impairment has on driving ability remains unclear and inconsistent, further research into the topic is necessary. Multiple studies, including ours, could show a difference in driving ability between PwMS and controls, however, consistent predictors for impaired driving are still lacking (27–29, 32, 37). While cognition may impact driving ability, it is unclear to what extent and in which areas, as we found an association between all driving outcomes with at least one neuropsychological measure, but no test was consistently associated with all driving outcomes. This suggests that it is not one cognitive area alone that impacts driving ability.
Future research might benefit from investigating older PwMS, with longer disease duration and more disease progression (particularly greater cognitive and physical impairment), because this may be useful in exploring how MS-specific impairments worsen driving ability. The results of our study show that PwMS have more problems in driving compared to controls, but it remains unclear which areas of MS-specific impairment impact driving ability in PwMS exactly and how great this impact is. Many of the regularly used neuropsychological and physical tests appear not to be sensitive enough for those with mild impairments, so having PwMS with greater impairments might help in identifying different factors that affect driving ability. It might also be beneficial to have longitudinal studies in this area, to see how disease progression and MS-specific impairment affects driving ability over time. Additionally, it might be advisable to use different tools for assessment of impairment, e.g., The Stroke Driver Screening Assessment (59) (SDSA) and the Useful Field of View test (60, 61) (UFOV), have both been found to be promising tools (34, 35).
It should be noted that while we found differences between PwMS and controls in driving, this does not automatically translate to PwMS not being able to drive safely. There should be further research, especially research with on-road driving tests, as the data we have as of now would not justify recommending driving cessation for all PwMS. However, it shows that this is an important issue that should be discussed with PwMS early on. This is especially important as many physicians do not make recommendations on driving or only do so after an adverse event (e.g., a car crash) has already taken place (61). To ensure PwMS are aware of the possibility of declining driving ability and allow them to compensate for it, physicians should routinely discuss driving issues.
The raw data supporting the conclusions of this article will be made available by the authors, without undue reservation.
The studies involving humans were approved by Psychotherapeutenkammer Hamburg. The studies were conducted in accordance with the local legislation and institutional requirements. The participants provided their written informed consent to participate in this study.
SS: Conceptualization, Data curation, Formal analysis, Investigation, Methodology, Project administration, Writing – original draft, Writing – review & editing. RN: Conceptualization, Writing – original draft, Writing – review & editing. CH: Conceptualization, Funding acquisition, Investigation, Methodology, Project administration, Writing – original draft, Writing – review & editing. CB: Conceptualization, Methodology, Writing – original draft, Writing – review & editing. AP: Formal analysis, Methodology, Writing – original draft, Writing – review & editing. JP: Conceptualization, Formal analysis, Funding acquisition, Investigation, Methodology, Project administration, Resources, Supervision, Writing – original draft, Writing – review & editing.
The author(s) declare that financial support was received for the research, authorship, and/or publication of this article. This study was sponsored via an independent grant by Merck Healthcare Germany GmbH, Weiterstadt, Germany (CrossRef Funder ID: 10.13039/100009945). The funder was not involved in the study design, collection, analysis, interpretation of data, the writing of this article or the decision to submit it for publication. We acknowledge financial support from the Open Access Publication Fund of UKE - Universitätsklinikum Hamburg-Eppendorf and DFG – German Research Foundation.
We thank Lisa Heil, Elena Fricke, Pauline Gerschwitz, Lea Wintz, and Laura Kiel for their assistance in data collection.
CB has received fees for advisory board participation from UCB Pharma and Zambon, lecture fees from AbbVie Pharma, BIAL Pharma, TAD Pharma, UCB Pharma, and Zambon Pharma. CH received research grants from Merck, Novartis, and speaker honoraria from Merck and Roche. JP has received funding to present lectures on fatigue from GAIA AG, for investigator-initiated studies from Merck and Celgene. RN has received funding to present lectures on cognitive screening and rehabilitation in MS (speakers’ bureau) from Merck, Novartis, and Biogen.
The remaining authors declare that the research was conducted in the absence of any commercial or financial relationships that could be construed as a potential conflict of interest.
All claims expressed in this article are solely those of the authors and do not necessarily represent those of their affiliated organizations, or those of the publisher, the editors and the reviewers. Any product that may be evaluated in this article, or claim that may be made by its manufacturer, is not guaranteed or endorsed by the publisher.
The Supplementary material for this article can be found online at: https://www.frontiersin.org/articles/10.3389/fneur.2024.1369143/full#supplementary-material
1. Howard, J, Trevick, S, and Younger, DS. Neurologic clinics. Epidemiology of multiple sclerosis. (2016). 34:919–39. doi: 10.1016/j.ncl.2016.06.016
2. Chiaravalloti, ND, and DeLuca, J. Cognitive impairment in multiple sclerosis. Lancet Neurol. (2008) 7:1139–51. doi: 10.1016/S1474-4422(08)70259-X
3. Coenen, M, Basedow-Rajwich, B, König, N, Kesselring, J, and Cieza, A. Functioning and disability in multiple sclerosis from the patient perspective. Chronic Illn. (2011) 7:291–310. doi: 10.1177/1742395311410613
4. Balcer, LJ, Miller, DH, Reingold, SC, and Cohen, JA. Vision and vision-related outcome measures in multiple sclerosis. Brain. (2015) 138:11–27. doi: 10.1093/brain/awu335
5. Thrue, C, Riemenschneider, M, Hvid, LG, Stenager, E, and Dalgas, U. Time matters: early-phase multiple sclerosis is accompanied by considerable impairments across multiple domains. Mult Scler. (2021) 27:1477–85. doi: 10.1177/1352458520936231
6. Gromisch, ES, and Dhari, Z. Identifying early neuropsychological indicators of cognitive involvement in multiple sclerosis. Neuropsychiatr Dis Treat. (2021) 17:323–37. doi: 10.2147/NDT.S256689
7. Salter, AR, Cutter, GR, Tyry, T, Marrie, RA, and Vollmer, T. Impact of loss of mobility on instrumental activities of daily living and socioeconomic status in patients with MS. Curr Med Res Opin. (2010) 26:493–500. doi: 10.1185/03007990903500649
8. Kister, I, Chamot, E, Salter, AR, Cutter, GR, Bacon, TE, and Herbert, J. Disability in multiple sclerosis: a reference for patients and clinicians. Neurology. (2013) 80:1018–24. doi: 10.1212/WNL.0b013e3182872855
9. Owsley, C, and McGwin, G. Vision and driving. Vis Res. (2010) 50:2348–61. doi: 10.1016/j.visres.2010.05.021
10. Anstey, KJ, and Wood, J. Chronological age and age-related cognitive deficits are associated with an increase in multiple types of driving errors in late life. Neuropsychology. (2011) 25:613–21. doi: 10.1037/a0023835
11. Akinwuntan, AE, O'Connor, C, McGonegal, E, Turchi, K, Smith, S, Williams, M, et al. Prediction of driving ability in people with relapsing-remitting multiple sclerosis using the stroke driver screening assessment. Int J MS Care. (2012) 14:65–70. doi: 10.7224/1537-2073-14.2.65
12. Akinwuntan, AE, Devos, H, Stepleman, L, Casillas, R, Rahn, R, Smith, S, et al. Predictors of driving in individuals with relapsing-remitting multiple sclerosis. Mult Scler. (2013) 19:344–50. doi: 10.1177/1352458512451944
13. Akinwuntan, AE, Backus, D, Grayson, J, and Devos, H. Validation of a short cognitive battery to screen for fitness-to-drive of people with multiple sclerosis. Eur J Neurol. (2018) 25:1250–4. doi: 10.1111/ene.13690
14. Classen, S, Krasniuk, S, Morrow, SA, Alvarez, L, Monahan, M, Danter, T, et al. Visual correlates of fitness to drive in adults with multiple sclerosis. OTJR (Thorofare NJ). (2018) 38:15–27. doi: 10.1177/1539449217718841
15. Krasniuk, S, Classen, S, Morrow, SA, Monahan, M, Danter, T, Rosehart, H, et al. Driving errors that predict on-road outcomes in adults with multiple sclerosis. OTJR (Thorofare NJ). (2017) 37:115–24. doi: 10.1177/1539449217708554
16. Krasniuk, S, Classen, S, Monahan, M, Danter, T, He, W, Rosehart, H, et al. A strategic driving maneuver that predicts on-road outcomes in adults with multiple sclerosis. Transport Res F: Traffic Psychol Behav. (2019) 60:147–56. doi: 10.1016/j.trf.2018.10.014
17. Lincoln, NB, and Radford, KA. Cognitive abilities as predictors of safety to drive in people with multiple sclerosis. Mult Scler. (2008) 14:123–8. doi: 10.1177/1352458507080467
18. Morrow, SA, Classen, S, Monahan, M, Danter, T, Taylor, R, Krasniuk, S, et al. On-road assessment of fitness-to-drive in persons with MS with cognitive impairment: a prospective study. Mult Scler. (2018) 24:1499–506. doi: 10.1177/1352458517723991
19. Ranchet, M, Akinwuntan, AE, Tant, M, Neal, E, and Devos, H. Agreement between Physician's recommendation and fitness-to-drive decision in multiple sclerosis. Arch Phys Med Rehabil. (2015) 96:1840–4. doi: 10.1016/j.apmr.2015.06.010
20. Schultheis, MT, Weisser, V, Manning, K, Blasco, A, and Ang, J. Driving behaviors among community-dwelling persons with multiple sclerosis. Arch Phys Med Rehabil. (2009) 90:975–81. doi: 10.1016/j.apmr.2008.12.017
21. Schultheis, MT, Weisser, V, Ang, J, Elovic, E, Nead, R, Sestito, N, et al. Examining the relationship between cognition and driving performance in multiple sclerosis. Arch Phys Med Rehabil. (2010) 91:465–73. doi: 10.1016/j.apmr.2009.09.026
22. Dehning, M, Kim, J, Nguyen, CM, Shivapour, E, and Denburg, NL. Neuropsychological performance, brain imaging, and driving violations in multiple sclerosis. Arch Phys Med Rehabil. (2014) 95:1818–23. doi: 10.1016/j.apmr.2014.05.022
23. Lings, S. Driving accident frequency increased in patients with multiple sclerosis. Acta Neurol Scand. (2002) 105:169–73. doi: 10.1034/j.1600-0404.2002.1o165.x
24. Ryan, KA, Rapport, LJ, Telmet Harper, K, Fuerst, D, Bieliauskas, L, Khan, O, et al. Fitness to drive in multiple sclerosis: awareness of deficit moderates risk. J Clin Exp Neuropsychol. (2009) 31:126–39. doi: 10.1080/13803390802119922
25. Devos, H, Brijs, T, Alders, G, Wets, G, and Feys, P. Driving performance in persons with mild to moderate symptoms of multiple sclerosis. Disabil Rehabil. (2013) 35:1387–93. doi: 10.3109/09638288.2012.731468
26. Devos, H, Ranchet, M, Backus, D, Abisamra, M, Anschutz, J, Allison, CD, et al. Determinants of on-road driving in multiple sclerosis. Arch Phys Med Rehabil. (2017) 98:1332–1338.e2. doi: 10.1016/j.apmr.2016.10.008
27. Harand, C, Mondou, A, Chevanne, D, Bocca, ML, and Defer, G. Evidence of attentional impairments using virtual driving simulation in multiple sclerosis. Mult Scler Relat Disord. (2018) 25:251–7. doi: 10.1016/j.msard.2018.08.005
28. Kotterba, S, Orth, M, Eren, E, Fangerau, T, and Sindern, E. Assessment of driving performance in patients with relapsing-remitting multiple sclerosis by a driving simulator. ENE. (2003) 50:160–4. doi: 10.1159/000073057
29. Marcotte, TD, Rosenthal, TJ, Roberts, E, Lampinen, S, Scott, JC, Allen, RW, et al. The contribution of cognition and spasticity to driving performance in multiple sclerosis. Arch Phys Med Rehabil. (2008) 89:1753–8. doi: 10.1016/j.apmr.2007.12.049
30. Schultheis, MT, Garay, E, and DeLuca, J. The influence of cognitive impairment on driving performance in multiple sclerosis. Neurology. (2001) 56:1089–94. doi: 10.1212/WNL.56.8.1089
31. Shawaryn, MA, Schultheis, MT, Garay, E, and DeLuca, J. Assessing functional status: exploring the relationship between the multiple sclerosis functional composite and driving. Arch Phys Med Rehabil. (2002) 83:1123–9. doi: 10.1053/apmr.2002.33730
32. Krasniuk, S, Classen, S, Morrow, SA, Alvarez, L, He, W, Srinivasan, S, et al. Clinical predictors of driving simulator performance in drivers with multiple sclerosis. Mult Scler. (2021) 27:2085–92. doi: 10.1177/1352458521992507
33. Raphail, A-MA, Vickers, KL, Leist, TP, and Schultheis, MT. The relationship between multiple sclerosis symptom severity measures and performance on driving variability metrics in a virtual reality simulator. Am J Phys Med Rehabil. (2020) 99:278–84. doi: 10.1097/PHM.0000000000001351
34. Seddiq Zai, S, Heesen, C, Buhmann, C, das Nair, R, and Pöttgen, J. Driving ability and predictors for driving performance in multiple sclerosis: a systematic review. Front Neurol. (2022) 13:1056411. doi: 10.3389/fneur.2022.1056411
35. Krasniuk, S, Classen, S, Morrow, SA, Tippett, M, Knott, M, and Akinwuntan, A. Clinical determinants of fitness to drive in persons with multiple sclerosis: systematic review. Arch Phys Med Rehabil. (2019) 100:1534–55. doi: 10.1016/j.apmr.2018.12.029
36. Bro, T, and Lindblom, B. Strain out a gnat and swallow a camel?- vision and driving in the Nordic countries. Acta Ophthalmol. (2018) 96:623–30. doi: 10.1111/aos.13741
37. Krasniuk, S, Classen, S, and Morrow, SA. Driving errors that predict simulated rear-end collisions in drivers with multiple sclerosis. Traffic Inj Prev. (2021) 22:212–7. doi: 10.1080/15389588.2021.1883008
38. Thompson, AJ, Banwell, BL, Barkhof, F, Carroll, WM, Coetzee, T, Comi, G, et al. Diagnosis of multiple sclerosis: 2017 revisions of the McDonald criteria. Lancet Neurol. (2018) 17:162–73. doi: 10.1016/S1474-4422(17)30470-2
39. Beck, AT, Steer, RA, and Brown, G. Psyc TESTS dataset. Washington, DC: American Psychological Association (APA) (1996).
40. Penner, IK, Raselli, C, Stöcklin, M, Opwis, K, Kappos, L, and Calabrese, P. The fatigue scale for motor and cognitive functions (FSMC): validation of a new instrument to assess multiple sclerosis-related fatigue. Mult Scler. (2009) 15:1509–17. doi: 10.1177/1352458509348519
41. Ferris, FL, Kassoff, A, Bresnick, GH, and Bailey, I. New visual acuity charts for clinical research. Am J Ophthalmol. (1982) 94:91–6. doi: 10.1016/0002-9394(82)90197-0
42. Langdon, DW, Amato, MP, Boringa, J, Brochet, B, Foley, F, Fredrikson, S, et al. Recommendations for a brief international cognitive assessment for multiple sclerosis (BICAMS). Mult Scler. (2012) 18:891–8. doi: 10.1177/1352458511431076
44. BVMT-R. (1997). Brief visuospatial memory test—revised. Available at: https://scholar.google.com/citations?user=qbo6c2kaaaaj&hl=en&oi=sra
45. VLMT. (1990). Verbaler Lern-und Merkfähigkeitstest: Ein praktikables und differenziertes Instrumentarium zur Prüfung der verbalen Gedächtnisleistungen; Available at: https://psycnet.apa.org/record/1991-71834-001
46. Reitan, RM. Trail making test results for normal and brain-damaged children. Percept Mot Skills. (1971) 33:575–81. doi: 10.2466/pms.1971.33.2.575
47. Wechsler, D. (1987). Wechsler memory scale-revised. Psychological Corporation. Available at: https://cir.nii.ac.jp/crid/1573105974508393472
49. Fründt, O, Fadhel, M, Heesen, C, Seddiq Zai, S, Gerloff, C, Vettorazzi, E, et al. Do impulse control disorders impair Car driving performance in patients with Parkinson's disease? J Parkinsons Dis. (2022) 12:2261–75. doi: 10.3233/JPD-223420
50. Hu, L, Bao, X, Wu, H, and Wu, W. A study on correlation of traffic accident tendency with driver characters using in-depth traffic accident data. J Adv Transp. (2020) 2020:1–7. doi: 10.1155/2020/9084245
51. Wickens, CM, Smart, RG, and Mann, RE. The impact of depression on driver performance. Int J Ment Health Addiction. (2014) 12:524–37. doi: 10.1007/s11469-014-9487-0.
52. Anderson, JR, Fitzgerald, KC, Murrough, JW, Katz Sand, IB, Sorets, TR, Krieger, SC, et al. Depression symptoms and cognition in multiple sclerosis: Longitudinal evidence of a specific link to executive control. Mult. Scler. J. (2023) 29:1632–45.
53. Emerson, JL, Johnson, AM, Dawson, JD, Uc, EY, Anderson, SW, and Rizzo, M. Predictors of driving outcomes in advancing age. Psychol Aging. (2012) 27:550–9. doi: 10.1037/a0026359
54. Baird, JF, Cederberg, KLJ, Sikes, EM, Jeng, B, Sasaki, JE, Sandroff, BM, et al. Changes in cognitive performance with age in adults with multiple sclerosis. Cogn Behav Neurol. (2019) 32:201–7. doi: 10.1097/WNN.0000000000000200
55. Beckerman, H, Kempen, JCE, Knol, DL, Polman, CH, Lankhorst, GJ, and de Groot, V. The first 10 years with multiple sclerosis: the longitudinal course of daily functioning. J Rehabil Med. (2013) 45:68–75. doi: 10.2340/16501977-1079
56. Mullen, N, Charlton, J, Devlin, A, and Bedard, M. Simulator validity: Behaviours observed on the simulator and on the road In: DL Fisher, M Rizzo, J Caird, and JD Lee, editors. Handbook of Driving Simulation for Engineering, Medicine and Psychology. Boca Raton, FL: CRC Press (2011). 1–18.
57. Harvey, PD. Domains of cognition and their assessment. Dialogues Clin Neurosci. (2019) 21:227–37. doi: 10.31887/DCNS.2019.21.3/pharvey
58. Nouri, FM, and Lincoln, NB. Validation of a cognitive assessment: predicting driving performance after stroke. Clin Rehabil. (1992) 6:275–81. doi: 10.1177/026921559200600402
59. Wood, JM, and Owsley, C. Useful field of view test. GER. (2014) 60:315–8. doi: 10.1159/000356753
60. Ball, K, and Owsley, C. The useful field of view test: a new technique for evaluating age-related declines in visual function. J Am Optom Assoc. (1993) 64:71–9.
Keywords: multiple sclerosis, driving, cognition, driving simulator, driving ability, fatigue, depression, cognitive impairment
Citation: Seddiq Zai S, das Nair R, Heesen C, Buhmann C, Pedersen A and Pöttgen J (2024) Factors affecting driving performance in patients with Multiple Sclerosis – still an open question. Front. Neurol. 15:1369143. doi: 10.3389/fneur.2024.1369143
Edited by:
Emilio Portaccio, Careggi University Hospital, ItalyReviewed by:
Laura Jennie Smith, Queen Mary University of London, United KingdomCopyright © 2024 Seddiq Zai, das Nair, Heesen, Buhmann, Pedersen and Pöttgen. This is an open-access article distributed under the terms of the Creative Commons Attribution License (CC BY). The use, distribution or reproduction in other forums is permitted, provided the original author(s) and the copyright owner(s) are credited and that the original publication in this journal is cited, in accordance with accepted academic practice. No use, distribution or reproduction is permitted which does not comply with these terms.
*Correspondence: Susan Seddiq Zai, cy5zZWRkaXEtemFpQHVrZS5kZQ==
Disclaimer: All claims expressed in this article are solely those of the authors and do not necessarily represent those of their affiliated organizations, or those of the publisher, the editors and the reviewers. Any product that may be evaluated in this article or claim that may be made by its manufacturer is not guaranteed or endorsed by the publisher.
Research integrity at Frontiers
Learn more about the work of our research integrity team to safeguard the quality of each article we publish.