 Juwei Wang
 Tingting Chen1
 Wenzong Zhu
94% of researchers rate our articles as excellent or good
Learn more about the work of our research integrity team to safeguard the quality of each article we publish.
Find out more
SYSTEMATIC REVIEW article
Front. Neurol., 31 January 2024
Sec. Dementia and Neurodegenerative Diseases
Volume 15 - 2024 | https://doi.org/10.3389/fneur.2024.1348778
Background: Brain atrophy is a type of neurological and psychiatric disorder characterized by a decrease in brain tissue volume and weight for various reasons and can have a serious impact on the quality of life of patients. Although there are many studies on brain atrophy, there is a lack of relevant bibliometric studies. Therefore, this study aims to provide a visual analysis of global trends in brain atrophy research over the past 16 years.
Methods: CiteSpace and VOSviewer were used to visually analyze publication output, scientific collaborations, cocitations, publishing journals, and keywords to determine the current status and future trends of brain atrophy research. Materials published from 2008 to 2023 were collected from the Web of Science Core Collection (WoSCC) database. This study placed no restrictions on the types of literature and focused on English language publications.
Results: A total of 3,371 publications were included in the analysis. From 2008 to 2023, the number of publications increased annually. In terms of national and academic institutions, universities in the United States and University College London rank first in publication out. Barkhof Frederik and Zivadinov Robert are the most prolific researchers in this field. The publication with the highest cocitation strength is “Deep gray matter volume loss drives disability worsening in multiple sclerosis.” Keyword clustering analysis showed that “Alzheimer’s disease” and “multiple sclerosis” are current popular topics. The analysis of emergent words indicates that “cerebral small vessel disease,” “neurodegeneration,” and “cortex/gray matter volume” may become hot research topics in the coming years.
Conclusion: This study analyses papers on brain atrophy from the past 16 years, providing a new perspective for research in this field. In the past 16 years, research on brain atrophy has received increasing attention. The quality of articles in this field is generally high. Extensive national cooperation already exists. The statistical results indicate that a stable core author group in the field of brain atrophy has almost formed.
Brain atrophy is a type of neurological and psychiatric disorder characterized by a decrease in brain tissue volume and weight that is commonly seen in the elderly but also can occur in adolescents and young children. Imaging of these patients usually shows widening and deepening of the sulci, flattening of the gyri, and enlargement of the ventricles, cisterns, and subarachnoid space. There are many causes of cerebral atrophy, including but not limited to Alzheimer’s disease, Multiple sclerosis, aging, cerebrovascular diseases, epilepsy, brain tumors, and encephalitis. In addition, other studies have reported that the risk factors of the development of brain atrophy include diabetes, hypertension, heart disease, and alcohol consumption, and the reduction in brain volume usually accelerates with age (1).
The symptoms of cerebral atrophy include cognitive impairment (e.g., memory decline, intellectual impairment), personality changes (e.g., depression, paranoia), neurological symptoms (e.g., dizziness, headaches), and degradation of limb motor function. Among these symptoms, cognitive impairment is the most significant change. Although patients with brain atrophy may not have any symptoms initially, their risk of developing dementia increases (2). Currently, the treatment for brain atrophy is mainly symptomatic and primary treatment, but brain atrophy cannot be completely cured. In addition, brain atrophy spans various diseases, such as Alzheimer’s disease, multiple sclerosis, Parkinson’s disease, and other well-known related diseases (3–5). The extensive volume of literature also poses a challenge for comprehensive reviews, making it cumbersome for researchers to efficiently identify key information in the field. Critical insights, such as leading countries, institutions, or authors from a statistical perspective, become challenging to discern amidst the vast amount of available material.
Bibliometrics is the study of academic publications (papers, books, conferences, etc.) in a certain field, using statistical data analysis to determine the current research status, hot topics, and future trends (6). This scientific analysis can be completed with specialized software, with CiteSpace and VOSviewer being the most widely used (7). CiteSpace was developed by Professor Chaomei Chen from Drexel University in the United States (8). VOSviewer is published by Nees Jan van Eck and Ludo Walterman from Leiden University in the Netherlands (9). This article employs VOSViewer as a supplemental tool and mainly relies on CiteSpace; by selecting appropriate literature, analyzing the frequency, journals, countries, institutions, and keywords of brain atrophy, and summarizing the research status and development, this study provides a reference for future research.
The materials were collected from the Web of Science Core Collection (WoSCC) database. Compared to Scopus, EI Compendex, CSSCI and CNKI, the WoSCC database is more comprehensive and reliable. We used the following search terms: TS = (“Brain Atrophy” OR “Cerebral Atrophy” OR “Encephal atrophy” OR “Gray Matter Atrophy” OR “Subcortical Atrophy”). The search was completed on October 9, 2023, including publications from 2008 to 2023. The language was restricted to English, but there were no restrictions on the type of literature. The index format was Science Citation Index Expanded (SCI-EXPANDED), Current Chemical Reactions (CCR-EXPANDED), and Index Chemicus (IC).
A total of 8,847 articles were retrieved. We manually screened the literature from each year and eliminated irrelevant publications. After exporting a plain text, 3,393 records that met the requirements were obtained. After deduplication, a total of 3,371 samples were obtained. A flow chart of the study retrieval and selection process is shown in Figure 1. These data do not involve identifiable information from patients and therefore the study did not require ethical review. We mainly used CiteSpace (v6.1, r6) for statistics, while VOSviewer 1.6.19 was used for analysis of journal publication volume and citation statistics.
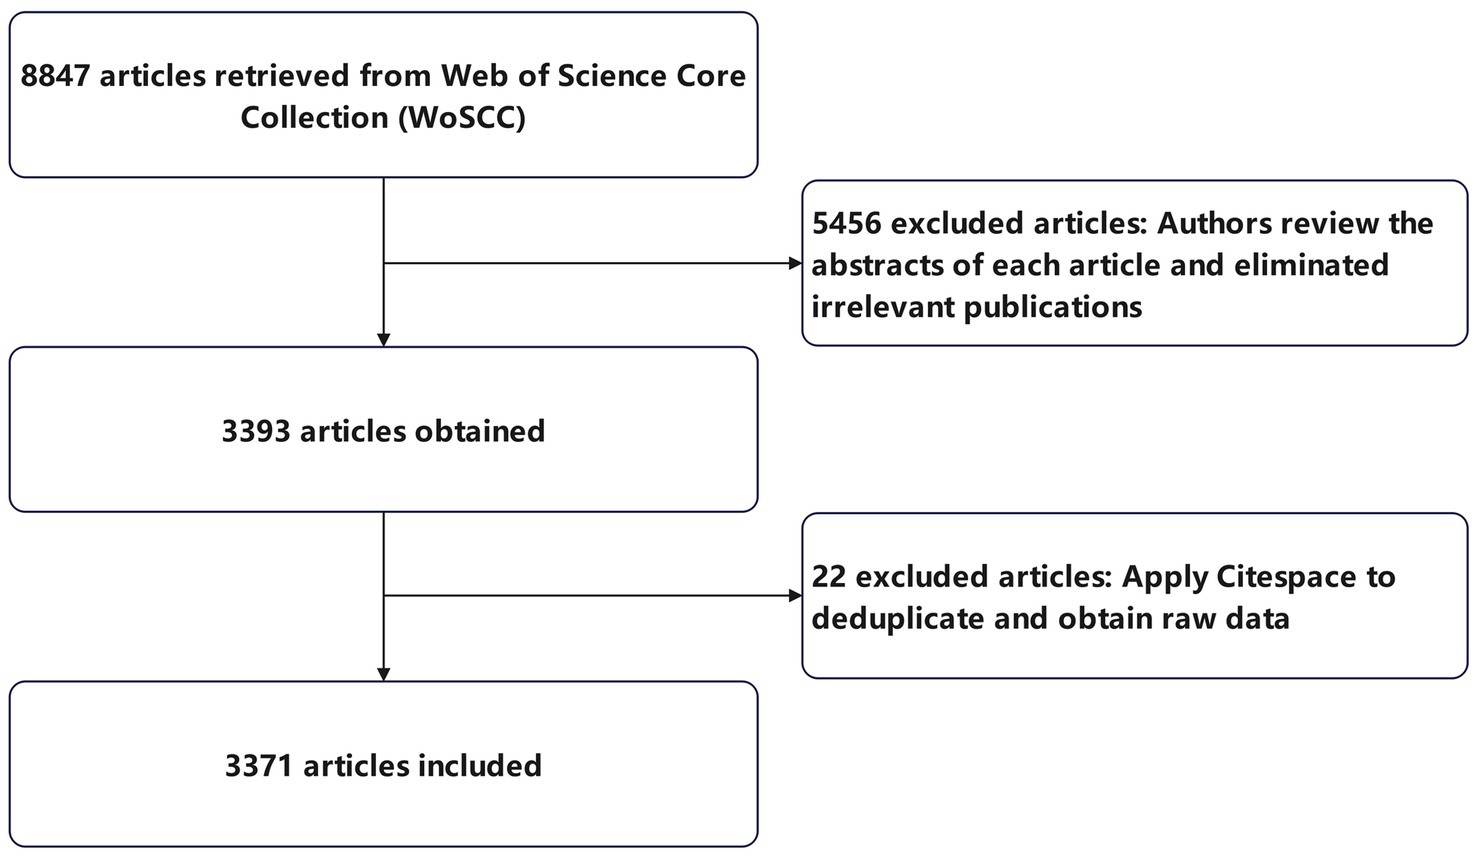
Figure 1. Flow chart of the study retrieval and selection process.
The CiteSpace settings were as follows: a “time slicing” value of 1 year was used; Pathfinder and Pruningsliced networks were selected for graph drawing; the factor K of the G-index was set to 25; and the TopN% was set to 10%. The image nodes and connections were adjusted according to the purpose of each analysis. Analyses using VOSviewer were performed with the default settings.
The area of the node circle represents the number of papers published by each country/institution/author or the frequency of keywords in the co-occurrence network. Links represent the existence of cooperative or co-occurrence relationships, and the thickness of the connection represents the strength of the association.
Centrality is an indicator that measures the importance of nodes in a network. The higher the centrality, the more links a given node has to other nodes.
“Dual-map overlays” can be used to make the citation and citation relationships of various publications clearer (10). In this system, the distribution of cited journals is presented on the left, while the distribution of cited journals is presented on the right. The curve represents the citation line, which displays the specific citation relationship.
Cocitation analysis was first proposed by the US central intelligence agency in 1973. Henry Smaller referred to the process of two articles being cited simultaneously by a third article as cocitation. This concept is now an important component of bibliometrics and has been proven to be a useful method for identifying key literature on interdisciplinary ideas (11).
“Burst Keywords” are words that are frequently cited over a short period. Their distributions can predict frontier trends. In these visualizations, the red bar represents the popularity of the word during a period, while light green bars have the opposite meaning.
A total of 3,371 articles were included in this study. Figure 2 shows the number of published papers per year for 16 consecutive years, with the vertical axis representing the number of published papers and the horizontal axis representing the year. The popularity of brain atrophy research is gradually increasing, and the annual publication volume was stabled from 2016 to 2019. However, in 2020, the publication of papers entered an outbreak phase and was not impacted by the COVID-19 pandemic. Overall, brain atrophy is receiving increasing attention.
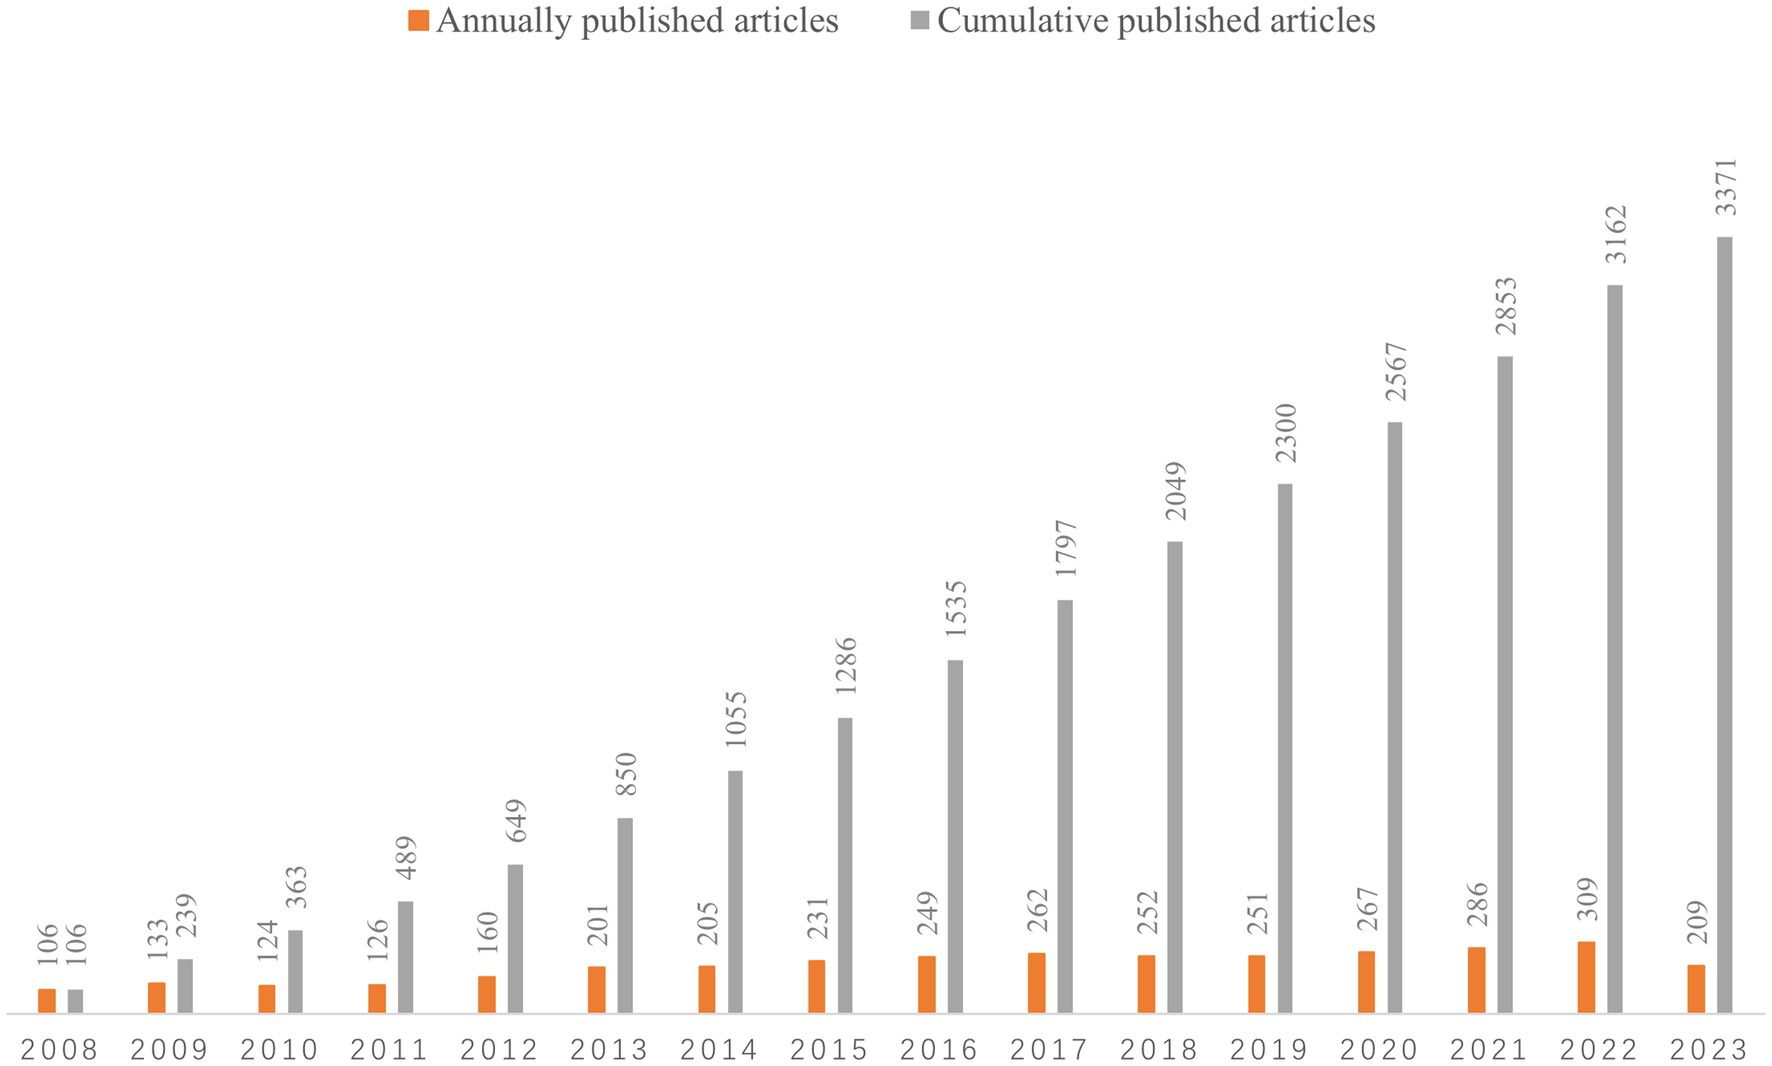
Figure 2. The number of annually published articles and cumulative number of published articles.
The included articles originated from 83 different countries. More than half of the articles came from the top three countries: the United States published the most articles (1,145, 34.0%), followed by England (409, 12.1%) and Italy (381, 11.3%), as shown in Table 1. Using CiteSpace and examining country nodes, Figure 3 shows a national collaborative network map. There are 83 nodes (N) and 358 connections (E) in the national cooperation relationship graph, with a network density of 0.1052, indicating that extensive scientific cooperation between countries has occurred. Among countries, the United States (0.23), Germany (0.21), and England (0.16) have higher centrality, indicating that they each play a crucial role in international cooperation. In addition, we found that Japan mainly cooperates with China and has the least cooperation with other countries, which may be related to its geopolitical environment.
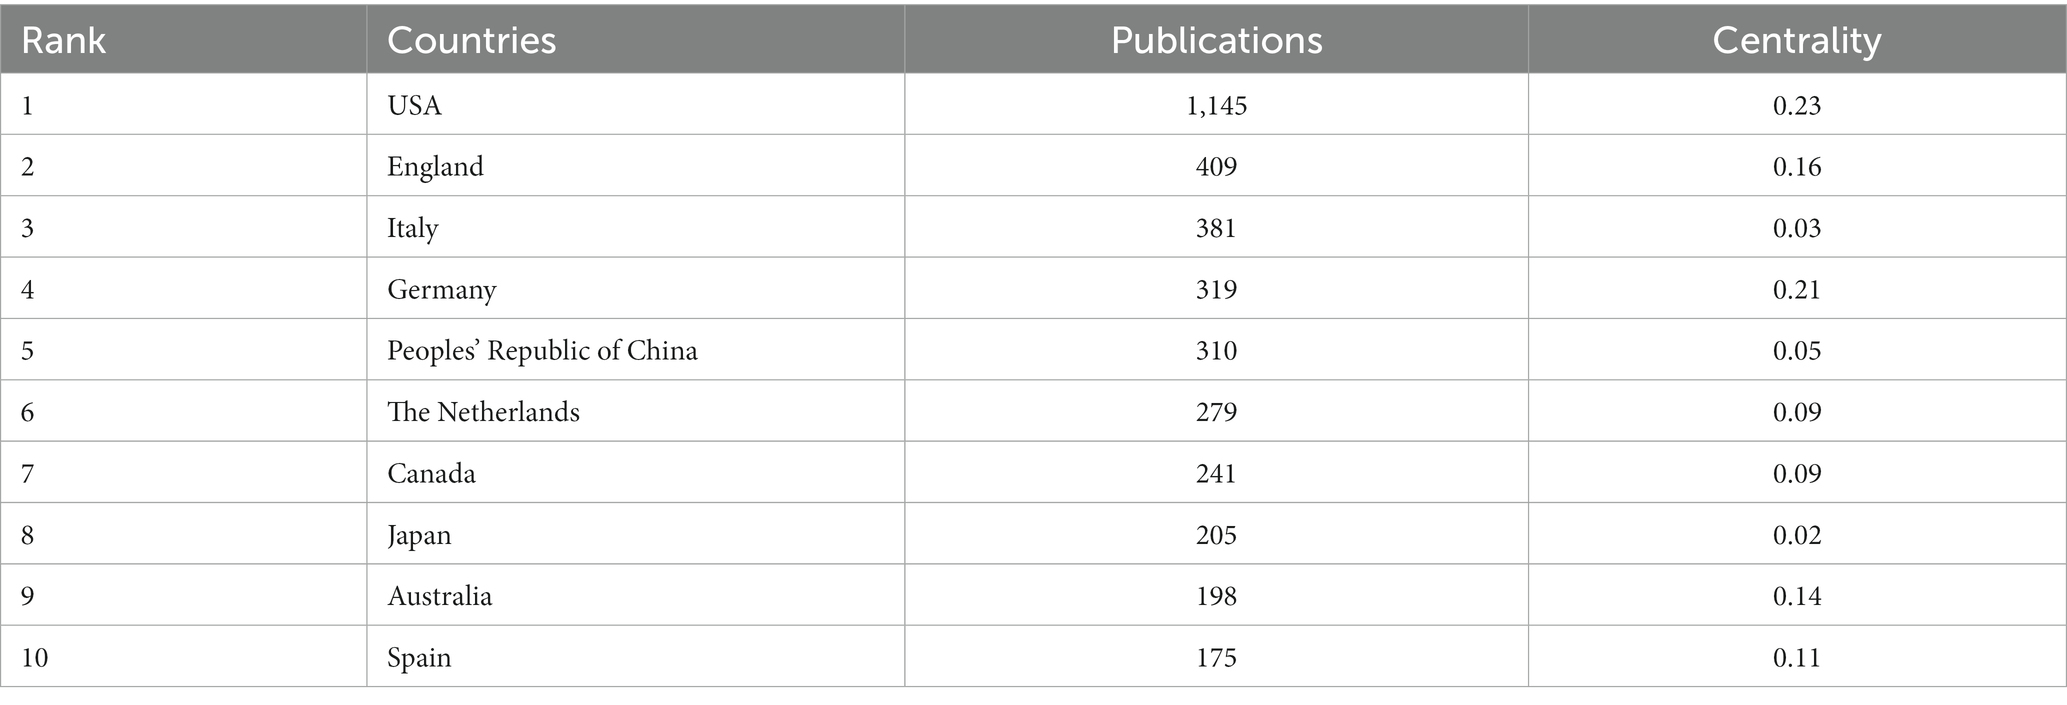
Table 1. The top 10 countries in terms of publications.
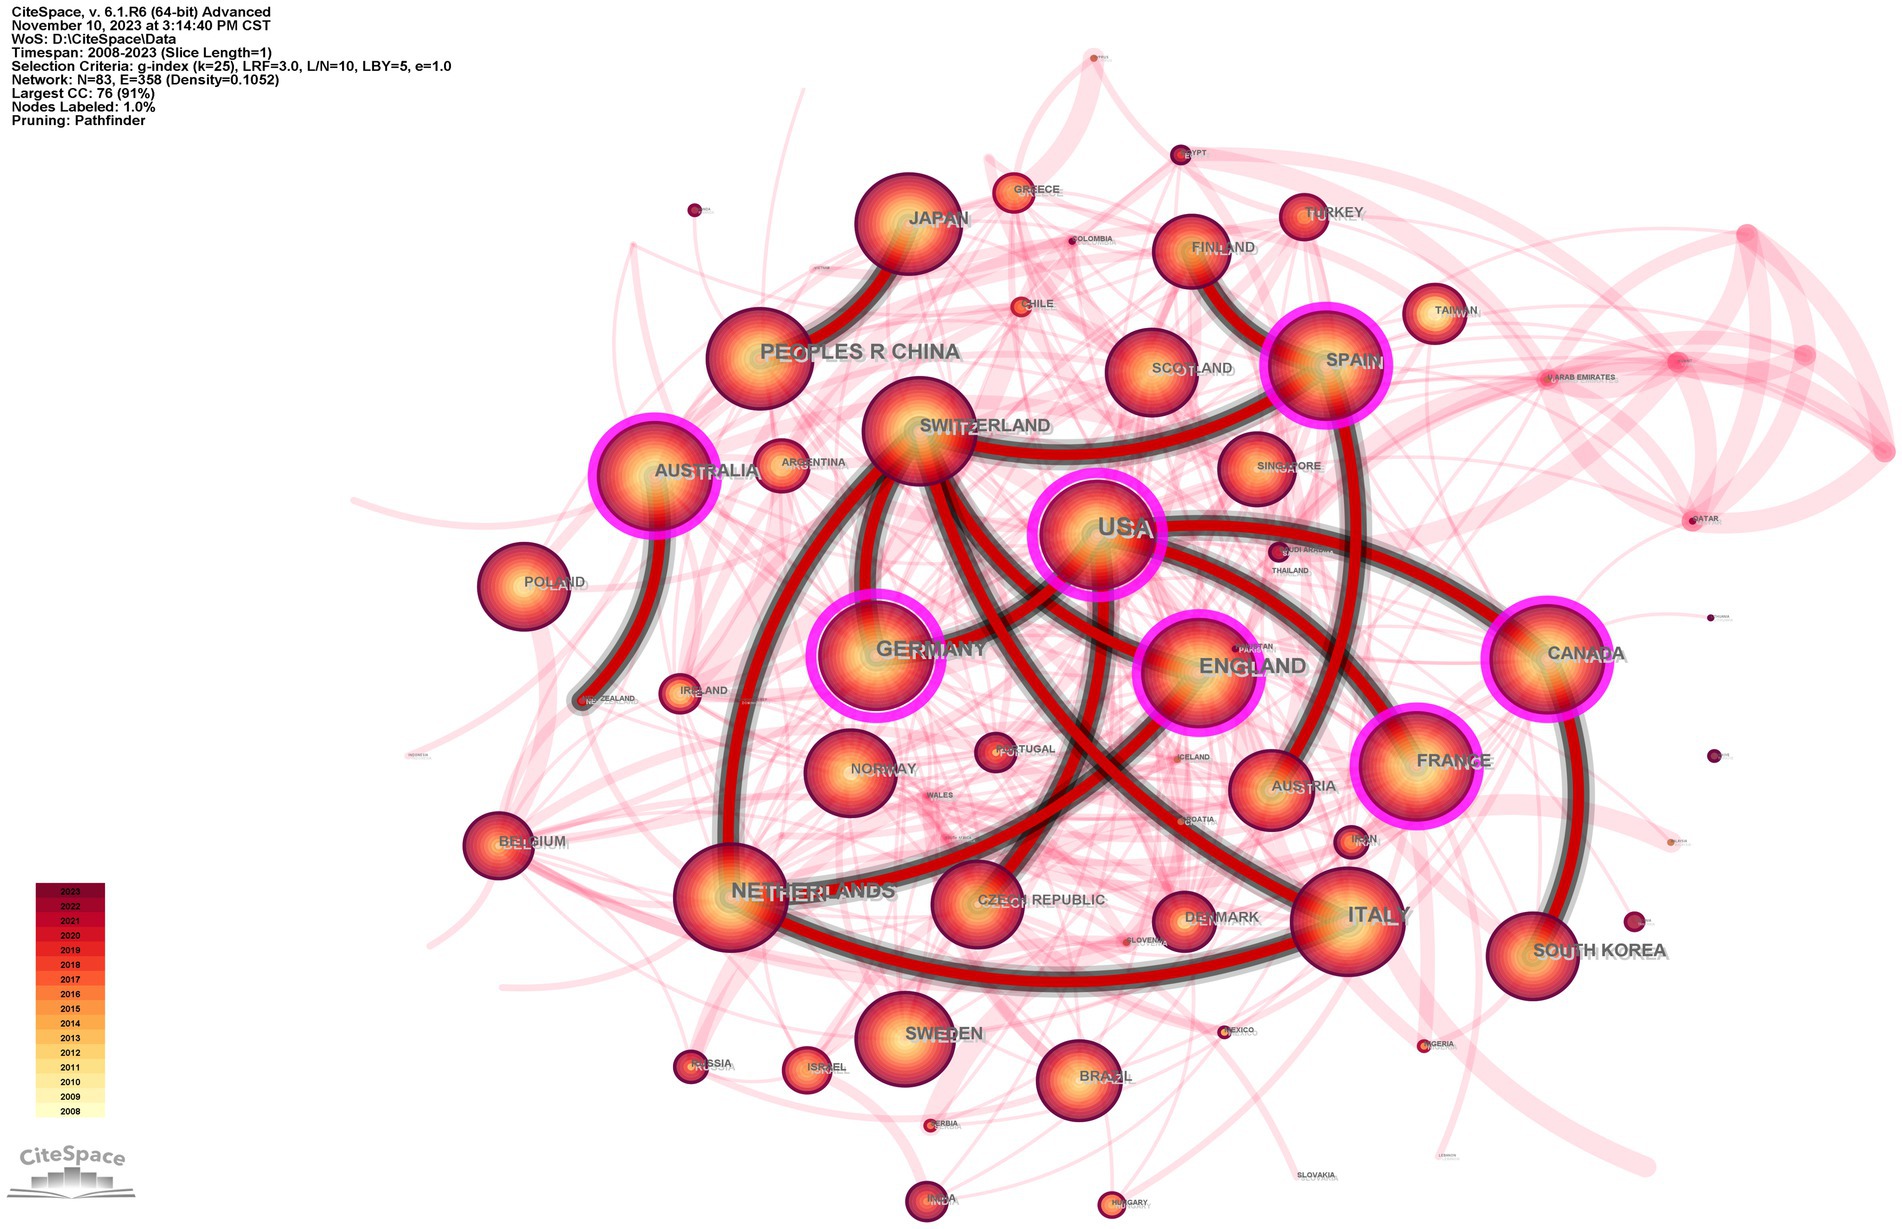
Figure 3. The collaboration network of countries/regions.
A total of 538 institutions published research articles analyzed in this study. Table 2 lists the 10 institutions with the highest number of publications. Among them, University College London was the top contributor (174, 5.2%), followed by the University of California, San Francisco (132, 4.0%) and University at Buffalo SUNY (90, 2.7%). Five of the top 10 institutions were from the United States. Using publishing institutions as nodes, a co-occurrence graph of publishing institutions was constructed (Figure 4). Only University of California, San Francisco (UCSF) with a centrality (0.13) greater than 0.1 can be considered a core center of interinstitutional cooperation. UCSF is among the most prestigious of the 23 branches of the California State University system. The UCSF Medical Center is part of this organization and has an excellent team of neurologists.
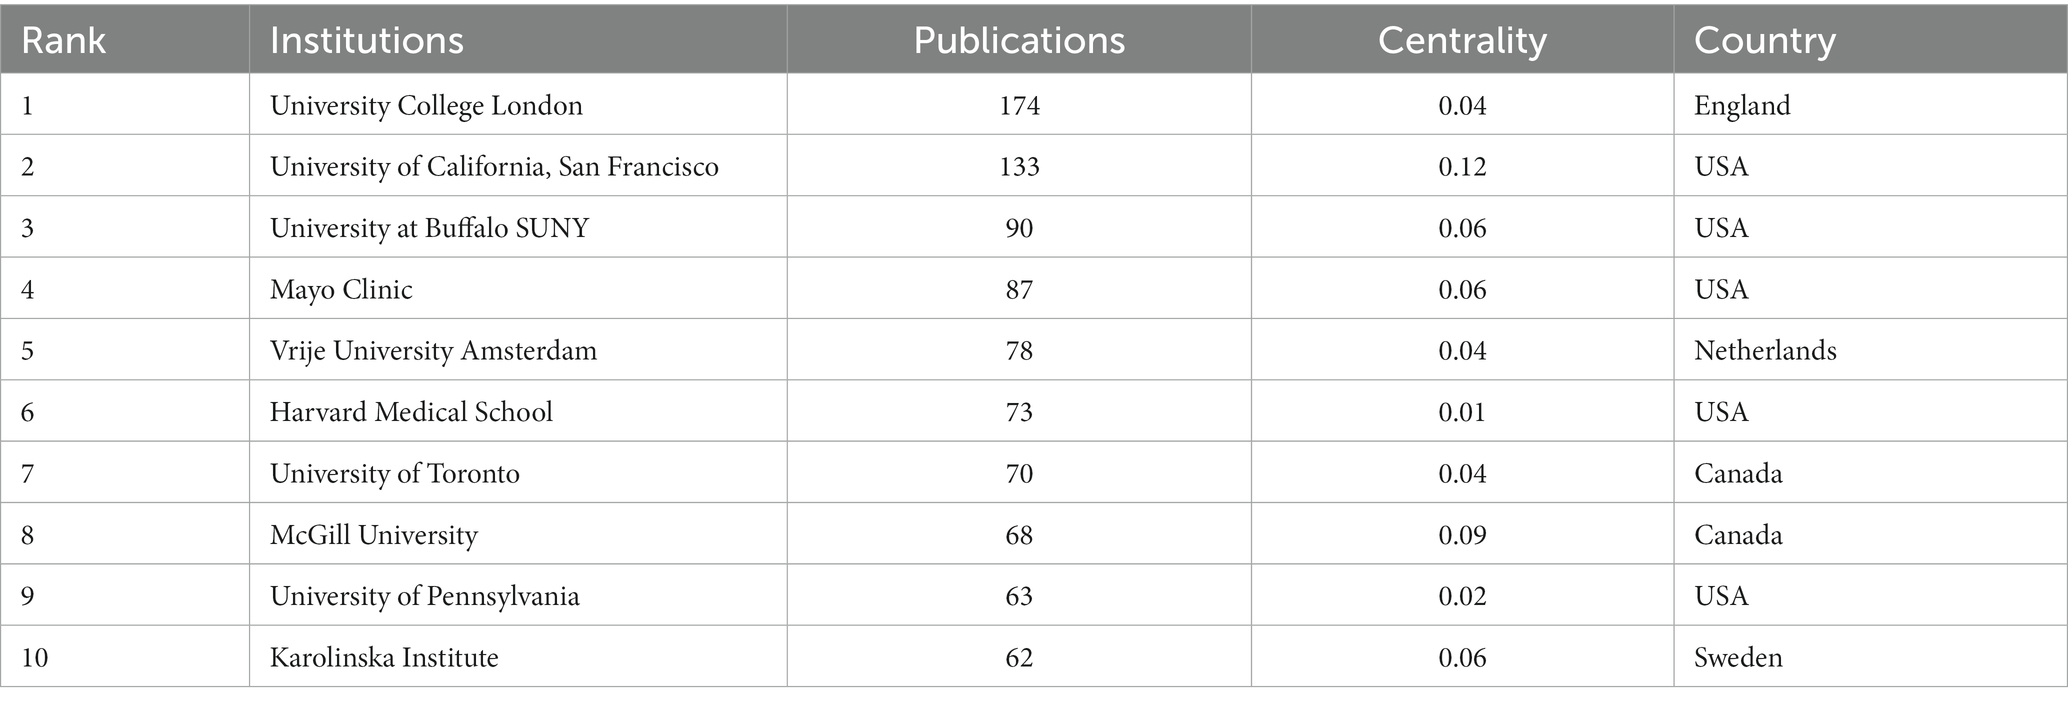
Table 2. The top 10 institutions in terms of publications.
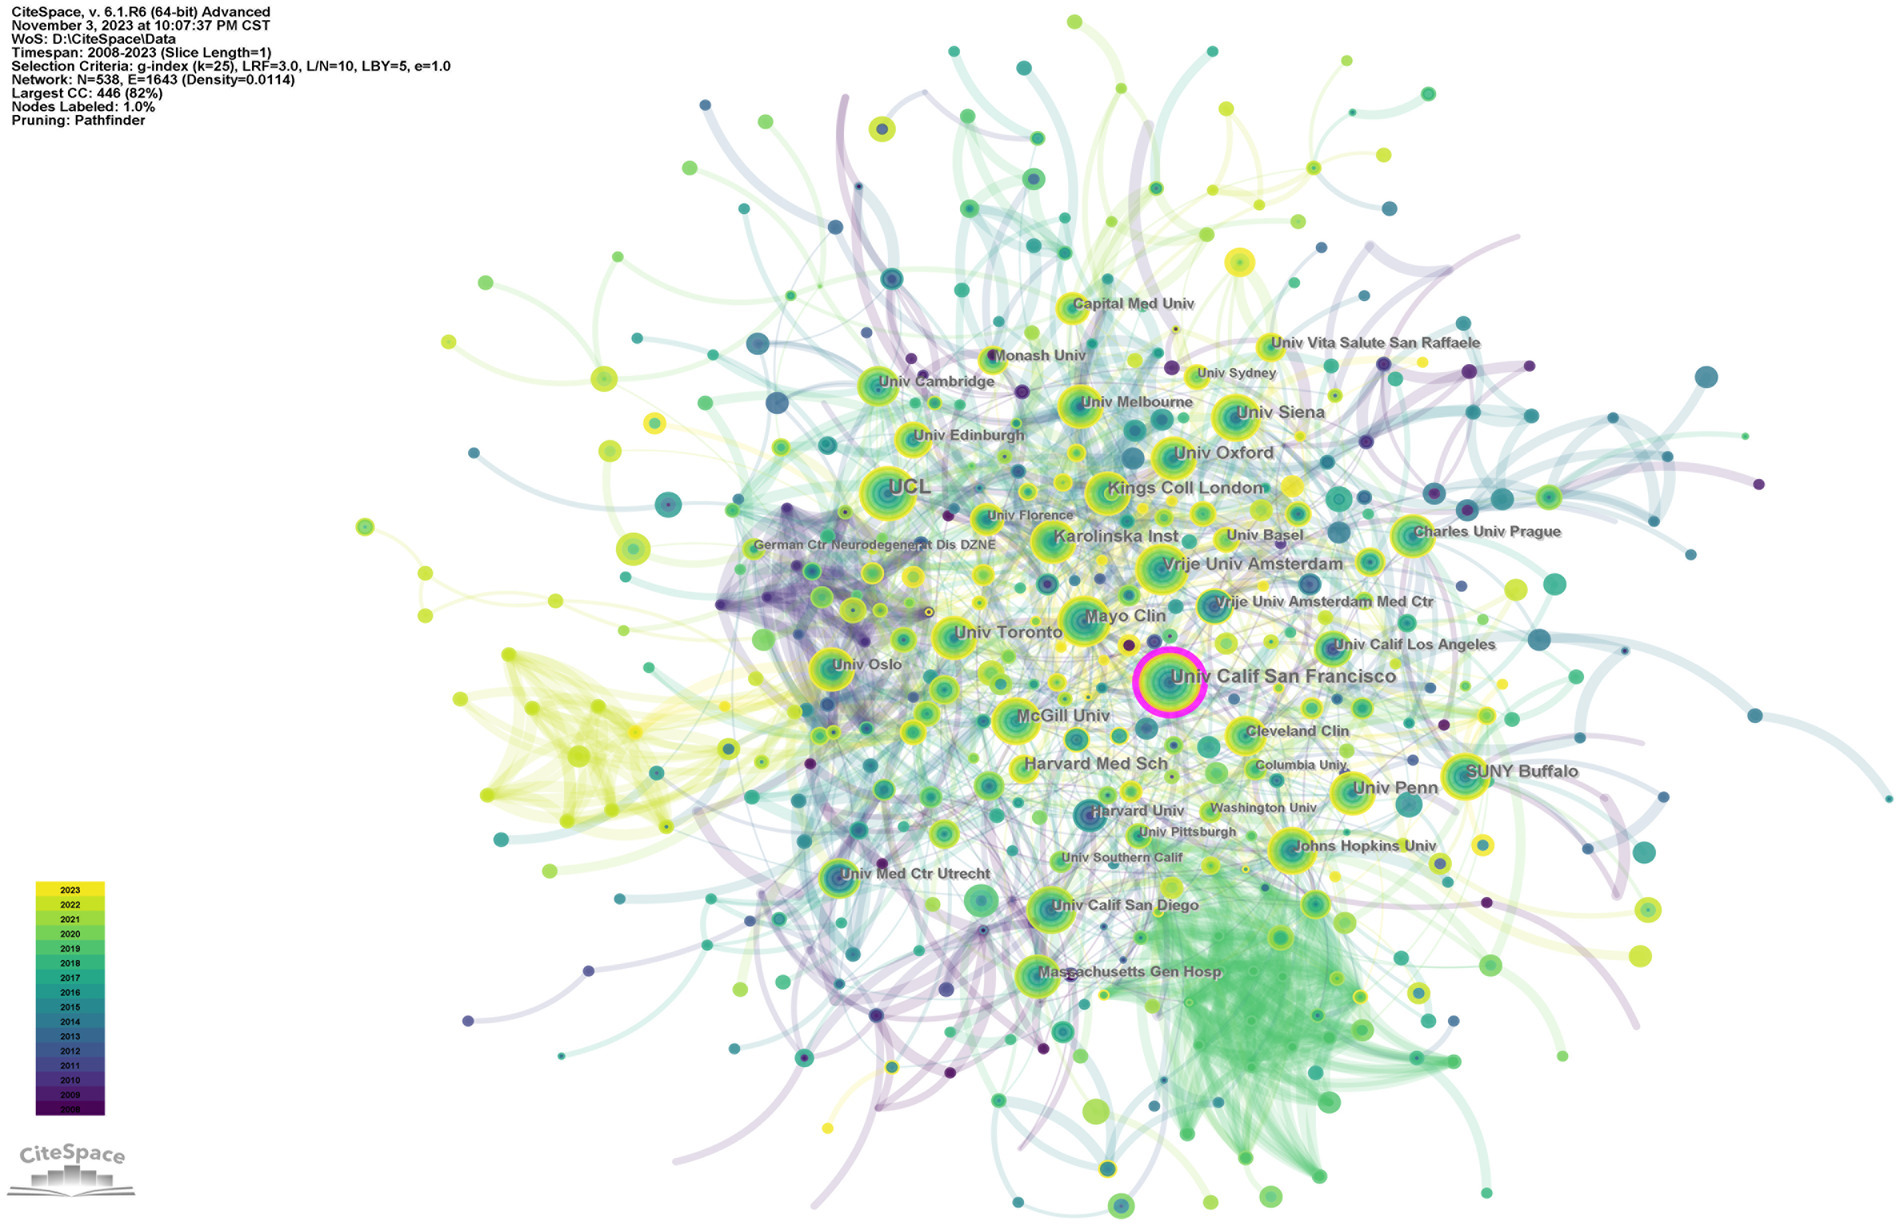
Figure 4. The collaboration network of institutions.
Based on the VOSviewer analysis, there are a total of 589 journals that published relevant articles. Table 3 shows the top 10 journals. MULTIPLE SCLEROSIS JOURNAL has the most publications, followed by NEUROLOGY and then NEUROBIOLOGY OF AGING. Except for PLOS ONE, all the top 10 journals fell under the category of neurology. These journals all have a 2023 impact factor greater than 3, with NEUROLOGY having the highest (9.9), indicating the high quality of the literature on brain atrophy.
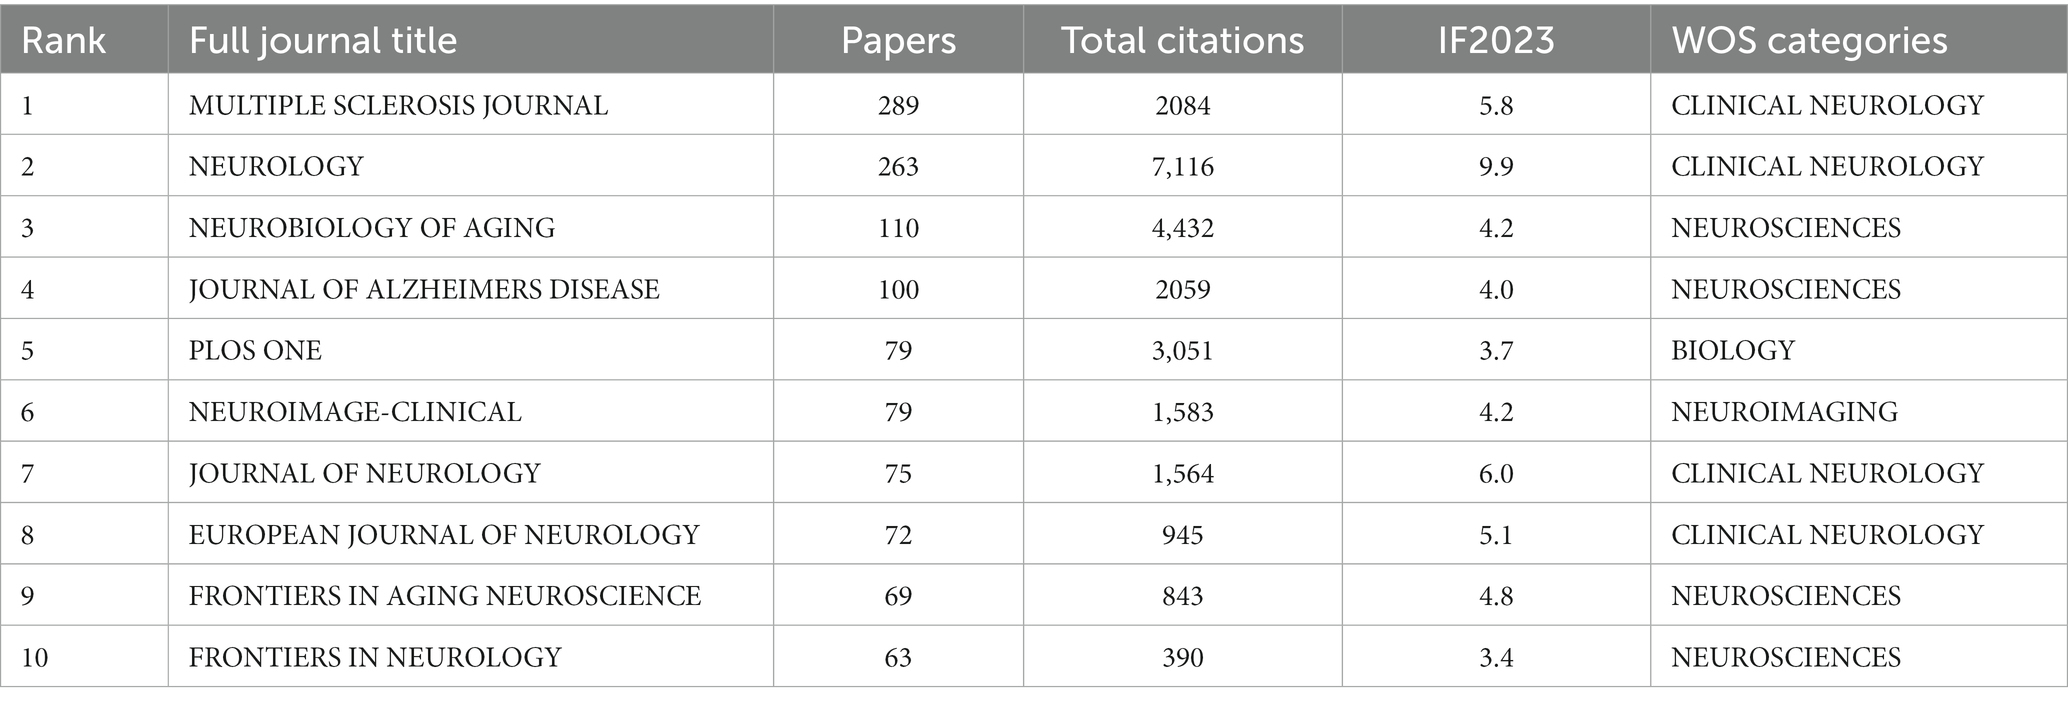
Table 3. The top 10 most productive journals.
In addition, we created a dual-map overlay (Figure 5). The journals that published cited articles on brain atrophy mainly come from the fields of Neurology, Sports, and Ophthalmology, while the journals with the most citations overal mainly come from the fields of Psychology, Education, Social, Economics, and Political.
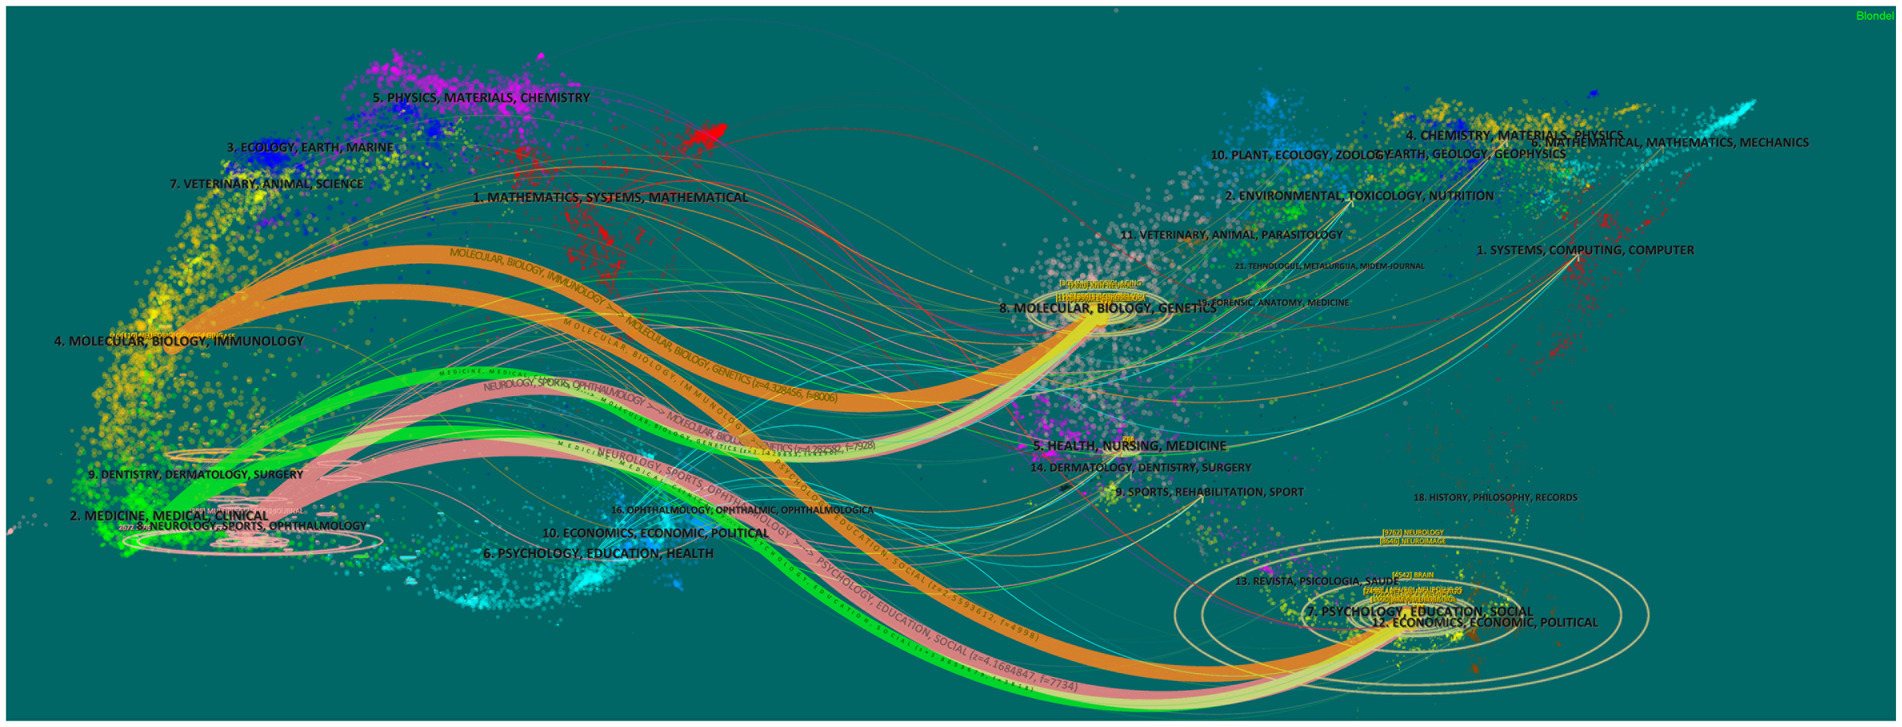
Figure 5. The dual-map overlay of brain atrophy.
A total of 645 authors contributed to the field of brain atrophy in the study period. Table 4 lists the 10 authors with the highest productivity. Barkhof Frederik is the most prolific author, having contributed 105 articles; the next most prolific authors are Zivadinov Robert (101) and Bergsland Niels (89). Using CiteSpace, an author collaboration network diagram was constructed with nodes representing authors (Figure 6). Core authors are the backbone of academic research in various disciplines. According to Price’s law, the minimum number of publications for a core author is n = 0.749 , where Nmax is the number of papers published by the most prolific author (12). Therefore, the minimum number of articles to become the core author of brain atrophy research is 8, yielding a total of 79 core authors who have published a total of 1,568 articles, accounting for 46.5% all articles. Lotka’s Law requires that high-yield authors account for 50% of the total number of publications (13). Therefore, it can be considered that a stable core author group in the field of brain atrophy has almost formed.
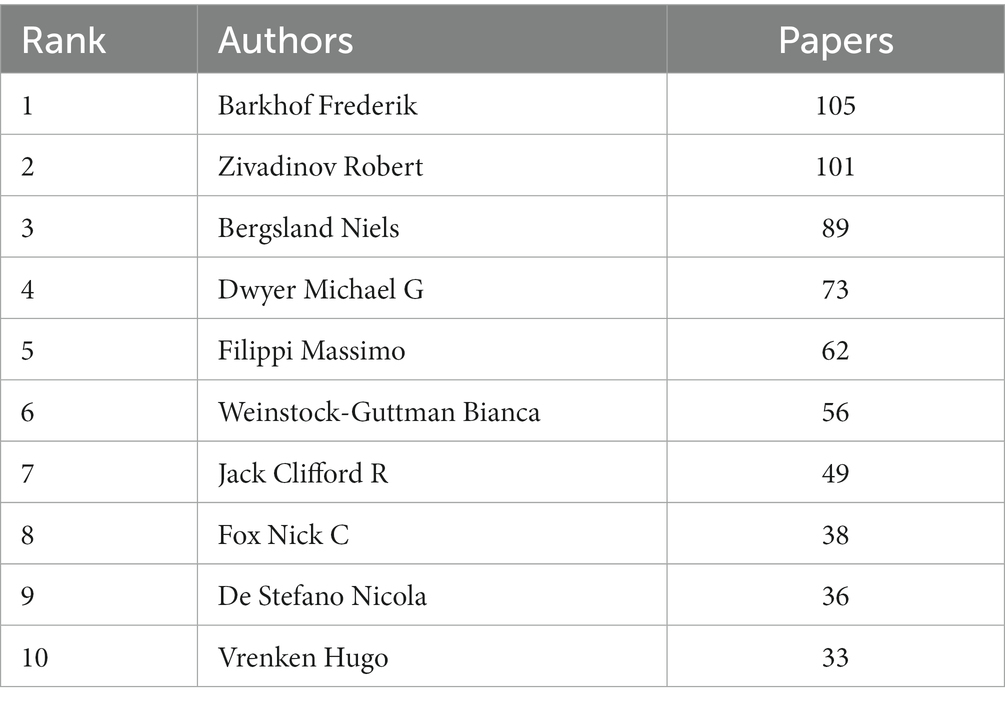
Table 4. The top 10 most productive authors.
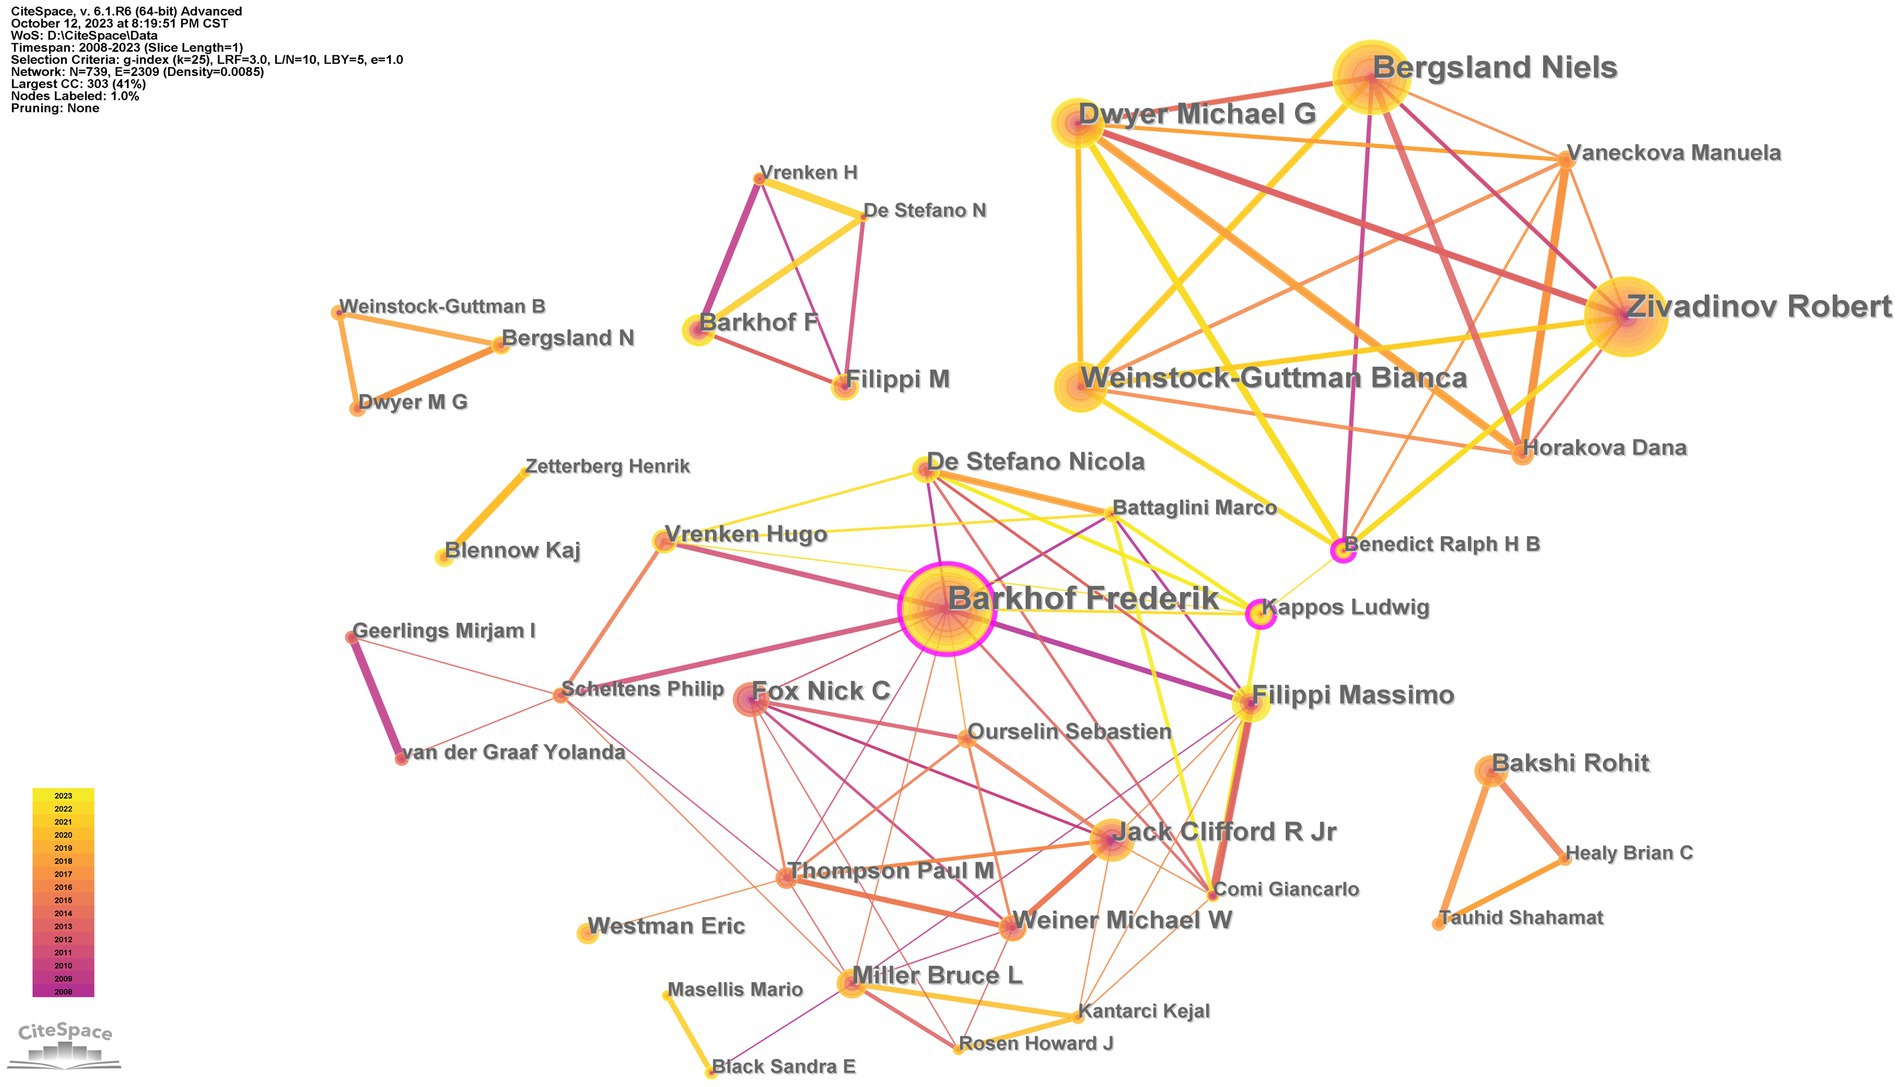
Figure 6. The collaboration network of authors.
Table 5 lists the ten papers with the highest cocitation strengths. According to the results of the CiteSpace analysis, the publication with the highest cocitation strength is “Deep gray matter volume loss drives disability worsening in multiple sclerosis” (14). It was written by Eshaghi Arman and published in ANNALS OF NEUROLOGY in 2018. This is a study from Europe aimed at investigating whether there is a spatiotemporal pattern of gray matter (GM) atrophy that is associated with faster disability accumulation in multiple sclerosis (MS). The results show that deep gray matter volume loss drives disability accumulation in MS and that temporal cortical GM shows accelerated atrophy in secondary progressive MS compared with relapsing–remitting MS.
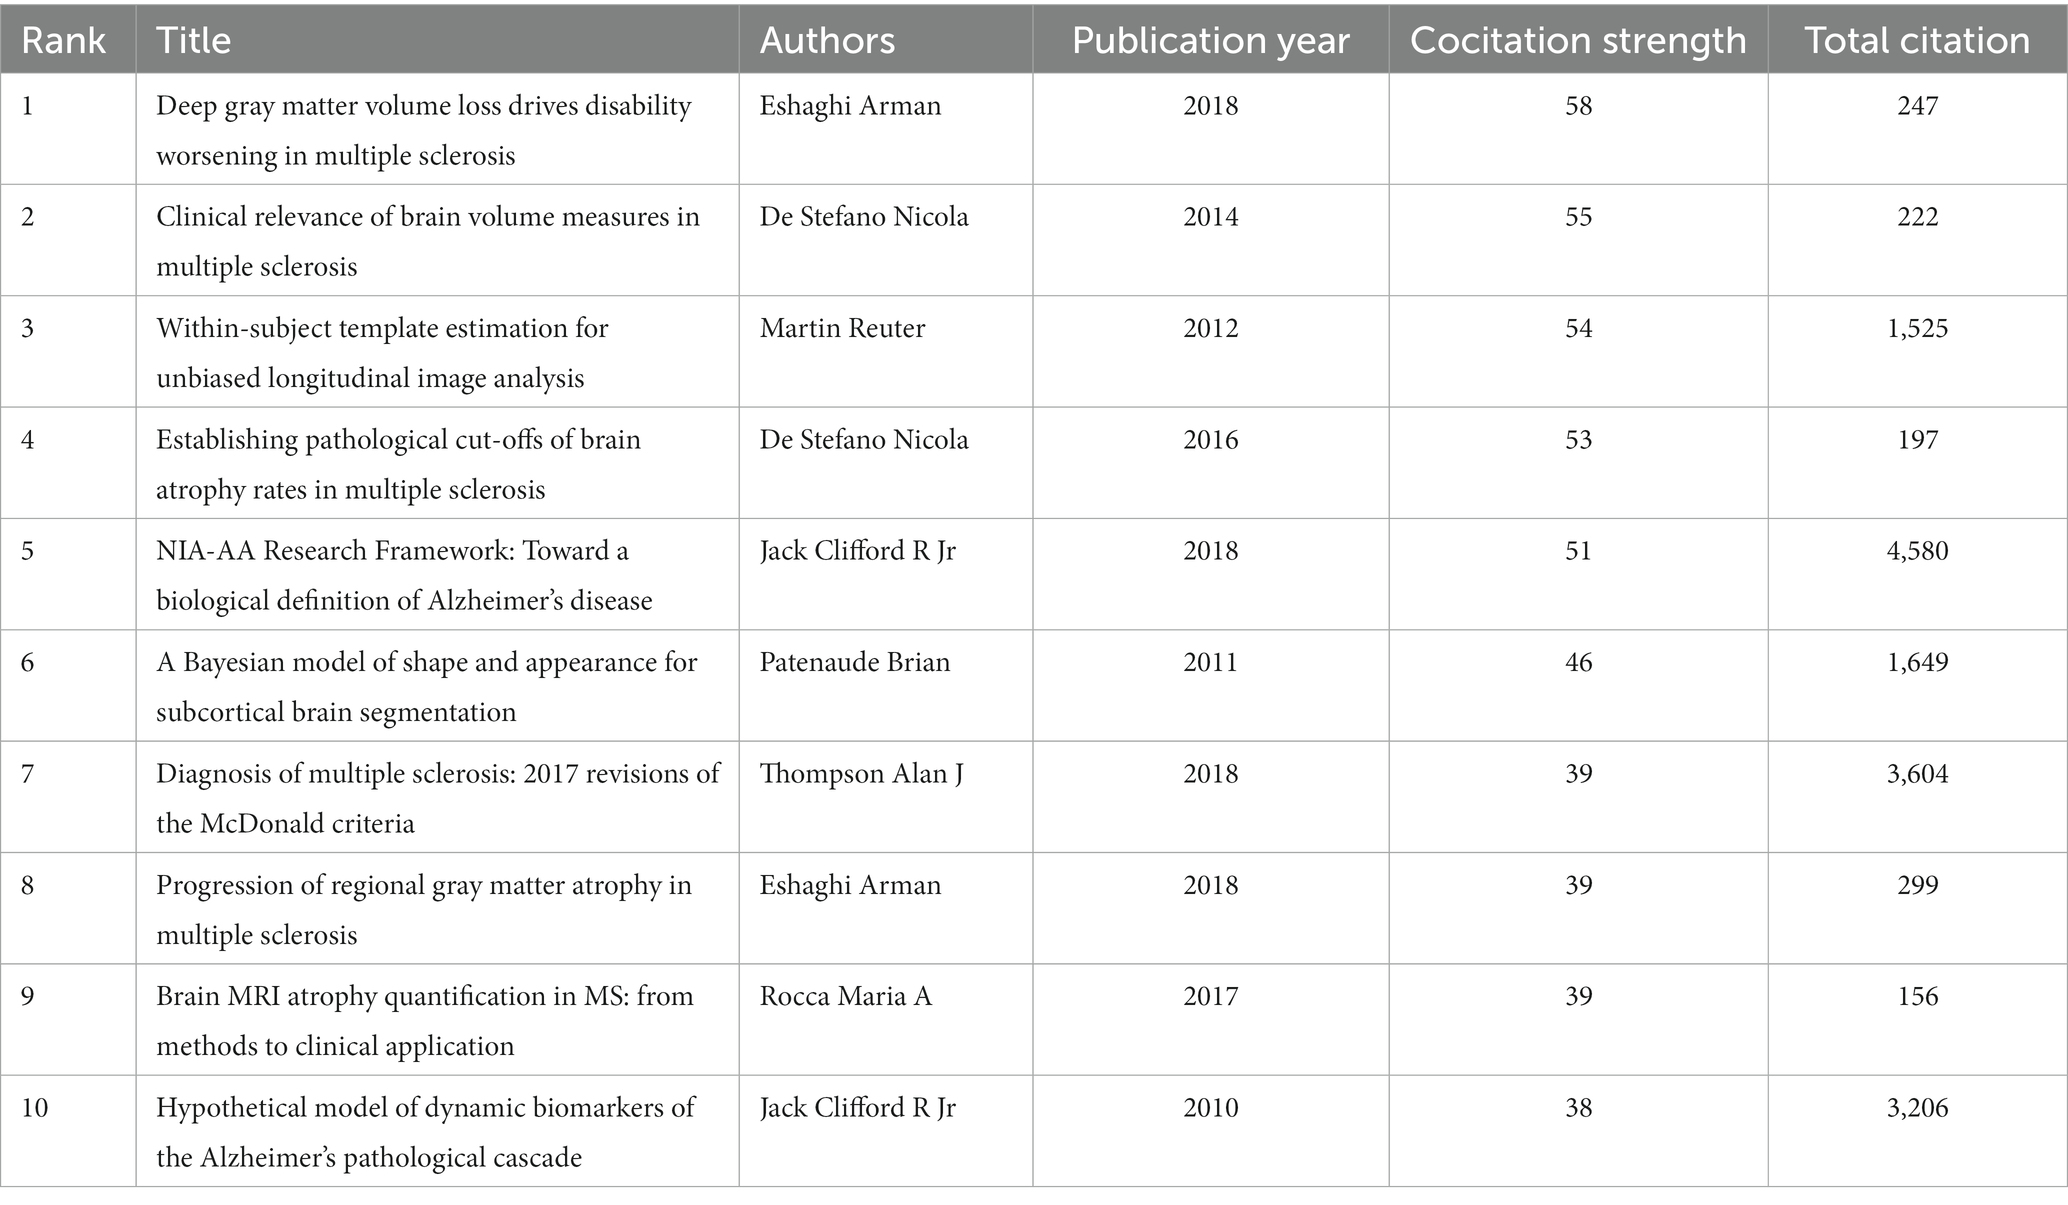
Table 5. The top 10 papers with the highest cocitation strength.
Key words are a reflection of an article’s topics. If a keyword appears repeatedly, Its representative topic is popular research. Table 6 lists the top 10 most frequently occurring keywords in the included. The most common was “brain atrophy” (900), followed by “Alzheimer’s disease” (740) and “MRI” (506). In addition, using CiteSpace, a keyword co-occurrence network graph Was constructed with nodes representing keywords, as shown in Figure 7.
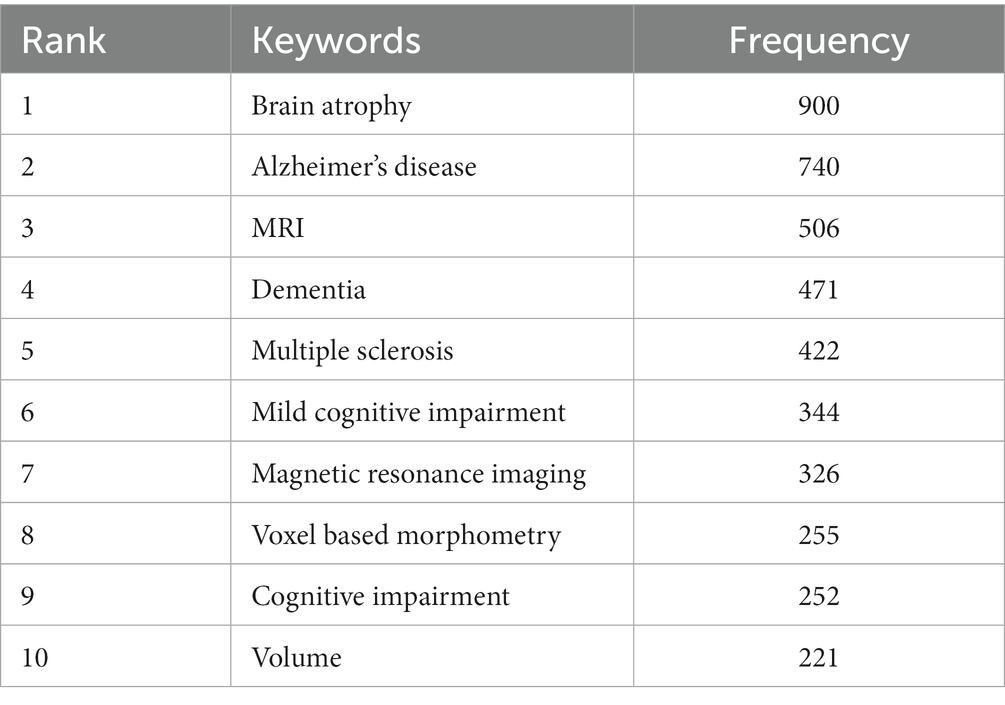
Table 6. The top 10 keywords with the highest frequency.
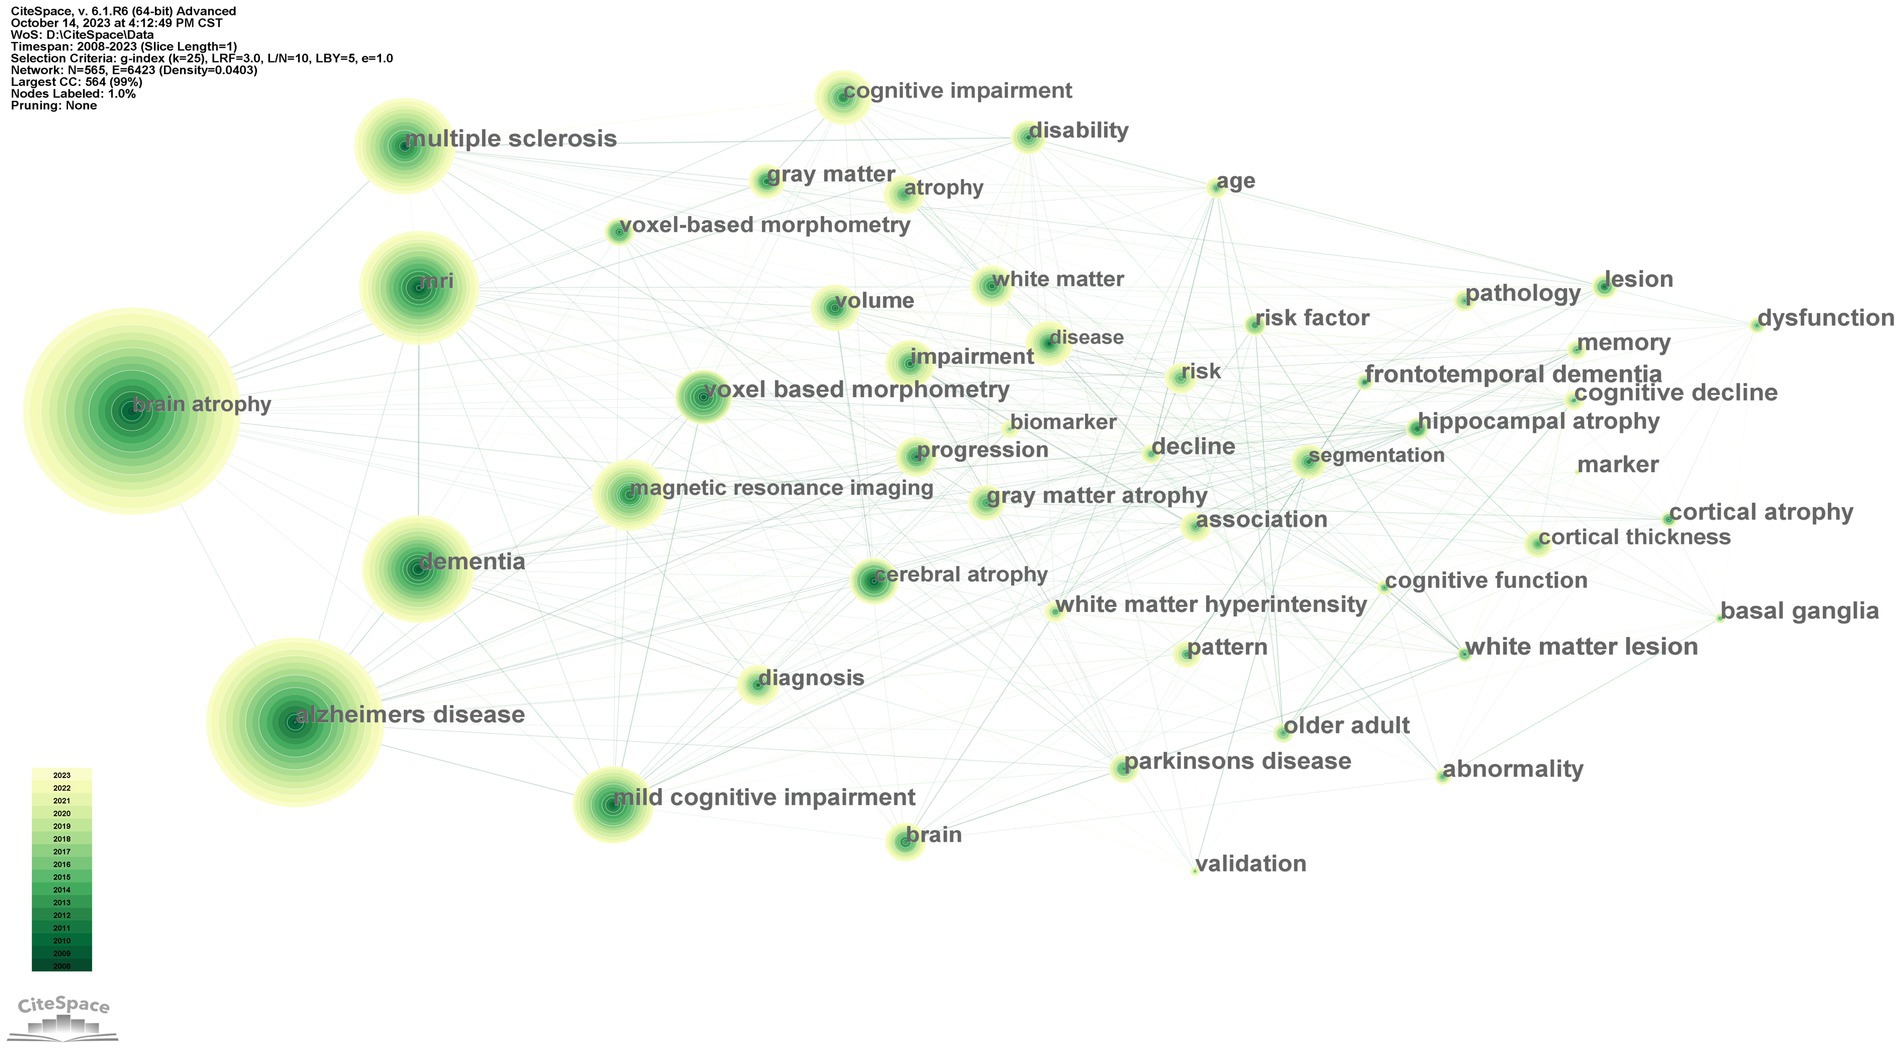
Figure 7. Map of keywords.
We use CiteSpace to generate a timeline view of keyword clustering (Figure 8). That the specific clusters include “Alzheimer’s disease,” “multiple sclerosis,” “disability,” “voxel-based morphometry,” “frontotemporal dementia,” and “Wilsons disease” with sizes of 116, 115, 111, 97, 81, and 44, respectively. These labels reflect the main classifications in the field of brain atrophy research.
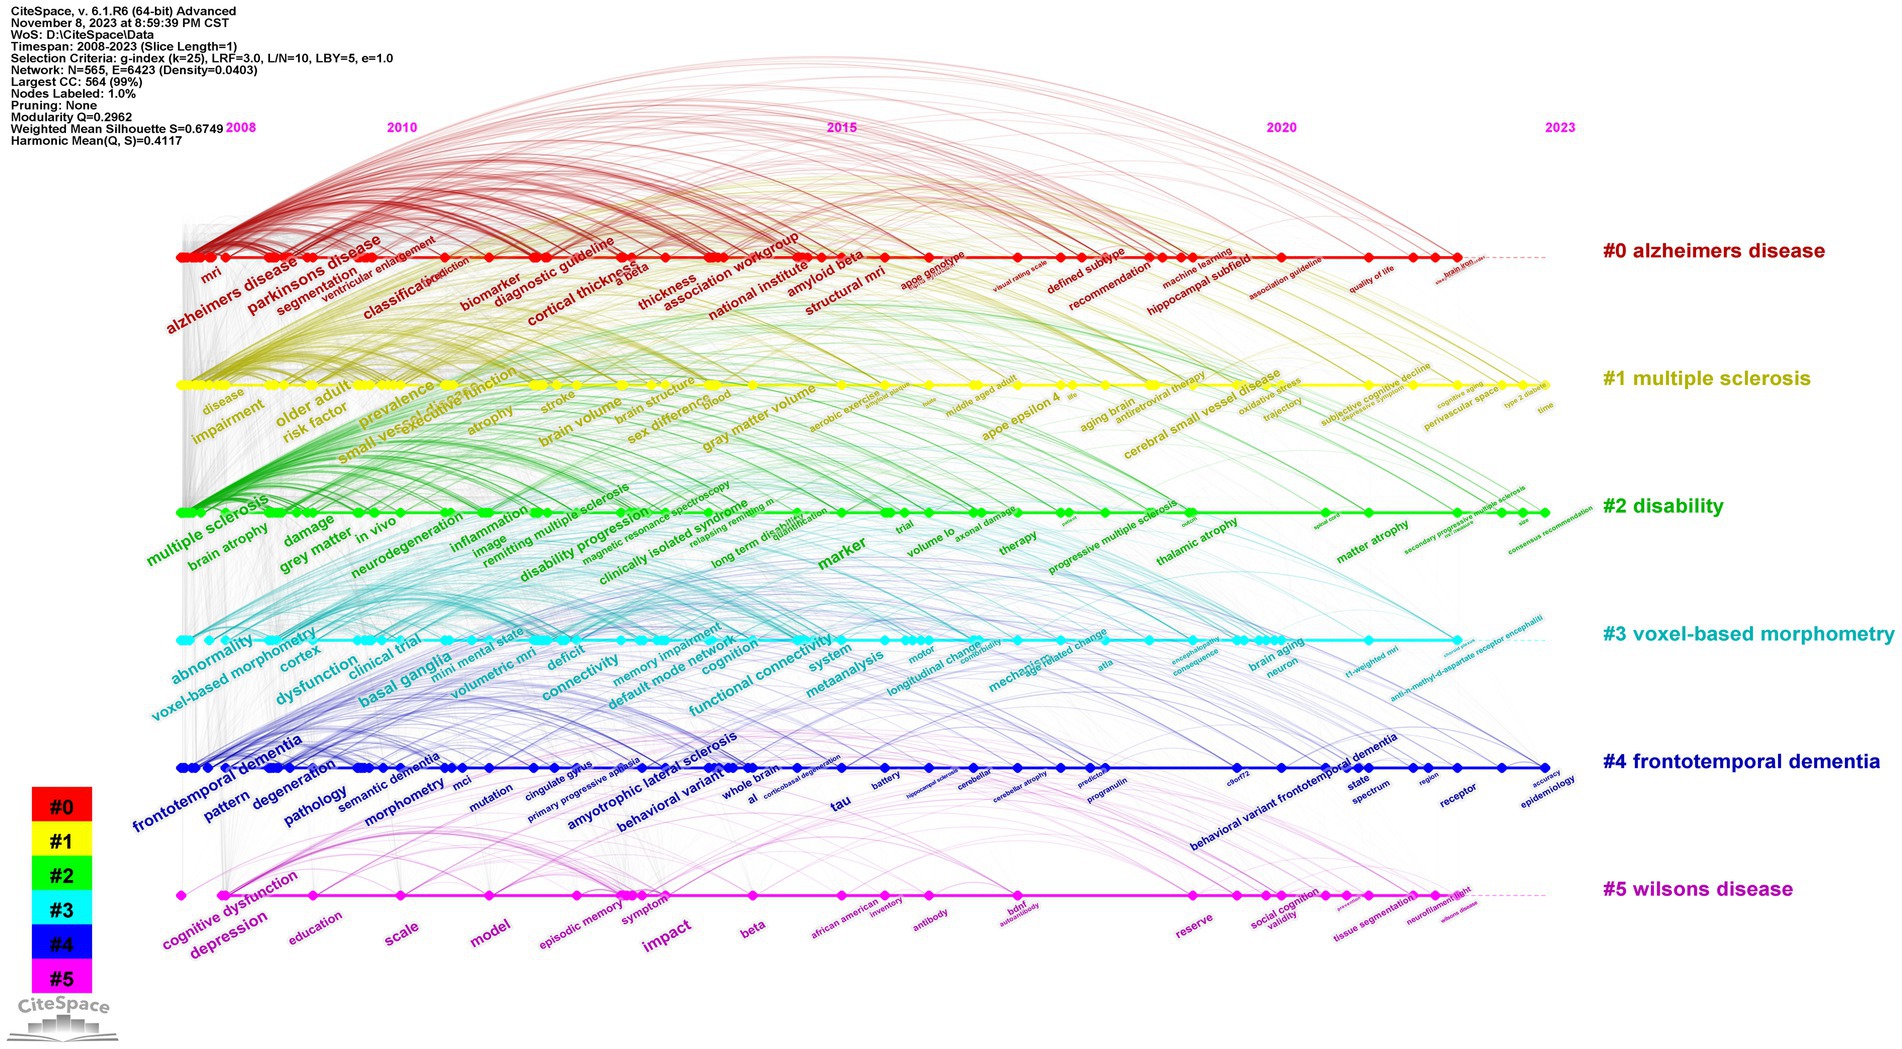
Figure 8. Timeline view of keyword clustering analysis.
Figure 9 shows the top 25 keywords with the strongest citation bursts. “cerebral small vessel disease,” “neurodegeneration,” and “cortex/gray matter volume” may become hot research topics in the coming years.
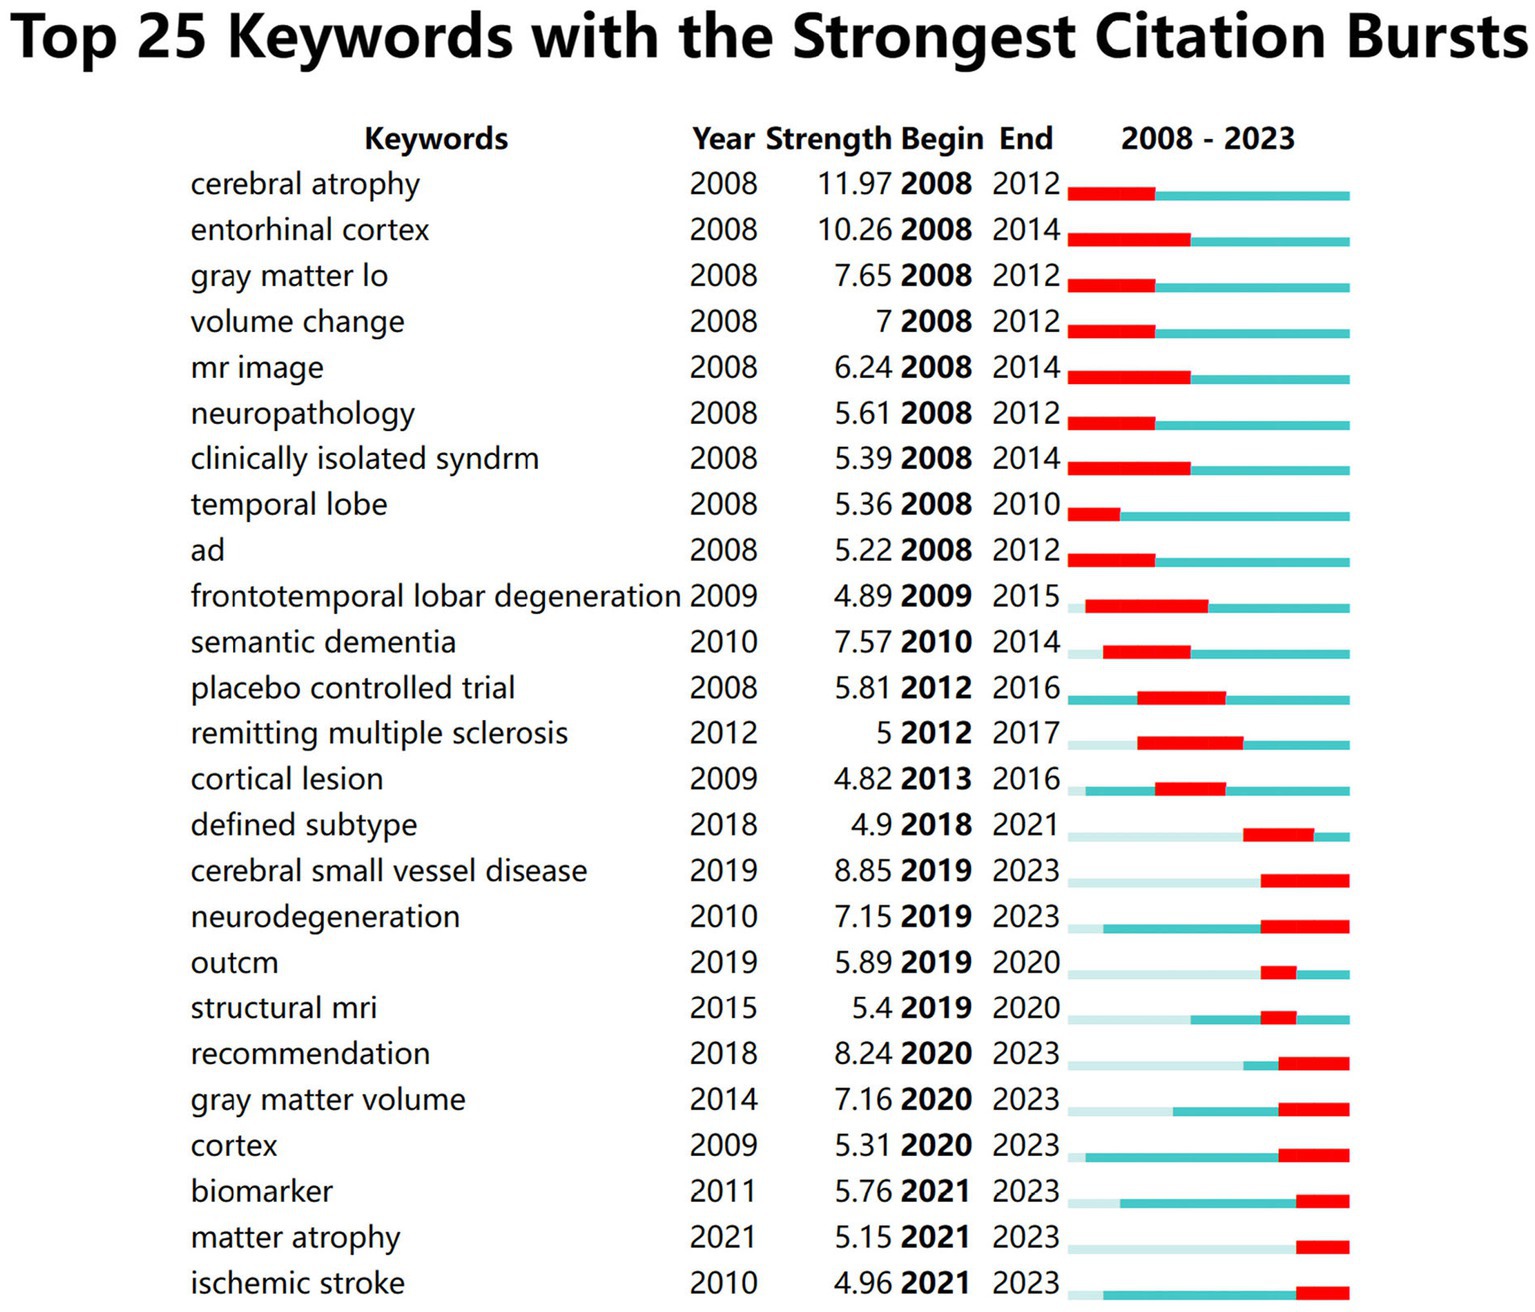
Figure 9. The top 25 keywords with the strongest citation bursts.
A total of 3,371 publications were included in the analysis. From 2008 to 2023, the number of publications increased annually. This indicates that research on brain atrophy is increasingly being valued. From an international perspective, the United States has the highest research output (1,145, 34.0%) and the highest centrality (0.23). Institutional analysis showed that University College London had the highest number of publications (174, 5.2%). The University of California, San Francisco (UCSF) had the highest centrality (0.12), indicating that it is the core of international cooperation.
In terms of authors, Barkhof Frederik was the most prolific author (105), followed by Zivadinov Robert (101); these individuals can be considered leaders in this field. A search from Web of Science showed that Barkhof Frederik (1,715 total documents, 146 of H-index) works at the Amsterdam UMC and has made significant achievements in treating Alzheimer’s disease. He has received the prestigious recognition of being a highly cited researcher in the field of neuroscience and behavior for eight consecutive years (2016–2023). In addition, we found that Zivadinov Robert (742 total documents, 68 of H-index) from Buffalo SUNY has stopped publishing articles since 2020, which is a regrettable fact. Classified according to Price’s Law, 79 core authors published 1,568 articles. This accounts for 46.5% of the total number of publications. Therefore, a stable group of core authors in the field of brain atrophy will imminently form.
All the included papers were published by one of 589 journals. Most of the top 10 journals are focused in the field of neurology and are high quality. MULTIPLE SCLEROSIS JOURNAL has the most publications. It comes from the UK and focuses on fields of multiple sclerosis, neuromyelitis optica and other central nervous system autoimmune diseases. A graph was created to show the annual publication count of this journal from 2014 to 2022 (Figure 10). We found that the number of publications decreased rapidly in the past 2 years, which may affect its leading position in the field of brain atrophy in the future. From the dual-map overlay, the journals with the most cited publications on brain atrophy mainly come from the fields of Neurology, Sports, and Ophthalmology, while the journals with the most cited publications in general mainly come from the fields of Psychology, Education, Social, Economics, and Political.
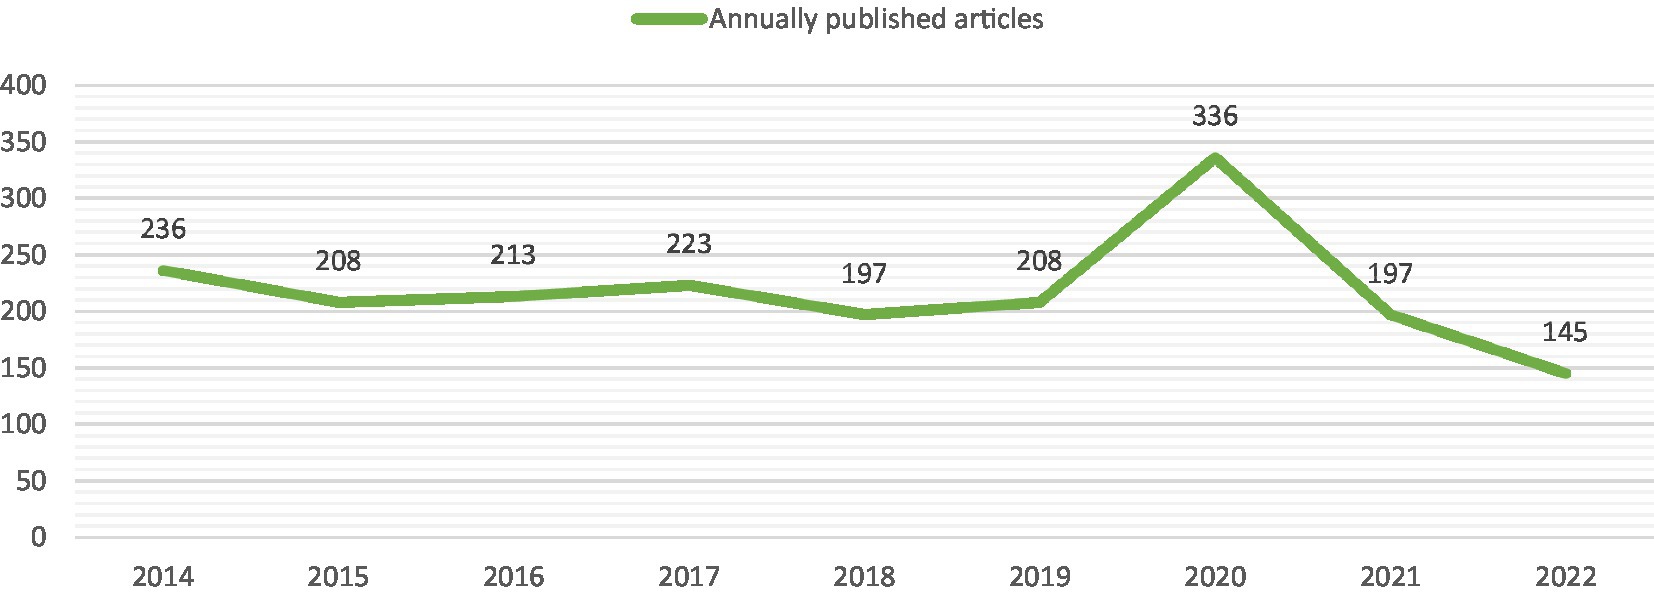
Figure 10. The number of annually published articles of MULTIPLE SCLEROSIS JOURNAL.
To evaluate the current research hotspots and frontiers, we used CiteSpace for keyword analysis. The results showed that from 2008 to 2023, the most frequently occurring keyword was brain atrophy (900), followed by Alzheimer’s disease (740) and MRI (506). We also found that “Alzheimer’s disease” and “multiple sclerosis” are currently the two most popular keyword clusters.
Alzheimer’s disease (AD) is a major global health challenge. According to incomplete statistics, there are over 25 million dementia patients in the world today, most of whom have AD (15). Research has shown that these patients are mostly concentrated in low-income and middle-income countries, thus representing a heavy economic burden (16). Brain atrophy is a major characteristic manifestation of this disease. In recent years, the evaluation of brain atrophy neuromarkers based on MRI has been proven to be effective for the diagnosis of Alzheimer’s disease (17, 18). Among the various subtypes of brain atrophy, hippocampal atrophy may be the best AD marker (19). Low hippocampal volume has been recognized by the European Medical Agency (EMA) for clinical trials of Alzheimer’s disease in the mild cognitive impairment (MCI) stage (20). The development of new automatic/manual segmentation methods is a current research hotspot aimed at providing faster and more accurate quantitative measurements of hippocampal volume (21). This may pave the way for further application of brain atrophy in the field of AD.
MS is the most common demyelinating disease, with a higher incidence rate in high-income countries (22). Brain atrophy has been recognized as an important feature of late-stage MS. The loss of brain tissue volume begins in the early stages of disease and is associated with the degree of physical and cognitive disability (4, 23). Some studies suggest that brain atrophy is the best predictor of future disability in MS patients (24, 25). With the introduction of new advanced imaging technologies, understanding of MS will increase (26). In addition, reducing the rate of brain atrophy has gradually increased in popularity as a key endpoint in clinical studies (27). Perhaps in the future, brain atrophy will bring new hope for the treatment of MS.
According to the analysis of burst keywords, “cerebral small vessel disease,” “neurodegeneration,” and “cortex/gray matter volume” may become hot research topics in the coming years.
Cerebral small vessel disease (SVD) is the main cause of vascular dementia (28). Compared to normal elderly individuals, patients with hereditary SVD have a higher rate of brain atrophy (29, 30). Long-term chronic ischemia of cerebral blood vessels is the core mechanism underlying brain atrophy (31–33). One study showed that the brain volume of SVD patients decreases over time with highly sensitive measurements (34). This can serve as an alternative indicator for monitoring disease progression and evaluating the effectiveness of treatment interventions. SVD exhibits heterogeneous etiologies. The most common forms are arteriosclerosis and cerebral amyloid angiopathy (35). However, there is currently limited research on the association between different types of SVD and brain atrophy (36). This may be the main future SVD research direction.
The appearance of brain atrophy on MRI is now regarded as a biomarker for neurodegeneration (37). As a crucial pathological link, neurodegeneration occurs in various diseases such as AD. AD is defined pathologically as amyloid plaques and tau neuronal tangles (38). However, the role of β-amyloid protein (Aβ) in sedimentation has been controversial for decades. Some studies suggest that Aβ in AD is related to neurodegeneration and brain atrophy (39, 40). Another study indicated that the Aβ load is not related to the rate of brain atrophy (41). Discussions about this aspect may continue to be important in the future.
Researchers have been paying increasing attention to the measurement of GM volume in recent years. Taking MS as an example, white matter (WM) plaques are recognized as the cause of brain atrophy. However, some studies have pointed out a lack of correlation between these factors (42–44). Damage to the GM may be an important cause of MS (27). Indeed, due to the immaturity of gray matter myelin sheath detection technology, the importance of GM injury in MS pathology has long been overlooked (45). Until recent years, research on the measurement of gray matter volume has gradually increased and may become a new research hotspot.
This study represents a groundbreaking visual analysis of the field of brain atrophy based on bibliometrics, facilitating understanding of the current research status and future hot trends. The joint application of CiteSpace and VOSviewer makes the results more comprehensive and accurate. However, the manual screening of the literature that was performed may have resulted in missing information. Moreover, the absence of some synonyms leads to the omission of some documents in the search process. In addition, due to software limitations, only the WoSCC database could be used. If conditions allow in the future, it is necessary to introduce more databases in later studies.
We have summarized 3,371 articles in the field of brain atrophy published from 2008 to 2023 to determine the current state and future trends of this research topic. The results indicate that the attention in this field is gradually increasing, that extensive international cooperation already exists, and that the quality of articles is generally high. In addition, a stable core author group has almost formed.
The original contributions presented in the study are included in the article/supplementary material, further inquiries can be directed to the corresponding authors.
JW: Data curation, Writing – original draft. TC: Data curation, Writing – review & editing. JX: Writing – review & editing. SZ: Writing – review & editing. YJ: Writing – review & editing. HZ: Conceptualization, Funding acquisition, Writing – review & editing. WZ: Conceptualization, Writing – review & editing.
The author(s) declare financial support was received for the research, authorship, and/or publication of this article. This work was supported by the Startup Fund for Scientific Research of Wenzhou Science and Technology Bureau (No. Y20180212) and Zhejiang Traditional Chinese Medical Technology Project (No. 2024ZL994).
The authors declare that the research was conducted in the absence of any commercial or financial relationships that could be construed as a potential conflict of interest.
All claims expressed in this article are solely those of the authors and do not necessarily represent those of their affiliated organizations, or those of the publisher, the editors and the reviewers. Any product that may be evaluated in this article, or claim that may be made by its manufacturer, is not guaranteed or endorsed by the publisher.
1. Enzinger, C, Fazekas, F, Matthews, PM, Ropele, S, Schmidt, H, Smith, S, et al. Risk factors for progression of brain atrophy in aging: six-year follow-up of normal subjects. Neurology. (2005) 64:1704–11. doi: 10.1212/01.WNL.0000161871.83614.BB
2. O'Brien, T, Firbank, MJ, Ritchie, K, Wells, K, Williams, GB, Ritchie, CW, et al. Association between midlife dementia risk factors and longitudinal brain atrophy: the PREVENT-dementia study. J Neurol Neurosurg Psychiatry. (2020) 91:158–61. doi: 10.1136/jnnp-2019-321652
3. Sluimer, JD, Vrenken, H, Blankenstein, MA, Fox, NC, Scheltens, P, Barkhof, F, et al. Whole-brain atrophy rate in Alzheimer disease: identifying fast progressors. Neurology. (2008) 70:1836–41. doi: 10.1212/01.wnl.0000311446.61861.e3
4. Giorgio, A, Battaglini, M, Smith, SM, and de Stefano, N. Brain atrophy assessment in multiple sclerosis: importance and limitations. Neuroimaging Clin N Am. (2008) 18:675–86. doi: 10.1016/j.nic.2008.06.007
5. Nagano-Saito, A, Washimi, Y, Arahata, Y, Kachi, T, Lerch, JP, Evans, AC, et al. Cerebral atrophy and its relation to cognitive impairment in Parkinson disease. Neurology. (2005) 64:224–9. doi: 10.1212/01.WNL.0000149510.41793.50
6. Ninkov, A, Frank, JR, and Maggio, LA. Bibliometrics: methods for studying academic publishing. Perspect Med Educ. (2022) 11:173–6. doi: 10.1007/s40037-021-00695-4
7. Pan, X, Yan, E, Cui, M, and Hua, W. Examining the usage, citation, and diffusion patterns of bibliometric map** software: a comparative study of three tools. J Informet. (2018) 12:481–93. doi: 10.1016/j.joi.2018.03.005
8. Chen, C, and Song, M. Visualizing a field of research: a methodology of systematic scientometric reviews. PLoS One. (2019) 14:e0223994. doi: 10.1371/journal.pone.0223994
9. Van Eck, N, and Waltman, L. Software survey: VOSviewer, a computer program for bibliometric map**. Scientometrics. (2010) 84:523–38. doi: 10.1007/s11192-009-0146-3
10. Chen, C, and Leydesdorff, L. Patterns of connections and movements in dual-map overlays: a new method of publication portfolio analysis. J Assoc Inf Sci Technol. (2014) 65:334–51. doi: 10.1002/asi.22968
11. Trujillo, CM, and Long, TM. Document co-citation analysis to enhance transdisciplinary research. Sci Adv. (2018) 4:e1701130. doi: 10.1126/sciadv.1701130
12. Price, DJDS. Little science, big science. New York Chichester, West Sussex: Columbia University Press (1963).
13. Lotka, AJ. The frequency distribution of scientific productivity. J Wash Acad Sci. (1926) 16:317–23.
14. Eshaghi, A, Prados, F, Brownlee, WJ, Altmann, DR, Tur, C, Cardoso, MJ, et al. Deep gray matter volume loss drives disability worsening in multiple sclerosis. Ann Neurol. (2018) 83:210–22. doi: 10.1002/ana.25145
15. Qiu, C, Kivipelto, M, and Von Strauss, E. Epidemiology of Alzheimer's disease: occurrence, determinants, and strategies toward intervention. Dialogues Clin Neurosci (2022);11(2):111–128. doi: 10.31887/DCNS.2009.11.2/cqiu
16. Sosa-Ortiz, AL, Acosta-Castillo, I, and Prince, MJ. Epidemiology of dementias and Alzheimer’s disease. Arch Med Res. (2012) 43:600–8. doi: 10.1016/j.arcmed.2012.11.003
17. Bobinski, M, de Leon, MJ, Convit, A, Santi, SD, Wegiel, J, Tarshish, CY, et al. MRI of entorhinal cortex in mild Alzheimer's disease. Lancet. (1999) 353:38–40. doi: 10.1016/S0140-6736(05)74869-8
18. Whitwell, JL, Dickson, DW, Murray, ME, Weigand, SD, Tosakulwong, N, Senjem, ML, et al. Neuroimaging correlates of pathologically defined subtypes of Alzheimer's disease: a case-control study. Lancet Neurol. (2012) 11:868–77. doi: 10.1016/S1474-4422(12)70200-4
19. Jack, CR Jr, Barkhof, F, Bernstein, MA, Cantillon, M, Cole, PE, DeCarli, C, et al. Steps to standardization and validation of hippocampal volumetry as a biomarker in clinical trials and diagnostic criterion for Alzheimer’s disease. Alzheimers Dement. (2011) 7:474–485.e4. doi: 10.1016/j.jalz.2011.04.007
20. European Medicines Agency. Qualification opinion of low hippocampal volume (atrophy) by MRI for use in regulatory clinical trials—in pre-dementia stage of Alzheimer’s disease. (2011).
21. Pini, L, Pievani, M, Bocchetta, M, Altomare, D, Bosco, P, Cavedo, E, et al. Brain atrophy in Alzheimer’s disease and aging. Ageing Res Rev. (2016) 30:25–48. doi: 10.1016/j.arr.2016.01.002
22. Leray, E, Moreau, T, Fromont, A, and Edan, G. Epidemiology of multiple sclerosis. Rev Neurol. (2016) 172:3–13. doi: 10.1016/j.neurol.2015.10.006
23. Shiee, N, Bazin, PL, Zackowski, KM, Farrell, SK, Harrison, DM, Newsome, SD, et al. Revisiting brain atrophy and its relationship to disability in multiple sclerosis. PLoS One. (2012) 7:e37049. doi: 10.1371/journal.pone.0037049
24. Dardiotis, E, Panayiotou, E, Provatas, A, Christodoulou, K, Hadjisavvas, A, Antoniades, A, et al. Gene variants of adhesion molecules act as modifiers of disease severity in MS. Neurol Neuroimmunol Neuroinflamm. (2017) 4:e350. doi: 10.1212/NXI.0000000000000350
25. Dardiotis, E, Nousia, A, Siokas, V, Tsouris, Z, Andravizou, A, Mentis, AFA, et al. Efficacy of computer-based cognitive training in neuropsychological performance of patients with multiple sclerosis: a systematic review and meta-analysis. Mult Scler Relat Disord. (2018) 20:58–66. doi: 10.1016/j.msard.2017.12.017
26. Bagnato, F, Gauthier, SA, Laule, C, Moore, GRW, Bove, R, Cai, Z, et al. Imaging mechanisms of disease progression in multiple sclerosis: beyond brain atrophy. J Neuroimaging. (2020) 30:251–66. doi: 10.1111/jon.12700
27. Andravizou, A, Dardiotis, E, Artemiadis, A, Sokratous, M, Siokas, V, Tsouris, Z, et al. Brain atrophy in multiple sclerosis: mechanisms, clinical relevance and treatment options. Auto Immun Highlights. (2019) 10:1–25. doi: 10.1186/s13317-019-0117-5
28. Román, GC, Erkinjuntti, T, Wallin, A, Pantoni, L, and Chui, HC. Subcortical ischaemic vascular dementia. Lancet Neurol. (2002) 1:426–36. doi: 10.1016/S1474-4422(02)00190-4
29. Peters, N, Holtmannspötter, M, Opherk, C, Gschwendtner, A, Herzog, J, Sämann, P, et al. Brain volume changes in CADASIL: a serial MRI study in pure subcortical ischemic vascular disease. Neurology. (2006) 66:1517–22. doi: 10.1212/01.wnl.0000216271.96364.50
30. Schmidt, R, Ropele, S, Enzinger, C, Petrovic, K, Smith, S, Schmidt, H, et al. White matter lesion progression, brain atrophy, and cognitive decline: the Austrian stroke prevention study. Ann Neurol. (2005) 58:610–6. doi: 10.1002/ana.20630
31. Kim, HW, Hong, J, and Jeon, JC. Cerebral small vessel disease and Alzheimer's disease: a review. Front Neurol. (2020) 11:927. doi: 10.3389/fneur.2020.00927
32. Hilal, S, Tan, CS, Adams, HHH, Habes, M, Mok, V, Venketasubramanian, N, et al. Enlarged perivascular spaces and cognition: a meta-analysis of 5 population-based studies. Neurology. (2018) 91:e832–42. doi: 10.1212/WNL.0000000000006079
33. Arba, F, Mair, G, Carpenter, T, Sakka, E, Sandercock, PAG, Lindley, RI, et al. Cerebral white matter hypoperfusion increases with small-vessel disease burden. Data from the third international stroke trial. J Stroke Cerebrovasc Dis. (2017) 26:1506–13. doi: 10.1016/j.jstrokecerebrovasdis.2017.03.002
34. Nitkunan, A, Lanfranconi, S, Charlton, RA, Barrick, TR, and Markus, HS. Brain atrophy and cerebral small vessel disease: a prospective follow-up study. Stroke. (2011) 42:133–8. doi: 10.1161/STROKEAHA.110.594267
35. Pantoni, L. Cerebral small vessel disease: from pathogenesis and clinical characteristics to therapeutic challenges. Lancet Neurol. (2010) 9:689–701. doi: 10.1016/S1474-4422(10)70104-6
36. Heinen, R, Groeneveld, ON, Barkhof, F, de Bresser, J, Exalto, LG, Kuijf, HJ, et al. Small vessel disease lesion type and brain atrophy: the role of co-occurring amyloid. Alzheimers Dement. (2020) 12:e12060. doi: 10.1002/dad2.12060
37. Jack, CR. Brain atrophy on magnetic resonance imaging as a biomarker of neurodegeneration. JAMA Neurol. (2016) 73:1179–82. doi: 10.1001/jamaneurol.2016.2843
38. Schwarz, AJ. The use, standardization, and interpretation of brain imaging data in clinical trials of neurodegenerative disorders. Neurotherapeutics. (2021) 18:686–708. doi: 10.1007/s13311-021-01027-4
39. Lue, LF, Brachova, L, Civin, WH, et al. Inflammation, Aβ deposition, and neurofibrillary tangle formation as correlates of Alzheimer's disease neurodegeneration. J Neuropathol Exp Neurol. (1996) 55:1083–8. doi: 10.1097/00005072-199655100-00008
40. Frisoni, GB, Lorenzi, M, Caroli, A, Kemppainen, N, Någren, K, and Rinne, JO. In vivo map** of amyloid toxicity in Alzheimer disease. Neurology. (2009) 72:1504–11. doi: 10.1212/WNL.0b013e3181a2e896
41. Josephs, KA, Whitwell, JL, Ahmed, Z, Shiung, MM, Weigand, SD, Knopman, DS, et al. β-Amyloid burden is not associated with rates of brain atrophy. Ann Neurol. (2008) 63:204–12. doi: 10.1002/ana.21223
42. Anderson, VM, Fox, NC, and Miller, DH. Magnetic resonance imaging measures of brain atrophy in multiple sclerosis. J Magn Reson Imaging. (2006) 23:605–18. doi: 10.1002/jmri.20550
43. Meier, DS, Weiner, HL, Khoury, SJ, and Guttmann, CR. Magnetic resonance imaging surrogates of multiple sclerosis pathology and their relationship to central nervous system atrophy. J Neuroimaging. (2004) 14:46S–53S. doi: 10.1177/1051228404266268
44. Pelletier, D, Nelson, SJ, Oh, J, Antel, JP, Kita, M, Zamvil, SS, et al. MRI lesion volume heterogeneity in primary progressive MS in relation with axonal damage and brain atrophy. J Neurol Neurosurg Psychiatry. (2003) 74:950–2. doi: 10.1136/jnnp.74.7.950
Keywords: CiteSpace, VOSviewer, bibliometric, visual perception, brain atrophy
Citation: Wang J, Chen T, Xie J, Zhao S, Jiang Y, Zhang H and Zhu W (2024) A bibliometric analysis of international publication trends in brain atrophy research (2008–2023). Front. Neurol. 15:1348778. doi: 10.3389/fneur.2024.1348778
Edited by:
Philippe Léon Louis Poindron, NeuroSys, FranceReviewed by:
Jose Bernal, Deutsches Zentrum für Neurodegenerative Erkrankungen, GermanyCopyright © 2024 Wang, Chen, Xie, Zhao, Jiang, Zhang and Zhu. This is an open-access article distributed under the terms of the Creative Commons Attribution License (CC BY). The use, distribution or reproduction in other forums is permitted, provided the original author(s) and the copyright owner(s) are credited and that the original publication in this journal is cited, in accordance with accepted academic practice. No use, distribution or reproduction is permitted which does not comply with these terms.
*Correspondence: Huihe Zhang, MzcyNzQ2NjcxQHFxLmNvbQ==; Wenzong Zhu, Z2RraW5nend6QDEyNi5jb20=
Disclaimer: All claims expressed in this article are solely those of the authors and do not necessarily represent those of their affiliated organizations, or those of the publisher, the editors and the reviewers. Any product that may be evaluated in this article or claim that may be made by its manufacturer is not guaranteed or endorsed by the publisher.
Research integrity at Frontiers
Learn more about the work of our research integrity team to safeguard the quality of each article we publish.