 Dongyu Liu
 Kazuyuki Fujihara
 Yuchio Yanagawa
 Hajime Mushiake
 Tomokazu Ohshiro
- 1Department of Physiology, Graduate School of Medicine, Tohoku University, Sendai, Japan
- 2Department of Psychiatry and Neuroscience, Graduate School of Medicine, Gunma University, Maebashi, Japan
- 3Department of Genetic and Behavioral Neuroscience, Graduate School of Medicine, Gunma University, Maebashi, Japan
Objective: To elucidate the functional role of gamma-aminobutyric acid (GABA)-ergic inhibition in suppressing epileptic brain activities such as spike-wave discharge (SWD), we recorded electroencephalogram (EEG) in knockout rats for Glutamate decarboxylase 1 (Gad1), which encodes one of the two GABA-synthesizing enzymes in mammals. We also examined how anti-epileptic drug valproate (VPA) acts on the SWDs present in Gad1 rats and affects GABA synthesis in the reticular thalamic nucleus (RTN), which is known to play an essential role in suppressing SWD.
Methods: Chronic EEG recordings were performed in freely moving control rats and homozygous knockout Gad1 (–/–) rats. Buzzer tones (82 dB) were delivered to the rats during EEG monitoring to test whether acoustic stimulation could interrupt ongoing SWDs. VPA was administered orally to the rats, and the change in the number of SWDs was examined. The distribution of GABA in the RTN was examined immunohistochemically.
Results: SWDs were abundant in EEG from Gad1 (–/–) rats as young as 2 months old. Although SWDs were universally detected in older rats irrespective of their Gad1 genotype, SWD symptom was most severe in Gad1 (–/–) rats. Acoustic stimulation readily interrupted ongoing SWDs irrespective of the Gad1 genotype, whereas SWDs were more resistant to interruption in Gad1 (–/–) rats. VPA treatment alleviated SWD symptoms in control rats, however, counterintuitively exacerbated the symptoms in Gad1 (–/–) rats. The immunohistochemistry results indicated that GABA immunoreactivity was significantly reduced in the somata of RTN neurons in Gad1 (–/–) rats but not in their axons targeting the thalamus. VPA treatment greatly increased GABA immunoreactivity in the RTN neurons of Gad1 (–/–) rats, which is likely due to the intact GAD2, another GAD isozyme, in these neurons.
Discussion: Our results revealed two opposing roles of GABA in SWD generation: suppression and enhancement of SWD. To account for these contradictory roles, we propose a model in which GABA produced by GAD1 in the RTN neuronal somata is released extrasynaptically and mediates intra-RTN inhibition.
1. Introduction
An absence seizure is a non-convulsive epilepsy accompanied by a spike-wave discharge (SWD) that appears suddenly in a patient's electroencephalogram (EEG) and lasts for several seconds (1–3). Human patients temporarily lose consciousness while paroxysmal activity emerges in the EEG. Therefore, the appearance of SWDs in an EEG is a useful clinical observation for the diagnosis of absence epilepsy. SWDs can be identified by a characteristic composite waveform consisting of a primary oscillation lasting up to 30 s (frequency: approximately 3 Hz) and large spikes superimposed on and in phase with the oscillation (1, 2). Genetic rat models for SWD have long been established (4–6); these model rats exhibit SWDs reproducibly in EEGs, with dominant oscillation frequencies of approximately 7–12 Hz (5, 7). Common laboratory rats such as Brown Norway, Long-Evans, and even wild-caught rats were recently demonstrated to exhibit abundant SWDs in EEGs (8, 9). Although SWDs in these rats are usually accompanied by the absence of seizure-like symptoms such as behavioral immobility, both naïve and genetic model rats can behaviorally detect and respond appropriately to sensory or reward cues presented when an SWD appeared on their EEG (9–12). Therefore, whether SWDs in rodents represent pathological or physiological brain activity remains controversial (7–9, 13, 14).
SWDs originate primarily within the reticular thalamic nucleus (RTN)–thalamus–cortex network (15–19). The RTN consists of GABAergic neurons that surround and innervate the thalamus, providing synaptic inhibition to thalamocortical (TC) relay neurons (20). The firing of RTN neurons elicits hyperpolarization in TC neurons, which in turn activates low-threshold T-type Ca2+ channels and evokes post-inhibitory rebound bursting in TC neurons (21). These TC neurons project axon collaterals back to the RTN; the re-excitation of RTN neurons leads to recurrent intra-thalamic oscillation, i.e., SWD (19).
Gamma-aminobutyric acid (GABA), the main inhibitory neurotransmitter, is synthesized from glutamate by two isoenzymes, namely, glutamate decarboxylase (GAD) 1 (67 kDa) and GAD2 (65 kDa) in mammalians. GAD2 is localized primarily in the inhibitory synapse and therefore plays an important role in synaptic inhibition (22, 23). Gad2 knockout mice or rats are viable but suffer from spontaneous convulsive seizures (24–26). By contrast, GAD1 is primarily localized in the cytoplasm of GABAergic neurons (27, 28). Knockout rats for Gad1 that were recently created through clustered regularly interspaced short palindromic repeats (CRISPR)/Cas9-mediated gene editing showed schizophrenia-like symptoms (29). However, whether these Gad1 (–/–) homozygous knockout rats show any other neurological symptoms, such as epilepsy, remains to be determined.
In this study, we conducted EEG monitoring of Gad1 (–/–) rats to evaluate their SWD symptoms in comparison with control rats. We attempted to interrupt ongoing SWDs through acoustic stimulation and conducted a pharmacological experiment using the anti-epilepsy drug valproate (VPA). Finally, we immunohistochemically analyzed the GABA expression level in RTN neurons to examine the effects of VPA treatment.
2. Materials
2.1. Animals
Gad1 knockout rats were generated using CRISPR/Cas9-mediated gene editing (29) in the Long-Evans background. Knockout rats were crossed with Long-Evans rats (Japan SLC, Inc., Japan) and bred in the Gad1 heterozygous (+/–) state in our laboratory. Gad1 (–/–) and Gad1 wild-type (+/+) rats were obtained from sibling mating between heterozygotes. All rats were reared under standard laboratory conditions under a 12-h/12-h light/dark cycle. All experimental procedures were approved by the Animal Care and Experimentation Committee of Gunma University and the Tohoku University Committee for Animal Research.
2.2. Surgery and EEG recordings
Implant surgery and EEG recording were performed as described previously (25). Briefly, rats were anesthetized with medetomidine, midazolam, and butorphanol mixture and placed on the stereotaxic apparatus. Heart rates and SpO2 were continuously monitored. The scalp was excised, and the parietal skull bone was exposed. Small burr holes (~0.9 mm diameter) were made bilaterally over the skull, and twisted-pair wire electrodes (114 μm diameter, TFA-coated silver wire, Med Wire, USA) and/or silver-pleated screw electrodes (M1 × 3 mm, Unique Medical, Japan) were aseptically implanted. The tips of the twisted-pair wire electrodes were inserted into the cortex at a depth of 1 mm and firmly supported through a ceramic guide tube (KyoCera, Japan). After the implant surgery, the rats were returned to the home cage and were allowed to recover from the surgery for 1 to 2 days before the first recording was made. On the EEG recording, the rat with the implant was transferred from the home cage to a clear plexiglass cage (60 × 60 × 60 cm), on whose walls two piezoelectric speakers (Digi-Key Electronics, Thief River Falls, MN, USA) were pasted. A wired head-stage amplifier (HST/8o50-G1-GR; Plexon, Inc., Dallas, TX, USA) or wireless head-stage amplifier (TBSI Wireless Neural Recording System, Global Bio Inc., Mount Laurel, NJ, USA) were used for EEG recording. Raw electrical signals were further amplified and digitized using the Omniplex multichannel recording system (Plexon). In total, 45 rats of both sexes, including 20 Gad1 (–/–), 9 Gad1 (+/–), and 16 Gad1 (+/+) rats, were used in this study. The rats were separated into two age groups, younger (<2 months) and older (≥2 months), and their EEGs were examined for SWDs. Because SWDs were rare in younger Gad1 (+/–) and Gad1 (+/+) rats, only EEG data from older rats were further analyzed. Thus, in total, 100 h of EEG data were collected and analyzed from 10 Gad1 (–/–) rats (age: 2–11 months), 45 h from 6 Gad1 (+/–) rats (age: 3–12 months), and 70 h from 7 Gad1 (+/+) rats (age: 2–12 months). EEG recording was performed for up to 5 h per day, and recording lasted for up to 3 months in a single animal. Some EEG recording sessions were videotaped to record rat behavior.
2.3. Acoustic stimulation experiment
In the acoustic stimulation experiment, a rat was placed in a clear plexiglass cage while wearing an EEG headset. The experimenter continuously monitored the EEG for SWDs and applied a series of acoustic stimulations from piezoelectric speakers (dominant frequency: 2 kHz; loudness: 82 dB [measured at the cage center]; ambient loudness: 44 dB) as soon as an SWD appeared on the monitor. The recording was started without acoustic stimulation for 1–2 h and continued for another 1–2 h with acoustic stimulation. In total, 22 h of EEG recording data were obtained from five Gad1 (–/–) rats (age: 2–10 months), as well as 28 h of EEG recording data from two Gad1 (+/–) rats and four Gad1 (+/+) rats (age: 3–9 months). Because Gad1 (+/–) and Gad1 (+/+) rats yielded similar results, the data from these genotype groups were merged and used as control group data.
2.4. Offline SWD detection
All EEG recording data were analyzed offline for SWDs using custom-made programs written in MATLAB code. Briefly, raw voltage signals sampled at 1 kHz were subjected to high-pass filtering (cutoff: 0.9 Hz) and wavelet-transformed (30). SWDs were extracted from the total spectral power time series data by imposing frequency thresholds at 5 and 32 Hz; this interval contained most of the SWD oscillation power (Figure 1). The extracted SWDs were checked visually, and mechanical noise caused by rats tapping the cable or chewing food pellets was excluded from the data. By our definition, a spike-train waveform lasting <1 s was not regarded as an SWD.
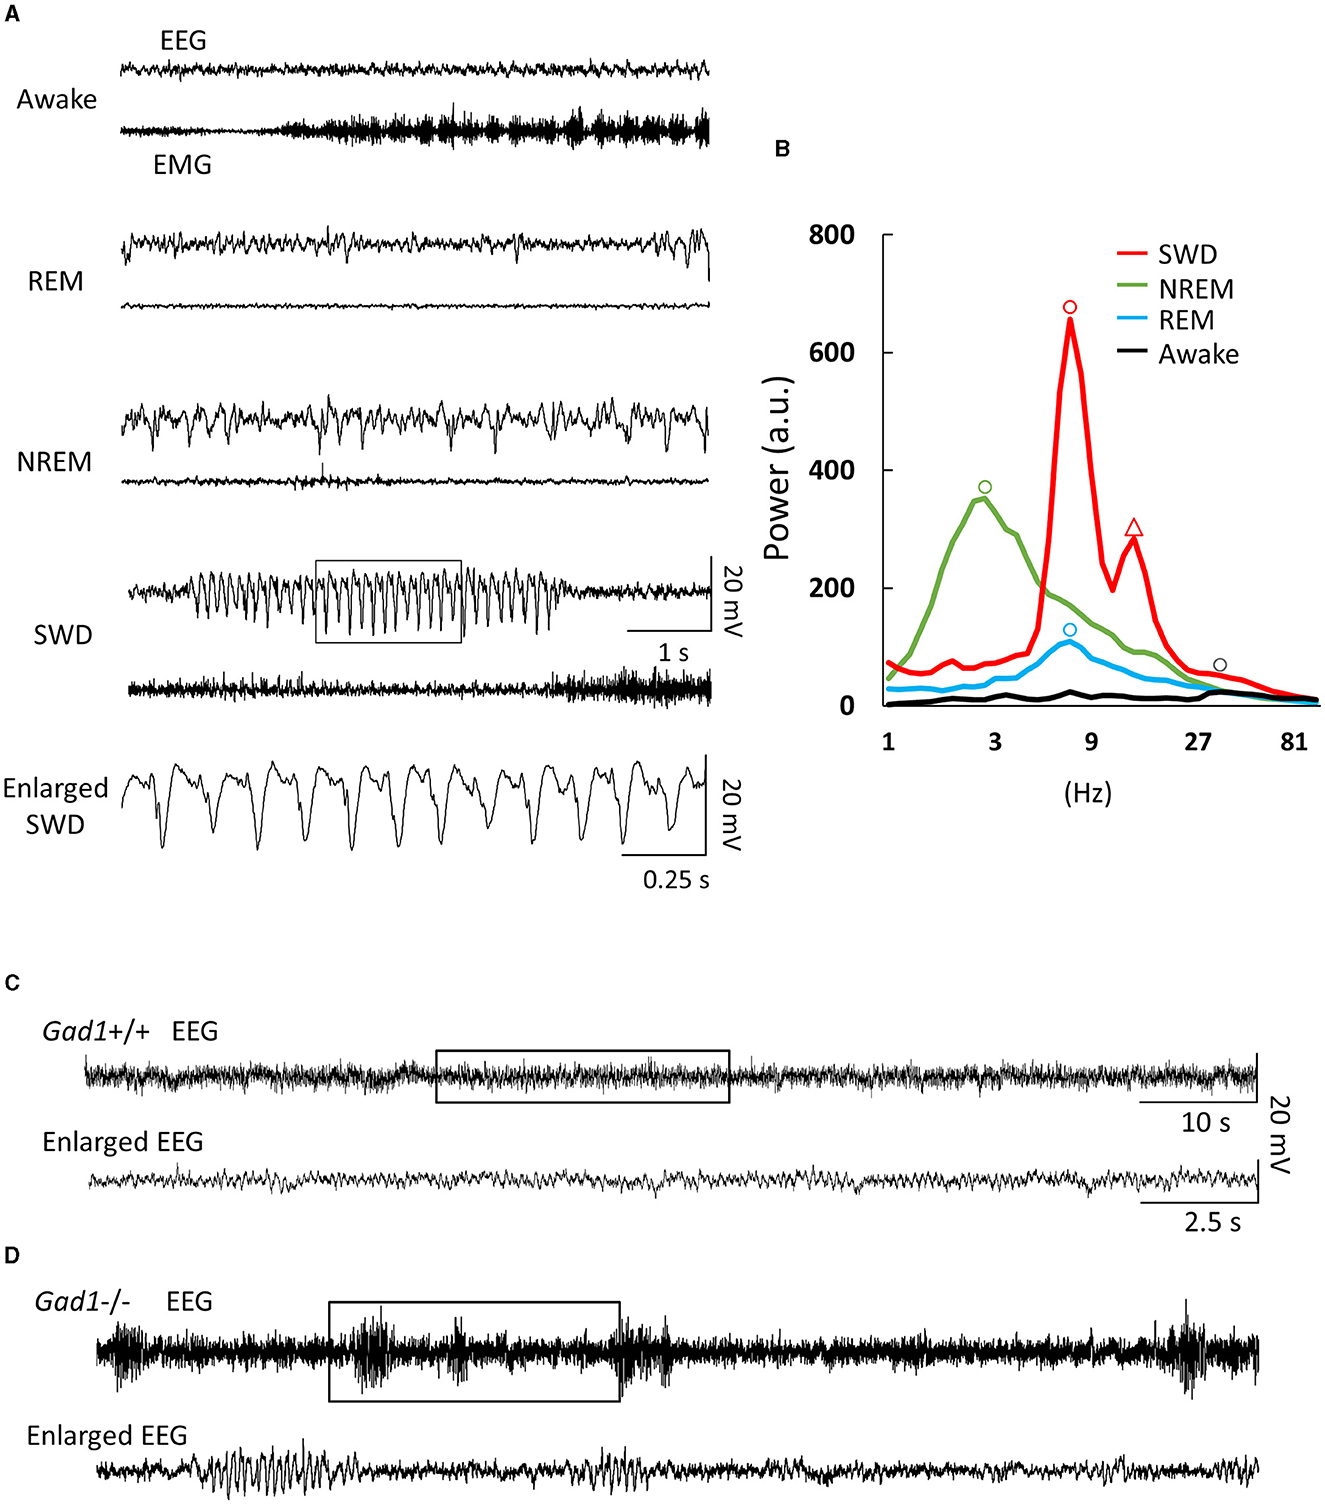
Figure 1. Electroencephalogram (EEG) and electromyogram (EMG) patterns. (A) EEG/EMG patterns from a Gad1 homozygous (–/–) knockout rat. Similar patterns were observed in both Gad1 heterozygous (+/–) and wild-type (+/+) rats. In the awake state, the animals showed a rapid, small-amplitude EEG pattern and a highly active EMG pattern. Rapid-eye-movement (REM) sleep was associated with complete muscle atonia, despite the active EEG pattern. Non-REM (NREM) sleep was associated with a slow, large-amplitude EEG pattern. Spike-wave discharges (SWDs) (framed section of the EEG, enlarged at the bottom) appeared suddenly while the rats were awake, although they tended to remain still. (B) EEG power spectrum with arbitrary units (a.u.). Peaks are indicated by circles. The dominant frequencies for SWD, NREM sleep, REM sleep, and wakefulness were 8, 3, 7, and 30 Hz, respectively. The SWD power spectrum also showed a second prominent peak (triangle) at the first harmonic, i.e., 16 Hz, reflecting a spiky waveform shape. (C) EEG pattern from a 7-week-old Gad1 (+/+) rat. Few SWDs were seen at ages of <2 months. The framed section (top) is enlarged at the bottom. (D) EEG patterns from a 5-week-old Gad1 (–/–) rat showed many SWDs. The framed section (top) is enlarged at the bottom.
2.5. VPA treatment
We initially examined the effect of intraperitoneal (i.p.) injections of VPA (150–300 mg/kg, dissolved in 1 ml of saline) using three Gad1 (–/–), two Gad1 (+/–), and two Gad1 (+/+) rats. In this pilot experiment, we observed that all became drowsy and inactive after the injection, except for one Gad1 (+/+) rat. To avoid acute poisoning and the need for repeated i.p. administration, we next tried a milder oral formulation of the drug, using another set of rats (two Gad1 (–/–), four Gad1 (+/–), and two Gad1 (+/+) rats). VPA (10 mg/ml) was dissolved in water and made available to the rats ad libitum for 7 days. At the end of this period, we collected the blood serum samples from these animals and outsourced them to a local biochemistry lab (Nagahama Life Science Laboratory, Shiga, Japan) for the VPA blood concentration measurement. VPA concentration was measured based on the enzyme immunoassay method (Emit2000 valproate assay, Siemens Healthcare, Japan). The average blood concentration of VPA was 40.4 ± 10.4 μg/ml (24.1–73.7; n = 8 animals). The effective blood concentration of VPA for the treatment of epilepsy in humans is 50–100 μg/ml (31). Based on these observations, we decided to adopt the oral administration of the drug for the EEG recording experiment and the GABA immunohistochemistry. For the recording experiment, a pre-medication EEG recording was performed 2–3 days before starting drug administration [control group: VPA (–)]. EEG recording was resumed on the 3rd day after the initiation of drug administration and performed for a total of 2–3 days until the 7th day of the VPA treatment [experimental group: VPA (+)] (Table 1). In total, we obtained 70 h of EEG recording data from four Gad1 (–/–) rats (age: 5–11 months) and 68 h from four Gad1 (+/+) rats (age: 5–12 months). The water intake and body weight were monitored during the experiment (Table 2).
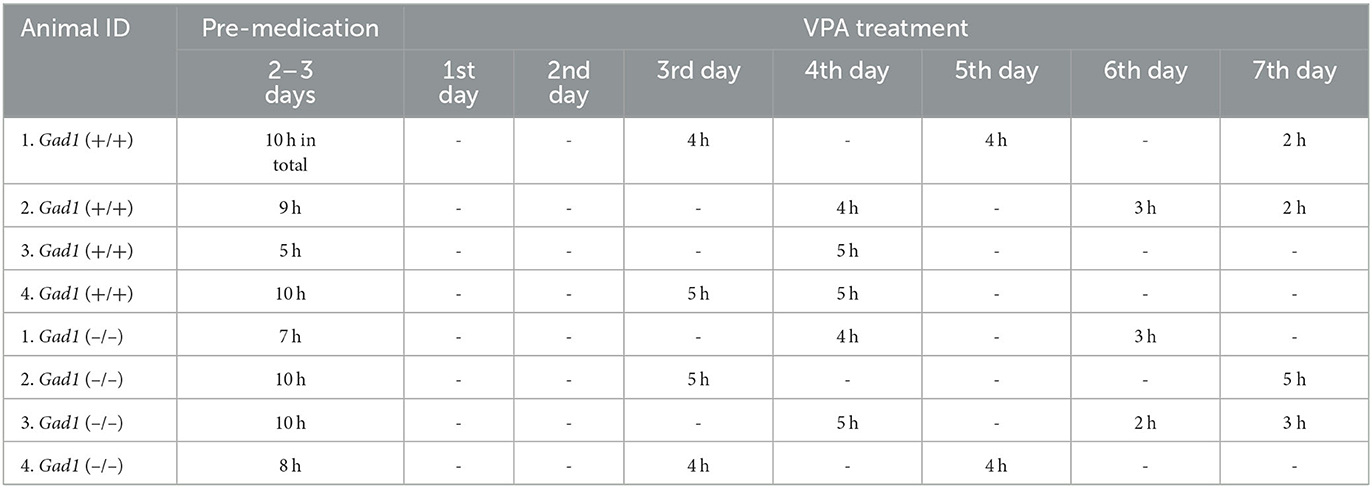
Table 1. EEG recording time before and during the VPA treatment.
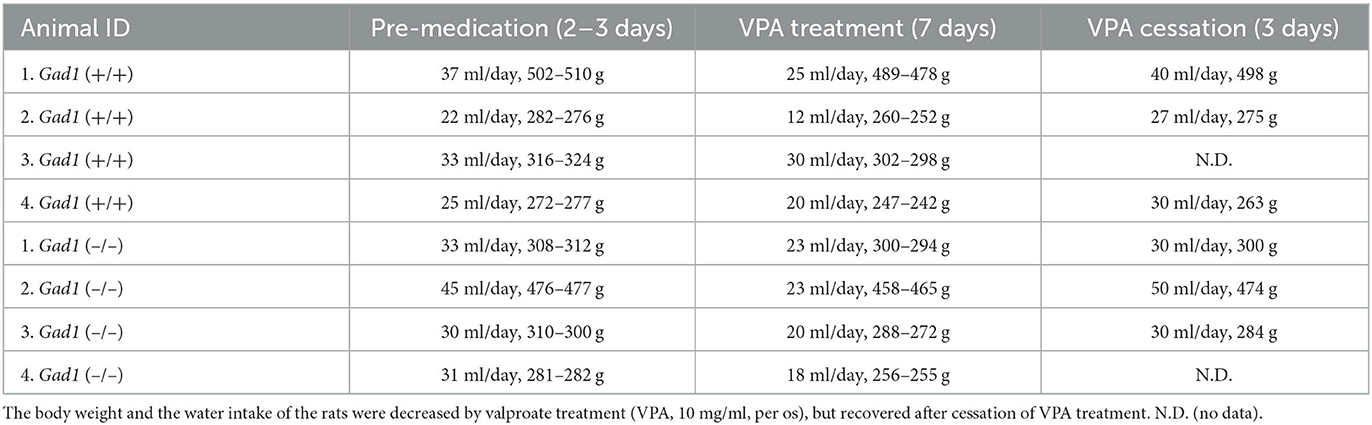
Table 2. Amounts of water/VPA intake (average) and rat's weight (range) before, during, and after VPA treatment.
2.6. Immunohistochemistry
Four Gad1 (+/+) VPA (–), five Gad1 (+/+) VPA (+), four Gad1 (–/–) VPA (–), and four Gad1 (–/–) VPA (+) rats were euthanized by intraperitoneal injection of pentobarbital (150 mg/kg animal) and perfused with one-half Karnovsky fixative (2% paraformaldehyde and 2% glutaraldehyde in phosphate-buffered saline). The fixed brain was immersed in 30% sucrose in 0.1 M phosphate buffer for cryoprotection and embedded in Tissue-Tek OCT compound (Sakura Finetek Japan, Tokyo, Japan). The frozen brain was cut into 10-μm-thick sections using a cryostat (CM1950, Leica, Wetzlar, Germany) and mounted onto coated slide glasses (MAS-01, Matsunami Glass, Kishiwada, Japan). Coronal sections (ca. bregma −2.7 mm) were selected to examine the RTN and neighboring thalamic nuclei. Immunostaining was performed using a STAINperfect Immunostaining Kit (ImmuSmol, Bordeaux, France), following the manufacturer's instructions. The primary antibodies used in these experiments included chicken polyclonal anti-GABA (1:500 dilution; ImmuSmol), rabbit polyclonal anti-parvalbumin (PV) (1:2,000, GTX134110, Genetex, Hsinchu, Taiwan), chicken normal serum (for negative control, 1:2,000 dilution; Jackson ImmunoResearch), and the secondary antibodies were preabsorbed Alexa Fluor-488 conjugated goat anti-chicken IgY (1:500 dilution; ab150173, Abcam, Cambridge, UK) and preabsorbed Alexa Fluor-568 conjugated goat anti-rabbit IgG (1:500 dilution; ab175695, Abcam, Cambridge, UK). For fluorescent nucleus staining, we used a CellStain−4′,6-diamidino-2-phenylindol (DAPI) solution (1:500 dilution, Dojindo Kumamoto, Mashiki, Japan). Fluorescence images were acquired using an LSM 780 laser confocal microscope (Zeiss, Oberkochen, Germany) and a 63 × oil objective lens (numerical aperture: 1.4) and analyzed using the ZEN confocal image analysis software (Zeiss) and ImageJ software (National Institutes of Health, Bethesda, MD, USA), respectively (32–34) (Supplementary Figures S1, S2).
2.7. Statistical analyses and graphics
Median values were compared using the Wilcoxon rank-sum, Wilcoxon signed-rank, and Kruskal–Wallis tests using the MATLAB Statistics and Machine Learning Toolbox. Multiple comparisons were performed using the multicompare function with Fisher's least significant difference option in the same toolbox. All plots were drawn using Excel software (Microsoft Corp., Redmond, WA, USA). In the box-whisker plot, the upper (lower) whisker was drawn from the top (bottom) of the box, up (down), to the largest (smallest) data point within 1.5-fold of the interquartile range. Outliers outside the upper and lower whiskers are not shown in the plot.
3. Results
3.1. Abundant SWDs in young Gad1 (–/–) rats
EEG patterns in Gad1 (–/–) rats during the awake or sleep (rapid eye movement and non-rapid eye movement) states appeared to be similar to those in normal animals (32) (Figure 1A). However, on visual inspection of the EEG data, frequent large-amplitude spiky waveforms caught the attention (Figure 1A, SWD), which lasted a few seconds and oscillated at approximately 8 Hz (Figure 1B). These features are suggestive of spike-wave discharges in rodents (5, 7). These SWDs were observed while the rats were awake but quiet or at rest after active exploration. SWDs were observed in Gad1 (–/–) rats as early as 2 months of age, whereas they were rarely detected in Gad1 (+/–) or Gad1 (+/+) rats at similar ages (Figures 1C, D, Table 3). Only one out of seven rats showed SWDs (29 SWDs were detected from a total of 10 h of recording). The other six control rats did not show SWD in their EEG (a total of 175 h of recording). However, even in Gad1 (+/+) rats, SWDs eventually prevailed in the EEG at older ages. No overt convulsive seizures or other epileptic activity were observed in Gad1 (–/–) rats (data not shown).
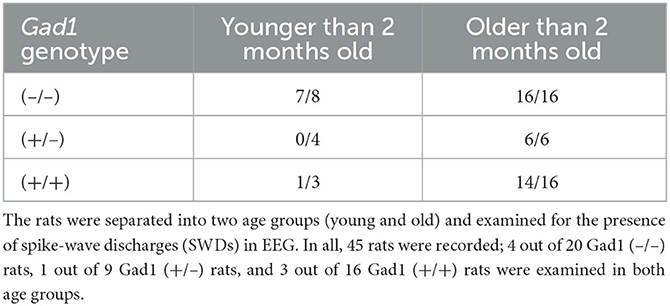
Table 3. Proportion of rats showing SWDs sorted by age.
As SWDs were rare in young Gad1 (+/–) and Gad1 (+/+) rats, only SWDs from older rats were analyzed and compared among the three genotypes (Figure 2). SWDs were significantly longer in Gad1 (–/–) rats (median: 2.3 s; n = 7,305 SWDs from 10 rats) than in Gad1 (+/–) rats (2.0 s; n = 1,749 SWDs from 6 rats) or Gad1 (+/+) rats (2.1 s; n = 3,766 SWDs from 7 rats) (Figure 2A; P = 4.2 × 10⁻¹³; Kruskal–Wallis test). The difference between Gad1 (+/+) and Gad1 (+/–) rats was not statistically significant (P = 0.41; Wilcoxon rank-sum test). The SWD length shows long-tailed distributions (Figure 2B), with the longest SWD lasting longer than 10 s. Most SWDs were shorter than 5 s in duration, regardless of genotype. The median SWD count in Gad1 (–/–) rats (61/h) was the largest among the three genotypes (P = 8.3 × 10⁻⁷; Kruskal–Wallis test) (Figure 2C), while the median SWD in Gad1 (+/–) rats (28/h) was significantly smaller than in Gad1 (+/+) rats (39/h) (P = 0.011; Wilcoxon rank-sum test). Therefore, the total SWD time per hour was greatest in Gad1 (–/–) rats (median: 155 s/h), which was significantly different from Gad1 (+/–) and Gad1 (+/+) rats (median: 86 and 102 s/h, respectively, P = 5.7 × 10⁻⁶; Kruskal–Wallis test) (Figure 2D). The total SWD time in Gad1 (+/–) was shorter than Gad1 (+/+) rats, however the difference was insignificant (P = 0.09; Wilcoxon rank-sum test). These results indicate that Gad1 (–/–) rats had the most severe SWD phenotype and that GAD1 plays a role in suppressing SWD generation in rats.
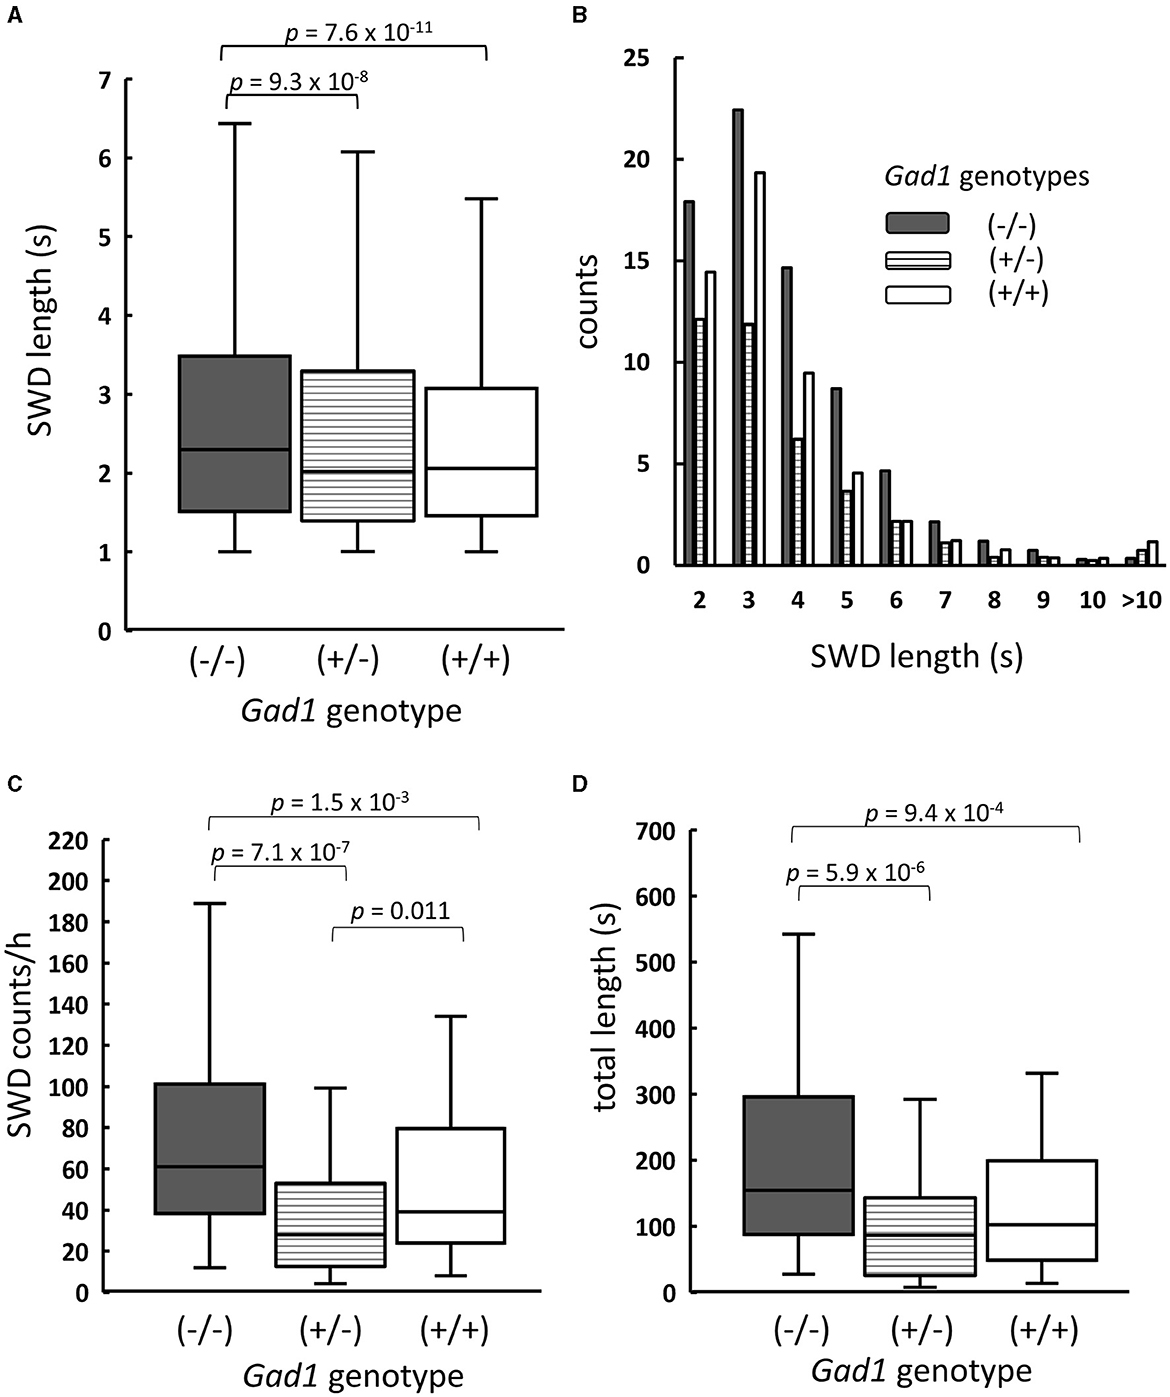
Figure 2. Summary of SWDs from Gad1 (–/–) rats (shaded), Gad1 (+/–) rats (lined), and Gad1 (+/+) rats (unshaded). (A) Box and whisker plots of individual SWD lengths. The median SWD length was greatest in the Gad1 (–/–) group. (B) Distribution of SWD counts per hour, sorted by length. Most SWDs lasted for 5 s. (C) Accumulated SWD counts per hour. The median count was highest in the Gad1 (–/–) group. (D) Accumulated lengths of individual SWDs per hour. The median length was greatest in the Gad1 (–/–) group. In the graphs, SWD data were merged within the same experimental group, and the medians of each group were compared (Wilcoxon rank-sum test), i.e., P-values were obtained based on events but not animals. See the text for detailed statistical information.
3.2. Interruption of SWD by acoustic stimulations
In human patients with absence seizures, SWD appears abruptly in EEG, while the patients temporally lose consciousness and are often unaware of external sensory stimuli (1–3). Therefore, we investigated whether the rats were responsive to external acoustic stimulation when SWDs appeared in the EEG. We presented buzzer tones through speakers to awake-behaving animals during live EEG monitoring. The experimenter presented the buzzer tone as soon as an SWD was detected in the EEG displayed on a monitor. Gad1 (–/–) and control rats responded overtly to these buzzer tones (Table 4). Most SWDs were interrupted readily by a single volley of buzzer tones (Case 1 SWD, Figure 3A), whereas the remaining SWDs were not (Case 2 SWD, Figure 3B). The appearance of SWDs in EEG was highly correlated with the inactivity of animals caused by reward withdrawal or a loss of motivation to achieve the reward during behavioral tasks (33). Because buzzer stimulations were not associated with reward and did not require a voluntary response, the SWDs observed in the rats, including in Case 2, likely reflect the animal's gradual loss of interest in, or sensory adaptation to, repeated buzzer tones (11, 33). If this is true, the number of SWDs should increase over time. To test this possibility, the SWDs were categorized into the first and second halves of the 1-h recording session. The total SWD count, including that of Cases 1 and 2, was not significantly different between the first and second halves of the session in Gad1 (–/–) rats (median: 63 and 48 per 30 min, respectively; n = 9; p = 0.82, Wilcoxon signed-rank test) and control rats (median: 37 and 9 per 30 min, respectively; n = 11; p = 0.10) (Figure 3C). Similarly, the SWD counts of Case 2 were not significantly different between the first and second halves of the session in Gad1 (–/–) rats (median: 6 and 16 per 30 min, respectively; p = 0.51) or control rats (median: 2 and 0 per 30 min, respectively; p = 0.11). We extended three recording sessions for an additional hour and observed no significant increase in SWD counts in any group (data not shown). Therefore, our results do not suggest that the SWDs were produced by sensory adaptation or a loss of motivation over time. Interestingly, the SWD count in Case 2 was significantly higher in Gad1 (–/–) rats (median Case2/(Case1 + Case2) ratio: 18%; n = 18) than in the control group (median ratio: 5%; n = 20) (p = 0.015, Wilcoxon rank-sum test) (Figure 3D). These results indicate that rats responded to sensory stimuli when SWDs appeared in EEG, and Gad1 (–/–) rats had more SWDs resistant to sensory interruption.
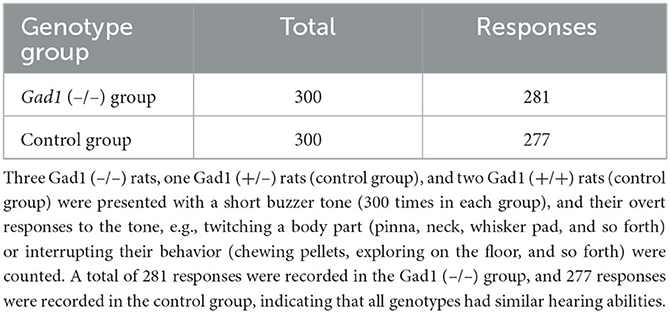
Table 4. Results of hearing ability test.
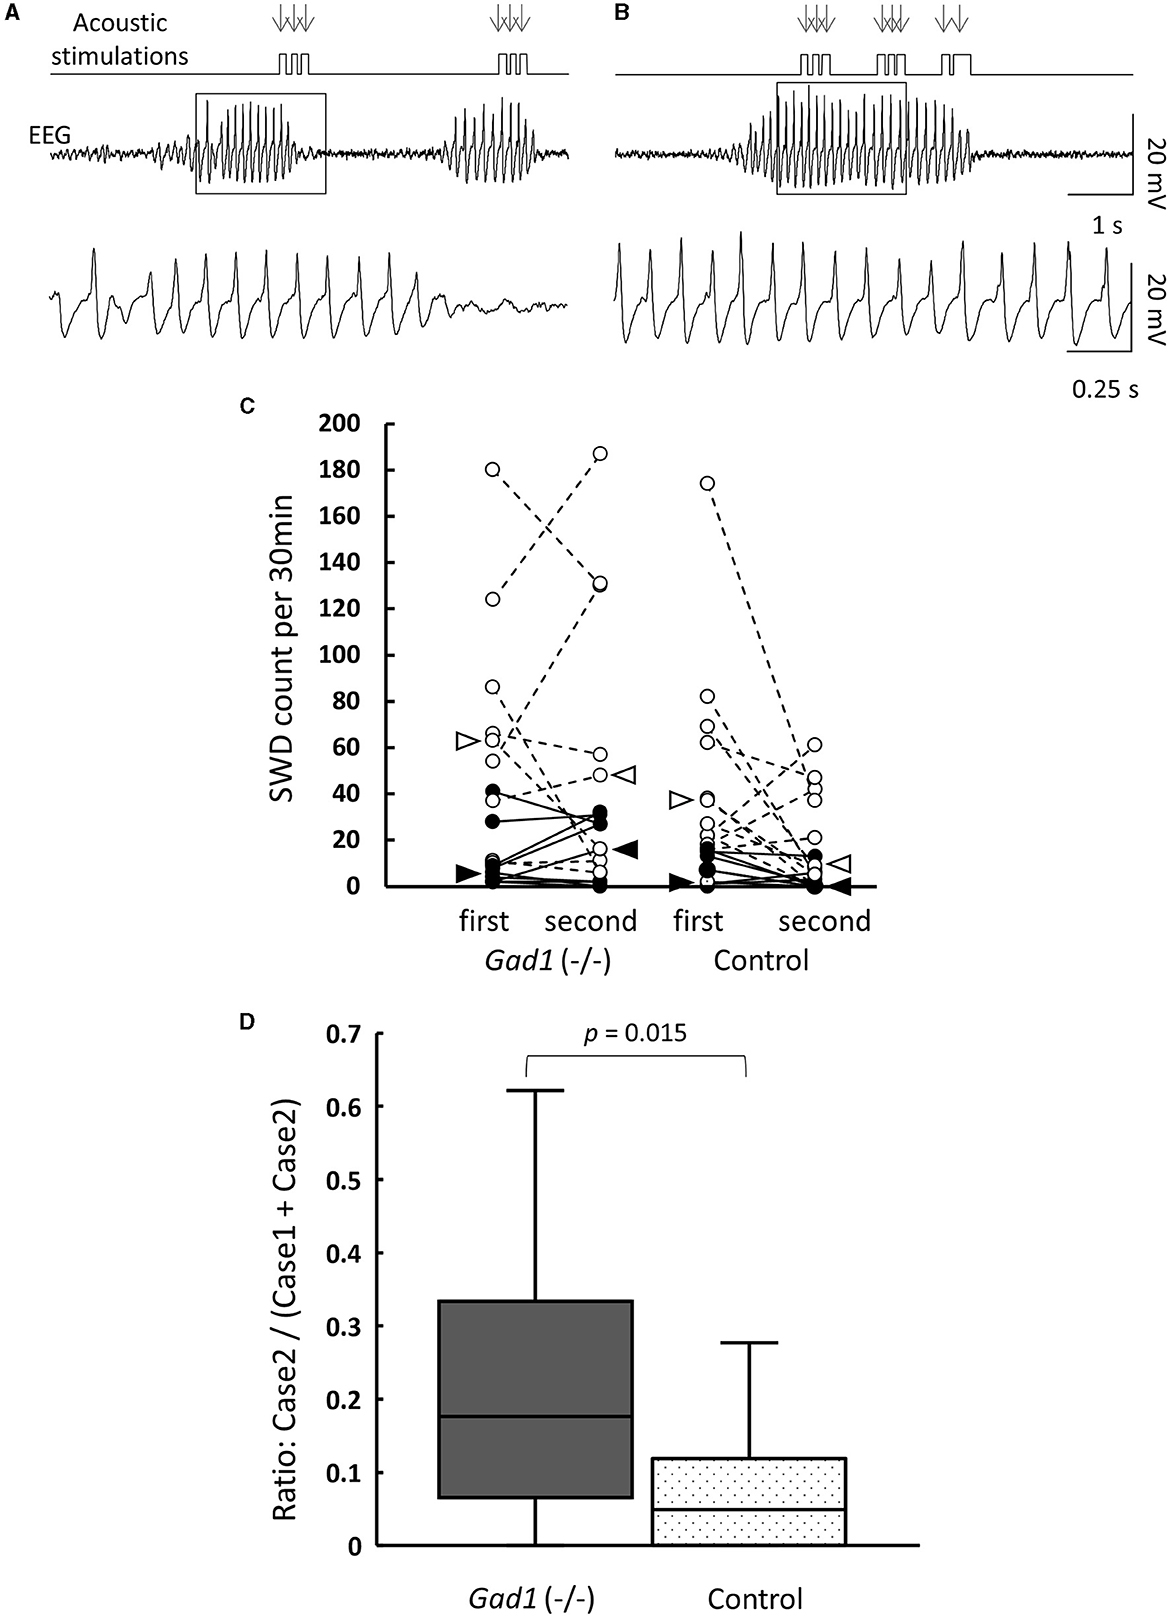
Figure 3. Interruption of SWDs by auditory stimuli (AS). (A) Case 1: SWDs on the EEG were readily interrupted by AS. The timing of AS presentation is indicated by arrows. The framed section of the SWD data is enlarged at the bottom. (B) Case 2: SWDs were not interrupted by AS. The framed section of the SWD data is enlarged at the bottom. Both examples are from a Gad1 (–/–) rat. The other genotypes showed similar patterns. (C) SWD counts according to genotype and occurrence period (first or second half) during the 1-h recording session. Total SWD counts, including both Cases 1 and 2, are indicated by open circles, and Case 2 counts are indicated by filled circles. Circles from the same rat are connected. Medians are indicated by open arrowhead (Cases 1 and 2) or filled arrowhead (Case 2 only). (D) Accumulated Case 2 ratio (Case 2/[Cases 1 and 2]) sorted by genotype. P-values were calculated using the Wilcoxon rank-sum test.
3.3. Anti-epileptic drug test
We next examined VPA, a medication commonly used to treat both the absence and the myoclonic seizure, which inhibits GABA degradative enzymes such as GABA transaminase (34, 35), thereby increasing the GABA level in the brain. As SWD was a common symptom in both older Gad1 (+/+) and Gad1 (–/–) rats, we expected that an increase in GABA caused by VPA would alleviate the SWD phenotype in both genotypes. Consistent with this expectation, the SWD phenotype in Gad1 (+/+) rats (n = 4) was significantly alleviated by VPA treatment (Figure 4). The median length of individual SWDs was decreased by VPA treatment, from 2.2 s (without VPA treatment; n = 2,516 SWDs) to 1.9 s (with VPA treatment; n = 1,625 SWDs) (Figure 4A). A decrease in SWD length was observed over the entire range of SWD sizes (Figure 4B). The median count of SWD appearances per hour decreased from 73 to 51 (Figure 4C); thus, the accumulated SWD length per hour decreased from 200 to 127 s following VPA treatment (Figure 4D).
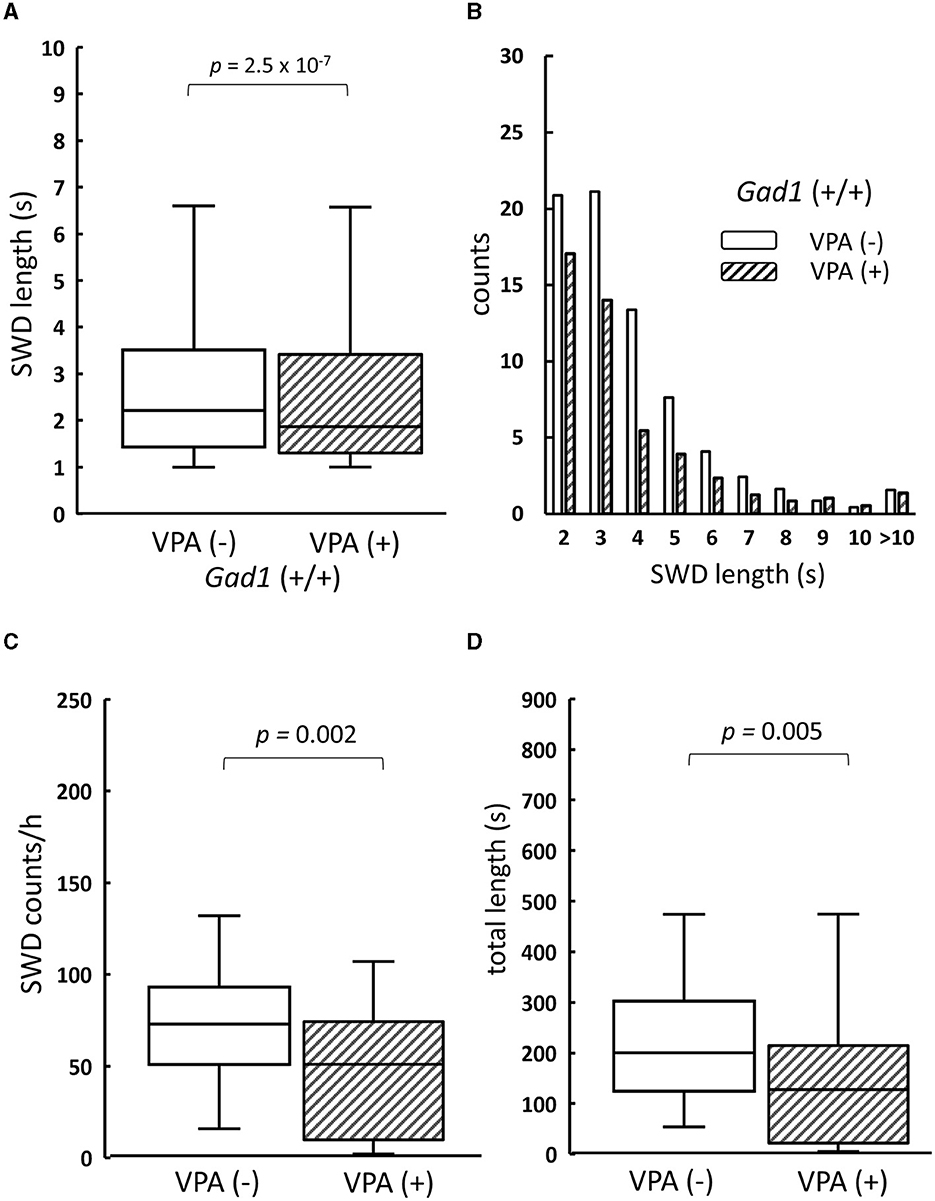
Figure 4. The effect of valproate treatment on SWD in Gad1 (+/+) rats. (A) The median SWD length before valproate treatment [VPA(–)] was significantly decreased by VPA administration [VPA (+)]. (B) SWD counts per hour decreased in almost all SWD length categories following VPA administration. (C) The median SWD count per hour was significantly decreased by VPA treatment. (D) The median accumulated SWD time per hour was significantly decreased by VPA treatment. SWD data were merged within the same experimental group, and the medians of each group were compared (the Wilcoxon rank-sum test).
Counterintuitively, the SWD phenotype in the Gad1 (–/–) rats (n = 4) was worsened by VPA treatment (Figure 5). The median SWD length without treatment (median: 2.4 s; n = 3,113 SWDs) increased to 3.0 s following VPA treatment (n = 3,132 SWDs) (Figure 5A). Notably, SWDs shorter than 4 s in duration decreased in number, whereas those lasting longer than 5 s became more frequent (Figure 5B). The number of SWD occurrences, irrespective of size, did not differ significantly between treatment groups (Figure 5C). Overall, accumulated SWD length per hour increased from 289 to 307 s; however, this increase was not significant (Figure 5D). In summary, VPA treatment exacerbated the SWD symptom in Gad1 (–/–) rats, unlike in control rats, suggesting that a mere increase in GABA level by the drug cannot compensate for GAD1 deficiency.
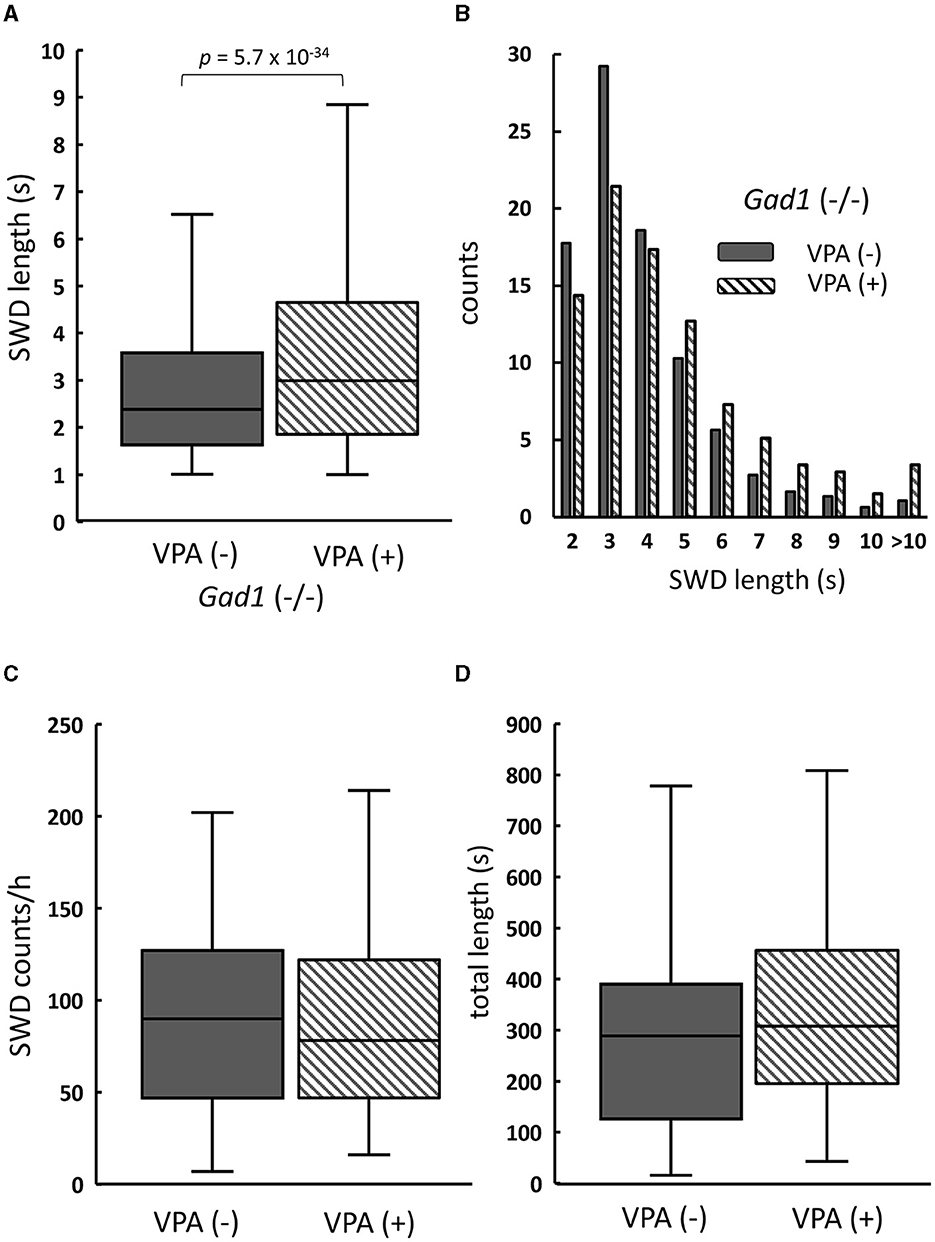
Figure 5. The effect of valproate treatment in Gad1 (–/–) rats. (A) The median SWD length before valproate treatment [VPA(–)] was significantly increased by VPA administration [VPA(+)]. (B) Following VPA treatment, SWD counts per hour decreased for shorter SWDs but increased for longer SWDs. (C) The median SWD count per hour was slightly decreased by VPA, but the effect was not statistically significant (P = 0.77). (D) The median SWD length per hour was increased by VPA, but the effect was not statistically significant (P = 0.23). SWD data were merged within the same experimental group, and the medians of each group were compared (the Wilcoxon rank-sum test).
3.4. GABA immunoreactivity in reticular thalamic nucleus
GAD1 is abundantly expressed in GABAergic neurons in the RTN, which plays an important role in SWD generation (15–19). We finally examined GABA immunoreactivity in the RTN (Figure 6). We identified GABAergic RTN neurons and their axons through co-immunostaining with an antibody against parvalbumin (PV), a peptide marker for the GABAergic RTN neurons (36–39). In Gad1 (+/+) rats without VPA treatment [VPA(–)], a strong GABA immunoreactivity was detected in the somata of RTN neurons (Figure 6A, left). A further enhanced GABA immunoreactivity was observed after VPA treatment [VPA(+)] (Figure 6B, left). As expected, GAD1 deficiency reduced GABA immunoreactivity in the somata (Figure 6C, left). VPA treatment restored GABA immunoreactivity in the somata of Gad1 (–/–) rats (Figure 6D, left). These results are quantified and summarized in Figure 6E. GABA immunoreactivity was significantly lower in Gad1 (–/–) rats (P = 7.4 × 10⁻⁹; Kruskal–Wallis test). The GABA immunoreactivity was restored in Gad1 (–/–) after VPA treatment, comparable to that of Gad1 (+/+) rats (P = 0.69; Wilcoxon rank-sum test).
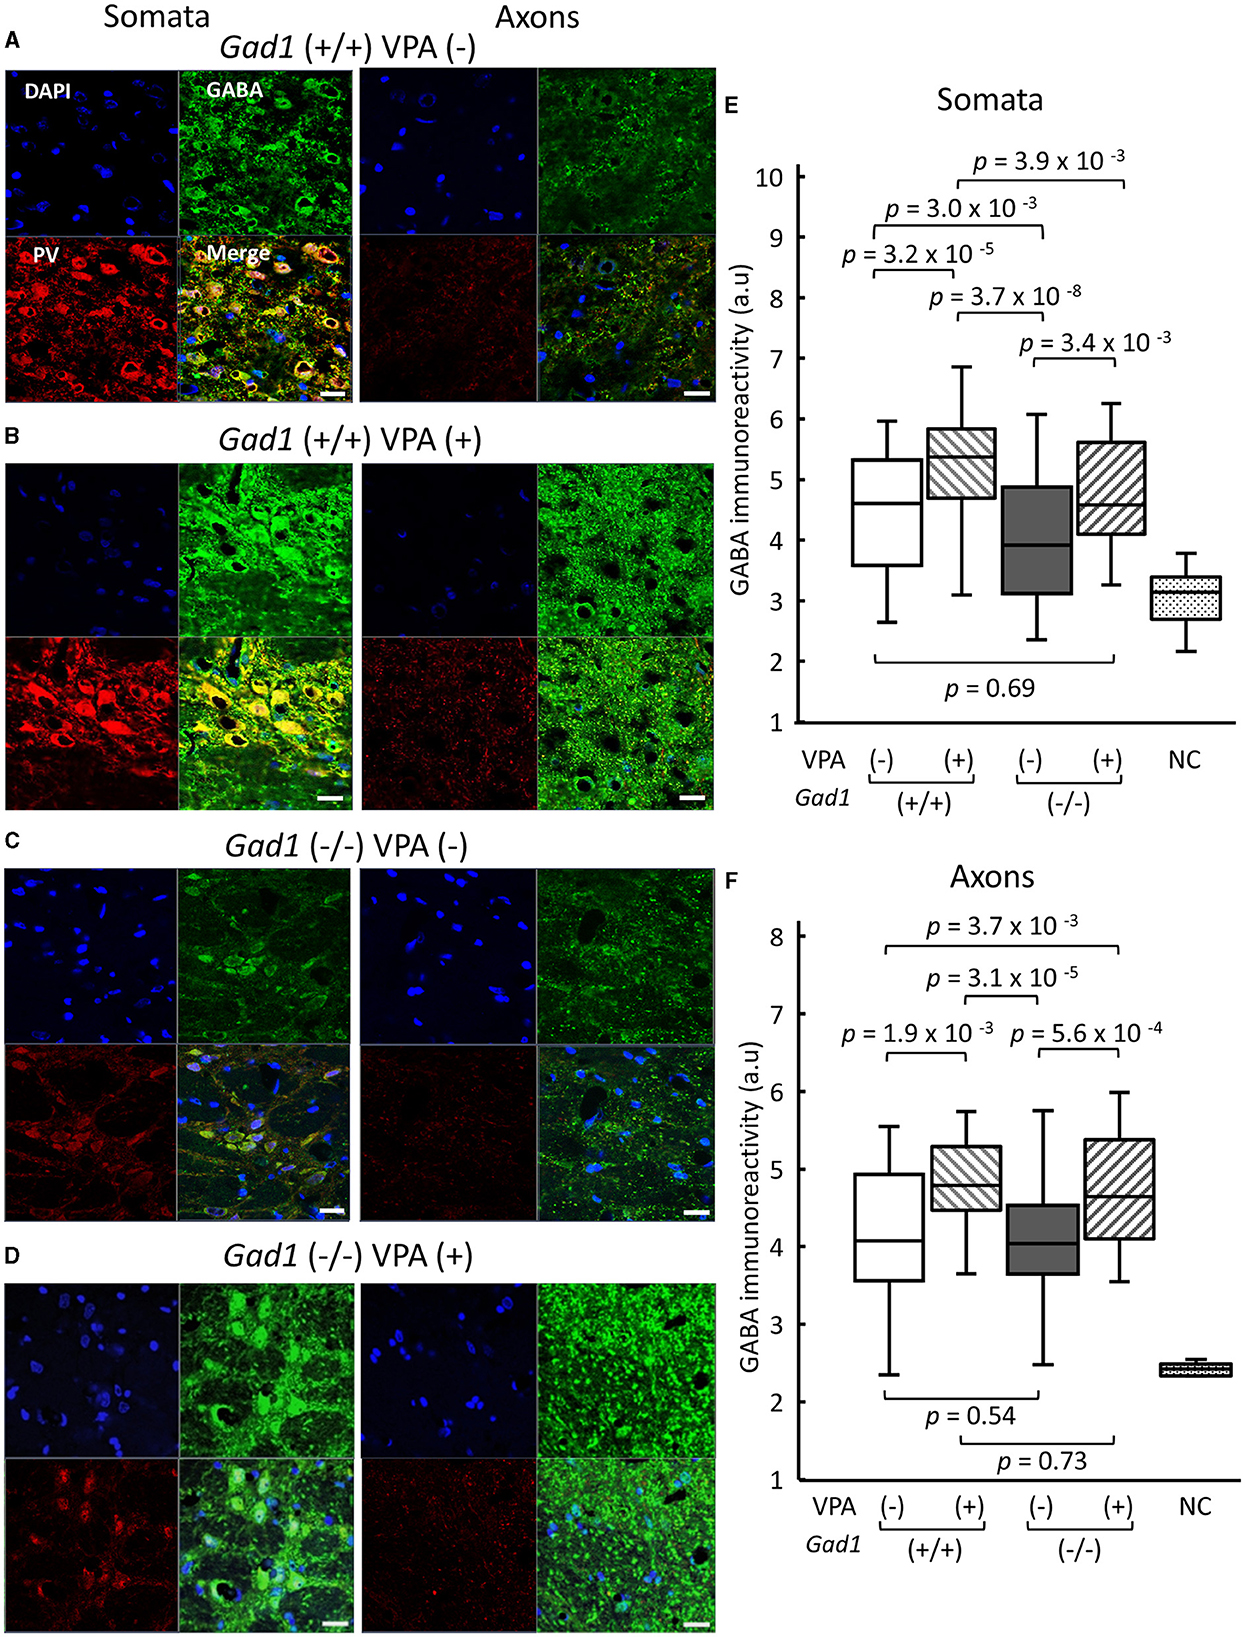
Figure 6. GABA immunoreactivity in neuronal soma of RTN neurons and their axons targeting the thalamus. White scale bar: 20 μm. Immunohistochemical detection of gamma aminobutyric acid (GABA, green) and parvalbumin (PV, red) in (A) Gad1 (+/+) VPA (–) rats, (B) Gad1 (+/+) VPA (+) rats, (C) Gad1 (–/–) VPA (–) rats, and (D) Gad1 (–/–) VPA (+) rat. Cell nuclei were labeled with DAPI (blue). (E) GABA immunoreactivity was significantly lower in the RTN neuronal soma of Gad1 (–/–) rats without VPA treatment. (F) GABA immunoreactivity in the RTN axons was not significantly different between Gad1 (–/–) and Gad1 (+/+) rats, irrespective of VPA treatment. P values in the graphs were calculated by pairwise comparisons (the Wilcoxon rank-sum test). Negative control (NC) was included to indicate the background immunoreactivity level, in which chicken normal serum was used as the primary antibody in place of the chicken anti-GABA antibody.
By contrast, the patterns of GABA immunoreactivity in the RTN axons targeting the thalamus were different from those found in the RTN somata. The GABA immunoreactivity in the RTN axons was similar between Gad1 (+/+) (Figure 6A, right) and Gad1 (–/–) rats (Figure 6C, right). VPA treatment led to a marked increase in GABA immunoreactivity in the axons of both Gad1 (+/+) rats (Figure 6B, right) and Gad1 (–/–) rats (Figure 6D, right) to a similar degree. These results are summarized in Figure 6F. The difference in GABA immunoreactivity was not significantly different between the two genotypes without VPA treatment [VPA(–)] (P = 0.54; Wilcoxon rank-sum test) or with VPA treatment [VPA(+)] (P = 0.73). These results suggest that GAD1 has a less influential role in axonal GABA production. In summary, we detected a significant reduction in GABA immunoreactivity in the RTN neuronal somata in Gad1 (–/–) rats, consistent with the notion that GAD1 is essential for GABA synthesis in the RTN. The residual GABA in Gad1 (–/–) rats and excess GABA after VPA treatment are presumably produced by another GABA-synthesizing enzyme, GAD2, which is also expressed in RTN neurons and predominantly localized in the axons (28). The absence of functional GAD1 in the RTN and the excess GABA production in the axons after VPA treatment may account for the contradictory VPA treatment effect observed in Gad1 (–/–) rats (see the “Discussion” section).
4. Discussion
In this study, we demonstrated that SWD appeared in EEGs at younger ages and more frequently in Gad1 (–/–) rats than in control rats, indicating that GAD1 plays an important role in SWD suppression. Even control rats exhibited SWDs (Figure 2), which increased in number with age (Table 3) and were alleviated by VPA treatment (Figure 4). Both GAD1 protein and mRNA levels have been reported to decrease spontaneously in the auditory cortex and hippocampus of common laboratory rats (40, 41), suggesting that the overall efficacy of GABAergic signal transduction in the brain decreases with age and that this decrease underlies the increase in SWDs observed in older control rats.
We observed that the SWD counts per hour in Gad1 (+/–) rats were significantly smaller than those in Gad1 (+/+) rats (Figure 2C), contrary to the observation that the SWD phenotype in Gad1 (+/–) rats was not significantly different from that in Gad1 (+/+) rats (Figure 2A). One likely explanation for this unexpected order relation is that one of the Gad1 (+/+) rats used for this experiment particularity showed a severe SWD phenotype similar to that of the Gad1 (–/–) rat. Therefore, we do not suggest that the difference seen between Gad1 (+/–) and Gad1 (+/+) rats reflects a biologically meaningful difference.
SWDs have been studied in rodent models of epilepsy (4–6). Rodent models have shown that SWDs associated with behavioral immobility could be readily interrupted by external acoustic stimulations or voluntarily controlled with reward cues (9–12, 33, 42), which is consistent with our observation that most SWDs and the associated behavioral immobility were interrupted by buzzer tones (Case 1 SWD, Figure 3A). However, these findings are inconsistent with the clinical observation in human cases that loss of consciousness (absence seizure) is associated with SWDs (1–3). Previous studies have suggested that SWDs in rodents may reflect regular brain activities such as those associated with whisker twitching or attentive mu rhythm (14, 43–45). Nevertheless, we demonstrated that modest numbers of SWDs were resistant to interruption by buzzer tones (Case 2 SWD, Figure 3B) (12). Our data do not strongly suggest that these SWDs were produced by sensory adaptation or loss of motivation over time. Although our buzzer stimuli were not associated with any reward or required behavioral response, they were strong enough to suppress the ongoing SWDs in the control rats for ~95% of the SWDs, comparable to ~90% reported by Rodgers et al. (12), in which their acoustic stimuli were associated with no reward as in ours. Importantly, in our Gad1 (–/–) rats, the same stimulus achieved suppression for ~82% of the SWDs, which was significantly lower than the control rats, supporting our interpretation that Gad1 (–/–) rats showed more severe SWDs resistant to external sensory stimuli. Further studies are required to clarify whether Case 2 SWDs indicate true epileptic activity intermixed with Case 1 SWDs, which may represent a regular brain rhythm.
The interplay between glutamatergic excitatory inputs and GABAergic inhibitory inputs to the thalamus, RTN, and cortex plays an essential role in generating SWDs. Synchronous neuronal excitation in TC neurons is associated with the depolarization of membrane potential after prolonged hyperpolarization by GABAergic inputs from RTN neurons (19, 46–49). The excitatory activity in TC neurons is transferred to the cortex through TC projections; in turn, cortical neurons provide corticothalamic input to the subcortical RTN and thalamus as feedback. The postinhibitory rebound depolarization requires T-type Ca2+ channels (19, 21), which are effectively blocked by ethosuximide (ETX) (9, 31). Indeed, we observed that ETX administration fully suppressed SWDs in both Gad1 (–/–) and Gad1 (+/+) rats (Supplementary Figure S3), confirming the involvement of T-type Ca2+ channels in SWD generation in these animals. Although the responsible genetic mutations in the epilepsy model rats have not been fully identified, a mutation in the gene encoding a T-type Ca2+ channel subunit has been suggested (5).
Our immunohistochemical experiment showed that GABA synthesis was greatly reduced in the RTN neuronal soma and minimally affected in the RTN axons in Gad1 (–/–) rats (Figure 6). GAD2, a GAD isozyme, is also expressed in RTN neurons (28) and is likely responsible for the residual GABA synthesis. Therefore, GABAergic neurotransmission should remain functional at the inhibitory synapses on the TC neurons in Gad1 (–/–) rats. We explored the role of GAD1 in suppressing SWD within the RTN neuronal soma. Interestingly, synaptic GABAergic connections are rare among the RTN neurons (50), and tonic inhibition mediated through extrasynaptic GABA receptors is dominant in these neurons (51). We propose that the GABA produced by GAD1 is released in an autocrine/paracrine manner from the RTN neuronal soma to inhibit RTN neurons extrasynaptically. Previous studies have demonstrated extrasynaptic GABA release in the retina (52). Our results can be accounted for by non-synaptic GABAergic inhibition within RTN neurons (Figure 7A). The GABA produced by GAD1 is released from the RTN neuronal cell bodies and maintains the basal activity of these inhibitory neurons through mutual extrasynaptic GABAergic neurotransmission. This model accounts for the enhanced SWD phenotype in Gad1 (–/–) rats (Figure 7B). RTN neurons are tonically active (disinhibited) in these rats due to a deficiency of extrasynaptic GABA. However, GABA synthesis in the axons continues due to intact synaptic GAD2 and can even be elevated due to the compensatory increase in GAD2 expression in Gad1 (–/–) rats (28). Therefore, GABA release at the inhibitory synapses between the disinhibited RTN axon terminals and target TC neurons should be significantly increased. The increased activation of synaptic GABA receptors on TC neurons induces deep hyperpolarization in these neurons, followed by profound rebound bursting. This rebound bursting is involved in sustained SWD generation (19, 21). A further increase in synaptic GABA production after VPA treatment (Figure 7C) results in longer and deeper hyperpolarization of TC neurons, leading to the paradoxical exacerbation of SWD symptoms in Gad1 (–/–) rats.
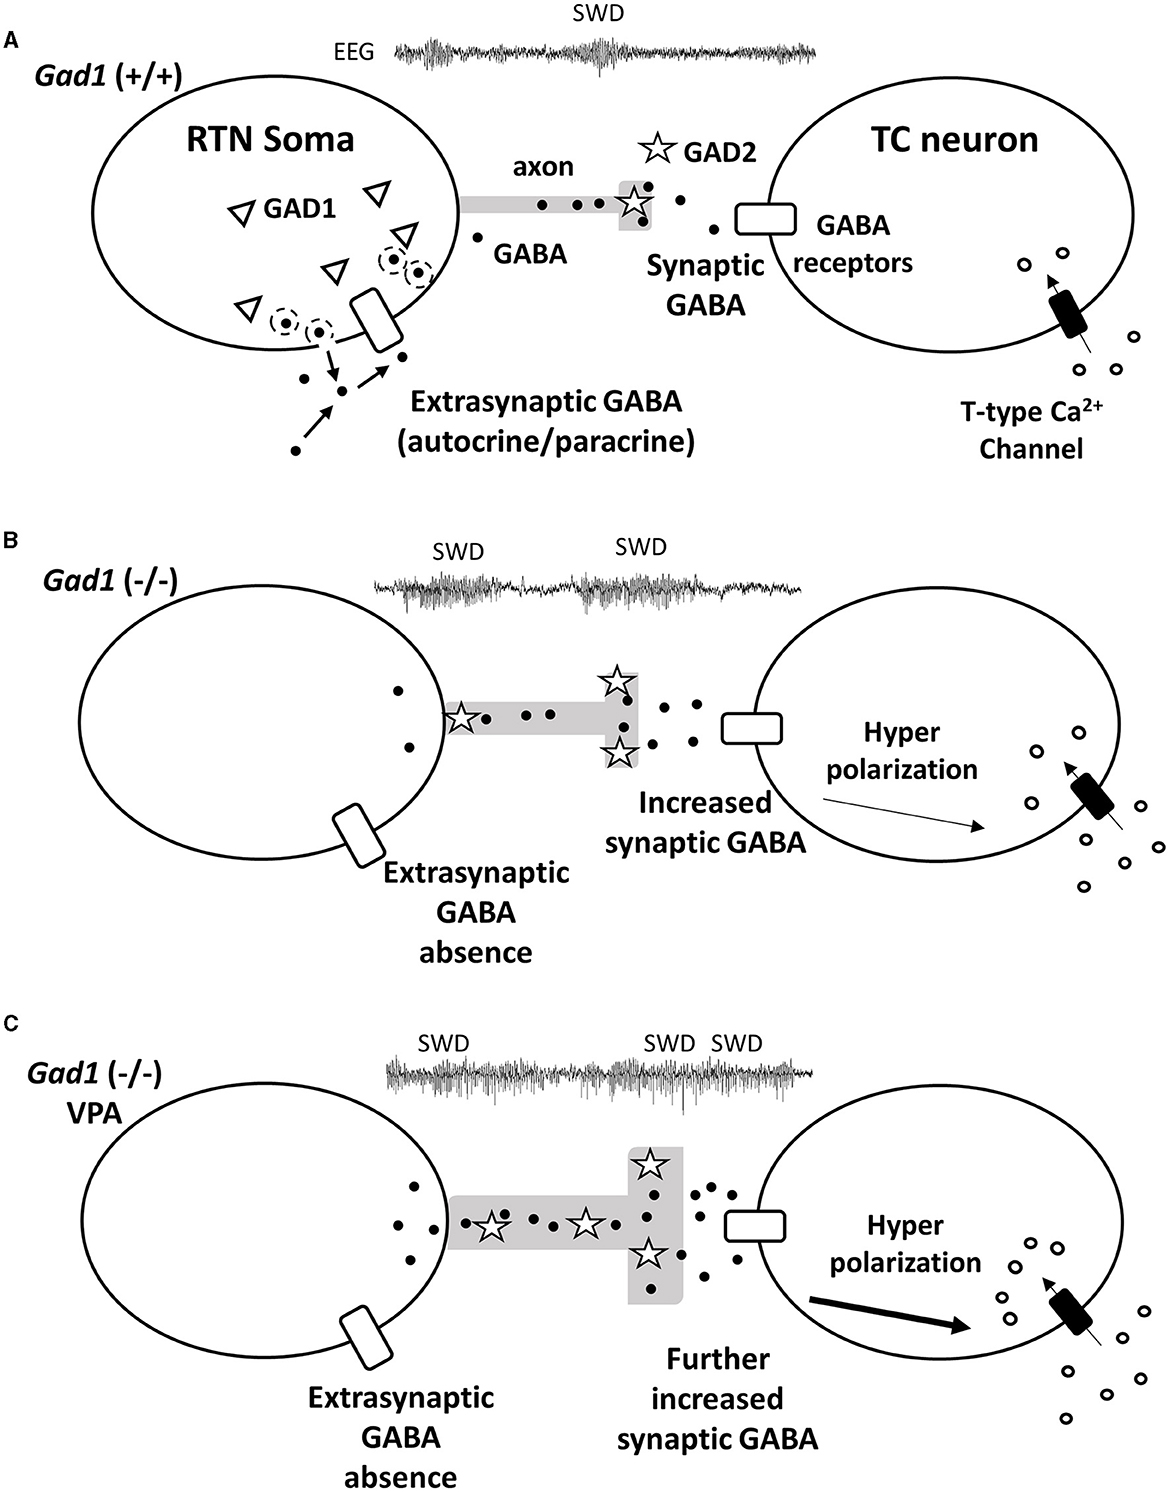
Figure 7. Hypothetical mechanism for GABA (black dots) signal transduction between reticular thalamic nucleus (RTN) neurons and thalamocortical (TC) relay neurons underlying SWD generation. (A) In the RTN neurons of Gad1 (+/+) rats, GABA generated by GAD1 (triangles) is released extrasynaptically. The extrasynaptic GABA acts on GABA receptors (white rectangles) localized on the cell body of the RTN neuron and regulates neural activity in an autocrine/paracrine manner. (B) RTN neurons of Gad1 (–/–) rats are disinhibited due to the lack of extrasynaptic GABA. Synaptic GABA synthesis is continued by intact GAD2 (stars) and is enhanced due to disinhibition. GABA binds to synaptic GABA receptors on TC neurons, resulting in deep membrane hyperpolarization and a rebound Ca2+ influx mediated by T-type Ca2+ channels. (C) In Gad1 (–/–) rats with VPA treatment, synaptic GABA synthesis and release are further enhanced, resulting in profound rebound bursting of TC neurons and exacerbation of the SWD phenotype.
In conclusion, we demonstrated that GAD1 deficiency in rats results in abundant SWDs in EEG data from an early age, comparable to other epilepsy-model rodents. Gad1 (–/–) rats exhibited SWDs resistant to interruption by buzzer tones more frequently than control rats; therefore, we suggest that true epileptic activity may have occurred, together with regular brain rhythms. We revealed two opposing roles for GABA: suppression and enhancement of SWD generation. Our interpretation of these results depends on the hypothetical extrasynaptic GABA produced by GAD1 from the RTN neuronal soma. Further molecular and neurophysiological experiments are necessary to confirm the role played by GAD1 in extrasynaptic GABAergic transduction in the RTN.
Data availability statement
The original contributions presented in the study are included in the article/Supplementary material, further inquiries can be directed to the corresponding author.
Ethics statement
The animal study was approved by Tohoku University Committee for Animal Research. The study was conducted in accordance with the local legislation and institutional requirements.
Author contributions
DL and TO designed the research, analyzed the data, and wrote the manuscript. DL conducted the experiments and collected the data. All authors contributed to the article and approved the submitted version.
Funding
This study was supported by JSPS KAKENHI Grants 16K06984 and 19K22464 (TO), 23K18159, 22H04922, and MEXT Grants 19H03337 (HM).
Acknowledgments
We thank Dr. Toshikazu Kakizaki for his helpful comments on the manuscript.
Conflict of interest
The authors declare that the research was conducted in the absence of any commercial or financial relationships that could be construed as a potential conflict of interest.
Publisher's note
All claims expressed in this article are solely those of the authors and do not necessarily represent those of their affiliated organizations, or those of the publisher, the editors and the reviewers. Any product that may be evaluated in this article, or claim that may be made by its manufacturer, is not guaranteed or endorsed by the publisher.
Supplementary material
The Supplementary Material for this article can be found online at: https://www.frontiersin.org/articles/10.3389/fneur.2023.1243301/full#supplementary-material
References
1. Blumenfeld H. Consciousness and epilepsy: why are patients with absence seizures absent? Prog Brain Res. (2005) 150:271–86. doi: 10.1016/S0079-6123(05)50020-7
2. Blumenfeld H. Epilepsy and the consciousness system: transient vegetative state? Neurol Clin. (2011) 29:801–23. doi: 10.1016/j.ncl.2011.07.014
3. Remi J, Vollmar C, Noachtar S. No response to acoustic stimuli: absence or akinetic seizure? Epilep Behav. (2011) 21:478–9. doi: 10.1016/j.yebeh.2011.06.008
4. Gilles van Luijtelaar TC. “Genetic models of absence epilepsy in the rat,” In: Models of Seizures and Epilepsy. (2006) p. 233-48.
5. Coenen AM, Van Luijtelaar EL. Genetic animal models for absence epilepsy: a review of the WAG/Rij strain of rats. Behav Genet. (2003) 33:635–55. doi: 10.1023/a:1026179013847
6. Danober L, Deransart C, Depaulis A, Vergnes M, Marescaux C. Pathophysiological mechanisms of genetic absence epilepsy in the rat. Prog Neurobiol. (1998) 55:27–57. doi: 10.1016/S0301-0082(97)00091-9
7. Shaw FZ. 7-12 Hz high-voltage rhythmic spike discharges in rats evaluated by antiepileptic drugs and flicker stimulation. J Neurophysiol. (2007) 97:238–47. doi: 10.1152/jn.00340.2006
8. Taylor JA, Reuter JD, Kubiak RA, Mufford TT, Booth CJ, Dudek FE, et al. Spontaneous recurrent absence seizure-like events in wild-caught rats. J Neurosci. (2019) 39:4829–41. doi: 10.1523/JNEUROSCI.1167-18.2019
9. Taylor JA, Rodgers KM, Bercum FM, Booth CJ, Dudek FE, Barth DS. Voluntary control of epileptiform spike-wave discharges in awake rats. J Neurosci. (2017) 37:5861–9. doi: 10.1523/JNEUROSCI.3235-16.2017
10. Saillet S, Gharbi S, Charvet G, Deransart C, Guillemaud R, Depaulis A, et al. Neural adaptation to responsive stimulation: a comparison of auditory and deep brain stimulation in a rat model of absence epilepsy. Brain Stimul. (2013) 6:241–7. doi: 10.1016/j.brs.2012.05.009
11. Drinkenburg WHIM, Schuurmans MLEJ, Coenen AML, Vossen JMH, van Luijtelaar ELJM. Ictal stimulus processing during spike-wave discharges in genetic epileptic rats. Behav Brain Res. (2003) 143:141–6. doi: 10.1016/S0166-4328(03)00031-7
12. Rodgers KM, Dudek FE, Barth DS. Progressive, seizure-like, spike-wave discharges are common in both injured and uninjured Sprague-Dawley rats: implications for the fluid percussion injury model of post-traumatic epilepsy. J Neurosci. (2015) 35:9194–204. doi: 10.1523/JNEUROSCI.0919-15.2015
13. Shaw FZ. Is spontaneous high-voltage rhythmic spike discharge in Long Evans rats an absence-like seizure activity? J Neurophysiol. (2004) 91:63–77. doi: 10.1152/jn.00487.2003
14. Wiest MC, Nicolelis MA. Behavioral detection of tactile stimuli during 7-12 Hz cortical oscillations in awake rats. Nat Neurosci. (2003) 6:913–4. doi: 10.1038/nn1107
15. Gorji A, Mittag C, Shahabi P, Seidenbecher T, Pape HC. Seizure-related activity of intralaminar thalamic neurons in a genetic model of absence epilepsy. Neurobiol Dis. (2011) 43:266–74. doi: 10.1016/j.nbd.2011.03.019
16. Hu B, Guo Y, Shi F, Zou X, Dong J, Pan L, et al. The generation mechanism of spike-and-slow wave discharges appearing on thalamic relay nuclei. Sci Rep. (2018) 8:4953. doi: 10.1038/s41598-018-23280-y
17. Meeren HK, Pijn JP, Van Luijtelaar EL, Coenen AM, Lopes da Silva FH. Cortical focus drives widespread corticothalamic networks during spontaneous absence seizures in rats. J Neurosci. (2002) 22:1480–95. doi: 10.1523/JNEUROSCI.22-04-01480.2002
18. Sitnikova E. Thalamo-cortical mechanisms of sleep spindles and spike-wave discharges in rat model of absence epilepsy (a review). Epilepsy Res. (2010) 89:17–26. doi: 10.1016/j.eplepsyres.2009.09.005
19. Fogerson PM, Huguenard JR. Tapping the brakes: cellular and synaptic mechanisms that regulate thalamic oscillations. Neuron. (2016) 92:687–704. doi: 10.1016/j.neuron.2016.10.024
20. Pinault D. The thalamic reticular nucleus: structure, function and concept. Brain Res Rev. (2004) 46:1–31. doi: 10.1016/j.brainresrev.2004.04.008
21. Leresche N, Lambert RC. GABA receptors and T-type Ca2+ channels crosstalk in thalamic networks. Neuropharmacology. (2018) 136:37–45. doi: 10.1016/j.neuropharm.2017.06.006
22. Wu H, Jin Y, Buddhala C, Osterhaus G, Cohen E, Jin H, et al. Role of glutamate decarboxylase (GAD) isoform, GAD65, in GABA synthesis and transport into synaptic vesicles-evidence from GAD65-knockout mice studies. Brain Res. (2007) 1154:80–3. doi: 10.1016/j.brainres.2007.04.008
23. Walls AB, Eyjolfsson EM, Smeland OB, Nilsen LH, Schousboe I, Schousboe A, et al. Knockout of GAD65 has major impact on synaptic GABA synthesized from astrocyte-derived glutamine. J Cereb Blood Flow Metab. (2011) 31:494–503. doi: 10.1038/jcbfm.2010.115
24. Stork O, Ji FY, Kaneko K, Stork S, Yoshinobu Y, Moriya T, et al. Postnatal development of a GABA deficit and disturbance of neural functions in mice lacking GAD65. Brain Res. (2000) 865:45–58. doi: 10.1016/S0006-8993(00)02206-X
25. Kakizaki T, Ohshiro T, Itakura M, Konno K, Watanabe M, Mushiake H, et al. Rats deficient in the GAD65 isoform exhibit epilepsy and premature lethality. FASEB J. (2021) 35:e21224. doi: 10.1096/fj.202001935R
26. Qi J, Kim M, Sanchez R, Ziaee SM, Kohtz JD, Koh S. Enhanced susceptibility to stress and seizures in GAD65 deficient mice. PLoS ONE. (2018) 13:e0191794. doi: 10.1371/journal.pone.0191794
27. Esclapez M TN, Kaufman DL, Tobin AJ, Houser CR. Comparative. Comparative localization of two forms of glutamic acid decarboxylase and their mRNAs in rat brain supports the concept of functional differences between the forms. Neuroscience. (1994) 14:834–1855. doi: 10.1523/JNEUROSCI.14-03-01834.1994
28. Panthi S, Lyons NMA, Leitch B. Impact of dysfunctional feed-forward inhibition on glutamate decarboxylase isoforms and gamma-aminobutyric acid transporters. Int J Mol Sci. (2021) 22:14. doi: 10.3390/ijms22147740
29. Fujihara K, Yamada K, Ichitani Y, Kakizaki T, Jiang W, Miyata S, et al. CRISPR/Cas9-engineered Gad1 elimination in rats leads to complex behavioral changes: implications for schizophrenia. Transl Psychiatry. (2020) 10:426. doi: 10.1038/s41398-020-01108-6
30. Kuki T, Ohshiro T, Ito S, Ji ZG, Fukazawa Y, Matsuzaka Y, et al. Frequency-dependent entrainment of neocortical slow oscillation to repeated optogenetic stimulation in the anesthetized rat. Neurosci Res. (2013) 75:35–45. doi: 10.1016/j.neures.2012.10.007
31. Loscher W. The pharmacokinetics of antiepileptic drugs in rats: consequences for maintaining effective drug levels during prolonged drug administration in rat models of epilepsy. Epilepsia. (2007) 48:1245–58. doi: 10.1111/j.1528-1167.2007.01093.x
32. Fang G, Xia Y, Zhang C, Liu T, Yao D. Optimized single electroencephalogram channel sleep staging in rats. Lab Anim. (2010) 44:312–22. doi: 10.1258/la.2010.009081
33. Vergnes M, Marescaux C, Boehrer A, Depaulis A. Are rats with genetic absence epilepsy behaviorally impaired? Epilepsy Res. (1991) 9:97–104. doi: 10.1016/0920-1211(91)90019-C
34. Watanabe Y, Takechi K, Fujiwara A, Kamei C. Effects of antiepileptics on behavioral and electroencephalographic seizure induced by pentetrazol in mice. J Pharmacol Sci. (2010) 112:282–9. doi: 10.1254/jphs.09225FP
35. Loscher W. Basic pharmacology of valproate—a review after 35 years of clinical use for the treatment of epilepsy. CNS Drugs. (2002) 16:669–94. doi: 10.2165/00023210-200216100-00003
36. Kawaguchi Y, Kondo S. Parvalbumin, somatostatin and cholecystokinin as chemical markers for specific GABAergic interneuron types in the rat frontal cortex. J Neurocytol. (2002) 31:277–87. doi: 10.1023/A:1024126110356
37. Kajita Y, Mushiake H. Heterogeneous GAD65 Expression in subtypes of GABAergic neurons across layers of the cerebral cortex and hippocampus. Front Behav Neurosci. (2021) 15:750869. doi: 10.3389/fnbeh.2021.750869
38. Steullet P, Cabungcal JH, Bukhari SA, Ardelt MI, Pantazopoulos H, Hamati F, et al. The thalamic reticular nucleus in schizophrenia and bipolar disorder: role of parvalbumin-expressing neuron networks and oxidative stress. Mol Psychiatry. (2018) 23:2057–65. doi: 10.1038/mp.2017.230
39. Williams SM, Goldman-Rakic PS, Leranth C. The synaptology of parvalbumin-immunoreactive neurons in the primate prefrontal cortex. J Comp Neurol. (1992) 320:353–69. doi: 10.1002/cne.903200307
40. Ling LL, Hughes LF, Caspary DM. Age-related loss of the GABA synthetic enzyme glutamic acid decarboxylase in rat primary auditory cortex. Neuroscience. (2005) 132:1103–13. doi: 10.1016/j.neuroscience.2004.12.043
41. Stanley DP, Shetty AK. Aging in the rat hippocampus is associated with widespread reductions in the number of glutamate decarboxylase-67 positive interneurons but not interneuron degeneration. J Neurochem. (2004) 89:204–16. doi: 10.1111/j.1471-4159.2004.02318.x
42. Li X, Ouyang G, Richards DA. Predictability analysis of absence seizures with permutation entropy. Epilepsy Res. (2007) 77:70–4. doi: 10.1016/j.eplepsyres.2007.08.002
43. Shaw FZ, Liao YF. Relation between activities of the cortex and vibrissae muscles during high-voltage rhythmic spike discharges in rats. J Neurophysiol. (2005) 93:2435–48. doi: 10.1152/jn.00999.2004
44. Nicolelis MA, Fanselow EE. Thalamocortical correction of thalamcortical optimization of tactile processing according to behavioral state. Nat Neurosci. (2002) 5:517–23. doi: 10.1038/nn0602-517
45. Shaw FZ, Liao YF, Chen RF, Huang YH, Lin RC. The zona incerta modulates spontaneous spike-wave discharges in the rat. J Neurophysiol. (2013) 109:2505–16. doi: 10.1152/jn.00750.2011
46. Guillery RW, Feig SL, Lozsadi DA. Paying attention to the thalamic reticular nucleus. Trends Neurosci. (1998) 21:28–32. doi: 10.1016/S0166-2236(97)01157-0
47. Clemente-Perez A, Makinson SR, Higashikubo B, Brovarney S, Cho FS, Urry A, et al. Distinct thalamic reticular cell types differentially modulate normal and pathological cortical rhythms. Cell Rep. (2017) 19:2130–42. doi: 10.1016/j.celrep.2017.05.044
48. Schofield CM, Kleiman-Weiner M, Rudolph U, Huguenard JR, A. gain in GABAA receptor synaptic strength in thalamus reduces oscillatory activity and absence seizures. Proc Natl Acad Sci U S A. (2009) 106:7630–5. doi: 10.1073/pnas.0811326106
49. Huntsman MM, Porcello DM, Homanics GE, DeLorey TM, Huguenard JR. Reciprocal inhibitory connections and network synchrony in the mammalian thalamus. Science. (1999) 283:541–3. doi: 10.1126/science.283.5401.541
50. Hou G, Smith AG, Zhang ZW. Lack of intrinsic GABAergic connections in the thalamic reticular nucleus of the mouse. J Neurosci. (2016) 36:7246–52. doi: 10.1523/JNEUROSCI.0607-16.2016
51. Crabtree JW, Lodge D, Bashir ZI, Isaac JT, GABAA. NMDA and mGlu2 receptors tonically regulate inhibition and excitation in the thalamic reticular nucleus. Eur J Neurosci. (2013) 37:850–9. doi: 10.1111/ejn.12098
Keywords: animal model of absence epilepsy, gamma-aminobutyric acid (GABA), glutamate decarboxylase (GAD), reticular thalamic nucleus, valproate
Citation: Liu D, Fujihara K, Yanagawa Y, Mushiake H and Ohshiro T (2023) Gad1 knock-out rats exhibit abundant spike-wave discharges in EEG, exacerbated with valproate treatment. Front. Neurol. 14:1243301. doi: 10.3389/fneur.2023.1243301
Received: 20 June 2023; Accepted: 29 August 2023;
Published: 26 September 2023.
Edited by:
Evgenia Sitnikova, Institute of Higher Nervous Activity and Neurophysiology (RAS), RussiaReviewed by:
Anna B. Volnova, Saint Petersburg State University, RussiaBen Duffy, Subtle Medical, Inc., United States
Copyright © 2023 Liu, Fujihara, Yanagawa, Mushiake and Ohshiro. This is an open-access article distributed under the terms of the Creative Commons Attribution License (CC BY). The use, distribution or reproduction in other forums is permitted, provided the original author(s) and the copyright owner(s) are credited and that the original publication in this journal is cited, in accordance with accepted academic practice. No use, distribution or reproduction is permitted which does not comply with these terms.
*Correspondence: Tomokazu Ohshiro, dG9zaGlyb0BtZWQudG9ob2t1LmFjLmpw