 Shadamu Yusuying
 Yao Lu3,4
 Shun Zhang
 Junjie Wang
 Juan Chen
 Daming Wang
 Jun Lu
 Peng Qi
- 1Department of Neurosurgery, Beijing Hospital, National Center of Gerontology, Institute of Geriatric Medicine, Chinese Academy of Medical Sciences and Peking Union Medical College, Beijing, China
- 2Graduate School of Peking Union Medical College, Beijing, China
- 3Beijing Hospital, National Center of Gerontology, Beijing Institute of Geriatrics, Beijing, China
- 4Department of Radiology, Beijing Hospital, National Center of Gerontology, Beijing, China
Background and aims: Secondary embolization (SE) during mechanical thrombectomy (MT) for cerebral large vessel occlusion (LVO) could reduce the anterior blood flow and worsen clinical outcomes. The current SE prediction tools have limited accuracy. In this study, we aimed to develop a nomogram to predict SE following MT for LVO based on clinical features and radiomics extracted from computed tomography (CT) images.
Materials and methods: A total of 61 patients with LVO stroke treated by MT at Beijing Hospital were included in this retrospective study, of whom 27 developed SE during the MT procedure. The patients were randomly divided (7:3) into training (n = 42) and testing (n = 19) cohorts. The thrombus radiomics features were extracted from the pre-interventional thin-slice CT images, and the conventional clinical and radiological indicators associated with SE were recorded. A support vector machine (SVM) learning model with 5-fold cross-verification was used to obtain the radiomics and clinical signatures. For both signatures, a prediction nomogram for SE was constructed. The signatures were then combined using the logistic regression analysis to construct a combined clinical radiomics nomogram.
Results: In the training cohort, the area under the receiver operating characteristic curve (AUC) of the nomograms was 0.963 for the combined model, 0.911 for the radiomics, and 0.891 for the clinical model. Following validation, the AUCs were 0.762 for the combined model, 0.714 for the radiomics model, and 0.637 for the clinical model. The combined clinical and radiomics nomogram had the best prediction accuracy in both the training and test cohort.
Conclusion: This nomogram could be used to optimize the surgical MT procedure for LVO based on the risk of developing SE.
Introduction
Mechanical thrombectomy (MT) has become a standard treatment for large vessel occlusion (LVO) stroke (1), with a successful recanalization rate ranging from 58.7% to 88% (2, 3). Complete recanalization still cannot be obtained in a small proportion of patients due to the formation of thrombus fragmentation and secondary embolization (SE) during the procedure. Thrombus fragmentation and SE can reduce the anterior blood flow and often require more complex surgical maneuvers to relieve the obstruction, increasing the risk of hemorrhagic transformation (4).
Generally, the stent retriever and contact aspiration remain the first-line thrombectomy strategies in clinical practice (5). However, both techniques can cause thrombus fragmentation (6, 7). These fragments must be curtailed to reduce the risk of emboli and micro-emboli obstructing the downstream cerebral vessels. Several new surgical devices and procedures, such as the balloon guide catheter (8), EmboTrap device (9), Lazarus funnel (10), stent retriever assisted vacuum-locked extraction (SAVE) (11), continuous aspiration before intracranial vascular embolectomy (CAPTIVE) (12), and balloon guide with large-bore distal access catheter with dual aspiration with the stent retriever (BADDASS) (13), can reduce the risk of developing SE and improve the complete recanalization. Nevertheless, their routine use has not been proven to be always necessary or cost-effective. Therefore, there is a need to identify patients at risk of developing SE to optimize the surgical approach for LVO stroke patients.
Clinical and radiological features, such as the use of anticoagulant therapy (14), pre-interventional systemic thrombolysis, and internal carotid artery (ICA) occlusion (15), may play an important role in the development of SE. Furthermore, previous studies have also identified various thrombus features, such as thrombus density and thrombus length, that might be related to the development of SE (16–18). However, these studies did not quantitatively analyze the wide range of features of the whole thrombus that can increase the risk of developing SE.
Radiomics can extract additional features from medical images (19–21) and is increasingly being used to improve the diagnosis and treatment of LVO (22–24). Previous studies used clot-based radiomics features to predict the optimal thrombectomy strategy for successful recanalization (25, 26) and the histological composition of the clot (27). However, to the best of our knowledge, no studies have been conducted investigating the use of CT-based radiomics to predict the risk of SE before MT for patients with LVO stroke. Therefore, in this study, we aimed to develop a prediction nomogram for SE following MT for LVO stroke patients based on clinical and CT-based radiomics features.
Materials and methods
Data acquisition
The patients with LVO stroke treated by MT at a Beijing Hospital between July 2017 and August 2022 were included in this retrospective study. The patients were included in the study if they had an extracranial or intracranial LVO involving either the anterior or posterior circulation; they underwent a one-stop CT examination that contains computed tomography angiogram (CTA) and computed tomography perfusion (CTP) on admission using the same scanner; they were treated with a thrombectomy strategy involving a stent retriever, contract aspiration, or both (Solumbra); they were with good preservation of the retrieved thrombi. Patients with incomplete CT or poor-quality images that could not be segmented, immeasurable thrombus location, and obvious vascular calcifications were excluded (Figure 1). Subsequently, the patients were randomly divided into training and testing cohorts, in a proportion of 7:3, and the overall distribution of the patient was maintained consistent (the proportion of SE and without SE is the same). The baseline characteristics of the patients, including age, gender, history of stroke, hypertension, hyperlipidemia, diabetes mellitus, atrial fibrillation, current use of anticoagulants, and smoking history; stroke subtype of Trial of Org 10172 in acute stroke treatment (28); conventional thrombus imaging markers, such as thrombus density and the vessel occlusion site, were extracted from the patient's medical records. In addition, the pre-interventional parameters, such as the administration of intravenous thrombolysis therapy, and interventional parameters, including the use of aspiration, stent retriever, Solumbra, and measurements, were also extracted. Figure 2 shows the detailed process of model building.
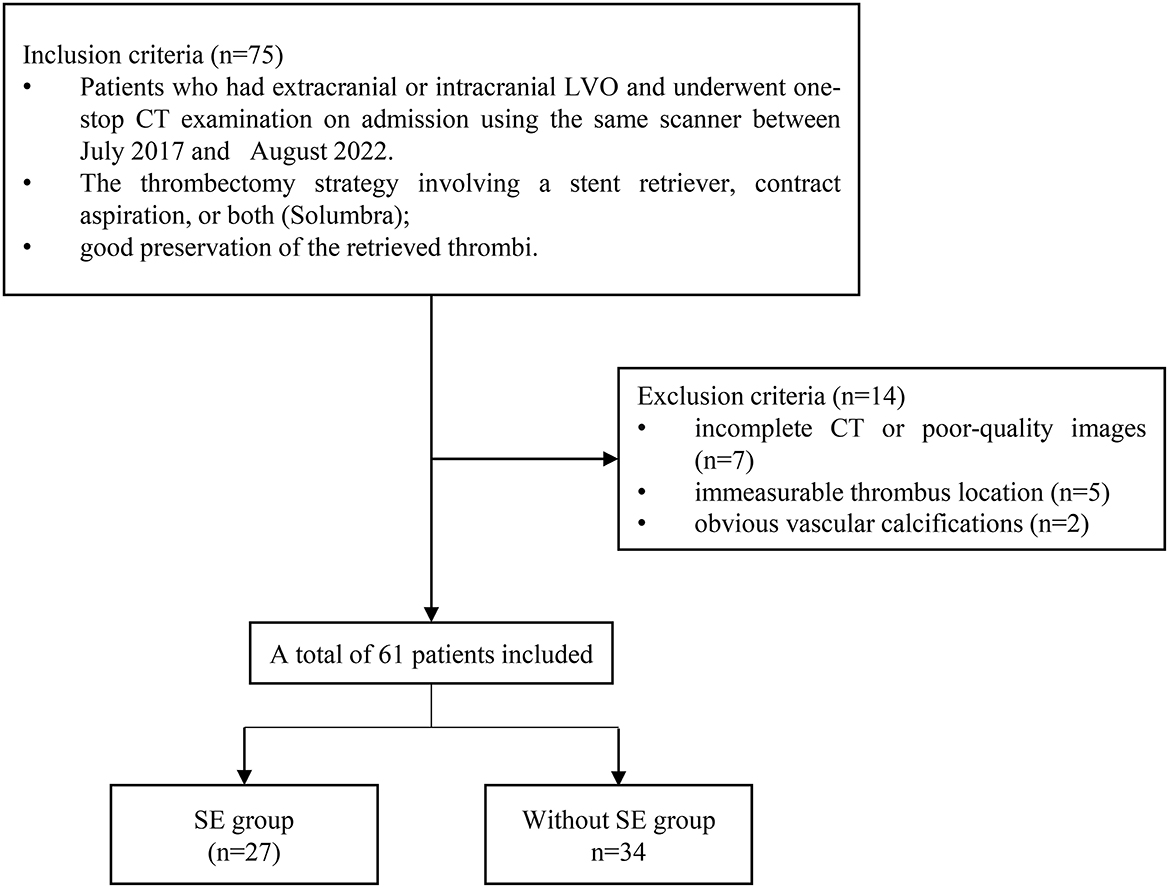
Figure 1. Flow chart for patient enrolment.
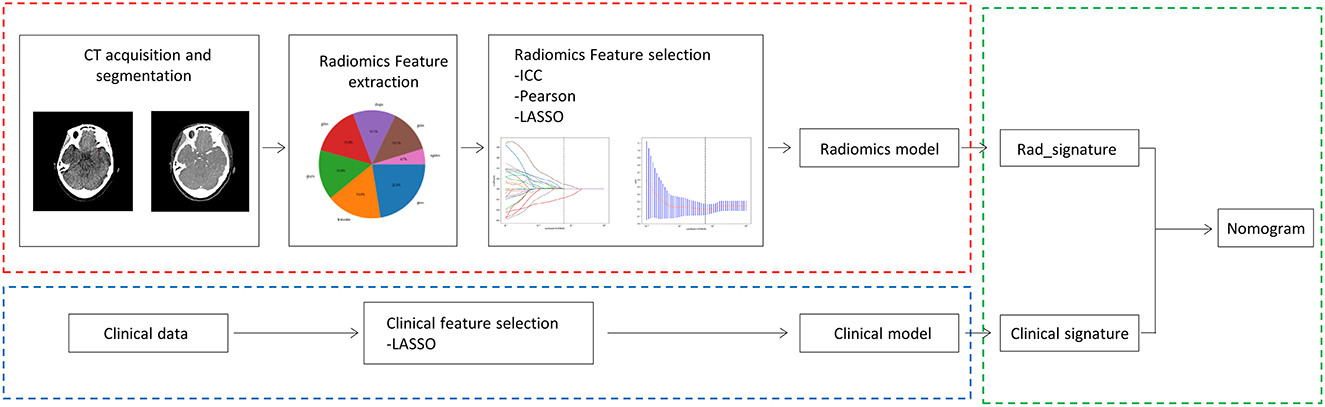
Figure 2. Overall workflow of this study.
Identification of SE
The images of the multiphase CTA acquired on admission and the digital cerebral angiography acquired during MT were reviewed. SE was identified according to the criteria published in our previous report (29). According to these criteria, patients are diagnosed with SE if they have a patent intracranial artery on the admission CTA, or pre-interventional angiography occluded during or after the MT procedure with visible embolisms in either the distal part of the primary occluded vessel or in a completely new location.
CT data acquisition
Whole brain dynamic volume CTA and CTP were obtained from the Aquilion ONE, Canon Medical Systems CT scanner with 320 × 0.5 mm detector rows and 160 mm coverage. Iopamidol (370 mg/ml iodine, Bracco, Italy) or iopromide (370 mg/ml iodine, Bayer, Germany) were injected using a high-pressure syringe via the elbow veins with a dose of 0.6 ml/kg, followed by a 30-ml bolus injection of saline. The CTP parameters were 80 kV, 100 mA, and 0.5-mm thickness reconstructed slices. The images were reconstructed using a hybrid-iterative reconstruction algorithm and 19 volume data packets, resulting in a total of 6,080 images for each patient.
Thrombus density measurements
The thrombus density was measured by positioning a region of interest (ROI) at ~2 mm behind the occlusion site, covering approximately half to two-thirds of the vascular area, and another ROI along with its corresponding position of the contralateral artery as explained in our previously reported method (30). The mean Hounsfield Unit (HU) value was recorded on the reconstructed NCCT images for the thrombus and contralateral artery. The relative HU (rHU) (thrombus density/contralateral artery density) and ΔHU (thrombus density-contralateral artery density) were calculated.
ROI segmentation
All NCCT and CTA images of 0.5 mm thickness were loaded into the 3D slicer software version 4.13.0 (https://www.slicer.org/; 3D Slicer image computing platform | 3D Slicer) and registered with ELASTIX [https://elastix.lumc.nl/; elastix (lumc.nl)]. Using the CTA images for guidance, two neuroradiologists (YL and JC) manually segmented the thrombus on each NCCT image (Figure 3). Intra-observer and inter-observer variability on the segmentation of ROI are presented as intra- and inter-class correlation coefficients (ICCs). The detailed process is as follows. In total, 30 cases were randomly selected, then YL and JC independently segmented ROIs during the same period to assess inter-observer agreement. After 1 month, YL repeated manually segmented ROIs again based on the randomly selected 30 cases to assess intra-observer agreement.
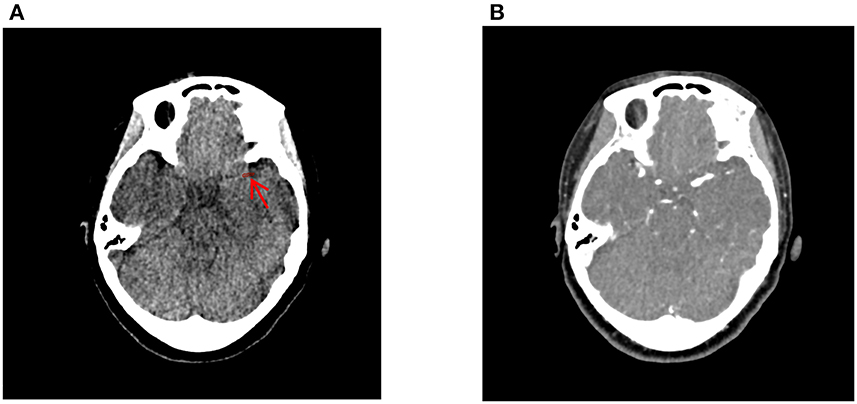
Figure 3. Delineation of the thrombus using the 3D-slicer software. The thrombus on the non-contrast computed tomography (A) was manually segmented using the computed tomography angiography image (B) as guidance. The red arrow indicates the location of the thrombus ROI.
Radiomics features extraction
Radiomics features were automatically extracted from the segmented thrombus using Python's Pyradiomics package (31) (https://pypi.org/project/pyradiomics/). From the NCCT images, 107 radiomics features were extracted. The extracted features were classified into first-order statistics, shape-based, gray-level co-occurrence matrix (GLCM), gray-level size zone matrix (GLSZM), gray-level run length matrix (GLRLM), neighboring gray tone difference matrix (NGTDM), and gray-level dependence matrix (GLDM). These radiomics features are described in detail on the PyRadiomics documentation site (http://pyradiomics.readthedocs.io). All of the above-mentioned features were standardized using the z-score.
Development of the radiomics signature
The feature dimensions were reduced to minimize radiomics bias, and the course of dimensionality was as follows. The features with a good inter- and intraobserver agreement defined as having an ICC above 0.75 were selected. The Pearson correlation coefficient was then calculated to identify the redundant features. Features with the largest mean absolute correlation or features that had a correlation coefficient of 0.9 or greater were removed. Finally, the least absolute shrinkage and selection operator (LASSO) regression model was used to identify the most useful features based on the training set. Depending on the regulation weight λ, LASSO shrinks all regression coefficients toward zero and sets the coefficients of many irrelevant features exactly to zero. The optimal λ was determined by calculating the minimum cross-validation error following a 10-fold cross-validation. An analysis of retained features with non-zero coefficients was performed to fit the regression models and construct the radiomics signatures. The radiomics score (Rad-score) was then calculated for each patient via a linear combination of the selected features weighted by their respective LASSO coefficients. For selecting the optimal radiomics model, different radiomics models were developed and tested, respectively, to predict the risk of SE based on the following eight machine learning classification algorithms: logistic regression (LR), support vector machine (SVM), K nearest neighbor (KNN), random forest (RF), extremely randomized trees (Extra-Trees), eXtreme Gradient Boosting (XGBoost), light gradient boosting machine (LightGBM), and multilayer perceptron (MLP). Then, the SVM machine learning model was identified which has the highest average area under the receiver operating characteristic (ROC) curve (AUC) on the testing set (Supplementary Figure 1). Therefore, the final selected features were inputted into the SVM machine learning models to construct the risk model. A 5-fold cross-verification was performed to obtain the final radiomics signature.
Development of the clinical signature
The process used to develop the radiomics signature was applied to the development of the clinical signature. The collected clinical features were included in a LASSO regression model to select the most valuable features in the training set, and the features with non-zero coefficients were retained. Then, the selected clinical features were inputted into the same SVM machine learning model to construct the risk model. The final clinical signatures were obtained by 5-fold cross-verification.
Development of the clinical radiomics nomogram
Logistic regression analysis was used to develop the clinical radiomics nomogram. The diagnostic accuracy of the clinical model, the radiomics model, and the clinical radiomics nomogram was assessed by calculating the AUC in both the training and testing cohorts. A decision curve analysis (DCA) was conducted to evaluate the clinical effectiveness of the clinical radiomics nomogram. The DCA involves calculating the net benefit of a threshold probability range across the training and testing cohorts.
Statistics analysis
Statistical analysis was performed using the IBM statistical package for social sciences software (SPSS) version 26.0. The Kolmogorov–Smirnov and Shapiro–Wilk tests were used to assess the normality of the evaluated variables. The continuous variables were reported as means ± standard deviations, and the categorical variables were reported as frequency counts and percentages. The chi-square or Fisher's exact tests were used to compare the categorical variables, while the Mann–Whitney U-tests or independent t-tests were used for the continuous variables. The Python 3.11.1 software (https://www.python.org) was used for feature extraction and screening and to build the models. The package “regression modeling strategies (rms [R])” was used to develop the nomogram. The metrics used to evaluate the performance of the three nomograms were AUC and 95% confidence interval (95%CI), accuracy, sensitivity, and specificity. The Delong test was used to estimate the differences in the AUC values between the three nomograms. For all statistical tests, a p-value below 0.05 was considered to be statistically significant.
Results
Patient characteristics
A total of 61 patients were eligible for the study. The training cohort consisted of 42 patients, and the testing cohorts consisted of 19 patients. The clinical and radiological features of all patients included in the study are summarized in Table 1. SE occurred in 27 of the 61 patients. Only large-artery atherosclerosis (p = 0.029) and stroke of other determined etiology (p = 0.045) differed significantly between the training and testing cohorts.
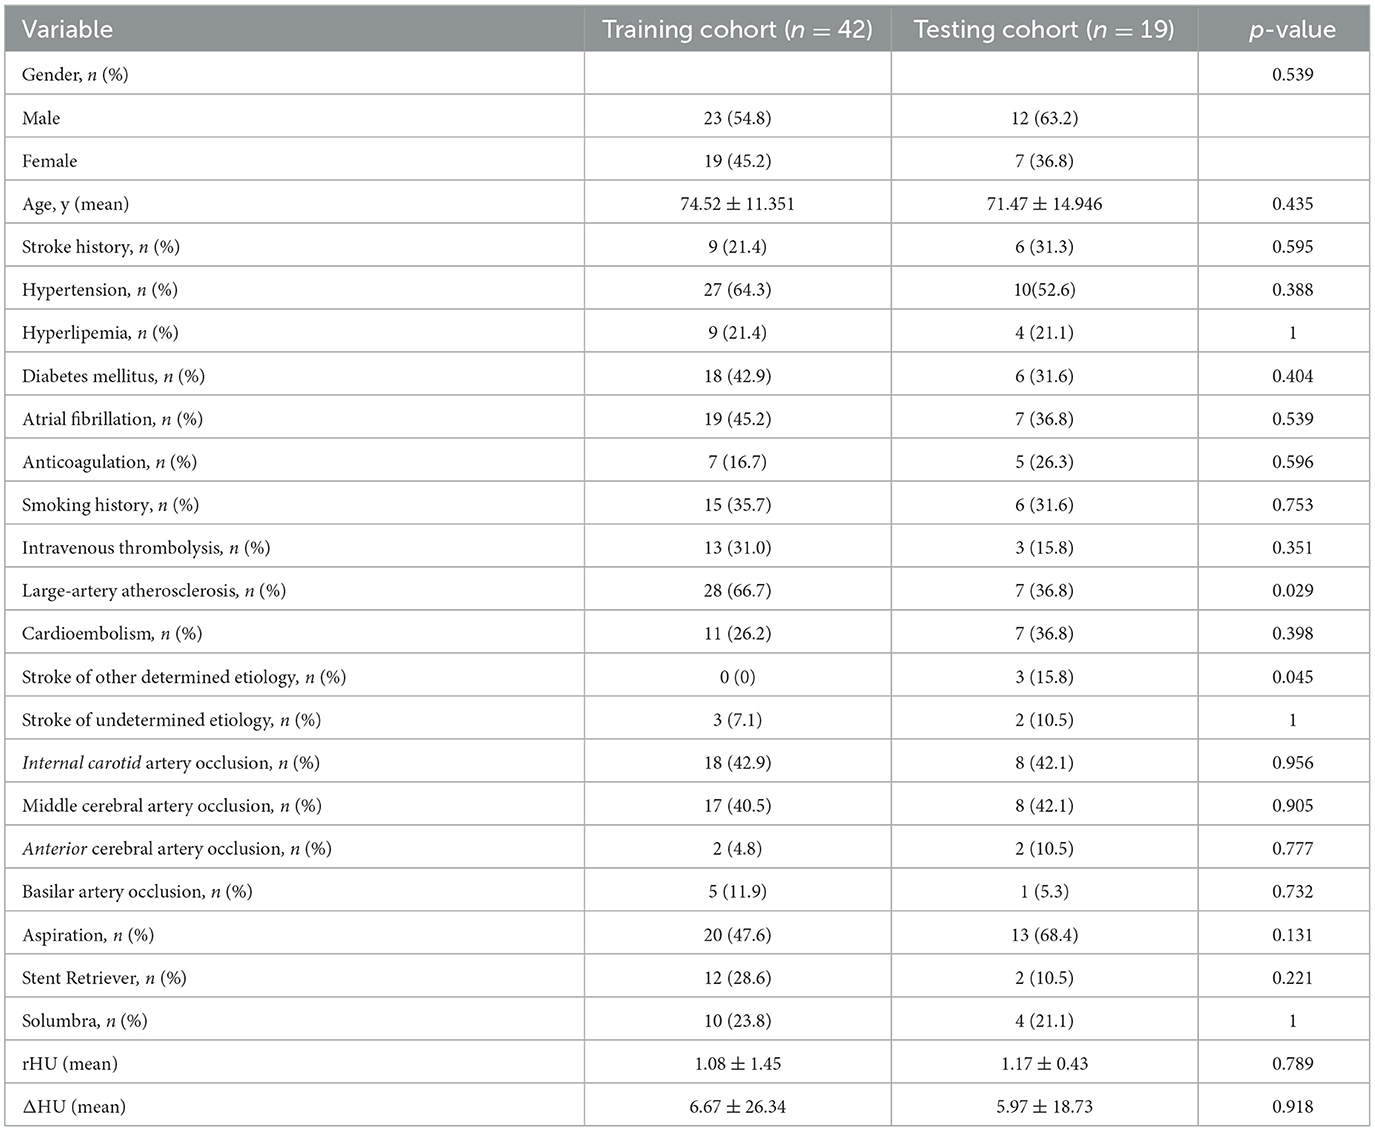
Table 1. Summary of the patients' characteristics in the training and test cohorts.
Screening and construction of the clinical signatures
After applying the LASSO feature screening, seven clinical features were selected, including smoking history, intravenous thrombolysis, internal carotid artery (ICA) occlusion, stent retriever, Solumbra, rHU, and cardioembolism. These features were used to establish the clinical signature.
Extraction, selection, and construction of the radiomics signatures
In total, 107 radiomics features were extracted from the reconstructed NCCT images, of which 64 features (ICC >0.75) were found to have satisfactory intra-observer and inter-observer reproducibility. Feature pairs with high correlations were omitted, leaving 27 features per patient for further selection. Finally, four relevant features were identified by LASSO analysis and used to construct the radiomics signature. The best regularization parameter was 0.059636 (Figures 4A, B). Figure 4C shows the selected features and weights. Based on these features, the Rad-score was calculated as follows:
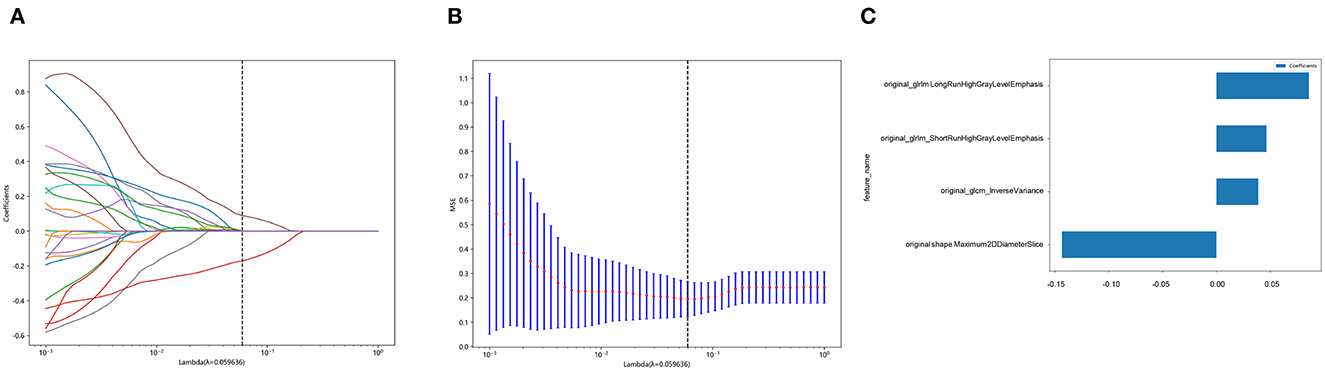
Figure 4. Selection of features based on the least absolute shrinkage and selection operator (LASSO) regression model. (A) shows a representative LASSO coefficient distribution map. The vertical dashed line indicates the value chosen after 10 rounds of cross-validation following the coefficient distribution map produced by the λ sequence. (B) LASSO model with the adjusted λ parameter following 10 rounds of cross-validation performed to pass the minimum standard. The optimal λ value was 0.059636 and is indicated by the vertical dashed line. (C) The selected radiomics features and their corresponding coefficients.
Rad-score = 0.3736422217481793 + 0.038825 × original_glcm_InverseVariance +0.085880 × original_glrlm_LongRunHighGrayLevelEmphasis + 0.046497 × original_glrlm_ShortRunHighGrayLevelEmphasis – 0.143520 × original_shape_Maximum2DDiameterSlice.
Establishment of the clinical radiomics nomogram
The combined clinical radiomics nomogram used to calculate the SE risk is illustrated in Figure 5. The risk of developing SE was calculated as follows. A score is first assigned to each influencing factor. Subsequently, all scores are summed up to calculate the total value. A line is then drawn from the total score to the risk axis to calculate the total SE risk. A higher total score is associated with greater SE risk.
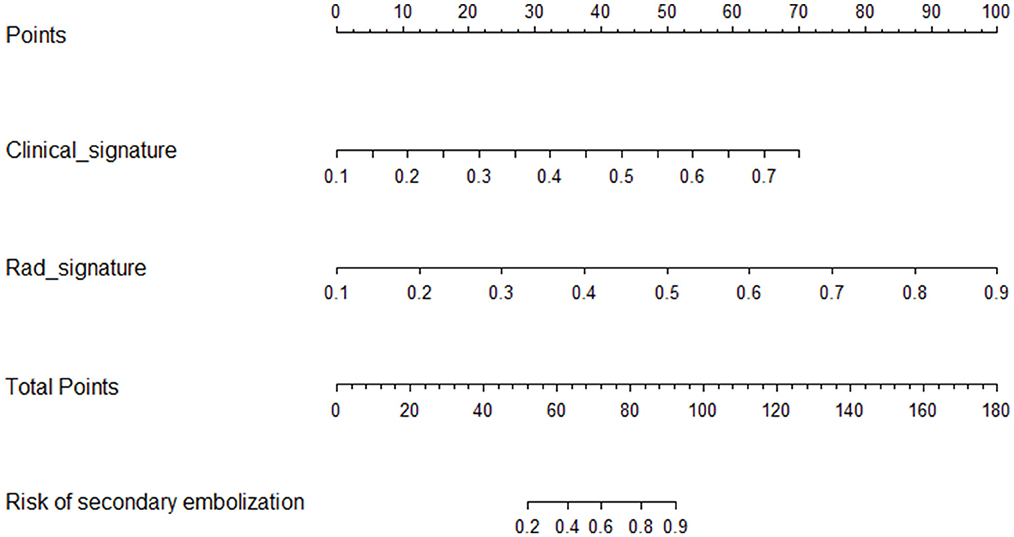
Figure 5. Clinical radiomics nomogram. The radiomics (Rad-signature) and clinical signatures values can be converted into quantitative values according to the corresponding points indicated on the axis. The total risk value was calculated by summing up the individual points. The final sum shown on the total points axis is then used to calculate the overall SE risk.
Performance of the clinical, radiomics, and combined nomograms
A summary of the diagnostic performance of the clinical, radiomics, and combined nomograms is provided in Table 2. In the training cohort, the AUCs of the nomograms were 0.963 for the combined model, 0.911 for the radiomics, and 0.891 for the clinical model (Figure 6A). Following validation, the AUCs were 0.762 for the combined model, 0.637 for the clinical model, and 0.714 for the radiomics model (Figure 6B).
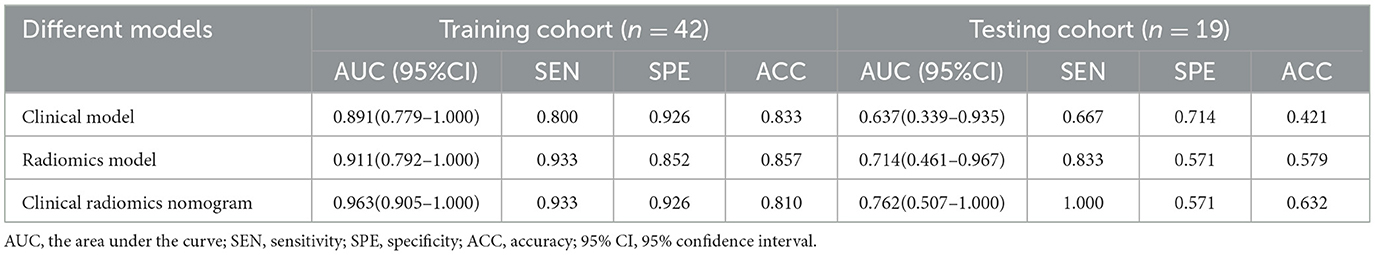
Table 2. Performance of the clinical model, radiomics model, and clinical radiomics model in the training and testing cohorts.
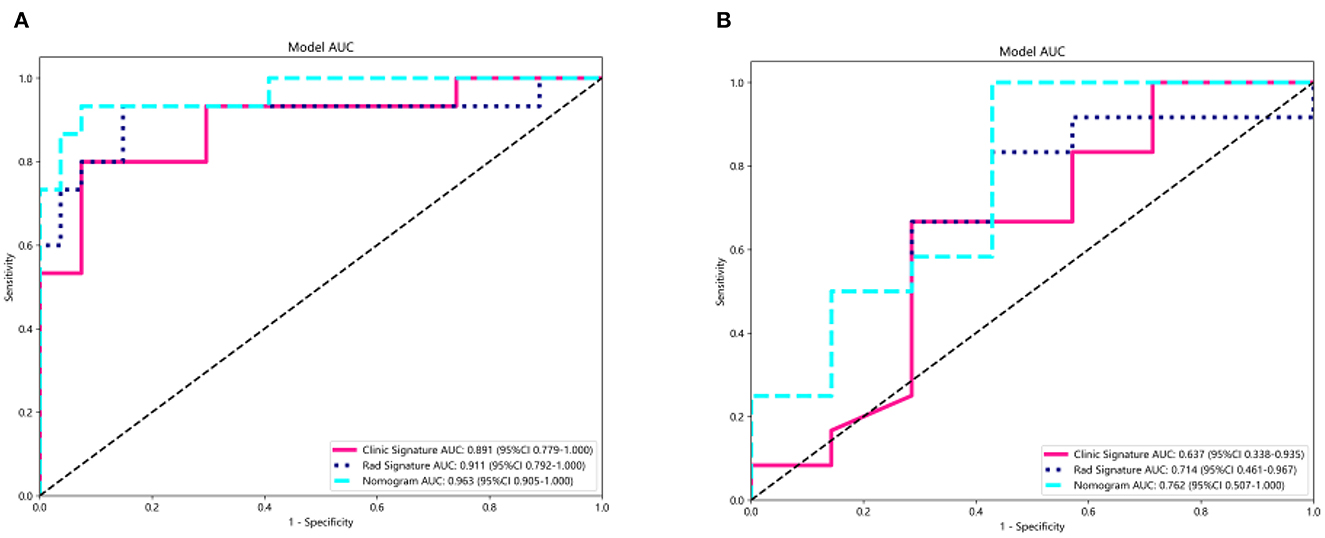
Figure 6. Receiver operating characteristic curves of the radiomics model, clinical model, and the clinical radiomics nomogram for predicting the SE risk for the training (A) and test (B) cohorts.
The Delong test results of the training set showed that no significant difference was noted between the AUC values of the nomogram and the clinical model (p-value = 0.191), the nomogram, and the radiomics model (p-value = 0.132). In the testing set, there were either no significant difference was noted between the AUC values of the nomogram and the clinical model (p-value = 0.266) or the nomogram and the radiomics model (p-value = 0.422).
The DCA for the three models for the training and testing cohorts are illustrated in Figures 7A, B. Compared with the clinical and radiomics nomograms, the DCA revealed that the combined nomogram added a net clinical prediction benefit for most of the threshold probabilities.
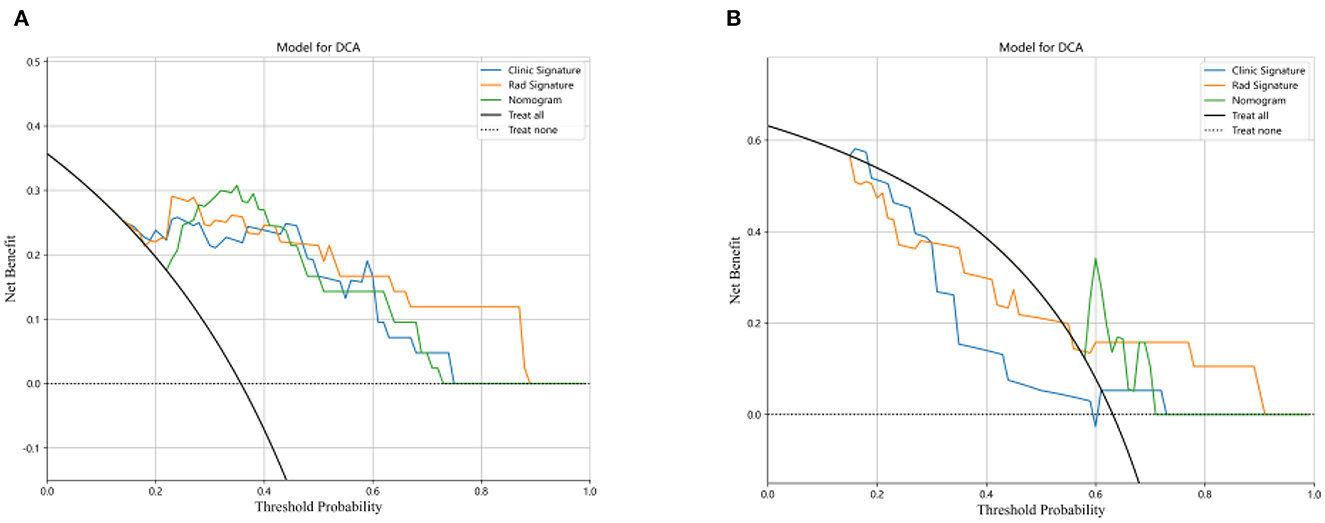
Figure 7. Decision curve analysis for the three models for the training (A) and test cohorts (B). The y-axis represents the net benefit, and the x-axis represents the threshold probability.
Discussion
Secondary embolization is a common complication of MT. Therefore, there is a need to identify patients at risk of developing SE to optimize the surgical procedure for stroke patients. Previous studies (14, 29) have attempted to develop risk prediction models based on clinical and thrombus features. However, the accuracy of these prediction models varied. To the best of our knowledge, this is the first study using both clinical variables and pre-interventional CT radiomics to identify patients at risk of developing SE.
Studies have shown that the risk of SE is affected by both clinical and thrombus features (32). The clinical information provides important information about the common risk factors, such as the thrombus location and surgical procedure for developing SE. Various studies also evaluated the impact of specific thrombus features on developing SE. In the study of Gengfan et al. (30), thrombus density was identified as an independent predictor of SE. However, this feature does not reflect the full heterogeneities of the different thrombi. The advantage of radiomics is that it can capture a wide range of thrombus features, thus better reflecting the heterogeneity of the thrombus than the conventional thrombus density feature. As a result, under the same SVM machine-learning model, our radiomics model achieved a better performance than the clinical model in both training and testing cohorts. However, the best performance was achieved by the combined clinical radiomics nomogram. The net clinical prediction benefit of the combined nomogram was further confirmed by DCA.
Apart from clinical and thrombus features, other studies used histological thrombus analysis to assess the risk of developing SE. Sporn et al. (18) found that SE occurred more frequently in thrombi with a small fraction of red blood cells. However, the results of the histopathology analysis can only be obtained after the MT procedure; therefore, this data cannot be used to optimize the surgical procedure. Radiomics analysis has the advantage of providing a fast, non-invasive method for neuro-interventional surgeons to objectively evaluate the risk of developing SE (33) before the surgical procedure rather than solely relying on their clinical judgment. The high-risk patients could then have their surgical technique optimized, which may eventually reduce the incidence of SE.
We acknowledge that our study has several limitations. The incidence of SE in our study was 43.3% higher than the 35.2% of patients reported by Gengfan et al. (29), possibly as a result of the selection bias introduced during the retrospective data collection process. The sample was small, and all the data were obtained from one institute. Therefore, a larger multicenter study is required to validate the prediction ability of the nomogram. The manual segmentation of the thrombus is prone to inter-observer and intra-observer variation due to which it can be easily affected by the reader's experience. Automatic or semiautomatic methods could improve the accuracy of the thrombus delineation. Moreover, our model was based on standard radiomics features. A deep learning approach could improve the model's prediction ability. Finally, the underlying biologic meaning of the radiomics features is difficult to interpret. Further studies are required to investigate the correlation between the thrombus histological and radiomics features.
Conclusion
This study proposed a new clinical radiomics model to predict the risk of SE. The radiomics model showed higher accuracy than the clinical model, and the clinical radiomics nomogram outperformed both the radiomics and clinical models. Our proposed clinical radiomics model could be used by neuro-interventional surgeons to predict the risk of SE, thus allowing them to optimize the surgical procedure according to the patient's needs.
Data availability statement
The raw data supporting the conclusions of this article will be made available by the authors, without undue reservation.
Ethics statement
The studies involving human participants were reviewed and approved by the Ethics Committee of Beijing Hospital (2019S-174). Written informed consent to participate in this study was provided by the patient/participants or patient/participants' legal guardian/next of kin.
Author contributions
SY, PQ, JL, and DW participated in the study design. JW, PQ, and JL were the surgeons and were in charge of patient care. SY and SZ participated in clinical data collection. YL and JC participated in imaging evaluation for AIS patients, delineation of the region of interest, and thrombus density measurement in images. SY, SZ, and JW participated in data analysis, data interpretation, and statistical analysis. SY drafted the manuscript. PQ, JL, and DW revised the manuscript. DW was responsible for the overall supervision. All the authors gave final approval for the version to be published.
Funding
This study was supported by Beijing Hospital Clinical Research 121 Project BJ-2021-234, the CMAS Innovation Fund for Medical Sciences (CIFMS) (Grant No. 2021-I2M-C&T-B-092), and the Capital's Funds for Health Improvement and Research (Grant No. 2020-4-4053).
Acknowledgments
We thank TopEdit (http://www.topeditsci.com) for its linguistic assistance during the preparation of this manuscript, and OnekeyAI and their developer's help in this scientific research study.
Conflict of interest
The authors declare that the research was conducted in the absence of any commercial or financial relationships that could be construed as a potential conflict of interest.
Publisher's note
All claims expressed in this article are solely those of the authors and do not necessarily represent those of their affiliated organizations, or those of the publisher, the editors and the reviewers. Any product that may be evaluated in this article, or claim that may be made by its manufacturer, is not guaranteed or endorsed by the publisher.
Supplementary material
The Supplementary Material for this article can be found online at: https://www.frontiersin.org/articles/10.3389/fneur.2023.1152730/full#supplementary-material
Supplementary Figure 1. Receiver operating characteristic (ROC) curve (AUC) on the testing set of eight machine learning classification algorithms. ROC, receiver operating characteristic; AUC, the area under the curve; LR, logistic regression; SVM, support vector machine; KNN, K nearest neighbor; RF, random forest; extra-trees, extremely randomized trees; XGBoost, eXtreme Gradient Boosting; LightGBM, light gradient boosting machine; MLP, multilayer perceptron.
References
1. Powers WJ, Rabinstein AA, Ackerson T, Adeoye OM, Bambakidis NC, Becker K, et al. 2018 guidelines for the early management of patients with acute ischemic stroke: a guideline for healthcare professionals from the American heart association/American stroke association. Stroke. (2018) 49:e46–e110. doi: 10.1161/STR.0000000000000158
2. Berkhemer OA, Fransen PSS, Beumer D, van den Berg LA, Lingsma HF, Yoo AJ, et al. A randomized trial of intraarterial treatment for acute ischemic stroke. N Engl J Med. (2015) 372:11–20. doi: 10.1056/NEJMoa1411587
3. Saver JL, Goyal M, Bonafe A, Diener H-C, Levy EI, Pereira VM, et al. Stent-retriever thrombectomy after intravenous t-PA vs. t-PA alone in stroke. N Engl J Med. (2015) 372:2285–95. doi: 10.1056/NEJMoa1415061
4. Todo A, Minaeian A, Sahni R, Chao KH. Incidence and outcome of procedural distal emboli using the Penumbra thrombectomy for acute stroke. J Neurointerv Surg. (2013) 5:135–8. doi: 10.1136/neurintsurg-2011-010216
5. Turk AS, Siddiqui A, Fifi JT, De Leacy RA, Fiorella DJ, Gu E, et al. Aspiration thrombectomy versus stent retriever thrombectomy as first-line approach for large vessel occlusion. (COMPASS): a multicentre, randomised, open label, blinded outcome, non-inferiority trial. Lancet. (2019) 393:998–1008. doi: 10.1016/S0140-6736(19)30297-1
6. Luraghi G, Bridio S, Lissoni V, Dubini G, Dwivedi A, McCarthy R, et al. Combined stent-retriever and aspiration intra-arterial thrombectomy performance for fragmentable blood clots: A proof-of-concept computational study. J Mech Behav Biomed Mater. (2022) 135:105462. doi: 10.1016/j.jmbbm.2022.105462
7. Mazur MD, Kilburg C, Park MS, Taussky P. Patterns and clinical impact of angiographically visible distal emboli during thrombectomy with solitaire for acute ischemic stroke. Neurosurgery. (2016) 78:242–50. doi: 10.1227/NEU.0000000000001135
8. Lee DH, Sung JH, Kim SU Yi HJ, Hong JT, Lee SW. Effective use of balloon guide catheters in reducing incidence of mechanical thrombectomy related distal embolization. Acta Neurochir. (2017) 159:1671–7. doi: 10.1007/s00701-017-3256-3
9. Bourcier R, Abed D, Piotin M, Redjem H, Ferré JC, Eugène F, et al. Multicenter initial experience with the EmboTrap device in acute anterior ischemic stroke. J Neuroradiol. (2018) 45:230–5. doi: 10.1016/j.neurad.2018.01.052
10. Fargen KM, Mocco J, Gobin YP. The Lazarus Funnel: a blinded prospective randomized in vitro trial of a novel CE-marked thrombectomy assist device. J Neurointerv Surg. (2016) 8:66–8. doi: 10.1136/neurintsurg-2014-011432
11. Maus V, Henkel S, Riabikin A, Riedel C, Behme D, Tsogkas I, et al. The SAVE technique : large-scale experience for treatment of intracranial large vessel occlusions. Clin Neuroradiol. (2019) 29:669–76. doi: 10.1007/s00062-018-0702-4
12. McTaggart RA, Tung EL, Yaghi S, Cutting SM, Hemendinger M, Gale HI, et al. Continuous aspiration prior to intracranial vascular embolectomy. (CAPTIVE): a technique which improves outcomes. J Neurointerv Surg. (2017) 9:1154–9. doi: 10.1136/neurintsurg-2016-012838
13. Ospel JM, Volny O, Jayaraman M, McTaggart R, Goyal M. Optimizing fast first pass complete reperfusion in acute ischemic stroke—The BADDASS approach. (BAlloon guide with large bore distal access catheter with dual aspiration with Stent-retriever as Standard approach). Expert Rev Med Dev. (2019) 16:955–63. doi: 10.1080/17434440.2019.1684263
14. Pilato F, Valente I, Calandrelli R, Alexandre A, Arena V, Dell'Aquila M, et al. Clot evaluation and distal embolization risk during mechanical thrombectomy in anterior circulation stroke. J Neurol Sci. (2022) 432:120087. doi: 10.1016/j.jns.2021.120087
15. Wong GJ, Yoo B, Liebeskind D, Baharvahdat H, Gornbein J, Jahan R, et al. Frequency, determinants, and outcomes of emboli to distal and new territories related to mechanical thrombectomy for acute ischemic stroke. Stroke. (2021) 52:2241–9. doi: 10.1161/STROKEAHA.120.033377
16. P Machi P, Jourdan F, Ambard D, Reynaud C, Lobotesis K, Sanchez M, et al. Experimental evaluation of stent retrievers' mechanical properties and effectiveness. J Neurointervent Surg. (2017) 9:221. doi: 10.1136/neurintsurg-2015-01221
17. Kaesmacher J, Boeckh-Behrens T, Simon S, Maegerlein C, Kleine JF, Zimmer C, et al. Risk of thrombus fragmentation during endovascular stroke treatment. AJNR Am J Neuroradiol. (2017) 38:991–8. doi: 10.3174/ajnr.A5105
18. Sporns PB, Hanning U, Schwindt W, Velasco A, Buerke B, Cnyrim C, et al. Ischemic stroke: histological thrombus composition and pre-interventional ct attenuation are associated with intervention time and rate of secondary embolism. Cerebrovasc Dis. (2017) 44:344–50. doi: 10.1159/000481578
19. Gillies RJ, Kinahan PE, Hricak H. Radiomics: Images are more than pictures, they are data. Radiology. (2016) 278:563–77. doi: 10.1148/radiol.2015151169
20. Lambin P, Rios-Velazquez E, Leijenaar R, Carvalho S, van Stiphout RGPM, Granton P, et al. Radiomics: extracting more information from medical images using advanced feature analysis. Eur J Cancer. (2012) 48:441–6. doi: 10.1016/j.ejca.2011.11.036
21. Aerts HJWL, Velazquez ER, Leijenaar RTH, Parmar C, Grossmann P, Carvalho S, et al. Decoding tumour phenotype by noninvasive imaging using a quantitative radiomics approach. Nat Commun. (2014) 5:4006. doi: 10.1038/ncomms5006
22. Avery EW, Behland J, Mak A, Haider SP, Zeevi T, Sanelli PC, et al. CT angiographic radiomics signature for risk stratification in anterior large vessel occlusion stroke. Neuroimage Clin. (2022) 34:103034. doi: 10.1016/j.nicl.2022.103034
23. Gerbasi A, Konduri P, Tolhuisen M, Cavalcante F, Rinkel L, Kappelhof M, et al. Prognostic value of combined radiomic features from follow-up DWI and T2-FLAIR in acute ischemic stroke. J Cardiovasc Dev Dis. (2022) 9:468. doi: 10.3390/jcdd9120468
24. Regenhardt RW, Bretzner M, Zanon Zotin MC, Bonkhoff AK, Etherton MR, Hong S, et al. Radiomic signature of DWI-FLAIR mismatch in large vessel occlusion stroke. J Neuroimaging. (2022) 32:63–7. doi: 10.1111/jon.12928
25. Hofmeister J, Bernava G, Rosi A, Vargas MI, Carrera E, Montet X, et al. Clot-based radiomics predict a mechanical thrombectomy strategy for successful recanalization in acute ischemic stroke. Stroke. (2020) 51:2488–94. doi: 10.1161/STROKEAHA.120.030334
26. Qiu W, Kuang H, Nair J, Assis Z, Najm M, McDougall C, et al. Radiomics-based intracranial thrombus features on CT and CTA predict recanalization with intravenous alteplase in patients with acute ischemic stroke. AJNR Am J Neuroradiol. (2019) 40:39–44. doi: 10.3174/ajnr.A5918
27. Hanning U, Sporns PB, Psychogios MN, Jeibmann A, Minnerup J, Gelderblom M, et al. Imaging-based prediction of histological clot composition from admission CT imaging. J Neurointerv Surg. (2021) 13:1053–7. doi: 10.1136/neurintsurg-2020-016774
28. Adams HP, Bendixen BH, Kappelle LJ, Biller J, Love BB, Gordon DL, et al. Classification of subtype of acute ischemic stroke. Definitions for use in a multicenter clinical trial. TOAST. Trial of Org 10172 in acute stroke treatment. Stroke. (1993) 24:35–41. doi: 10.1161/01.str.24.1.35
29. Ye G, Qi P, Chen K, Tan T, Cao R, Chen J, et al. Risk of secondary embolism events during mechanical thrombectomy for acute ischemic stroke: a single-center study based on histological analysis. Clin Neurol Neurosurg. (2020) 193:105749. doi: 10.1016/j.clineuro.2020.105749
30. Ye G, Cao R, Lu J, Qi P, Chen J, Wang D. CT-based higher thrombus density is associated with secondary embolism during mechanical thrombectomy: a preliminary observation. J Stroke Cerebrovasc Dis. (2019) 28:104311. doi: 10.1016/j.jstrokecerebrovasdis.2019.104311
31. van Griethuysen JJM, Fedorov A, Parmar C, Hosny A, Aucoin N, Narayan V, et al. Computational radiomics system to decode the radiographic phenotype. Cancer Res. (2017) 77:e104–7. doi: 10.1158/0008-5472.CAN-17-0339
32. Chueh JY, Puri AS, Wakhloo AK, Gounis MJ. Risk of distal embolization with stent retriever thrombectomy and ADAPT. J Neurointerv Surg. (2016) 8:197–202. doi: 10.1136/neurintsurg-2014-011491
Keywords: stroke, mechanical thrombectomy, thrombus, secondary embolization, radiomics, nomogram, large vessel occlusion
Citation: Yusuying S, Lu Y, Zhang S, Wang J, Chen J, Wang D, Lu J and Qi P (2023) CT-based thrombus radiomics nomogram for predicting secondary embolization during mechanical thrombectomy for large vessel occlusion. Front. Neurol. 14:1152730. doi: 10.3389/fneur.2023.1152730
Received: 28 January 2023; Accepted: 14 April 2023;
Published: 12 May 2023.
Edited by:
Xin Zhang, Southern Medical University, ChinaReviewed by:
Chubin Ou, Macquarie University, AustraliaXin Feng, Southern Medical University, China
Copyright © 2023 Yusuying, Lu, Zhang, Wang, Chen, Wang, Lu and Qi. This is an open-access article distributed under the terms of the Creative Commons Attribution License (CC BY). The use, distribution or reproduction in other forums is permitted, provided the original author(s) and the copyright owner(s) are credited and that the original publication in this journal is cited, in accordance with accepted academic practice. No use, distribution or reproduction is permitted which does not comply with these terms.
*Correspondence: Peng Qi, cWlwZW5nMjAwOEBhbGl5dW4uY29t; Jun Lu, bHVqdW4zNjU1QGJqaG1vaC5jbg==; Daming Wang, ZG0ud2FuZ0Biamhtb2guY24=