
95% of researchers rate our articles as excellent or good
Learn more about the work of our research integrity team to safeguard the quality of each article we publish.
Find out more
BRIEF RESEARCH REPORT article
Front. Neurol. , 16 March 2023
Sec. Stroke
Volume 14 - 2023 | https://doi.org/10.3389/fneur.2023.1114602
 Lotte Sondag1
 Axel Wolsink1Wilmar M. T. Jolink2Sabine Voigt3,4
 Marianne A. A. van Walderveen4
 Marieke J. H. Wermer3
 Catharina J. M. Klijn1†
 Floris H. B. M. Schreuder1*†
Background: Perihematomal edema (PHE) after spontaneous intracerebral hemorrhage (sICH) is associated with clinical deterioration, but the etiology of PHE development is only partly understood.
Aims: We aimed to investigate the association between systemic blood pressure (BP) variability (BPV) and formation of PHE.
Methods: From a multicenter prospective observational study, we selected patients with sICH who underwent 3T brain MRI within 21 days after sICH, and had at least 5 BP measurements available in the first week after sICH. Primary outcome was the association between coefficient of variation (CV) of systolic BP (SBP) and edema extension distance (EED) using multivariable linear regression, adjusting for age, sex, ICH volume and timing of the MRI. In addition, we investigated the associations of mean SBP, mean arterial pressure (MAP), their CVs with EED and absolute and relative PHE volume.
Results: We included 92 patients (mean age 64 years; 74% men; median ICH volume 16.8 mL (IQR 6.6–36.0), median PHE volume 22.5 mL (IQR 10.2–41.4). Median time between symptom onset and MRI was 6 days (IQR 4–11), median number of BP measurements was 25 (IQR 18–30). Log-transformed CV of SBP was not associated with EED (B = 0.050, 95%-CI −0.186 to 0.286, p = 0.673). Furthermore, we found no association between mean SBP, mean and CV of MAP and EED, nor between mean SBP, mean MAP or their CVs and absolute or relative PHE.
Discussion: Our results do not support a contributing role for BPV on PHE, suggesting mechanisms other than hydrostatic pressure such as inflammatory processes, may play a more important role.
Spontaneous intracerebral hemorrhage (sICH) is a devastating disease with a poor outcome (1, 2). Besides direct injury through compression and disruption of brain parenchyma (3), sICH elicits a secondary response that starts within hours after sICH and causes secondary brain injury (SBI) (4). Perihematomal edema (PHE), especially peak PHE, is considered an important imaging marker for SBI (4, 5), is associated with clinical deterioration and possibly also with poor functional outcome (5, 6). PHE grows fastest in the first 72 h, gradually increases up to 2–3 weeks (5, 7–10), after which it gradually decreases until it resolves after ~1–2 months (5).
Formation of PHE is driven by osmotic and hydrostatic pressure gradients [difference between intracranial pressure and systemic blood pressure (BP)], reflecting the blood brain barrier (BBB) permeability (5). Not only high systemic BP but also greater systemic BP variability (BPV) may increase the development of PHE in areas of impaired autoregulation (11).
Various measures of PHE are available, including absolute and relative PHE volume (aPHE and rPHE), and the edema extension distance (EED = radius of a sphere that equals the volume of PHE and ICH together – the radius of a sphere that equals ICH volume) (12). It is suggested that EED is independent of hematoma volume and therefore the most appropriate proxy measure of SBI (12). Targeting PHE could possibly improve outcome in patients with sICH. Treatment of high BP could theoretically ameliorate the formation of PHE, based on a decrease of the hydrostatic pressure gradient (13). Earlier work investigating the relationship between BP and formation of PHE showed conflicting results (4, 5, 14–21), and the effect of early treatment of elevated BP on functional outcome after sICH is controversial (22, 23). It was suggested that high BPV rather than high BP alone, contributes to the formation of PHE (15) and may worsen clinical outcome (11, 13, 17, 24–28). No previous study investigated the association between BPV and EED.
We aimed to investigate the association of BPV, measured by coefficient of variation (CV) of systolic BP (SBP) within the first week after sICH, with the formation of PHE measured by EED up to 21 days after sICH. Second we assessed the associations of mean SBP, CV of mean arterial pressure (MAP) and mean MAP within the first week after sICH with EED. Third we investigated the associations of these BP measurements with aPHE and rPHE volume.
This study was part of the Finding ETiology of spontaneous Cerebral Hemorrhage (FETCH) study, a prospective multicenter study in adults with CT-confirmed sICH that aimed to characterize underlying pathophysiological mechanisms. Patients were recruited between October 2013 and December 2018 in three Dutch hospitals [Radboudumc Nijmegen, University Medical Center Utrecht (UMCU) and Leiden University Medical Center (LUMC)]. The FETCH study was approved by the Medical Ethics Review Committee of the UMCU (NL43286.041.13; METC 13/270D). We obtained written informed consent from all patients. We conformed to ICMJE Recommendations.
For the current study, we included patients who underwent 3 tesla (T) brain magnetic resonance imaging (MRI) within 21 days after symptom onset and had at least five measurements of BP registered within the first week after symptom onset. We collected baseline characteristics including date and time of symptom onset, Glasgow Coma Scale (GCS) score and National Institute of Health Stroke Scale (NIHSS) score on admission, systolic and diastolic BP measurements (SBP and DBP) during admission (preferably the following BP measurements were recorded: first BP on admission; every 4 h in the first 48 h; every 6 h from days 3 to 7), past medical history [hypertension, diabetes mellitus, hypercholesterolemia, coronary artery disease, previous ICH, ischemic stroke, transient ischemic attack (TIA) or atrial fibrillation/flutter], vascular risk factors (use of tobacco, and alcohol) and previous medication (oral anticoagulant drugs, platelet inhibitors, antihypertensive drugs, lipid lowering drugs). BP measurements were collected as part of routine care and were performed by inflatable cuff measurements at the brachial artery. Definitions can be found in the Supplementary material.
3 T brain MRI [Siemens Healthineers, Erlangen, Germany (Radboudumc); Philips Healthcare, Best, The Netherlands (LUMC, UMCU)] was performed using a standard protocol, amongst which Fluid Attenuated Inversion Recovery (FLAIR), and blood sensitive sequences (T2* in Radboudumc and UMCU; susceptibility-weighted imaging (SWI) in LUMC) (29).
One trained reader (AW) manually segmented ICH and PHE volumes on axial FLAIR sequences using ITK-SNAP 3.8 (http://www.itksnap.org/) (30), blinded for baseline characteristics and BP measurements. A second trained reader (LS) segmented ICH and PHE volumes of 10 patients, blinded for baseline characteristics, BP measurements and the results from the first reader, to determine inter-observer agreement using the intraclass correlation coefficient (ICC). The Supplementary material describes the segmentation protocol. We used Matlab 2014b to calculate absolute ICH volumes and PHE volumes based on the number of voxels and the voxel size in three directions. Intraventricular hemorrhage extension (IVH) was classified absent or present. We classified ICH location as deep (thalamus, basal ganglia), lobar (cerebral lobes) or infratentorial (brainstem or cerebellum).
The primary outcome parameter was EED, calculated as (12). Secondary, we assessed aPHE, and rPHE ().
We calculated means, standard deviations (SD) and CV of SBP, and MAP (= using all BP values from the first week after symptom onset. We verified our data for normal distribution, and in case of skewed distribution performed log-transformation. We primarily investigated the association between CV of SBP and EED using univariable linear regression. Next, multivariable linear regression was used to adjust for prespecified covariables age, sex, ICH-volume and interval between symptom onset and MRI, as these are known to influence the development of SBI (5, 31) and PHE (5, 10, 21, 32–34). We performed a sensitivity analysis including all BP measurements from the first 48 h after onset only. We performed a subgroup analysis for deep, lobar and infratentorial sICH separately. Second, we repeated univariable and multivariable linear regression, now assessing associations between mean SBP and mean and CV of MAP as independent determinants and EED. Third, we assessed the associations between mean and CV of SBP, mean and CV of MAP and aPHE or rPHE through univariable linear regression. We used SPSS version 25.0 (IBM Corp, Armonk, New York, USA) to perform all statistical analyses.
From the 153 patients in the FETCH study with a 3 T MRI, 94 patients had an MRI of good quality that was performed within 21 days. We finally included 92 patients (mean age 64 years) who had at least five BP measurements available within the first week. Baseline characteristics of included and excluded patients were similar (Supplementary Table 1). Baseline characteristics of included patients are summarized in Table 1. Median number of BP measurements was 25 (IQR 18, 30) in the first week, and 12 (IQR 9, 13) in the first 48 h. Median interval between symptom onset and MRI was 6 days (IQR 4, 11). In 18 patients (20%) MRI was performed within 72 h and in 55 patients (60%) within 7 days of symptom onset. Agreement in ICH and PHE volume measurements on MRI between the two readers was excellent, with an ICC of 0.95 for ICH volume and 0.99 for PHE volume. MRI findings are summarized in Table 3. In five patients, MRI showed more than 1 ICH. In these patients we segmented the largest ICH and its surrounding PHE.
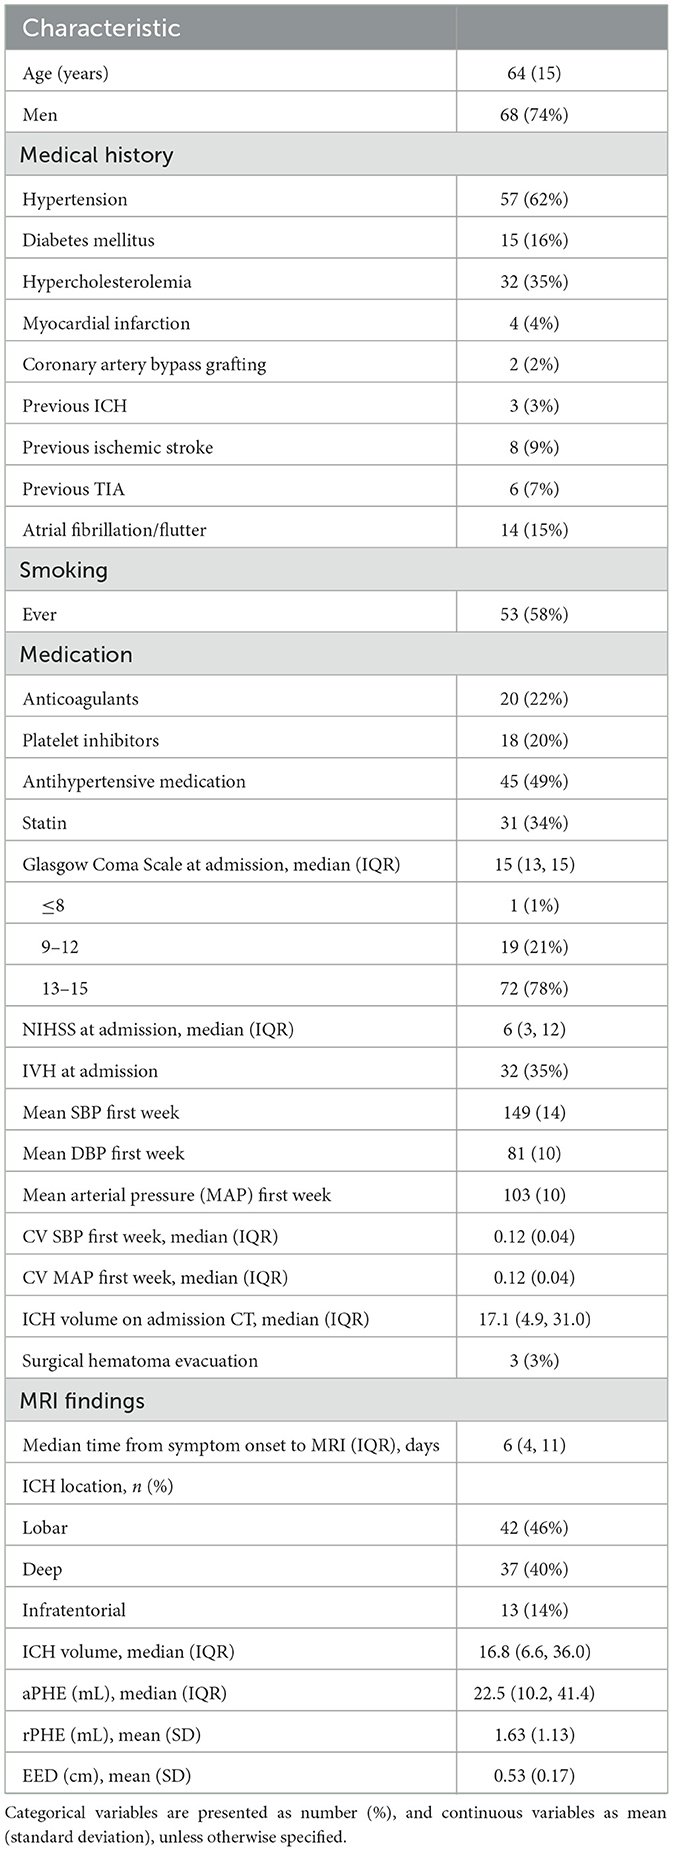
Table 1. Baseline characteristics and MRI findings of included patients (n = 92).
We found no association between log-transformed CV of SBP in the first week with EED in univariable regression analysis (B 0.056, 95% CI −0.002 to 0.003, p = 0.677; Table 2; Figure 1). This result remained unchanged after adjusting for age, sex, ICH volume on MRI and time between symptom onset and MRI (Table 3). Results remained unchanged in our sensitivity analysis including the BP measurements from the first 48 h after symptom onset only (Supplementary Table 2). In the subgroup analysis, both lobar, deep and infratentorial sICH did not show an association between CV of SBP in the first week and EED (Supplementary Table 3). Secondary analyses, we did not find an association between mean SBP, mean MAP or (log transformed) CV of MAP and EED in univariable and stepwise multivariable linear regression models (Tables 2, 3). Furthermore, we did not find an association between all BP measures and (log-transformed) aPHE or rPHE in univariable linear regression (Table 2).
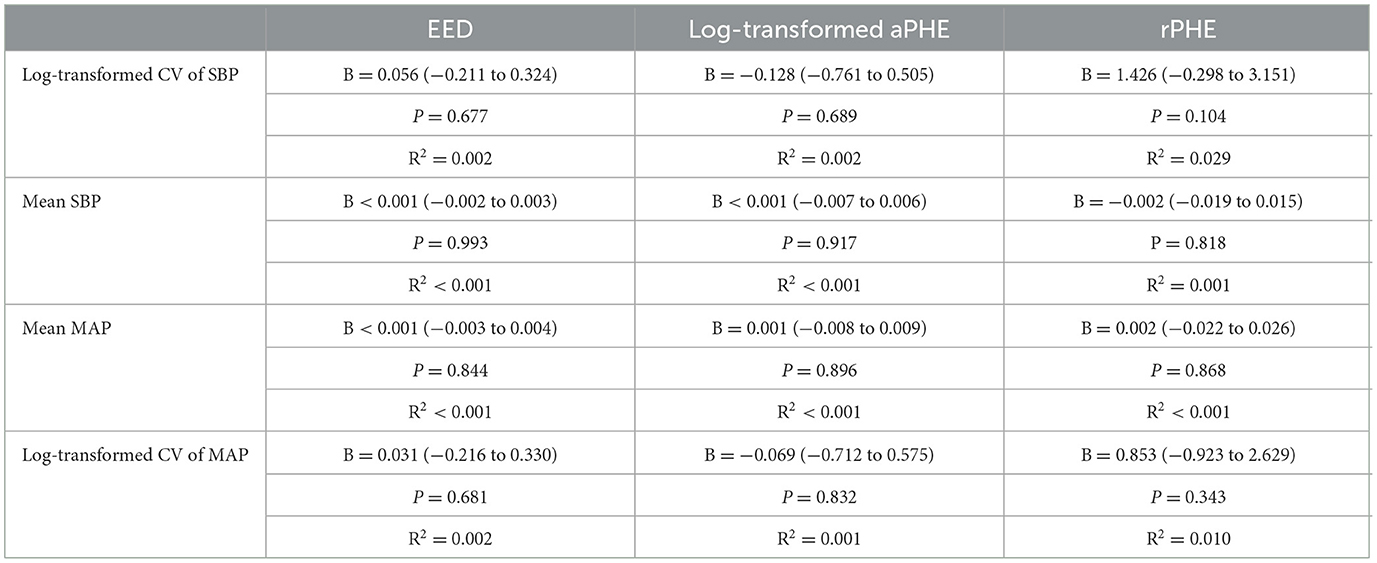
Table 2. Univariable regression analyses for the influence of different BP measurements in the first week on PHE as measured by EED, aPHE, and rPHE on 3T MRI.
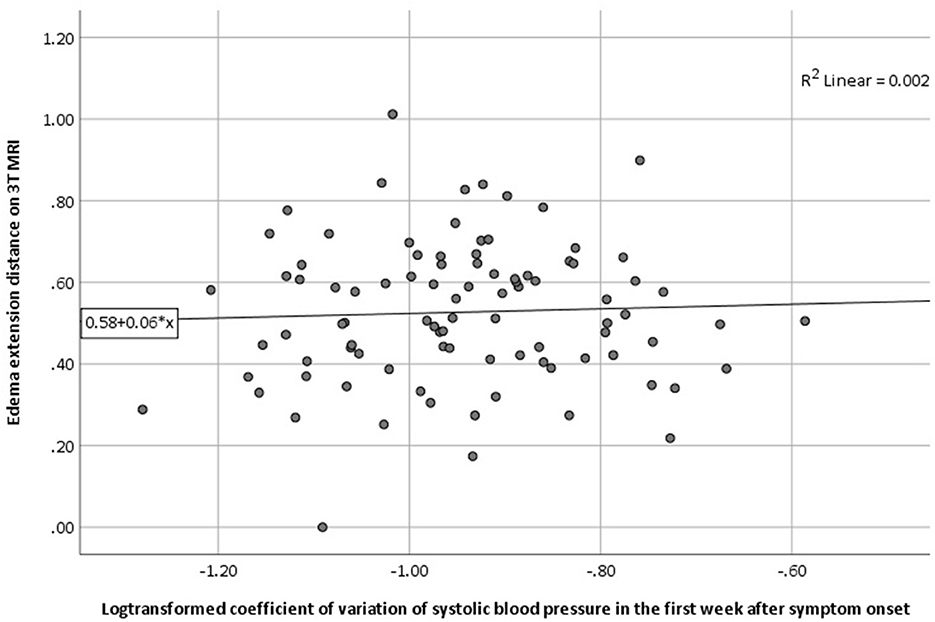
Figure 1. Association between (log-transformed) CV of SBP in the first week and the presence of PHE as measured by EED on 3T MRI (univariable regression analysis). 3T MRI, 3 tesla magnetic resonance imaging; CV, coefficient of variation; EED, edema extension distance; PHE, perihematomal edema; SBP, systolic blood pressure.
In patients with sICH, we found no association between variability of SBP (measured as CV of SBP) in the first week after symptom onset and EED on 3 T MRI within 21 days after symptom onset. Neither was there an association between mean SBP, mean MAP or CV of MAP and EED. Furthermore, we found no association between CV of SBP, mean SBP, mean MAP or CV of MAP and aPHE or rPHE.
BPV is associated with a higher risk of cardiovascular events and death due to cardiovascular diseases (28). Although the association between larger BPV and worse outcome after ischemic stroke and ICH has been established (11), few previous studies investigated the association between BPV and PHE (15, 17). A post-hoc analysis of the ATACH-2 trial (a randomized controlled trial investigating the effect of BP reduction < 140 vs. < 180 mmHg within 4.5 h after symptom onset) found a consistent association between different measures of BPV (SD, CV, average real variability, successive variation, residual SD) with clinical outcome in 913 participants, but not with absolute PHE growth on CT at 24 h as compared to baseline CT (17). A second study, that investigated 38 patients with sICH within 72 h after symptom onset, found an association of variability of MAP and minimal MAP in the first 72 h after symptom onset with rPHE on CT or MRI at 24 and 48–72 h, but not for mean MAP or maximal MAP (15). The absence of an association found in our study, could be partly explained by the difference in the modality and timing of PHE measurement. Instead of CT, we used MRI in all participants, which is a presumed to be a superior modality to delineate PHE (35). Additionally, most of our participants underwent MRI > 72 h after symptom onset, which corresponds better with the expected peak of PHE (5, 7, 9, 10). To take the influence of timing of MRI into account we have included this variable in the multivariable analysis, which did not alter our results. Furthermore, we measured EED, a more appropriate proxy measure of SBI compared to aPHE and rPHE (12). Another possible explanation for the different results is the absence of a standardized method to calculate BPV. Our study investigated mean and CV of SBP as well as mean and CV of MAP from all BP measurements within the first 7 days (and separately in the first 48 h). A previous study calculated hour-by-hour MAP-variance, mean MAP, maximal MAP and minimal MAP of all BP measurements performed, at least up until 72 h (15). The ATACH-2 trial calculated five measures of BPV (SD, CV, average real variability, successive variation, residual SD) from the highest and lowest SBP of every hour in the first 24 h, and the two highest and lowest SBP at days 2, 3, and 7 (17). However, in our sensitivity analyses including BP measurements from the first 48 h, results remained unchanged. Last, in our study we included a large proportion of patients that used oral anticoagulation (22 vs. 0% in the two previous studies), which may have influenced the development of PHE as thrombin (which is influenced by oral anticoagulation) can directly induce BBB-disruption and PHE development (36).
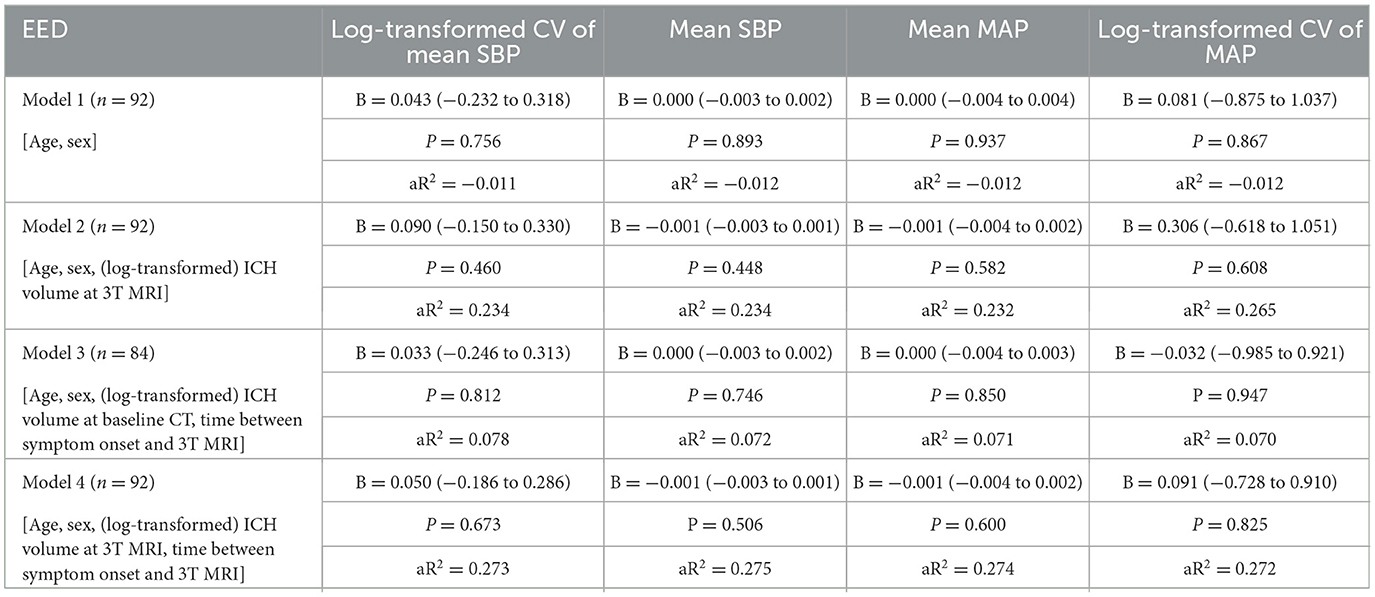
Table 3. Multivariable regression analyses for the influence of different BP measurements in the first week on the EED on 3T MRI.
Our study has several strengths. First, we selected patients from a prospective multicenter cohort study in which 3 T MRI was performed in all patients, irrespective of clinical deterioration. Second, we studied PHE on 3 T MRI up to 21 days, which is closer to represent peak PHE than studies that investigated PHE at 24 or 72 h. Third, we analyzed PHE on MRI scans, which is superior to CT for the investigation of PHE, which is illustrated by our excellent inter-observer reproducibility (37). Our study also has some limitations. The sample size was relatively small, which may have resulted in limited power. Two previous small studies reported discordant results regarding the association the between BPV and rPHE; these inconsistencies reflect small sample sizes and their associated imprecision and other biases (14, 15). Second, including only patients with MRI study has resulted in selection bias because severely affected patients were unable to undergo MRI or will have died before MRI could be performed. Third, time between symptom onset and MRI was not fixed, resulting in a variance between 1 and 19 days. Finally, BP measurements were not performed at standardized time intervals after symptom onset, and we included all BP measurements within the first week. Since exact timing of all BP measurements were not recorded, we were unable to include BP measurements prior to the MRI only. In addition, there was no clear and consistent protocol for the BP measurement itself. Differences in timing, equipment and operators can contribute to BPV. However, our sensitivity analysis using the BP measurements from the first 48 h only shows similar results. Although other studies showed an association between BPV and clinical outcome, our results do not support a role for BPV as a contributing factor for the development of PHE, suggesting that mechanisms other than hydrostatic pressure factors such as inflammatory processes, may play a more important role.
The raw data supporting the conclusions of this article will be made available by the authors, without undue reservation.
The studies involving human participants were reviewed and approved by Medical Ethics Review Committee of the University Medical Centre Utrecht, the Netherlands. The patients/participants provided their written informed consent to participate in this study.
LS, FS, and CK contributed to the conception and design of the current study. CK, FS, MWa, MWe, and WJ contributed to the conception, design, and execution of the FETCH study. CK, FS, LS, MWa, MWe, SV, and WJ contributed to patient inclusions and data collection. LS and AW performed statistical analyses and wrote the draft of the article. All authors contributed to manuscript revision, read, and approved the submitted version.
MW was supported by a personal ZonMw VIDI grant (91717337) and the Dutch Heart Foundation (2016T86). FS was supported by the Dutch Heart Foundation (2019T060). This work (LS) was supported by the CONTRAST consortium, which acknowledges the support from the Netherlands Cardiovascular Research Initiative, an initiative of the Dutch Heart Foundation (CVON2015-01: CONTRAST), and from the Brain Foundation Netherlands (HA2015.01.06). The collaboration project is additionally financed by the Ministry of Economic Affairs by means of the PPP Allowance made available by the Top Sector Life Sciences and Health to stimulate public-private partnerships (LSHM17016). The consortium received unrestricted funding by Stryker, Medtronic, and Cerenovus for research. Radboud UMC and Erasmus MC received additional unrestricted funding on behalf of CONTRAST, and for the execution of the Dutch ICH Surgery Trial pilot study. For the Dutch ICH Surgery Trial, Radboudumc, and Erasmus MC received funding from Penumbra Inc., ZonMw, and Zorginstituut. The funding sources were not involved in study design, monitoring, data collection, statistical analyses, interpretation of results, or manuscript writing.
The authors declare that the research was conducted in the absence of any commercial or financial relationships that could be construed as a potential conflict of interest.
All claims expressed in this article are solely those of the authors and do not necessarily represent those of their affiliated organizations, or those of the publisher, the editors and the reviewers. Any product that may be evaluated in this article, or claim that may be made by its manufacturer, is not guaranteed or endorsed by the publisher.
The Supplementary Material for this article can be found online at: https://www.frontiersin.org/articles/10.3389/fneur.2023.1114602/full#supplementary-material
1. van Asch CJ, Luitse MJ, Rinkel GJ, van der Tweel I, Algra A, Klijn CJ. Incidence, case fatality, and functional outcome of intracerebral haemorrhage over time, according to age, sex, and ethnic origin: a systematic review and meta-analysis. Lancet Neurol. (2010) 9:167–76. doi: 10.1016/S1474-4422(09)70340-0
2. Poon MT, Fonville AF, Al-Shahi Salman R. Long-term prognosis after intracerebral haemorrhage: systematic review and meta-analysis. J Neurol Neurosurg Psychiatry. (2014) 85:660–7. doi: 10.1136/jnnp-2013-306476
3. Wilkinson DA, Pandey AS, Thompson BG, Keep RF, Hua Y, Xi G. Injury mechanisms in acute intracerebral hemorrhage. Neuropharmacology. (2018) 134(Pt B):240–8. doi: 10.1016/j.neuropharm.2017.09.033
4. Urday S, Kimberly WT, Beslow LA, Vortmeyer AO, Selim MH, Rosand J, et al. Targeting secondary injury in intracerebral haemorrhage–perihaematomal oedema. Nat Rev Neurol. (2015) 11:111–22. doi: 10.1038/nrneurol.2014.264
5. Chen Y, Chen S, Chang J, Wei J, Feng M, Wang R. Perihematomal edema after intracerebral hemorrhage: an update on pathogenesis, risk factors, and therapeutic advances. Front. Immunol. (2021) 12:740632. doi: 10.3389/fimmu.2021.740632
6. Volbers B, Willfarth W, Kuramatsu JB, Struffert T, Dörfler A, Huttner HB, et al. Impact of perihemorrhagic edema on short-term outcome after intracerebral hemorrhage. Neurocrit Care. (2016) 24:404–12. doi: 10.1007/s12028-015-0185-y
7. Staykov D, Wagner I, Volbers B, Hauer E-M, Doerfler A, Schwab S, et al. Natural course of perihemorrhagic edema after intracerebral hemorrhage. Stroke. (2011) 42:2625–9. doi: 10.1161/STROKEAHA.111.618611
8. Inaji M, Tomita H, Tone O, Tamaki M, Suzuki R, Ohno K. Chronological changes of perihematomal edema of human intracerebral hematoma. Acta Neurochir Suppl. (2003) 86:445–8. doi: 10.1007/978-3-7091-0651-8_91
9. Volbers B, Giede-Jeppe A, Gerner ST, Sembill JA, Kuramatsu JB, Lang S, et al. Peak perihemorrhagic edema correlates with functional outcome in intracerebral hemorrhage. Neurology. (2018) 90:e1005–12. doi: 10.1212/WNL.0000000000006272
10. Venkatasubramanian C, Mlynash M, Finley-Caulfield A, Eyngorn I, Kalimuthu R, Snider RW, et al. Natural history of perihematomal edema after intracerebral hemorrhage measured by serial magnetic resonance imaging. Stroke. (2011) 42:73–80. doi: 10.1161/STROKEAHA.110.590646
11. Manning LS, Rothwell PM, Potter JF, Robinson TG. Prognostic significance of short-term blood pressure variability in acute stroke: systematic review. Stroke. (2015) 46:2482–90. doi: 10.1161/STROKEAHA.115.010075
12. Parry-Jones AR, Wang X, Sato S, Mould WA, Vail A, Anderson CS, et al. Edema extension distance: outcome measure for phase II clinical trials targeting edema after intracerebral hemorrhage. Stroke. (2015) 46:e137–140. doi: 10.1161/STROKEAHA.115.008818
13. Lattanzi S, Cagnetti C, Provinciali L, Silvestrini M. Blood pressure variability and clinical outcome in patients with acute intracerebral hemorrhage. J Stroke Cerebrovasc Dis. (2015) 24:1493–9. doi: 10.1016/j.jstrokecerebrovasdis.2015.03.014
14. Qureshi AI, Palesch YY, Martin R, Novitzke J, Cruz-Flores S, Ehtisham A, et al. Effect of systolic blood pressure reduction on hematoma expansion, perihematomal edema, and 3-month outcome among patients with intracerebral hemorrhage: results from the antihypertensive treatment of acute cerebral hemorrhage study. Arch Neurol. (2010) 67:570–6. doi: 10.1001/archneurol.2010.61
15. Sykora M, Diedler J, Turcani P, Rupp A, Steiner T. Subacute perihematomal edema in intracerebral hemorrhage is associated with impaired blood pressure regulation. J Neurol Sci. (2009) 284:108–12. doi: 10.1016/j.jns.2009.04.028
16. Vemmos KN, Tsivgoulis G, Spengos K, Zakopoulos N, Synetos A, Kotsis V, et al. Association between 24-h blood pressure monitoring variables and brain oedema in patients with hyperacute stroke. J Hypertens. (2003) 21:2167–73. doi: 10.1097/00004872-200311000-00027
17. de Havenon A, Majersik JJ, Stoddard G, Wong K-H, McNally JS, Smith AG, et al. Increased blood pressure variability contributes to worse outcome after intracerebral hemorrhage: an analysis of ATACH-2. Stroke. (2018) 49:1981–4. doi: 10.1161/STROKEAHA.118.022133
18. Sansing LH, Messe SR, Cucchiara BL, Lyden PD, Kasner SE. Anti-adrenergic medications and edema development after intracerebral hemorrhage. Neurocrit Care. (2011) 14:395–400. doi: 10.1007/s12028-010-9498-z
19. McCourt R, Gould B, Gioia L, Kate M, Coutts SB, Dowlatshahi D, et al. Cerebral perfusion and blood pressure do not affect perihematoma edema growth in acute intracerebral hemorrhage. Stroke. (2014) 45:1292–8. doi: 10.1161/STROKEAHA.113.003194
20. Anderson CS, Huang Y, Arima H, Heeley E, Skulina C, Parsons MW, et al. Effects of early intensive blood pressure-lowering treatment on the growth of hematoma and perihematomal edema in acute intracerebral hemorrhage: the Intensive Blood Pressure Reduction in Acute Cerebral Haemorrhage Trial (INTERACT). Stroke. (2010) 41:307–12. doi: 10.1161/STROKEAHA.109.561795
21. Arima H, Wang JG, Huang Y, Heeley E, Skulina C, Parsons MW, et al. Significance of perihematomal edema in acute intracerebral hemorrhage: the INTERACT trial. Neurology. (2009) 73:1963–8. doi: 10.1212/WNL.0b013e3181c55ed3
22. Alrahbi S, Alaraimi R, Alzaabi A, Gosselin S. Intensive blood-pressure lowering in patients with acute cerebral hemorrhage. N Engl J Med. (2016) 375:1033–43. doi: 10.1056/NEJMoa1603460
23. Moullaali TJ, Wang X, Martin RH, Shipes VB, Robinson TG, Chalmers J, et al. Blood pressure control and clinical outcomes in acute intracerebral haemorrhage: a preplanned pooled analysis of individual participant data. Lancet Neurol. (2019) 18:857–64. doi: 10.1016/S1474-4422(19)30196-6
24. Manning L, Hirakawa Y, Arima H, Wang X, Chalmers J, Wang J, et al. Blood pressure variability and outcome after acute intracerebral haemorrhage: a post-hoc analysis of INTERACT2, a randomised controlled trial. Lancet Neurol. (2014) 13:364–73. doi: 10.1016/S1474-4422(14)70018-3
25. Chung P-W, Kim J-T, Sanossian N, Starkmann S, Hamilton S, Gornbein J, et al. Association between hyperacute stage blood pressure variability and outcome in patients with spontaneous intracerebral hemorrhage. Stroke. (2018) 49:348–54. doi: 10.1161/STROKEAHA.117.017701
26. Tanaka E, Koga M, Kobayashi J, Kario K, Kamiyama K, Furui E, et al. Blood pressure variability on antihypertensive therapy in acute intracerebral hemorrhage: the stroke acute management with urgent risk-factor assessment and improvement-intracerebral hemorrhage study. Stroke. (2014) 45:2275–9. doi: 10.1161/STROKEAHA.114.005420
27. Rothwell PM. Limitations of the usual blood-pressure hypothesis and importance of variability, instability, and episodic hypertension. Lancet. (2010) 375:938–48. doi: 10.1016/S0140-6736(10)60309-1
28. Stevens SL, Wood S, Koshiaris C, Law K, Glasziou P, Stevens RJ, et al. Blood pressure variability and cardiovascular disease: systematic review and meta-analysis. BMJ. (2016) 354:i4098. doi: 10.1136/bmj.i4098
29. Wiegertjes K, Jansen MG, Jolink WM, Duering M, Koemans EA, Schreuder FH, et al. Differences in cerebral small vessel disease magnetic resonance imaging markers between lacunar stroke and non-Lobar intracerebral hemorrhage. Eur Stroke J. (2021) 6:236–44. doi: 10.1177/23969873211031753
30. Yushkevich PA, Piven J, Hazlett HC, Smith RG, Ho S, Gee JC, et al. User-guided 3D active contour segmentation of anatomical structures: significantly improved efficiency and reliability. Neuroimage. (2006) 31:1116–28. doi: 10.1016/j.neuroimage.2006.01.015
31. Xi G, Keep RF, Hoff JT. Mechanisms of brain injury after intracerebral haemorrhage. Lancet Neurol. (2006) 5:53–63. doi: 10.1016/S1474-4422(05)70283-0
32. Wu TY, Sharma G, Strbian D, Putaala J, Desmond PM, Tatlisumak T, et al. Natural history of perihematomal edema and impact on outcome after intracerebral hemorrhage. Stroke. (2017) 48:873–9. doi: 10.1161/STROKEAHA.116.014416
33. Hervella P, Rodríguez-Yáñez M, Pumar JM, Ávila-Gómez P, da Silva-Candal A, López-Loureiro I, et al. Antihyperthermic treatment decreases perihematomal hypodensity. Neurology. (2020) 94:E1738–48. doi: 10.1212/WNL.0000000000009288
34. Wagner I, Volbers B, Kloska S, Doerfler A, Schwab S, Staykov D. Sex differences in perihemorrhagic edema evolution after spontaneous intracerebral hemorrhage. Eur J Neurol. (2012) 19:1477–81. doi: 10.1111/j.1468-1331.2011.03628.x
35. Urday S, Beslow LA, Goldstein DW, Vashkevich A, Ayres AM, Battey TWK, et al. Measurement of perihematomal edema in intracerebral hemorrhage. Stroke. (2015) 46:1116–9. doi: 10.1161/STROKEAHA.114.007565
36. Ye F, Garton HJL, Hua Y, Keep RF Xi G. The role of thrombin in brain injury after hemorrhagic and ischemic stroke. Transl Stroke Res. (2020). doi: 10.1007/s12975-020-00855-4
Keywords: intracerebral hemorrhage, blood pressure variability, brain edema, perihematomal edema, blood pressure
Citation: Sondag L, Wolsink A, Jolink WMT, Voigt S, van Walderveen MAA, Wermer MJH, Klijn CJM and Schreuder FHBM (2023) The association between blood pressure variability and perihematomal edema after spontaneous intracerebral hemorrhage. Front. Neurol. 14:1114602. doi: 10.3389/fneur.2023.1114602
Received: 02 December 2022; Accepted: 01 March 2023;
Published: 16 March 2023.
Edited by:
Gabriel Broocks, University of Hamburg, GermanyReviewed by:
Tom Moullaali, University of Edinburgh, United KingdomCopyright © 2023 Sondag, Wolsink, Jolink, Voigt, van Walderveen, Wermer, Klijn and Schreuder. This is an open-access article distributed under the terms of the Creative Commons Attribution License (CC BY). The use, distribution or reproduction in other forums is permitted, provided the original author(s) and the copyright owner(s) are credited and that the original publication in this journal is cited, in accordance with accepted academic practice. No use, distribution or reproduction is permitted which does not comply with these terms.
*Correspondence: Floris H. B. M. Schreuder, RmxvcmlzLlNjaHJldWRlckByYWRib3VkdW1jLm5s
†These authors have contributed equally to this work and share last authorship
Disclaimer: All claims expressed in this article are solely those of the authors and do not necessarily represent those of their affiliated organizations, or those of the publisher, the editors and the reviewers. Any product that may be evaluated in this article or claim that may be made by its manufacturer is not guaranteed or endorsed by the publisher.
Research integrity at Frontiers
Learn more about the work of our research integrity team to safeguard the quality of each article we publish.