 Nafiseh Karimi
 Majid Motovali-Bashi
 Mostafa Ghaderi-Zefrehei2*†
- 1Department of Cell and Molecular Biology and Microbiology, Faculty of Biological Science and Technology, University of Isfahan, Isfahan, Iran
- 2Department of Animal Genetics, Yasouj University, Yasuj, Iran
Introduction: Multiple sclerosis (MS), a non-contagious and chronic disease of the central nervous system, is an unpredictable and indirectly inherited disease affecting different people in different ways. Using Omics platforms genomics, transcriptomics, proteomics, epigenomics, interactomics, and metabolomics database, it is now possible to construct sound systems biology models to extract full knowledge of the MS and recognize the pathway to uncover the personalized therapeutic tools.
Methods: In this study, we used several Bayesian Networks in order to find the transcriptional gene regulation networks that drive MS disease. We used a set of BN algorithms using the R add-on package bnlearn. The BN results underwent further downstream analysis and were validated using a wide range of Cytoscape algorithms, web based computational tools and qPCR amplification of blood samples from 56 MS patients and 44 healthy controls. The results were semantically integrated to improve understanding of the complex molecular architecture underlying MS, distinguishing distinct metabolic pathways and providing a valuable foundation for the discovery of involved genes and possibly new treatments.
Results: Results show that the LASP1, TUBA1C, and S100A6 genes were most likely playing a biological role in MS development. Results from qPCR showed a significant increase (P < 0.05) in LASP1 and S100A6 gene expression levels in MS patients compared to that in controls. However, a significant down regulation of TUBA1C gene was observed in the same comparison.
Conclusion: This study provides potential diagnostic and therapeutic biomarkers for enhanced understanding of gene regulation underlying MS.
1. Introduction
Multiple sclerosis (MS) is a multifocal inflammatory autoimmune disease (1). Even though MS is usually considered a white matter disease, but several studies have demonstrated the involvement of gray matter impairment in conjunction with cortical and deep (2–6) leading to progressive neuronal damage in genetically sensitive hosts (1). MS is a complex multicomponent demyelinating disease and its pathophysiology consist of redox, autoimmune, vascular, and neurodegenerative systems, to name a few. The clear-cut mechanisms of MS triggering, its development, and progression are still obscure. In MS, impairing of the myelin sheath of neural axons in the Central Nervous System (CNS) is observed (7, 8). MS shows a long range of symptoms e.g., from pathological processes to severe physical disabling. Gender preferences, genetical factors, and geographical differences have been reported for people suffering from MS. Over outburst of MS, monocytes, which are a preserved subset of white blood cells, are activated by interferon-β (IFN-β) (7). MS study is quite vivid, using Omics data, many authors have used gene networks to get some insight into molecular mechanisms of MS (9–19). The integration of information gleaned from a variety of resources encompassing transcriptomics, genomics, proteomics and patient clinical data could boost our understanding of the mechanism(s) underpinning the reason for this disease (20). In this regard, we can explore the signaling pathways involved in MS (21), apply logical networks to model signaling pathways in MS (22) and use networks to combine information on transcriptome-interactome data from MS studies (17). We can also apply theory of biochemical systems for improving therapeutic drugs in re-myelination (15), create molecular networks based on transcription factors and genes expressed in mononuclear cells in MS patients (23), and design reactive networks between distinct miRNA and target genes in T cells (23). This approach will help explain the molecular mechanisms of the MS disease (12). Supplementary Table 1 shows some examples of network-based studies used with different MS biological data. As one can see, Bayesian Network (BN) modeling paradigms have rarely been applied in this setting. BN uses probability theory to reason under uncertainty. BN as a graphical scheme (directed acyclic graph) consists of a qualitative part (structural model) and a quantitative part (local probability distributions), which allow for a different kind of probabilistic inference, and quantitatively measures even the smallest impact of a variable or set of variables on others. This sort of modeling is of great importance in transcriptomic studies, since it can reveal both qualitative and quantitative elements of learned gene networks. BN has previously been used in several transcriptomic studies (10, 24, 25).
Many existing categories of gene networks identify groups of related genes as gene sets, making experimental follow-up a formidable task. With BN, it is possible to determine whether a gene is a driving source of changes in its gene network or not, since both in-degree and out-degrees of connectivity of each gene can be readily verified. The more out-degree gene has, the higher likelihood of being a possible regulator one. This would be a crucial characteristic for example when looking for potential drug targets. However, it is likely that a specific transcription factor defining a particular cell type that drives pathology, may not have a large number of out-degrees while still being crucial. To this end, if a particular gene is expressed across different cell types, for example like S100A6, then it may be correlated with different genes, but this may be a spurious correlation. Therefore, to leave off possible artifacts, we should use extra source of information when interpreting the results. Today, MS research is increasingly data-driven—a trend that arguably shall continue at a much higher rate in times to come. To tackle these large amounts of heterogeneous data, and to derive insight into MS disease, many interdisciplinary scientists have started using a variety of computational tools. In this study, we aim to gain much insight into the regulatory transcriptional gene network underlying MS using systems biology approaches in the context of BN, that may yield mechanistically interpretable results.
2. Methods
2.1. Network analysis
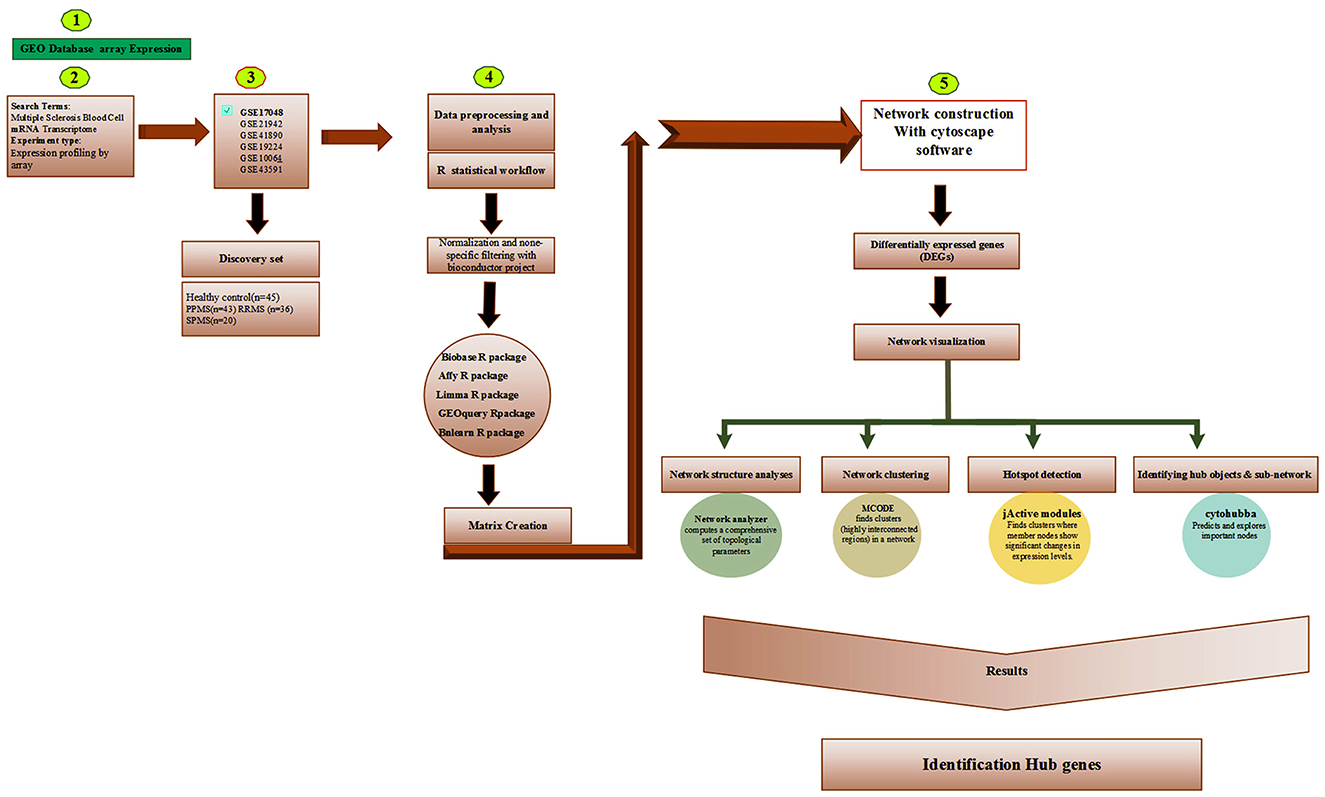
In this study, the Gene Expression Omnibus (GEO) database (https://www.ncbi.nlm.nih.gov/geo/) was scanned using a combination of several simple key words, and resulting DNA microarray experiments related to MS, that fulfilled our criteria. In the end, based on our criteria for choosing a suitable GEO data set, the microarray series with accession number GSE17048 was downloaded from GEO using the GEO query package (26). This accession was seen to have the highest number of arrays per probe—a fact that would help minimize the rate of false positives while training the regulatory gene BN. The GSE17048 contained 56 blood samples from MS group [44 patients were in the RRMS phase (relapsing-remitting) and 12 patients were in the SPMS phase (progressive-secondary)]. The control population was 44 healthy people without any symptoms. The average age of the patients was 39.5 years old and the control group was 39.23 years old, and in terms of gender, the MS included 29 women and 15 men (higher prevalence of the disease in women) and 23 men and 21 women were studied in the control group. In order to remove noise from the data, probes with the highest variance were obtained and used as an input to train the gene regulatory BN using bnlearn, an R add-on package (27, 28). The following codes were used to filter the probes with highest variances: qt <- quantile[t(data1); probs = c(0.0002,0.99)]; rows1 <- apply[t(data1), function(x) any(x < qt | x > qt)]; data2 <- t(data1)[, rows1]. We obtained the best fitted BN model on our data using Bayesian information criterion (BIC) and its adjacency matrix, with the help of the Cytoscape-based aMatReader plugin, with the Cytoscape (29) environment used for further downstream scrutiny.
2.2. Downstream analysis
This was accomplished with the following Cytoscape add-on packages. The jActiveModules were used to explore the concept of gene modules and find sub-networks (30); MCODE to identify putative complexes by finding regions of significant local density (31); CytoHubba to explore the protein-protein interaction (PPI) network of hub genes using eleven different methods (32). The NetworkAnalyzer was used to determine the hub genes, taking into account the degree of topological criteria (e.g., the number of nodes, edges, and connected components, along with the network diameter, radius, density, centralization, heterogeneity, clustering coefficient, the characteristic path length, the distributions of node degrees, neighborhood connectivity, average clustering coefficients, and shortest path lengths) (33). The iRegulon was used to detect targets / motifs/paths from a set of genes; and the CyTargetLinker to integrate regulatory reactions in network analysis. In addition, we used Metascape (34) to annotate the multiple gene lists in our study. Even though transcriptomic statistical analysis is generally based on probe level data, the probe names were converted to their corresponding gene names using g:Profiler (https://biit.cs.ut.ee/gprofiler/gost) to get better insight into the data. Results from the aforementioned software were combined. Figure 1 shows the analysis used in this study.
2.3. Validation of LASP1, TUBA1C, and S100A6 genes using quantitative real-time PCR
2.3.1. Ethics statement
Following the bioinformatics analysis, validation of significant differentially expressed genes (DEGs) (LASP1, TUBA1C, and S100A6) was carried out using QRT-PCR. A total of 100 whole blood samples (56 MS cases, mean age: 39.5 years and 44 controls, mean age: 39.5 years), obtained from MS Research Center and Al-Zahra Hospital in Isfahan (http://alzahra.mui.ac.ir) were used. All procedures were approved and carried out in accordance with Medical Research Ethics Committee of Iran under code IR.UI.REC.1399.076.
2.3.2. RNA extraction
Total RNA was extracted from each sample according to the standard TRIzol protocol (Bio BASIC, Canada) according to manufacturer's instructions. RNA concentration and quality were determined using both Nanodrop (Thermo Scientific Tm Nano Drope One C model) and gel electrophoresis. The existence of two sharp bands representing 18S and 28S ribosomal RNA on a 1% (w/v) ethidium bromide stained agarose gel during electrophoresis through TAE buffer (40 mM Tris-acetate, 1 mM EDTA, pH 8.0) at 100 V for 30 min confirmed the quality of the extracted RNAs. Those RNA samples with a RNA integrity Number (RIN) < 1.8 were excluded from further analysis. For all the RNA work DEPC-Treated Water was used. High quality extracted total RNA was stored at −70°C until cDNA synthesis.
2.3.3. cDNA synthesis
Initially, DNAse I (Fermentase Cat # ENO 521) treatment was used to remove genomic DNA before cDNA synthesis. Next, cDNA synthesis was carried out using a commercial kit provided by Yektatajhiz Company (Cat No.: YT4500) according to manufacturer's instructions. This involved keeping the samples on ice under sterile conditions at 70°C for 5 mins, 37°C for 60 mins, 70°C for 5 mins, and finally storing all synthesized cDNAs at −20°C.
2.3.4. Quantitative real time PCR analysis
To enable the validation of our candidate genes (LASP1, TUBA1C, and S100A6), SYBR Green -based QRT-PCR was performed using a LightCycler® 96 (BioRad, Germany). The sequence of all primers used are listed in the Table 1. These were designed using the PRIMER3 program (http://frodo.wi.mit.edu). QRT-PCR reactions were performed in duplicate and the values of average cycle threshold (Ct) were determined for each sample. The conditions of QRT-PCR amplification were: 1 cycle at 95°C for 2 min, 40 cycles at 95°C for 50 s, 60°C for 30 s. The human beta-actin gene (ACTB_HUMAN) was used as the internal control. Hence, all calculated concentrations are relative to the concentration of the standard, expressed in arbitrary units and the quantification cycle values were automatically calculated with Rotor-Gene software version 6.1.
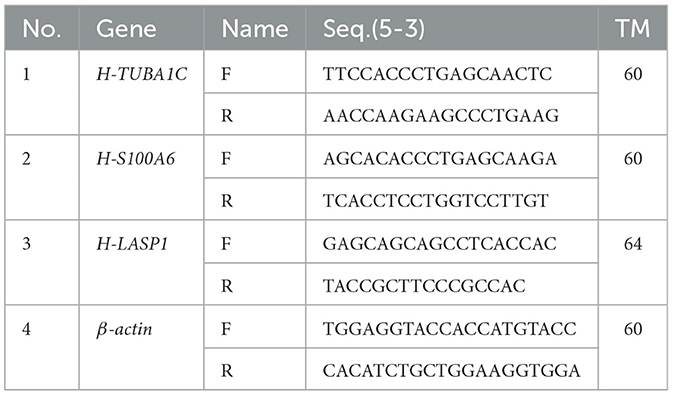
Table 1. Primers designed for QRT-PCR.
The results were analyzed using the 2−ΔΔCt method (35). In this study, beta-actin gene (as a reference gene) and S100A6, TUBA1C, and LASP1 genes [as target genes (TRG)] and CT data from real-time expression of TUBA1C, LASP1, and S100A6 were statistically analyzed (P < 0.05) by REST 2009 software. After checking the normality of data, using the Kolmogorov Smirnov test and the unpaired t-test in GraphPad Prism 8 software, a significant difference in the expression levels of genes LASP1, TUBA1C, and S100A6 was observed between patients and healthy individuals.
3. Results
The fundamental idea behind this analysis was to shed some light into gene-gene interactions underpinning MS disease with regard to cause and effect (36). In this study, we reused GSE17048 experiment data which contained the profiled mRNA expression for all known genes in whole blood from 144 health individuals, 99 with MS (43 PPMS, 36 RRMS, and 20 SPMS). As meta-data of GSE17048 shows in the Gene Expression Omnibus–NCBI, in the conducting the experimental design, whole blood mRNA expression was compared between different types of MS and age-matched healthy control. The nature of probability distribution induced by a gene regulatory BN will allow diverse probabilistic gene queries to be answered in linear time. This makes BN to be practically appealing. The results of comparison of the network structures determined from various algorithms, including Hill Climbing, Tabu Search, Max-Min Hill Climbing, and Restricted Maximize algorithms with different scoring functions, are shown in Table 2. Some key properties of BN are fundamental in judging estimated results.
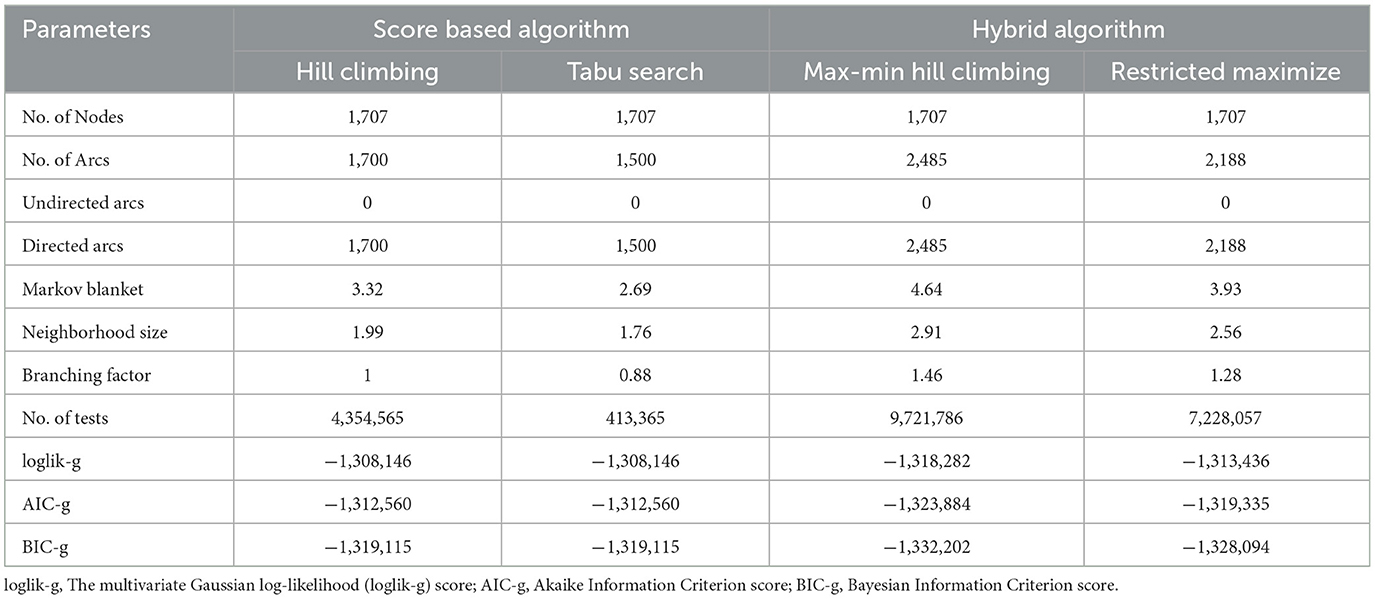
Table 2. Estimation of structural Bayesian network parameters with different algorithms.
Figure 2 shows some properties of trained BN gene networks.
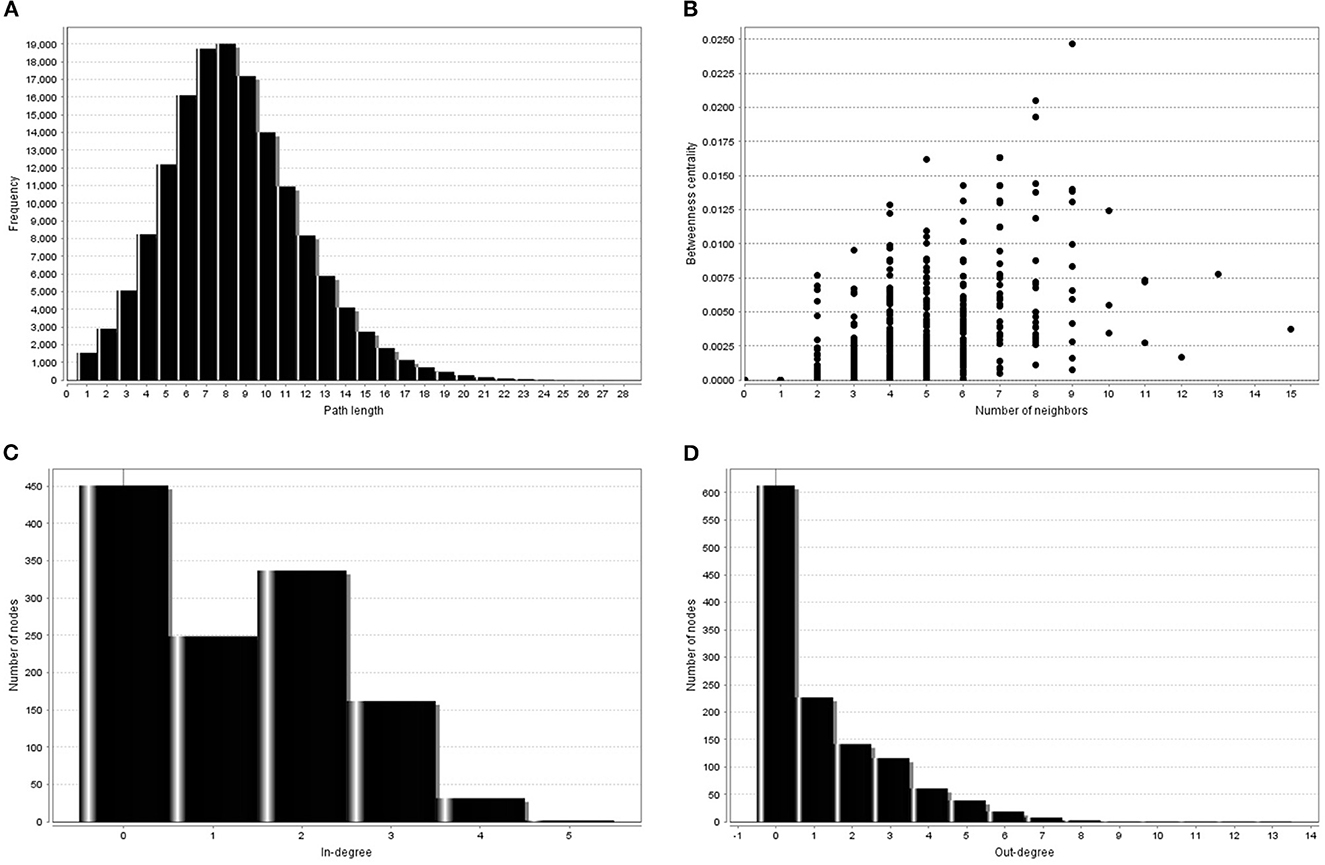
Figure 2. Some topological measures of trained gene regulatory BN visualized by NetworkAnalyzer. (A) Shortest path length distribution. The path length is the number of edges along the path. The distance dij between a pair of different nodes i and j is the length of the shortest path connection. (B) Between-ness centrality. The Between-ness centrality of a node reflects the amount of control that this node exerts over the interaction of other nodes in the network. (C) Distribution of in-degree gene connectivity measure. (D) Distribution of out-degree gene connectivity measure.
Topological parameters can characterize the location of genes in a gene network (37). Using NetworkAnalyzer, the following network topological parameters were calculated in our data. This was based on clustering coefficient (0.003), number of nodes (1,707), connected components (857), network diameter (26), network radius (1), shortest paths (192,463), characteristics path (8.313), the average number of neighbors (1.992), network density (0.0), isolated nodes (854), number of self-loops (0), multi-edge node pairs (0), and analysis times (1.467). The nature of probability distribution induced by a gene regulatory BN allowed diverse probabilistic gene queries to be answered in linear time. However, many structural BN parameters may be important. One of the key parameters (shown in Table 2) is the branching factor. This parameter plays a significant role in development of the gene network. Each Node (gene) will have its own branching measure, which will determine the out degree of that gene. If the branching factor value is not uniform in the network, an average branching factor can generally be calculated. This value turned out to be different depending on the type of algorithm used. Max-Min Hill Climbing returned a higher average than Restricted Maximize. In terms of system level understanding of research, the higher the branching factor, the more frequently gene regulators can be identified in the network. Biological networks have a modular architecture (38). MCODE can find connected and dense areas of the gene network based on network topology measures. In our analysis, 12 different modules were detected using MCODE, among which, 7 modules had 3 nodes; 3 edges with different interaction modes; 3 modules had 6 nodes and 7 edges; 1 module 15 nodes and 17 edges and finally 1 module had 6 nodes and 6 edges (Supplementary Figure 1). The active subnetworks were obtained using jActiveModules. The jActiveModules comprised 5 modules, where ILLMN_1742167 (TUBA1C), ILLMN_1665909 (LASP1), and ILLMN_1713636 (S100A6) were seen to be enriched modules (Figure 3). The number of modules detected by this method was different than those identified with the MCODE based method.
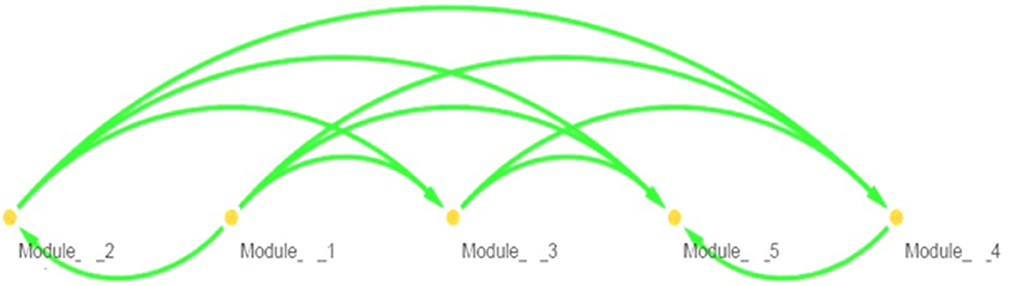
Figure 3. Extracted molecular modules using jActiveModules.
Figure 3 shows predicted modules in different modes of interaction. Module-level analysis explores the organization of biological systems and reconstructs module networks [A network module is a group of nodes (hub genes) that work together. Node or Vertex is a connection point or a branch point or an end point in a connection. And the path that connects the nodes to each other is called edge]. Figure 3 shows a module-level view of our gene regulatory BN network that denotes a high-level representation of the regulatory machinery of the MS gene network topology. Dense module searching of two MS Genome-Wide Association Study (GWAS) datasets identified several genes (GRB2, HDAC1, IL2RA, JAK2, KEAP1, MAPK1, RELA, and STAT3). These genes were enriched for glial cell differentiation (14). CytoHubba provides a user-friendly interface for discovering important nodes in biological networks (32). CytoHubba considers the shortest path between groups of nodes. Among the 11 proposed algorithms, MCC fitted better than the others. In Figure 4 and Table 3, we present the top 10 identified probes. Many of the genes, such as TUBA1C, LASP1, and S100A6 shown in Figure 4, are close to the hub genes and were actually identified as hub genes by other algorithms such as CyTargetLinker. The iRegulon software then allowed us to identify regulons using motif discovery in a set of regulated genes. Identified transcription factors affecting the hub genes are listed in Supplementary Table 2 and Supplementary Figure 2 and their common factors identified are given in Table 4. The most significant, the STAT5A protein, mediates the responses of many cell ligands, such as IL2, IL3 and different growth hormones. In this study, the gene identifiers were uploaded to Metascape and used in conjunction with KEGG pathways, GO biological processes, Reactome gene complexes, canonical and CORUM pathways (39). The results of the enrichment analysis, including descriptions, function, ontology, expression, etc. are shown in Table 5, Supplementary Table 3, and Supplementary Figure 3.
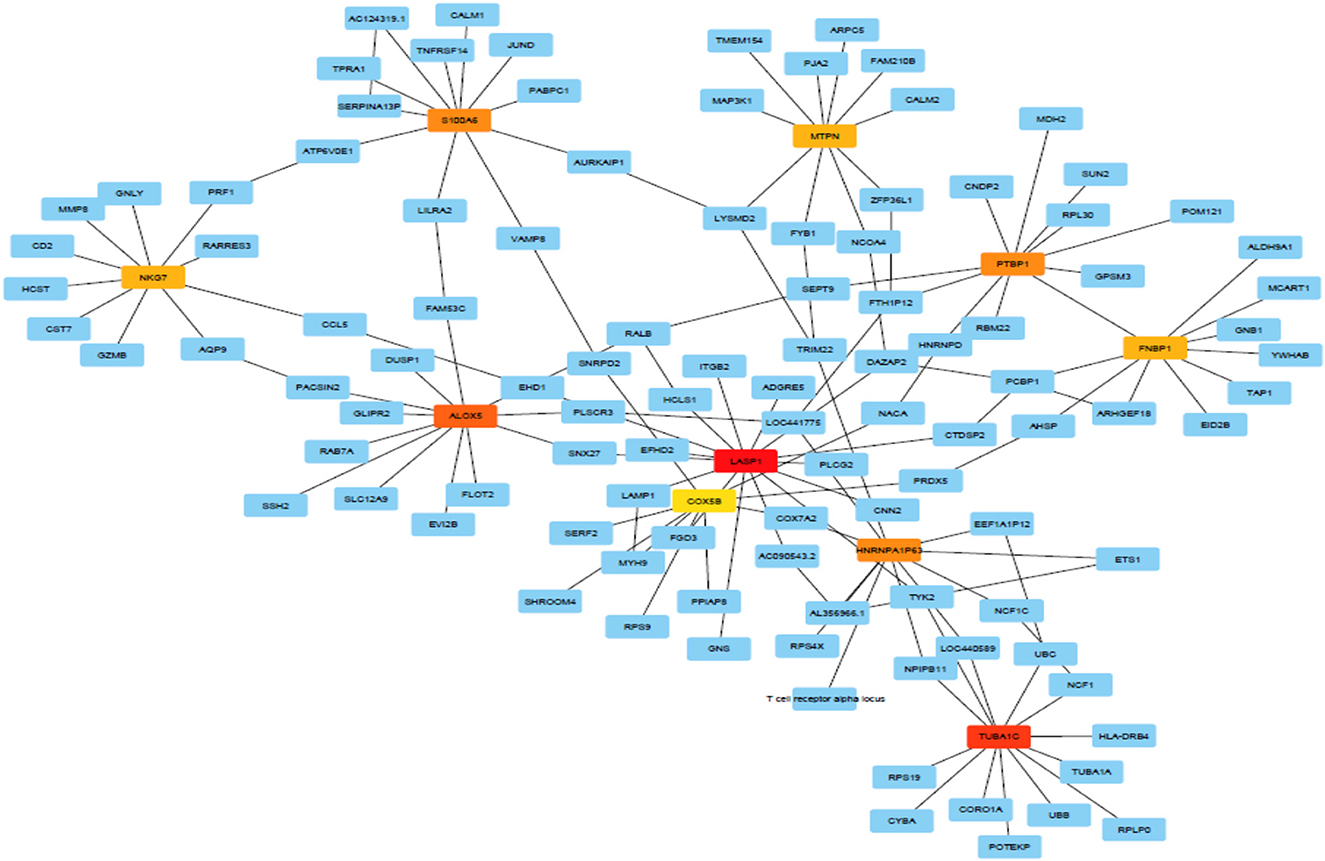
Figure 4. The MCC method captures essential genes in the top ranked list.
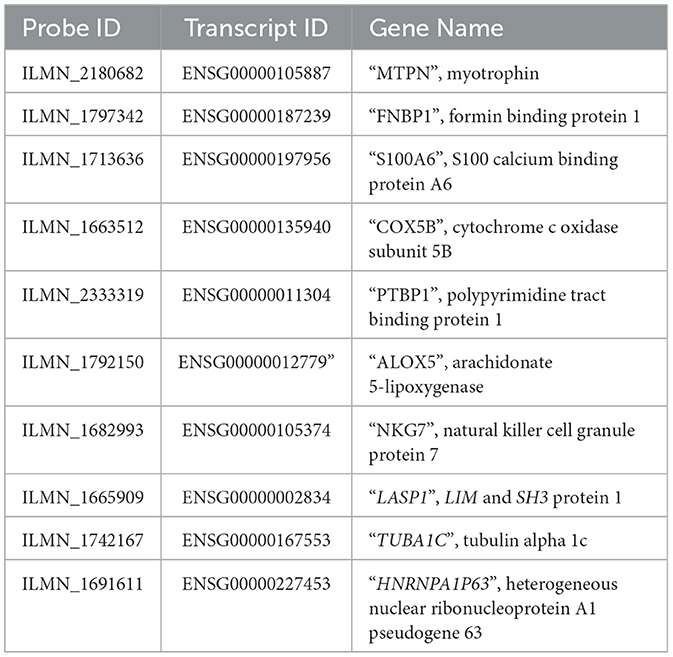
Table 3. The 10 top genes/probes identified by the MCC method.

Table 4. The top 10 transcription factors (TFs) estimated to affect hub genes.
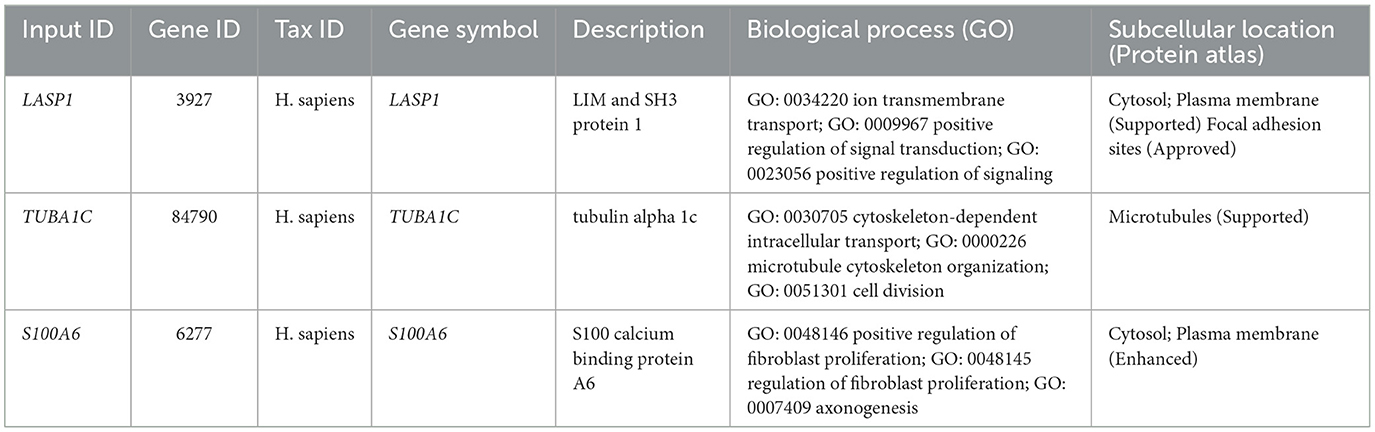
Table 5. Metascape results LASP1, TUBA1C, and S100A6 genes.
Genes were ranked from top to bottom based on degree, closeness and betweenness [higher degree (hub), higher betweenness (throat) and higher closeness centrality (shortest distance with other genes in the network)]. In terms of these parameters, three genes (LASP1, TUBA1C, and S100A6) showed a significant correlation with MS disease. These were thus identified as hub genes (Supplementary Table 4). In this study, probes ILLMN_1665909, ILLMN_1742167, and ILLMN_1713636 had high degrees of 15, 13, and 11, respectively and were identified as hub probes. In total of 850 probes had zero input edges, 200 probes had 1 in-degree. ILLMN_1665909, with the highest out-degree (13 out-degree) and 2 in-degree (mapped to human LASP1) plays an important role in regulating activity. Its encoded cytoplasmic protein binds focal adhesion proteins and plays a role in cell signaling, migration, and proliferation. ILLMN_1742167, with 12 out-degree and 1 in-degree mapped to the human tubulin gene (TUBA1C), and ILLMN_1713636 with 9 out-degree and 2 in-degree mapped to the S100A6 gene (Figure 2).
3.1. Real-time reverse transcription polymerase chain reaction
As given in the Material and Methods section, we used RT-PCR to validate the results of Bayesian gene network. RT-PCR, that actually reflects product accumulation, is a routine lab-based method to validate array based transcriptomic results. In this study, the LASP1, TUBA1C, and S100A6 genes turned out to be playing regulatory roles in MS. In validating aforementioned genes, using RT-PCR experiment, it was indicated that the patterns of relative gene expression for these genes (LASP1, TUBA1C, and S100A6) were significant between MS cases and controls (P < 0.05). The calculations based on the formula –ΔΔct shown the amount of mRNA transcripts of LASP1 and S100A6 genes, increased (5.491 and 36.556 times respectively) in patients though a decrease (0.166 times) in TUBA1C gene expression was seen in MS patients (P < 0.05) (Table 6 and Figure 5).
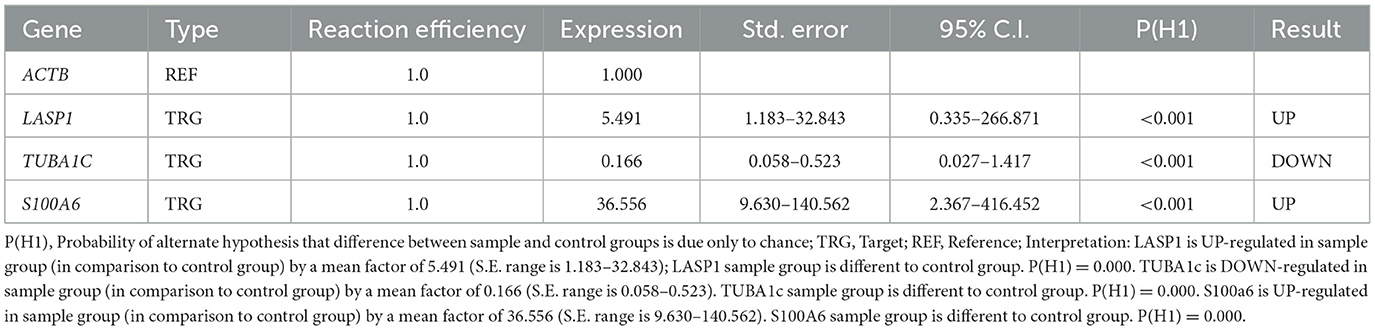
Table 6. REST software data compared LASP1, TUBA1c, and S100A6 genes in MS patient and control groups.
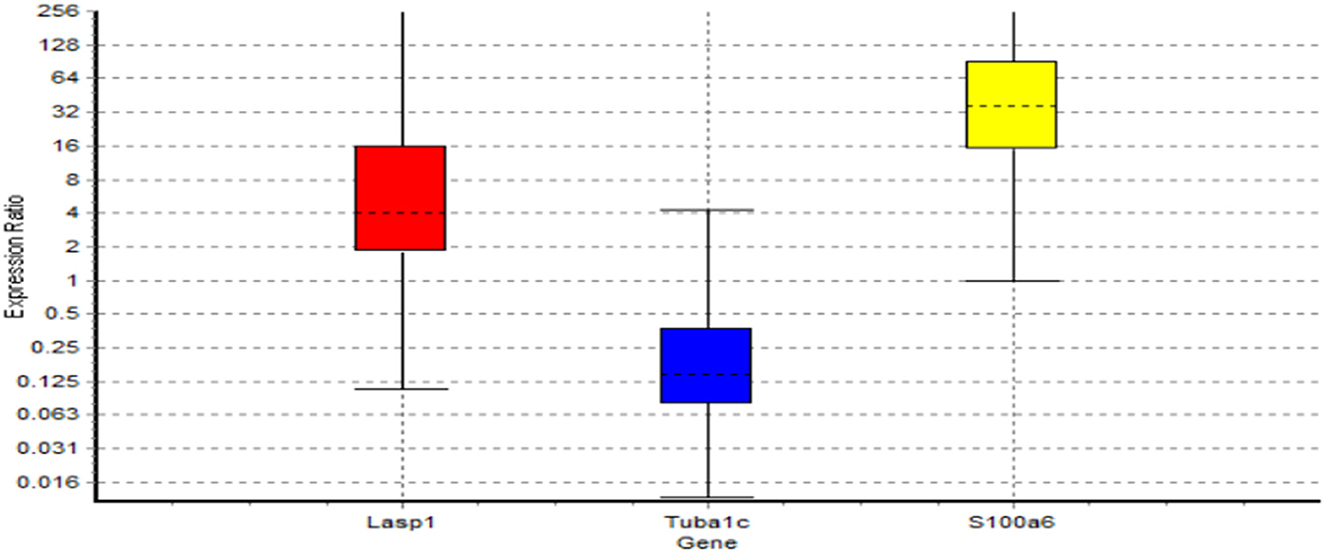
Figure 5. Boxes represent the interquartile range, or the middle 50% of observations. The dotted line represents the median gene expression. Whiskers represent the minimum and maximum observations.
The results after studying the normality of the distribution of variables using the one sample Kolmogorov–Smirnov test and unpaired t-test in GraphPad Prism 8 software show a significant difference in expression levels of LASP1, TUBA1C, and S100A6 genes between patients and healthy controls. P-values were: TUBA1C < 0.0001, S100A6 < 0.0001, LASP1 < 0.003. Mean expression of TUBA1C, LASP1, and S100A6 genes in patient samples was 7.4, 5.6, and 2.9 respectively and 4.9, 8.1, and 8.0, respectively in healthy individuals. Results from statistical analysis also showed a decrease in TUBA1C gene expression and an increase in LASP1 and S100A6 gene expression in MS patients compared to the control group (Figure 6).
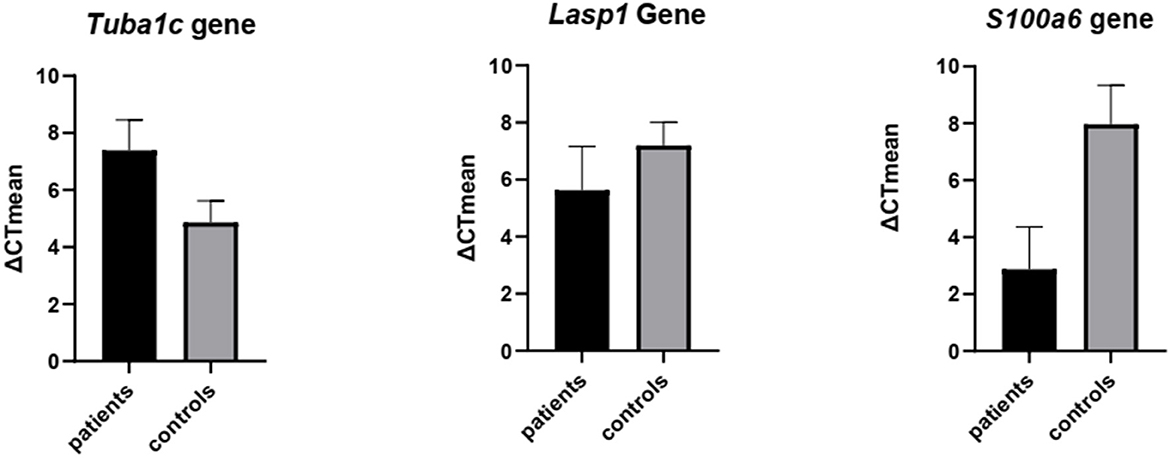
Figure 6. Validation of the expression of TUBA1C, LASP1, and S100A6 genes by real-time PCR. Unpaired t-test was used to detect differences in gene expression between 2 groups patients & controls using the Graph Pad Prism 8 software. Significance: P-value TUBA1C < 0.0001, P-value S100A6 < 0.0001, P-value LASP1 < 0.003.
4. Discussion
At present, the cause of MS is not fully understood, but knowledge of the genetic factors involved is essential for effective diagnosis and identification of the most appropriate MS therapeutic interventions. In this study, three genes (LASP1, TUBA1c, and S100A6) with high degree, high closeness centrality and high betweenness measures were highlighted as potential MS candidate regulator markers. These three genes (LASP1, TUBA1c, and S100A6) seem to be the most significant in the MS disease process. S100A6 functions in a wide range of cell types as a member of the S100 family and this family expression in MS patients could be considered as a diagnostic biomarker for MS. Its inhibition of demyelinating nerve cells suggests that S100 proteins could act as a candidate therapeutic target in MS (40). Komatsu et al. reported increased expression of S100A6 (Calcyclin), a calcium-bound protein of the S100 family, in human colorectal adenocarcinoma (41). Peterova et al. reported an overexpression of S100 protein-encoding mRNA in both colorectal cancer cell lines and surgically resected specimens of colorectal cancer (42). A study by Bartkowska et al. (43) showed that in response to different stress conditions, the level of S100A6 decreased in several brain structures, indicating that S100A6 may modulate stress responses. The genome-wide methylation array has identified a few hypomethylated immune-related genes, amongst them S100A6 which shows up-regulation in autoimmune encephalitis patients (44). Even though S100A6 is involved in many biological phenomena, its biological activity is still unknown (45). At the transcriptional level, upstream stimulatory factor and Nuclear factor-kappa B (NF-κB) activates the S100A6 gene promoter, although p53 might act indirectly to suppress transcription of the S100A6 gene (46). TUBA1C is a member of Microtubules which are vulnerable to degradation and disorganization in a variety of neurodegenerative diseases (47–49). Malfunction of microtubules (e.g., TUBA1C) is also considered as the central physiopathological mechanism of neurodegenerative diseases. The abnormalities in the regulatory pathways of microtubules disrupt the properties and functions of microtubules, leading to nerve damage (50). A decreased expression of the TUBA1C gene in Parkinson's disease has already been demonstrated by quantitative analysis of gene expression (51). LASP1)The LIM and SH3 protein 1), a focal adhesion adaptor protein, is an actin-binding, signaling pathway-regulated phosphoprotein which localizes within multiple sites of dynamic actin assembly. It has the potential to interact with various molecules, and is highly expressed in the adult CNS. Microarray data has revealed that alterations in LASP1 proteins affect cell migration, adhesion, and cytoskeletal organization (52). LASP1, significantly expressed by CNS neurons, is localized at synaptic sites (53).
A couple of significant transcription factors (TFs) that interact with these hub genes were identified in this study. The YY1 TF (Yi and Yang 1) is a multifactorial protein that, depending on the cell tissue, can activate or suppress gene expression (54). It is expressed in the nervous system. The YY1 promoter lacks the usual TATA box but has a rich GC sequence and therefore resembles a large subset of housekeeping and growth regulator genes. These features suggest that it may play an important role in development. In the CNS, myelination is performed by oligodendrocytes. YY1 function in oligodendrocytes was first reported by Berndt et al. (55). YY1 activates the promoter of myelin lipids and has been identified as an important player in myelination of the central nervous system during growth. In multiple neurodegenerative diseases, YY1 function is degraded through distinct mechanisms, including protein utilization, protein degradation, and ectopic nuclear/cytoplasmic shuttle (N/C). These disorders inhibit YY1 transcriptional activity and lead to gene transcriptional abnormalities that contribute to disease pathogenesis. A future goal in YY1 research is to discover other potential mechanisms that lead to YY1 dysfunction in neurodegenerative diseases, such as ectopic changes after translation (56). The other TF identified in study was Nuclear Factor of Activated T Cells 3 (NFATc3), a member of NFAT family. NFATc3 acts as signal integrators because their function is to bind STAT3, c-Jun, CREB, and ATF3 factors at specific DNA binding sites. NFATc3 cannot be regulated alone and act as calcium-dependent transcription factors. The antigen-mediated T cell receptor (TCR) mediates multiple signaling cascades, including phospholipase C (PLC) -dependent pathways that are secondary messengers of inositol-1,4,5-triphosphate (IP3) and diacylglycerol (DAG). IP3 binds to the IP3 receptor in the endoplasmic reticulum (ER) and releases Ca2+ ions into the cytoplasm (57). In this way, NFATc1-4, activates intracellular calcium via dephosphorylation (35). The findings show that NFATc3 is defined as a marker of a specific subset of astrocytes that are activated in response to lesions, as well as some degree of heterogeneity among astrocytes that may have consequences for cells in the nervous system (58). Preliminary findings in neuroblast cells have shown that various treatments that alter tubulin polymerization, such as reducing the mineral zinc, prevent the transfer of NFATc3 to the nucleus. In agreement with a functional relationship between NFAT and microtubules, it has been observed that the degradation of several proteins that control the proper organization of the microtubule network, and the actin-cytoskeletal linker, disrupts the nucleus and transcriptional activity of NFAT. Overall, it indicates the involvement of microtubules in NFAT nuclear stimulation (59). The LASP1 gene enhances NFAT2 nuclear translocation by activating the nuclear factor Akt (60). NFAT can affect processes such as axon growth, synaptogenesis, Schwann cell differentiation, and myelination (58). In general, it can be concluded that increase of the expression of LASP1 and S100A6 genes and decrease the expression of the TUBA1C gene in multiple sclerosis disrupts NFAT transcriptional activity. Although the role of NFAT in regulating the immune system is well established, our knowledge of NFAT in human disease is limited. The function of NFAT in other aspects of human immune or inflammatory diseases is also largely unknown (61).
The involvement of hub genes identified in this study in other disorders have been reported as well. Patients with MS are known to suffer from a number of digestive problems (62) and studies have shown that LASP1 (63) and S100A6 genes have high expression in the digestive system. A link can therefore be established between the expression of these genes, MS, gastrointestinal problems and possibly other types of human cancers (64). Also, LASP1 plays a crucial role in the growth and metastasis of gastric cancer and other cancers (52, 63, 65–68). For example, LASP1 can cause the progression and metastasis of colorectal cancer (CRC), but its mechanism is still unclear (69). A connection between LASP1 and S100A has reported underpinning LASP1 binds to the calcium-binding protein family (S100A) and increases its expression in colon cancer (Kappa = 0.347, P < 0.01) (70). On this basis, the present study confirmed the importance of three gene expression patterns (LASP1, S100A6, and TUBA1C) for understanding the transcriptome complexity of MS. This leads us to conclude that upregulation of LASP1 and S100A6 genes along with down-regulation of TUBA1C is central to MS pathology. To our knowledge, this is the first report to evaluate the level of expression of the above genes for discovery of a transcriptomic signature for MS disease. These findings provide a potential mechanism for some significant biomarkers responsible for the pathogenesis of MS. However, we still have a long way to go to understand the larger transcriptomic profile for this disease. This study provides initial data to further investigate the possible role of these genes in the pathogenesis of MS.
5. Conclusions
Results of the present study indicate that the analysis of gene expression data based on gene-gene interaction networks can provide opportunities to determine the genes involved in MS. The importance of three candidate marker genes in this disease were highlighted. These candidate marker genes, LASP1, TUBA1C, and S100A6, identified by the biological systems approach, have been further confirmed in the laboratory. The significant difference in the expression of these three genes in patients with MS will help further research on this disease and its treatment. This useful tool can serve as a good starting point for identifying new therapies and understanding the basic mechanisms controlling normal cellular processes and disease pathologies. It is crucial to point out here that for learning Bayesian gene network in this study, we did not separate sets of possible signaling protein molecules and transactional factors beforehand in our data, and consider them to be parents (causatives) in the learned network. By doing so, the learned Bayesian gene network probably would be biologically much more appealing. We aim to do this in a due course in the future.
Data availability statement
The data presented in the study are deposited in the https://www.ncbi.nlm.nih.gov/geo/query/acc.cgi?acc=GSE17048 repository, accession number GSE17048.
Ethics statement
All procedures were approved and carried out in accordance with Medical Research Ethics Committee in Iran under code IR.UI.REC.1399.076. The patients/participants provided their written informed consent to participate in this study.
Author contributions
NK and MG-Z developed the theoretical formalism, designed the model and the computational framework, and analyzed the data. NK performed experimental lab the analytic calculations. MM-B conducted the backbone of the experiment and contributed to the final version of the manuscript. All authors have read and agreed to the published version of the manuscript.
Funding
This study was funded with the budget of the University of Isfahan (use of laboratory equipment and purchase of materials) and the Biotechnology Development Headquarters (grant for purchase of laboratory materials).
Acknowledgments
The authors thank all the patients, their families, and caregivers. The authors thank all the clinicians for their involvement and contribution to the study. This work was supported by Jacqueline Smith from The University of Edinburgh, Easter Bush, Midlothian, EH25 9RG, UK for writing—review and editing.
Conflict of interest
The authors declare that the research was conducted in the absence of any commercial or financial relationships that could be construed as a potential conflict of interest.
Publisher's note
All claims expressed in this article are solely those of the authors and do not necessarily represent those of their affiliated organizations, or those of the publisher, the editors and the reviewers. Any product that may be evaluated in this article, or claim that may be made by its manufacturer, is not guaranteed or endorsed by the publisher.
Supplementary material
The Supplementary Material for this article can be found online at: https://www.frontiersin.org/articles/10.3389/fneur.2023.1090631/full#supplementary-material
Abbreviations
BIC, Bayesian information criterion; BN, Bayesian Network; CNS, central nervous system; DEGs, differentially expressed genes; DAG, diacylglycerol; ER, endoplasmic reticulum; GEO, gene expression omnibus; GWAS, genome-wide association study; IP3, inositol-1,4,5-triphosphate; LASP1, The LIM and SH3 protein 1; MS, multiple sclerosis; NLS, nuclear localization signal; NFATc3, nuclear factor of activated T cells 3; NF-κB, nuclear factor-kappa B; PLC, phospholipase C; PPI, protein-protein interaction; RIN, RNA integrity number; RRMS, relapsing-remitting MS; SPMS, secondary progressive MS; TFs, transcription factors; TCR, T cell receptor; YY1, Yi and Yang 1.
Footnotes
1. ^https://www.ncbi.nlm.nih.gov/geo/.
2. ^https://www.r-project.org/ (2022).
3. ^https://www.bioconductor.org/ (2003–2022).
4. ^https://cytoscape.org/ National Institute of General Medical Sciences (NIGMS).
References
1. Hernandez AL, O'Connor KC, Hafler DA. Chapter 52 - Multiple Sclerosis. In:Rose NR, Mackay IR, , editors. The Autoimmune Diseases (Fifth Edition). Boston: Academic Press (2014). p. 735–56. doi: 10.1016/B978-0-12-384929-8.00052-6
2. Anderson VM, Fisniku LK, Altmann DR, Thompson AJ, Miller DH. MRI Measures show significant cerebellar gray matter volume loss in multiple sclerosis and are associated with cerebellar dysfunction. Multiple Sclerosis. (2009) 15:811–7. doi: 10.1177/1352458508101934
3. Daniel O, Praneeta C, Kedar RM, Douglas L A, Michael G D, Susan A G, et al. The North American imaging in multiple sclerosis cooperative (NAIMS), deep grey matter injury in multiple sclerosis. a NAIMS consensus statement. Brain. (2021) 144:1974–84. doi: 10.1093/brain/awab132
4. Enzinger C FF. Measuring gray matter and white matter damage in MS: why this is not enough. Front Neurol. (2015) 6:56. doi: 10.3389/fneur.2015.00056
5. Messina S PF. Gray matters in multiple sclerosis: cognitive impairment and structural MRI. Mult Scler Int. (2014) 2014:609694. doi: 10.1155/2014/609694
6. Raz E CM, Sbardella E, Totaro P, Pozzilli C, et al. Gray- and White-Matter Changes 1 Year after First Clinical Episode of Multiple Sclerosis: Mr Imaging. Radiology. (2010) 257:448–54. doi: 10.1148/radiol.10100626
7. Almsned F, Lipsky RH, Jafri MS. Transcriptomic analysis of multiple sclerosis patient-derived monocytes by RNA-sequencing for candidate gene discovery. Inform Med Unlocked. (2021) 23:100563. doi: 10.1016/j.imu.2021.100563
8. Miljković D SI. Multiple sclerosis: molecular mechanisms and therapeutic opportunities. Antioxid Redox Signal. (2013) 18:2286–334. doi: 10.1089/ars.2012.5068
9. Brosch T, Yoo Y, Li DKB, Traboulsee A, Tam R. Modeling the variability in brain morphology and lesion distribution in multiple sclerosis by deep learning. Med Image Comput Comput Assist Interv MICCAI. (2014) 17:462–9. doi: 10.1007/978-3-319-10470-6_58
10. Cervantes-Gracia K, Husi H. Integrative analysis of multiple sclerosis using a systems biology approach. Sci Rep. (2018) 8:5633. doi: 10.1038/s41598-018-24032-8
11. Freiesleben S, Hecker M, Zettl UK, Fuellen G, Taher L. Analysis of microrna and gene expression profiles in multiple sclerosis: integrating interaction data to uncover regulatory mechanisms. Sci Rep. (2016) 6:34512. doi: 10.1038/srep34512
12. Liu M, Hou X, Zhang P, Hao Y, Yang Y, Wu X, et al. Microarray gene expression profiling analysis combined with bioinformatics in multiple sclerosis. Mol Biol Rep. (2013) 40:3731–7. doi: 10.1007/s11033-012-2449-3
13. Luo D, Fu J. Identifying characteristic mirnas-genes and risk pathways of multiple sclerosis based on bioinformatics analysis. Oncotarget. (2018) 9:5287–300. doi: 10.18632/oncotarget.23866
14. Manuel AM Dai Y, Freeman LA, Jia P, Zhao Z. Dense module searching for gene networks associated with multiple sclerosis. BMC Med Genomics. (2020) 13:48. doi: 10.1186/s12920-020-0674-5
15. McGuinness MJ. A mathematical model of Remyelination in multiple sclerosis. Undergraduate Honors Theses (2017).
16. Navaderi M, Rajaei S, Rahimirad S, Jafari Harandi A, Ghaleh Z, Falahati K, et al. Identification of multiple sclerosis key genetic factors through multi-staged data mining. Multiple Scler Rel Diso. (2020) 39:101446. doi: 10.1016/j.msard.2019.101446
17. Safari-Alighiarloo N, Rezaei-Tavirani M, Taghizadeh M, Tabatabaei SM, Namaki S. Network-based analysis of differentially expressed genes in cerebrospinal fluid (CSF) and blood reveals new candidate genes for multiple sclerosis. PeerJ. (2016) 4:e2775. doi: 10.7717/peerj.2775
18. Shang Z, Sun W, Zhang M, Xu L, Jia X, Zhang R, et al. Identification of key genes associated with multiple sclerosis based on gene expression data from peripheral blood mononuclear cells. PeerJ. (2020) 8:e8357. doi: 10.7717/peerj.8357
19. Yang Q, Pan W, Qian L. Identification of the MIRNA–MRNA regulatory network in multiple sclerosis. Neurol Res. (2017) 39:142–51. doi: 10.1080/01616412.2016.1250857
20. Hanafy KA, Sloane JA. Regulation of remyelination in multiple sclerosis. FEBS Lett. (2011) 585:3821–8. doi: 10.1016/j.febslet.2011.03.048
21. Han MH, Steinman L. Systems biology for identification of molecular networks in multiple sclerosis. Multiple Sclerosis J. (2009) 15:529–30. doi: 10.1177/1352458509103318
22. Kotelnikova E, Bernardo-Faura M, Silberberg G, Kiani NA, Messinis D, Melas IN, et al. Signaling networks in MS: a systems-based approach to developing new pharmacological therapies. Multiple Sclerosis J. (2014) 21:138–46. doi: 10.1177/1352458514543339
23. Muñoz-San Martín M, Reverter G, Robles-Cedeño R, Buxò M, Ortega FJ, Gómez I, et al. Analysis of MIRNA signatures in CSF identifies upregulation of Mir-21 and Mir-146a/B in patients with multiple sclerosis and active lesions. J Neuroinflam. (2019) 16:220. doi: 10.1186/s12974-019-1590-5
24. Diaz-Beltran L, Cano C, Wall DP, Esteban FJ. Systems biology as a comparative approach to understand complex gene expression in neurological diseases. Behavioral Sciences. (2013) 3:253–72. doi: 10.3390/bs3020253
25. Friedman N, Linial M, Nachman I, Pe'er D. Using Bayesian Networks to analyze expression data. In: Proceedings of the Fourth Annual International Conference on Computational Molecular Biology. (2000). p. 127–35. doi: 10.1145/332306.332355
26. Davis S MP. A Bridge between the gene expression omnibus (GEO) and bioconductor. Bioinf. (2007) 14:1846–7. doi: 10.1093/bioinformatics/btm254
27. Scutari M. Bayesian Network constraint-based structure learning algorithms: parallel and optimised implementations in the Bnlearn R package. arXiv preprint arXiv:14067648 (2014).
28. Hao C. Learning Bayesian Network structure from data. Doctoral dissertation, thesis submitted for the degree of MSc in Mathematics. Institute of Mathematics Eötvös Loránd University. (2018).
29. Assenov Y, Albrecht M, Lengauer T. Topological analysis of biological networks. Doctoral dissertation, Max Planck Institute for Informatics. (2006).
30. Su G, Morris JH, Demchak B, Bader GD. Biological Network Exploration with Cytoscape 3. Curr Protoc Bioinform. (2014) 47:8.13.1–8.0.24. doi: 10.1002/0471250953.bi0813s47
31. Cline MS, Smoot M, Cerami E, Kuchinsky A, Landys N, Workman C, et al. Integration of biological networks and gene expression data using cytoscape. Nat Protoc. (2007) 2:2366–82. doi: 10.1038/nprot.2007.324
32. Chin C-H, Chen S-H, Wu H-H, Ho C-W, Ko M-T, Lin C-Y. Cytohubba: Identifying hub objects and sub-networks from complex interactome. BMC Syst Biol. (2014) 8:S11–S. doi: 10.1186/1752-0509-8-S4-S11
33. Assenov Y, Ramírez F, Schelhorn S-E, Lengauer T, Albrecht M. Computing topological parameters of biological networks. Bioinformatics. (2007) 24:282–4. doi: 10.1093/bioinformatics/btm554
34. Zhou Y, Zhou B, Pache L, Chang M, Khodabakhshi AH, Tanaseichuk O, et al. Metascape provides a biologist-oriented resource for the analysis of systems-level datasets. Nat Communic. (2019) 10:1523. doi: 10.1038/s41467-019-09234-6
35. Giaimo BD, Oswald F, Borggrefe T. Dynamic chromatin regulation at notch target genes. Transcription. (2017) 8:61–6. doi: 10.1080/21541264.2016.1265702
36. Detanico T, Virgen-Slane R, Steen-Fuentes S, Lin WW, Rhode-Kurnow A, Chappell E, et al. Co-expression networks identify DHX15 RNA helicase as a B Cell regulatory factor. Front Immunol. (2019) 10:2903. doi: 10.3389/fimmu.2019.02903
37. Newman MEJ. The structure and function of complex networks. SIAM Review. (2003) 45:167–256. doi: 10.1137/S003614450342480
38. Barabási A-L, Gulbahce N, Loscalzo J. Network medicine: a network-based approach to human disease. Nat Rev Genet. (2010) 12:56. doi: 10.1038/nrg2918
39. Giurgiu M, Reinhard J, Brauner B, Dunger-Kaltenbach I, Fobo G, Frishman G, et al. CORUM: the comprehensive resource of mammalian protein complexes-−2019. Nucleic Acids Res. (2019) 47:D559–63. doi: 10.1093/nar/gky973
40. Barateiro A, Afonso V, Santos G, Cerqueira JJ, Brites D, van Horssen J, et al. S100b as a potential biomarker and therapeutic target in multiple sclerosis. Mol Neurobiol. (2016) 53:3976–91. doi: 10.1007/s12035-015-9336-6
41. Komatsu K, Andoh A, Ishiguro S, Suzuki N, Hunai H, Kobune-Fujiwara Y, et al. Increased expression of S100a6 (Calcyclin), a calcium-binding protein of the S100 family, in human colorectal adenocarcinomas. Clin Cancer Res. (2000) 6:172–7.
42. Peterova E, Bures J, Moravkova P, Kohoutova D. Tissue MRNA for S100a4, S100a6, S100a8, S100a9, S100a11, and S100p proteins in colorectal neoplasia: A pilot study. Molecules. (2021) 26:402. doi: 10.3390/molecules26020402
43. Bartkowska K, Swiatek I, Aniszewska A, Jurewicz E, Turlejski K, Filipek A, et al. Stress-dependent changes in the Cacybp/Sip interacting protein S100a6 in the mouse brain. PLoS ONE. (2017) 12:e0169760. doi: 10.1371/journal.pone.0169760
44. Tsai M-H, Lin C-H, Tsai K-W, Lin M-H, Ho C-J, Lu Y-T, et al. S100a6 Promotes B lymphocyte penetration through the blood–brain barrier in autoimmune encephalitis. Front Genet. (2019) 10:1188. doi: 10.3389/fgene.2019.01188
45. Donato R, Cannon BR, Sorci G, Riuzzi F, Hsu K, Weber DJ, et al. Functions of S100 Proteins. Curr Mol Med. (2013) 13:24–57. doi: 10.2174/156652413804486214
46. Leśniak W, Słomnicki Ł P, Filipek A. S100a6 - New Facts and Features. Biochem Biophys Res Commun. (2009) 390:1087–92. doi: 10.1016/j.bbrc.2009.10.150
47. Dubey J, Ratnakaran N, Koushika SP. Neurodegeneration and microtubule dynamics: death by a thousand cuts. Front Cell Neurosci. (2015) 9:343. doi: 10.3389/fncel.2015.00343
48. Aiken J, Buscaglia G, Bates EA, Moore JK. The A-tubulin gene tuba1a in brain development: a key ingredient in the neuronal isotype blend. J Dev Biol. (2017) 5:8. doi: 10.3390/jdb5030008
49. Matamoros AJ, Baas PW. Microtubules in health and degenerative disease of the nervous system. Brain Res Bull. (2016) 126:217–25. doi: 10.1016/j.brainresbull.2016.06.016
50. Sferra A, Nicita F, Bertini E. Microtubule dysfunction: a common feature of neurodegenerative diseases. Int J Mol Sci. (2020) 21:7354. doi: 10.3390/ijms21197354
51. Kim JM, Lee KH, Jeon YJ, Oh JH, Jeong SY, Song IS, et al. Identification of genes related to Parkinson's disease using expressed sequence tags. DNA Res. (2006) 13:275–86. doi: 10.1093/dnares/dsl016
52. Zhang H, Chen X, Bollag WB, Bollag RJ, Sheehan DJ, Chew CS. Lasp1 gene disruption is linked to enhanced cell migration and tumor formation. Physiol Genomics. (2009) 38:372–85. doi: 10.1152/physiolgenomics.00048.2009
53. Phillips GR, Anderson TR, Florens L, Gudas C, Magda G, Yates JR, et al. Actin-binding proteins in a postsynaptic preparation: lasp-1 is a component of central nervous system synapses and dendritic spines. J Neurosci Res. (2004) 78:38–48. doi: 10.1002/jnr.20224
54. He Y, Casaccia-Bonnefil P. The Yin and Yang of Yy1 in the nervous system. J Neurochem. (2008) 106:1493–502. doi: 10.1111/j.1471-4159.2008.05486.x
55. Berndt JA, Kim JG, Tosic M, Kim C, Hudson LD. The transcriptional regulator Yin Yang 1 activates the myelin PLP gene. J Neurochem. (2001) 77:935–42. doi: 10.1046/j.1471-4159.2001.00307.x
56. Chen ZS, Chan HYE. Transcriptional dysregulation in neurodegenerative diseases: who tipped the balance of Yin Yang 1 in the brain? Neural Regener Res. (2019) 14:1148–51. doi: 10.4103/1673-5374.251193
57. Lee J-U, Kim L-K, Choi J-M. Revisiting the concept of targeting Nfat to control T cell immunity and autoimmune diseases. Front Immunol. (2018) 9:2747. doi: 10.3389/fimmu.2018.02747
58. Serrano-Pérez MC, Martín ED, Vaquero CF, Azcoitia I, Calvo S, Cano E, et al. Response of transcription factor Nfatc3 to excitotoxic and traumatic brain insults: identification of a subpopulation of reactive astrocytes. Glia. (2011) 59:94–107. doi: 10.1002/glia.21079
59. Mastrogiovanni M, Juzans M, Alcover A, Di Bartolo V. Coordinating cytoskeleton and molecular traffic in T cell migration, activation, and effector functions. Front Cell Developm Biol. (2020) 8:1138. doi: 10.3389/fcell.2020.591348
60. Wu L, Lin W, Liao Q, Wang H, Lin C, Tang L, et al. Calcium channel blocker nifedipine suppresses colorectal cancer progression and immune escape by preventing Nfat2 nuclear translocation. Cell Rep. (2020) 33:108327. doi: 10.1016/j.celrep.2020.108327
61. Pan MG, Xiong Y, Chen F. Nfat gene family in inflammation and cancer. Curr Mol Med. (2013) 13:543–54. doi: 10.2174/1566524011313040007
62. Gulick E, Namey M. Bowel dysfunction in persons with multiple sclerosis. In: Constipation–Causes, Diagnosis And Treatment (2012).
63. Orth MF, Cazes A, Butt E, Grunewald TGP. An update on the LIM and Sh3 domain protein 1 (Lasp1): A versatile structural, signaling, and biomarker protein. Oncotarget. (2015) 6:26. doi: 10.18632/oncotarget.3083
64. Wang XH, Du H, Li L, Shao DF, Zhong XY, Hu Y, et al. Increased expression of S100a6 promotes cell proliferation in gastric cancer cells. Oncol Lett. (2017) 13:222–30. doi: 10.3892/ol.2016.5419
65. Butt E, Raman D. New frontiers for the cytoskeletal protein Lasp1. Front Oncol. (2018) 8:391. doi: 10.3389/fonc.2018.00391
66. Li Z, Chen Y, Wang X, Zhang H, Zhang Y, Gao Y, et al. Lasp-1 induces proliferation, metastasis and cell cycle arrest at the G2/M phase in gallbladder cancer by down-regulating S100p Via the Pi3k/Akt pathway. Cancer Lett. (2016) 372:239–50. doi: 10.1016/j.canlet.2016.01.008
67. Grunewald TG, Butt E. The LIM and SH3 domain protein family: structural proteins or signal transducers or both? Molec Cancer. (2008) 7:31. doi: 10.1186/1476-4598-7-31
68. Zheng J, Yu S, Qiao Y, Zhang H, Liang S, Wang H, et al. Lasp-1 promotes tumor proliferation and metastasis and is an independent unfavorable prognostic factor in gastric cancer. J Cancer Res Clin Oncol. (2014) 140:1891–9. doi: 10.1007/s00432-014-1759-3
69. Zhao L, Wang H, Liu C, Liu Y, Wang X, Wang S, et al. Promotion of colorectal cancer growth and metastasis by the LIM and SH3 domain protein1. Gut. (2010) 59:1226–35. doi: 10.1136/gut.2009.202739
Keywords: multiple sclerosis (MS), Bayesian network, transcriptome, Cytoscape, qPCR
Citation: Karimi N, Motovali-Bashi M and Ghaderi-Zefrehei M (2023) Gene network reveals LASP1, TUBA1C, and S100A6 are likely playing regulatory roles in multiple sclerosis. Front. Neurol. 14:1090631. doi: 10.3389/fneur.2023.1090631
Received: 05 November 2022; Accepted: 10 February 2023;
Published: 09 March 2023.
Edited by:
Honghao Wang, Guangzhou First People's Hospital, ChinaReviewed by:
Yongchang Li, Xinjiang Agricultural University, ChinaCandice Brinkmeyer-Langford, Texas A&M University, United States
Copyright © 2023 Karimi, Motovali-Bashi and Ghaderi-Zefrehei. This is an open-access article distributed under the terms of the Creative Commons Attribution License (CC BY). The use, distribution or reproduction in other forums is permitted, provided the original author(s) and the copyright owner(s) are credited and that the original publication in this journal is cited, in accordance with accepted academic practice. No use, distribution or reproduction is permitted which does not comply with these terms.
*Correspondence: Majid Motovali-Bashi, bWJhc2hpQHNjaS51aS5hYy5pcg==; Mostafa Ghaderi-Zefrehei, bWdoYWRlcmlAeXUuYWMuaXI=; bW9zbW9zNzQxQHlhaG9vLmNvbQ==
†These authors have contributed equally to this work and share first authorship