
95% of researchers rate our articles as excellent or good
Learn more about the work of our research integrity team to safeguard the quality of each article we publish.
Find out more
ORIGINAL RESEARCH article
Front. Neurol. , 27 July 2022
Sec. Applied Neuroimaging
Volume 13 - 2022 | https://doi.org/10.3389/fneur.2022.903263
This article is part of the Research Topic Neuroimaging Study of Post-Stroke Cerebral Edema View all 16 articles
 Tianqi Xu1†
 Jianhong Yang1†
 Qing Han1†Yuefei Wu1Xiang Gao2Yao Xu1
 Yi Huang2,3Aiju Wang4
 Mark W. Parsons5,6*
 Longting Lin1,5*
Objective: We hypothesized that quantitative net water uptake (NWU), a novel neuroimaging marker of early brain edema, can predict symptomatic intracranial hemorrhage (sICH) after acute ischemic stroke (AIS).
Methods: We enrolled patients with AIS who completed admission multimodal computed tomography (CT) within 24 h after stroke onset. NWU within the ischemic core and penumbra was calculated based on admission CT, namely NWU-core and NWU-penumbra. sICH was defined as the presence of ICH in the infarct area within 7 days after stroke onset, accompanied by clinical deterioration. The predictive value of NWU-core and NWU-penumbra on sICH was evaluated by logistic regression analyses and the receiver operating characteristic (ROC) curve. A pure neuroimaging prediction model was built considering imaging markers, which has the potential to be automatically quantified with an artificial algorithm on image workstation.
Results: 154 patients were included, of which 93 underwent mechanical thrombectomy (MT). The median time from symptom onset to admission CT was 262 min (interquartile range, 198–368). In patients with MT, NWU-penumbra (OR =1.442; 95% CI = 1.177–1.766; P < 0.001) and NWU-core (OR = 1.155; 95% CI = 1.027–1.299; P = 0.016) were independently associated with sICH with adjustments for age, sex, time from symptom onset to CT, hypertension, lesion volume, and admission National Institutes of Health Stroke Scale (NIHSS) score. ROC curve showed that NWU-penumbra had better predictive performance than NWU-core on sICH [area under the curve (AUC): 0.773 vs. 0.673]. The diagnostic efficiency of the predictive model was improved with the containing of NWU-penumbra (AUC: 0.853 vs. 0.760). A pure imaging model also presented stable predictive power (AUC = 0.812). In patients without MT, however, only admission NIHSS score (OR = 1.440; 95% CI = 1.055–1.965; P = 0.022) showed significance in predicting sICH in multivariate analyses.
Conclusions: NWU-penumbra may have better predictive performance than NWU-core on sICH after MT. A pure imaging model showed potential value to automatically screen patients with sICH risk by image recognition, which may optimize treatment strategy.
Brain edema is an important pathophysiological process after acute ischemic stroke (AIS). The pathophysiological mechanisms are primarily cytotoxic edema, angiogenic edema, and cerebrospinal fluid influx (1, 2). Progressive edema will lead to irreversible tissue injury, secondary neurological deterioration, and poor outcome (3). Current assessments of brain edema degree are mainly based on follow-up non-contrast computed tomography (NCCT), as brain edema peaks around 3 days after stroke onset (4). Imaging characteristics such as shrunken sulci, low density around infarct core, midline shift, and even brain hernia suggest brain edema indirectly (5). However, there are few neuroimaging markers able to detect brain edema early, directly, and quantitatively, and none of these neuroimaging markers were available in CT until recently (6).
Quantitative net water uptake (NWU) is a relatively novel neuroimaging marker of early brain edema after AIS, first described in 2016 based on admission multimodal CT (7). Researchers subsequently reported that NWU within the ischemic core can identify patients within the thrombolysis time window and predict poor outcomes at 90 days, and those with malignant edema (8–10). In the hyperacute stage of AIS, cytotoxic edema will lead to endothelial cell swelling, further blood-brain barrier (BBB) breakdown, increased permeability, and ultimately may contribute to hemorrhagic transformation (HT). Previous research reported that NWU within the ischemic core was a predictor of HT in patients with successful reperfusion (11). In this study, NWU within the ischemic core and the ischemic penumbra were calculated separately. The predictive values of NWU-core and NWU-penumbra on symptomatic intracranial hemorrhages (sICH) after AIS were further investigated.
This is a single-institute retrospective study. The clinical and imaging data were obtained from an established database, which contains data from all patients with AIS admitted to the Emergency Department at Ningbo First Hospital (Advanced Stroke Center) between July 2017 and September 2019. Inclusion criteria: (1) acute anterior circulation infarction; (2) admission multimodal CT including NCCT, CT angiography (CTA), and CT perfusion (CTP) were completed within 24 h after symptom onset. In patients with wake-up stroke, we estimated the time of stroke onset by taking the midpoint between sleep time and wake time (12); (3) follow-up CT scans performed at 24 h and 1 week after stroke onset or immediately in case of clinical deterioration; (4) the absence of intracranial hemorrhage, brain tumor, or preexisting infarctions in admission NCCT. The thrombolysis in cerebral infarction (TICI) grading scale is used to define endpoints of successful revascularization (13).
According to the European Cooperative Acute Stroke Study (ECASS) II criteria, hemorrhagic transformation (HT) of infarcted brain tissue can be divided into four types, including HI1 (scattered small petechiae, no mass effect), HI2 (confluent petechiae, no mass effect), PH1 (hematoma within infarcted tissue, occupying <30%, no substantive mass effect), and PH2 (hematoma occupying 30% or more of the infarcted tissue, with obvious mass effect). sICH was defined as the presence of hemorrhagic hyperdensity in the infarction area on follow-up CT scans within 7 days, accompanied by clinical deterioration (an NIHSS score increase ≥ 4 from baseline) (14, 15) with no explanation for the clinical deterioration other than secondary intracerebral hemorrhage.
Admission multimodal CT was conducted by a 320-slice scanner (Toshiba Aquilion ONE, Canon Medical Imaging, Tokyo, Japan) with 320 axial sections and 0.5 mm thickness. All imaging data were processed by commercial software (MIstar, Apollo Medical Imaging Technology, Melbourne, VIC, Australia). CTP was used to identify the ischemic core and ischemic penumbra. The threshold of ischemic core was delay time (DT) > 3 s and cerebral blood flow (CBF) <30%. The threshold of ischemic penumbra was DT > 3 s and CBF > 30% (16). Regions of interest (ROIs) corresponding to the ischemic core and penumbra according to these thresholds were drawn manually, and mirrored contralateral ROIs were generated automatically and defined as normal tissue. These ROIs were then superimposed on NCCT to measure CT density (Dre, Dpenra, and Dnra) with Hounsfield units (HU) between 20 and 80 (Figure 1). NWU-core was defined as an elevated volume of water (Δ ater) per unit volume of ischemic core (core). Similarly, NWU-penumbra was defined as Δ ater per unit volume of ischemic penumbra (penumbra), according to the following equations (6, 7):
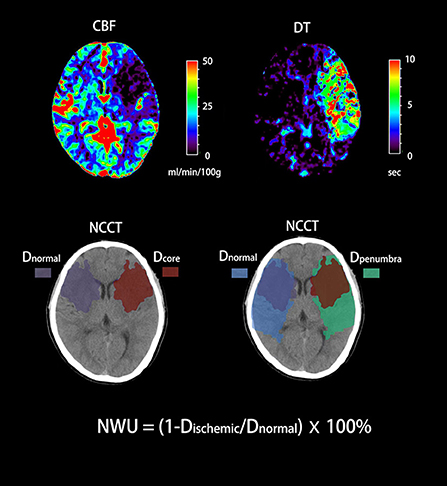
Figure 1. Quantification of NWU-core and NWU-penumbra in admission CT. CBV and DT maps based on CTP were used to identify the ischemic core and penumbra with the setting of different thresholds. The mean density of the ischemic core, ischemic penumbra, and normal tissue derived from mirrored contralateral were then calculated (Dre, Dpenra, and Dnra).
We performed the statistical analyses under the supervision of professional statisticians. SPSS version 22.0 (SPSS Inc, Chicago, IL, USA), MedCalc version 20.027 (MedCalc Software Ltd, Ostend, Belgium), and GraphPad Prism version 8.0 (GraphPad Software, San Diego, CA, USA) were used in these analyses. Baseline characteristics were compared between patients with and without sICH. For continuous variables that followed a normal distribution, data were expressed as mean ± SD, and the t-test was used for group comparison. For non-normal continuous variables, data were presented in the form of the medians (interquartile ranges), and the Mann–Whitney U test was applied. Categorical variables were expressed as frequencies (%) using the χ2 test or Fisher's test as appropriate. Univariate logistic regression analyses were used to explore the associations between sICH, NWU-core, and NWU-penumbra. Backward stepwise multivariate logistic regression analyses were then performed. We used age, sex, admission NIHSS score, time from symptom onset to CT, lesion volume, and variables with P < 0.10 in the univariate analyses as covariates. The variance inflation factor (VIF) was calculated to examine multicollinearity among variables included in regression models. Predictive models containing NWU-core and NWU-penumbra were further built. The predictive power of NWU-core, NWU-penumbra, and regression models were measured by receiver operating characteristic (ROC) curve analysis.
A total of 154 patients with acute anterior circulation ischemic stroke were included in the study. There were 58 cases of HT (37.7%), including 8 cases of HI1 (5.2%), 24 cases of HI2 (15.6%), 12 cases of PH1 (7.8%), and 14 cases of PH2 (9.1%). sICH occurred in 28 patients (18.2%). Table 1 shows the baseline characteristics of patients. The median time from symptom onset to multimodal CT was 262 min (interquartile range, 198–368). Compared with non-sICH patients, patients with sICH have higher median admission NIHSS score [21 (15–28) vs. 17 (12–21), P = 0.008], higher median ischemic core volume [48 (32–62) vs. 24 (9–45), P < 0.001], higher median NWU-core [8.2 (5.8–10.9) vs. 5.3 (2.7–7.9), P = 0.015] and higher median NWU-penumbra [3.6 (2.1–5.1) vs. 0.9 (−1.5 to 3.5), P < 0.001].
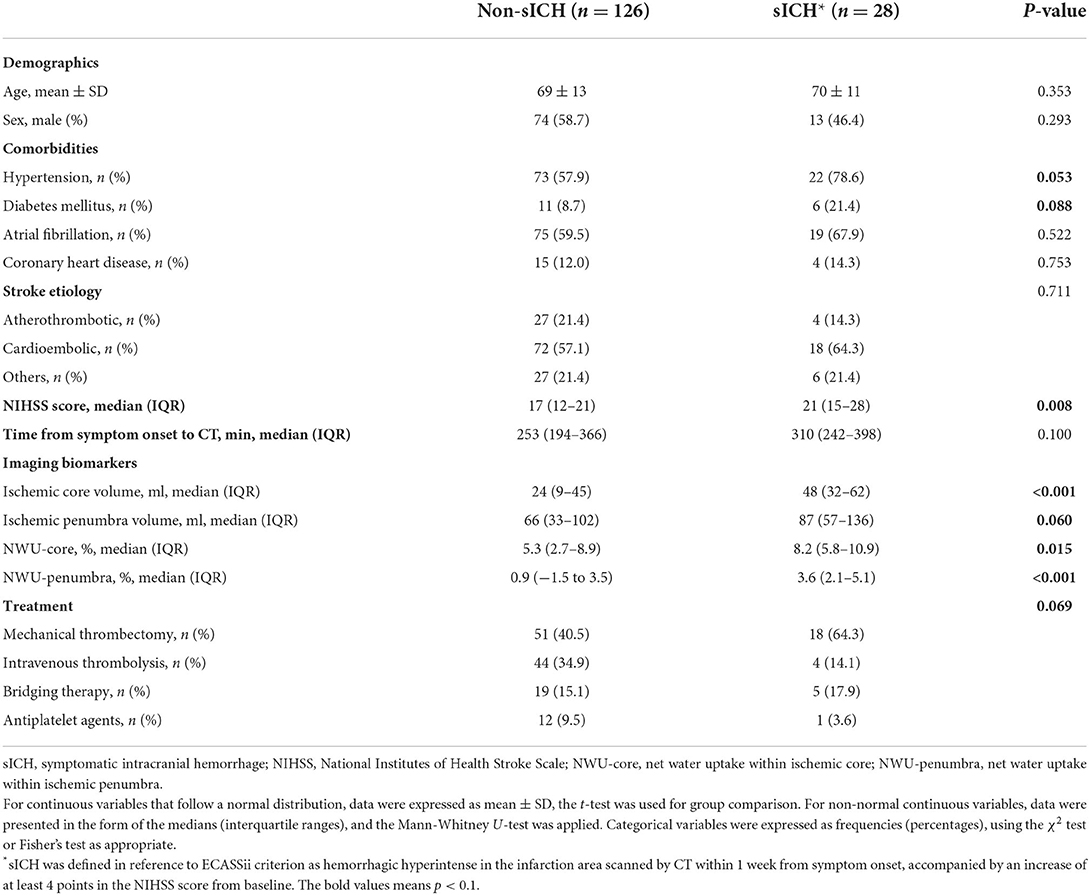
Table 1. Baseline characteristics of enrolled patients.
Among the 154 enrolled patients, 93 underwent MT, of which 73 patients (78.5%) received successful reperfusion according to the TICI grading scale. Of the 61 patients who did not receive MT, 48 underwent intravenous thrombolysis and 13 received antiplatelet agents only. Supplementary Table 1 shows patient's demographics of group MT vs. non-MT and indicates that 23 (82.1%) of the 28 patients with sICH underwent MT. Figure 2 shows the data distributions of NWU-core and NWU-penumbra. In the MT group, patients with sICH had higher NWU-core [8.8 (6.0–10.9) vs. 5.0 (2.8–9.0), P = 0.013] and higher NWU-penumbra [2.6 (3.6–5.1) vs. 0.7 (−1.2 to 3.4), P < 0.001]. Univariate analysis showed that hypertension (OR = 3.812; 95% CI = 1.274–11.406; P = 0.017), ischemic core volume (OR = 1.014; 95% CI = 1.001–1.027; P = 0.034), NWU-core (OR = 1.143; 95% CI = 1.024–1.277; P = 0.018), and NWU-penumbra (OR =1.431; 95% CI = 1.159–1.766; P = 0.001) were associated with sICH after MT. However, in patients without MT, none of the imaging biomarkers showed significance, only admission NIHSS score (OR = 1.237; 95% CI = 1.066–1.434; P = 0.005) and diabetes mellitus (OR = 11.778; 95% CI = 1.394–99.511; P = 0.024) were significantly correlated with sICH (Table 2). The associations between NWU-core and NWU-penumbra with different types of HT are shown in Supplementary Table 2.
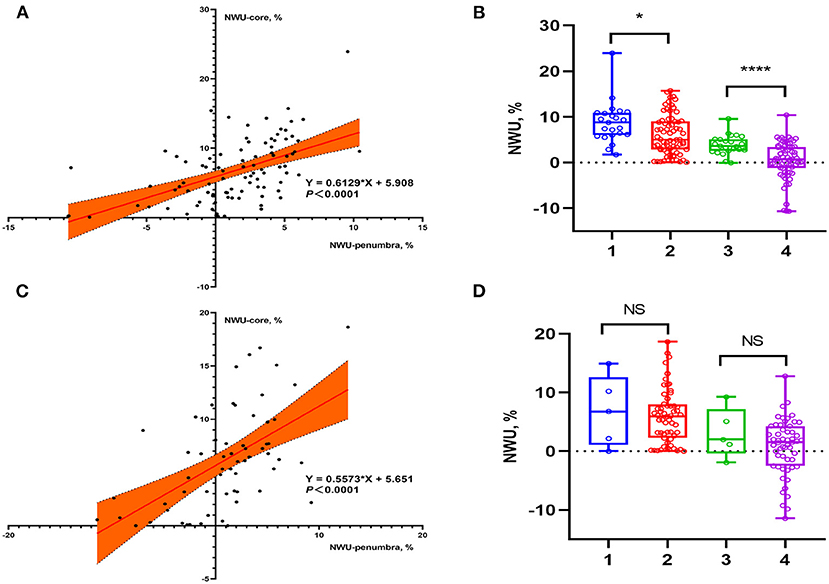
Figure 2. Data distributions of NWU-core and NWU-penumbra in patients stratified by reperfusion therapies. (A) Scatter plot showed the relationship between NWU-core and NWU-penumbra in patients with MT. (B) Group 1: NWU-core of sICH patients, group 2: NWU-core of non-sICH patients, group 3: NWU-penumbra of sICH patients, group 4: NWU-penumbra of non-sICH patients. Box plot showed that in patients with MT, sICH group had higher NWU-core [8.8 (6.0–10.9) vs. 5.0 (2.8–9.0), P = 0.013] and NWU-penumbra [2.6 (3.6–5.1) vs. 0.7 (−1.2 to 3.4), P < 0.001] than those without sICH. (C) Scatter plot showed the relationship between NWU-core and NWU-penumbra in patients without MT. (D) Group 1: NWU-core of sICH patients, group 2: NWU-core of non-sICH patients, group 3: NWU-penumbra of sICH patients, group 4: NWU-penumbra of non-sICH patients. Box plot showed that in patients without MT, there was no statistical difference in NWU-core [6.8 (1.1–12.6) vs. 6.0 (2.3–8.0), P = 0.885] and NWU-penumbra [2.0 (−0.4 to 7.2) vs. 1.5 (−2.8 to 4.1), P = 0.318] between sICH and non-sICH group. * p < 0.05; ** p < 0.01; *** p < 0.001; **** p < 0.0001.
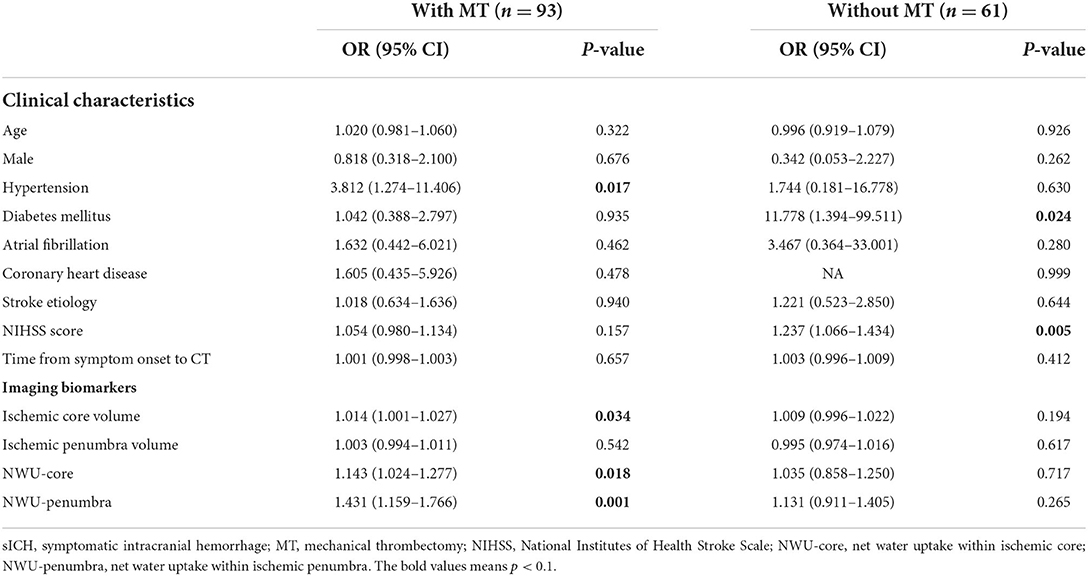
Table 2. Univariate logistic regression analysis for risk of sICH in patients stratified by reperfusion therapies.
Table 3 shows four different predictive models of sICH in patients with MT. Model 1 was built without NWU for subsequent comparison. Models 2 and 3 included NWU-core and NWU-penumbra separately as they were correlated (Spearman correlation coefficient = 0.555; P < 0.001). Model 4 contained only imaging markers. We found that NWU-penumbra (OR = 1.442; 95% CI = 1.177–1.766; P < 0.001) and NWU-core (OR = 1.155; 95% CI = 1.027–1.299; P = 0.016) were independently associated with sICH after adjustment for age, sex, admission NIHSS score, time from symptom onset to CT, lesion volume, and hypertension. The imaging-only model contained ischemic core volume (OR = 1.017; 95% CI = 1.001–1.033; P = 0.034) and NWU-penumbra (OR = 1.412; 95% CI = 1.150–1.735; P = 0.001). In patients without MT, only admission NIHSS score (OR = 1.440; 95% CI = 1.055–1.965; P = 0.022) was independently associated with sICH.
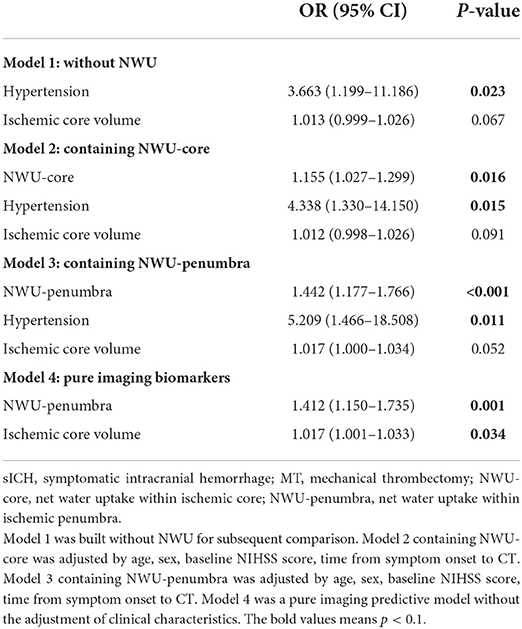
Table 3. Multivariable logistic regression analysis for predictive models of sICH in patients with MT.
With multivariate regression analysis, we discovered that NWU-penumbra and NWU-core were independently associated with sICH in the MT group and built four different predictive models. ROC curve analyses were conducted to test the predictive power of individual variables for models predicting sICH. Figure 3 shows that the area under the curve (AUC) of NWU-penumbra was higher than that of NWU-core (0.773 vs. 0.673). The diagnostic efficiency of the predictive model was improved with the inclusion of NWU-penumbra (AUC of model 3 vs. model 1 = 0.853 vs. 0.760). The pure imaging predictive model also demonstrated a stable predictive effect (AUC of model 4 = 0.812). It is also noteworthy that NWU-penumbra demonstrated high sensitivity (91.30; 95% CI = 72.0–98.9) in predicting sICH with an optimal cut point of 1.7%. Supplementary Figure 1 shows the illustrative cases for high NWU with sICH vs. low NWU without sICH.
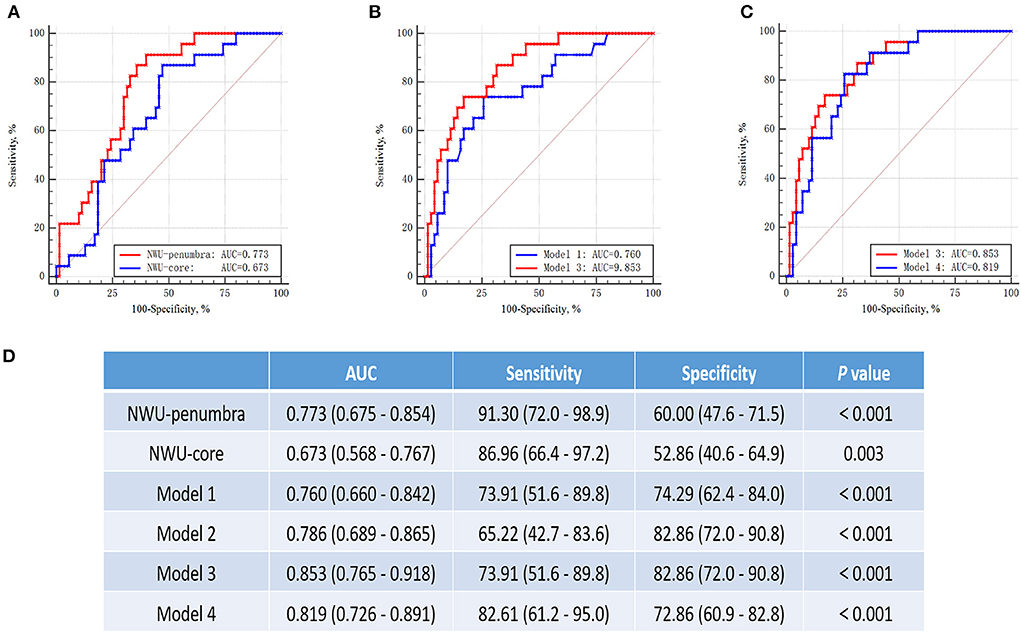
Figure 3. ROC curves for prediction of sICH in patients with mechanical thrombectomy. (A) The ROC curves of NWU-penumbra vs. NWU-core (AUC: 0.773 vs. 0.673). (B) The ROC curves of model 1 vs. model 3 (AUC: 0.760 vs. 0.853). (C) The curves of model 3 vs. model 4 (AUC: 0.853 vs. 0.812). (D) Table showed the data of ROC curve analysis.
In this research, quantitative NWU was used to assess the degree of early post-stroke brain edema within the ischemic core and penumbra separately. We found that NWU-penumbra may have a better value than NWU-core for predicting sICH after MT, and a pure imaging model containing NWU-penumbra and ischemic core volume showed a potential value for predicting sICH after MT independent of clinical variables.
Quantitative NWU, based on admission multimodal CT, has been described as a novel neuroimaging marker of early brain edema (6, 7). The NWU began immediately after AIS with the extravasation of fluid into ischemic tissue through the BBB, which may allow the detection of ionic edema earlier and more sensitively than previous methods (17). Previous studies reported that NWU within the ischemic core was an independent predictor for patients with AIS developing malignant edema (9, 18, 19) and poor neurological outcomes (8, 10). The cerebral ischemic lesion consists of a central irreversible necrotic zone and reversible peripheral ischemic penumbra. One of the main findings in our study was that NWU-penumbra demonstrates better predictive performance than NWU-core on sICH after MT. The most likely mechanisms for this water uptake involve disruption of the BBB caused by cytotoxic edema and angiogenic edema (20, 21). Although speculative, the presence and elevation of early brain edema within the penumbra may indicate a more serious tissue injury and damage expansion. Timely reperfusion can salvage ischemic penumbra but may also aggravate BBB destruction due to reperfusion injury. Tissue edema may compress the small blood vessels, leading to the impairment of microcirculation, which may contribute to vascular endothelial injury and secondary hemorrhage (22). Previous studies indicated that NWU-core was associated with HT within 36 h after successful endovascular treatment (11, 23). In this study, we focused on sICH within 7 days after stroke onset, which was defined as the presence of HT accompanied by clinical deterioration (the NIHSS score increased by more than 4 points from baseline). From a clinical perspective, sICH is strongly related to patient outcomes and often leads to longer hospital stays and more attention from neurologists to optimize treatment strategies, such as reducing intraoperative heparin dosage, avoiding dual antiplatelet, and appropriate blood pressure management. This study showed that in patients with AIS without MT, the predictive value of NWU on sICH might be overwhelmed by the admission NIHSS score. This result may be explained by an insufficient number of patients and a comparably low incidence of sICH among patients without MT. Patients who received MT tended to have larger vessel occlusions and had a higher recanalization probability, which may result in more severe reperfusion injury and BBB disruption. The surgery itself can also cause damage to blood vessels.
In this study, we examined several different models for predicting sICH after MT and found that the inclusion of NWU-penumbra significantly improved the predictive power of such models. Importantly, the pure imaging model containing NWU-penumbra and ischemic core volume also showed a stable predictive value for sICH after MT. In most hospitals, CT at admission is the standard care for patients with AIS, with the advantages of being widely and rapidly available and intrinsically quantitative (24). Therefore, compared with other predictors for sICH, such as serum occludin level, interleukin-33, and platelet-to-lymphocyte ratio (25–27), imaging makers would be comparatively simple and practical. A pure imaging model that does not include clinical characteristics may have the potential to be calculated automatically on the image workstation through deep neural networks (28). In future studies, the imaging model may be served as part of the computer-aided diagnosis systems to screen patients at sICH risk before treatment.
Our study has some limitations. Foremost, is the fact that it was a retrospective and single-center study. Further external validation trials in larger cohorts are required before clinical implementation. Secondly, the incidence of sICH was relatively low in the non-MT group, which may result in insufficient statistical power.
In conclusion, we found that NWU-penumbra had better predictive performance than NWU-core on sICH after MT. The pure imaging model based on admission CT may automatically flag patients with elevated sICH risk. It helps further hypothesis generation to better identify patients at risk of reperfusion injury or parenchymal hemorrhagic transformation in patients undergoing endovascular thrombectomy.
The raw data supporting the conclusions of this article will be made available by the authors, without undue reservation.
The studies involving human participants were reviewed and approved by Ningbo First Hospital, Ningbo Hospital of Zhejiang University. The patients/participants provided their written informed consent to participate in this study.
TX: conceptualization, methodology, formal analysis, and writing-original draft. JY: project administration. QH: data curation. YW, YX, and AW: resources. XG, YH, and YX: funding acquisition. MP and LL: validation and writing-review and editing. All authors contributed to the article and approved the submitted version.
This study was supported by Ningbo Health Branding Subject Fund (PPXK2018-04) and Medicine and Health Science and Technology Projects of Zhejiang Province (2022KY305, 2022KY322, 2019KY162).
The authors declare that the research was conducted in the absence of any commercial or financial relationships that could be construed as a potential conflict of interest.
All claims expressed in this article are solely those of the authors and do not necessarily represent those of their affiliated organizations, or those of the publisher, the editors and the reviewers. Any product that may be evaluated in this article, or claim that may be made by its manufacturer, is not guaranteed or endorsed by the publisher.
The Supplementary Material for this article can be found online at: https://www.frontiersin.org/articles/10.3389/fneur.2022.903263/full#supplementary-material
Supplementary Figure 1. Illustrative cases for high NWU with sICH vs. low NWU without sICH. Case 1 (A–C), (A) lesion map, green region represents ischemic penumbra and red represents ischemic core. (B) NCCT with hand-drawn ROI, NWU-core = 4.8%, NWU-penumbra = −0.5%. (C) Follow-up CT didn't indicate ICH. Case 2 (D–F), (D) lesion map, green region represents ischemic penumbra and red represents ischemic core. (E) NCCT with hand-drawn ROI, NWU-core = 11.3%, NWU-penumbra = 5.1%. (F) Follow-up CT indicates parenchymatous hematoma in the basal ganglia.
Supplementary Table 1. Patient's demographics of group MT vs. non-MT.
Supplementary Table 2. Univariate logistic regression analysis for risks of NWU-core and NWU-penumbra on different types of HT.
1. Stokum JA, Gerzanich V, Simard JM. Molecular pathophysiology of cerebral edema. J Cereb Blood Flow Metab. (2016) 36:513–38. doi: 10.1177/0271678X15617172
2. Mestre H, Du T, Sweeney AM, Liu G, Samson AJ, Peng W, et al. Cerebrospinal fluid influx drives acute ischemic tissue swelling. Science. (2020) 367:eaax7171. doi: 10.1126/science.aax7171
3. Battey TW, Karki M, Singhal AB, Wu O, Sadaghiani S, Campbell BC, et al. Brain edema predicts outcome after nonlacunar ischemic stroke. Stroke. (2014) 45:3643–8. doi: 10.1161/STROKEAHA.114.006884
4. Gotoh O, Asano T, Koide T, Takakura K. Ischemic brain edema following occlusion of the middle cerebral artery in the rat. I: the time courses of the brain water, sodium and potassium contents and blood-brain barrier permeability to 125i-albumin. Stroke. (1985) 16:101–9. doi: 10.1161/01.STR.16.1.101
5. Walberer M, Blaes F, Stolz E, Muller C, Schoenburg M, Tschernatsch M, et al. Midline-shift corresponds to the amount of brain edema early after hemispheric stroke–an mri study in rats. J Neurosurg Anesthesiol. (2007) 19:105–10. doi: 10.1097/ANA.0b013e31802c7e33
6. Broocks G, Flottmann F, Ernst M, Faizy TD, Minnerup J, Siemonsen S, et al. Computed tomography–based imaging of voxel-wise lesion water uptake in ischemic brain. Invest Radiol. (2018) 53:207–13. doi: 10.1097/RLI.0000000000000430
7. Minnerup J, Broocks G, Kalkoffen J, Langner S, Knauth M, Psychogios MN, et al. Computed tomography-based quantification of lesion water uptake identifies patients within 4.5 hours of stroke onset: a multicenter observational study. Ann Neurol. (2016) 80:924–34. doi: 10.1002/ana.24818
8. Broocks G, Kemmling A, Tessarek S, McDonough R, Meyer L, Faizy TD, et al. Quantitative lesion water uptake as stroke imaging biomarker: a tool for treatment selection in the extended time window? Stroke. (2022) 53:201–9. doi: 10.1161/STROKEAHA.120.033025
9. Broocks G, Flottmann F, Scheibel A, Aigner A, Faizy TD, Hanning U, et al. Quantitative lesion water uptake in acute stroke computed tomography is a predictor of malignant infarction. Stroke. (2018) 49:1906–12. doi: 10.1161/STROKEAHA.118.020507
10. Nawabi J, Flottmann F, Kemmling A, Kniep H, Leischner H, Sporns P, et al. Elevated early lesion water uptake in acute stroke predicts poor outcome despite successful recanalization – when “tissue clock” and “time clock” are desynchronized. Int J Stroke. (2021) 16:863–72. doi: 10.1177/1747493019884522
11. Nawabi J, Kniep H, Schön G, Flottmann F, Leischner H, Kabiri R, et al. Hemorrhage after endovascular recanalization in acute stroke: lesion extent, collaterals and degree of ischemic water uptake mediate tissue vulnerability. Front Neurol. (2019) 10:569. doi: 10.3389/fneur.2019.00569
12. Henry M, Bruce C, Mark P, Leonid C, Christopher L, Chung H, et al. Thrombolysis guided by perfusion imaging up to 9 hours after onset of stroke. N Engl J Med. (2019) 380:1795–803. doi: 10.1056/NEJMoa1813046
13. Fugate JE, Klunder AM, Kallmes DF. What is meant by “tici”? AJNR Am J Neuroradiol. (2013) 34:1792–7. doi: 10.3174/ajnr.A3496
14. Hacke W, Kaste M, Fieschi C, von Kummer R, Davalos A, Meier D, et al. Randomised double-blind placebo-controlled trial of thrombolytic therapy with intravenous alteplase in acute ischaemic stroke (ecass ii). Second european-australasian acute stroke study investigators. Lancet. (1998) 352:1245–51. doi: 10.1016/S0140-6736(98)08020-9
15. Berger C, Fiorelli M, Steiner T, Schabitz WR, Bozzao L, Bluhmki E, et al. Hemorrhagic transformation of ischemic brain tissue: asymptomatic or symptomatic? Stroke. (2001) 32:1330–5. doi: 10.1161/01.STR.32.6.1330
16. Lin L, Bivard A, Krishnamurthy V, Levi CR, Parsons MW. Whole-brain ct perfusion to quantify acute ischemic penumbra and core. Radiology. (2016) 279:876–87. doi: 10.1148/radiol.2015150319
17. Simard JM, Kent TA, Chen M, Tarasov KV, Gerzanich V. Brain oedema in focal ischaemia: molecular pathophysiology and theoretical implications. Lancet Neurol. (2007) 6:258–68. doi: 10.1016/S1474-4422(07)70055-8
18. Shi J, Wu H, Dong Z, Liang X, Liu Q, Zhu W, et al. Automated quantitative lesion water uptake in acute stroke is a predictor of malignant cerebral edema. Eur Radiol. (2022) 32:2771–80. doi: 10.1007/s00330-021-08443-2
19. Gabriel B, Sarah E, Helge K, Andre K, Fabian F, Matthias B, et al. Early prediction of malignant cerebellar edema in posterior circulation stroke using quantitative lesion water uptake. Neurosurgery. (2021) 88:531–37. doi: 10.1093/neuros/nyaa438
20. Okada T, Suzuki H, Travis ZD, Zhang JH. The stroke-induced blood-brain barrier disruption: current progress of inspection technique, mechanism, and therapeutic target. Curr Neuropharmacol. (2020) 18:1187–212. doi: 10.2174/1570159X18666200528143301
21. Bernardo-Castro S, Sousa JA, Bras A, Cecilia C, Rodrigues B, Almendra L, et al. Pathophysiology of blood-brain barrier permeability throughout the different stages of ischemic stroke and its implication on hemorrhagic transformation and recovery. Front Neurol. (2020) 11:594672. doi: 10.3389/fneur.2020.594672
22. Ng FC, Churilov L, Yassi N, Kleinig TJ, Thijs V, Wu TY, et al. Microvascular dysfunction in blood-brain barrier disruption and hypoperfusion within the infarct posttreatment are associated with cerebral edema. Stroke. (2021) 53:1597–605. doi: 10.1161/STROKEAHA.121.036104
23. Nawabi J, Elsayed S, Scholz H, Kemmling A, Meyer L, Kniep H, et al. Interaction effect of baseline serum glucose and early ischemic water uptake on the risk of secondary hemorrhage after ischemic stroke. Front Neurol. (2021) 12:690193. doi: 10.3389/fneur.2021.690193
24. Watanabe O, West CR, Bremer A. Experimental regional cerebral ischemia in the middle cerebral artery territory in primates. Part 2: effects on brain water and electrolytes in the early phase of mca stroke. Stroke. (1977) 8:71–6. doi: 10.1161/01.STR.8.1.71
25. Yuan S, Li W, Hou C, Kang H, Ma Q, Ji X, et al. Serum occludin level combined with nihss score predicts hemorrhage transformation in ischemic stroke patients with reperfusion. Front Cell Neurosci. (2021) 15:714171. doi: 10.3389/fncel.2021.714171
26. Yang Y, Xie D, Zhang Y. Increased platelet-to-lymphocyte ratio is an independent predictor of hemorrhagic transformation and in-hospital mortality among acute ischemic stroke with large-artery atherosclerosis patients. Int J Gen Med. (2021) 14:7545–55. doi: 10.2147/IJGM.S329398
27. Chen Z, Hu Q, Huo Y, Zhang R, Fu Q, Qin X. Serum interleukin-33 is a novel predictive biomarker of hemorrhage transformation and outcome in acute ischemic stroke. J Stroke Cerebrovasc Dis. (2021) 30:105506. doi: 10.1016/j.jstrokecerebrovasdis.2020.105506
Keywords: brain edema, multimodal CT, net water uptake, symptomatic intracranial hemorrhage (sICH), acute ischemic stroke (AIS), mechanical thrombectomy (MT)
Citation: Xu T, Yang J, Han Q, Wu Y, Gao X, Xu Y, Huang Y, Wang A, Parsons MW and Lin L (2022) Net water uptake, a neuroimaging marker of early brain edema, as a predictor of symptomatic intracranial hemorrhage after acute ischemic stroke. Front. Neurol. 13:903263. doi: 10.3389/fneur.2022.903263
Received: 24 March 2022; Accepted: 27 June 2022;
Published: 27 July 2022.
Edited by:
Peiyu Huang, Zhejiang University, ChinaReviewed by:
Vasu Saini, University of Miami Health System, United StatesCopyright © 2022 Xu, Yang, Han, Wu, Gao, Xu, Huang, Wang, Parsons and Lin. This is an open-access article distributed under the terms of the Creative Commons Attribution License (CC BY). The use, distribution or reproduction in other forums is permitted, provided the original author(s) and the copyright owner(s) are credited and that the original publication in this journal is cited, in accordance with accepted academic practice. No use, distribution or reproduction is permitted which does not comply with these terms.
*Correspondence: Longting Lin, bG9uZ3RpbmcubGluQHVuc3cuZWR1LmF1; Mark W. Parsons, TWFyay5QYXJzb25zQHVuc3cuZWR1LmF1
†These authors have contributed equally to this work
Disclaimer: All claims expressed in this article are solely those of the authors and do not necessarily represent those of their affiliated organizations, or those of the publisher, the editors and the reviewers. Any product that may be evaluated in this article or claim that may be made by its manufacturer is not guaranteed or endorsed by the publisher.
Research integrity at Frontiers
Learn more about the work of our research integrity team to safeguard the quality of each article we publish.