 Seung Yup Lee1,2†
 Rowan O. Brothers1†
 Katherine B. Turrentine1Ayesha Quadri1
 Eashani Sathialingam1Kyle R. Cowdrick1
 Scott Gillespie3Shasha Bai3
 Adam E. Goldman-Yassen4Clinton H. Joiner1,4,5
 R. Clark Brown4,5
 Erin M. Buckley1,4,6*
- 1Wallace H. Coulter Department of Biomedical Engineering, Georgia Institute of Technology and Emory University, Atlanta, GA, United States
- 2Department of Electrical and Computer Engineering, Kennesaw State University, Marietta, GA, United States
- 3Pediatric Biostatistics Core, Emory University School of Medicine, Atlanta, GA, United States
- 4Department of Pediatrics, Emory University School of Medicine, Atlanta, GA, United States
- 5Aflac Cancer & Blood Disorders Center, Children's Healthcare of Atlanta, Atlanta, GA, United States
- 6Children's Research Scholar, Children's Healthcare of Atlanta, Atlanta, GA, United States
Red blood cell transfusions are common in patients with sickle cell disease who are at increased risk of stroke. Unfortunately, transfusion thresholds needed to sufficiently dilute sickle red blood cells and adequately restore oxygen delivery to the brain are not well defined. Previous work has shown that transfusion is associated with a reduction in oxygen extraction fraction and cerebral blood flow, both of which are abnormally increased in sickle patients. These reductions are thought to alleviate hemometabolic stress by improving the brain's ability to respond to increased metabolic demand, thereby reducing susceptibility to ischemic injury. Monitoring the cerebral hemometabolic response to transfusion may enable individualized management of transfusion thresholds. Diffuse optical spectroscopies may present a low-cost, non-invasive means to monitor this response. In this study, children with SCD undergoing chronic transfusion therapy were recruited. Diffuse optical spectroscopies (namely, diffuse correlation spectroscopy combined with frequency domain near-infrared spectroscopy) were used to quantify oxygen extraction fraction (OEF), cerebral blood volume (CBV), an index of cerebral blood flow (CBFi), and an index of cerebral oxygen metabolism (CMRO2i) in the frontal cortex immediately before and after transfusion. A subset of patients receiving regular monthly transfusions were measured during a subsequent transfusion. Data was captured from 35 transfusions in 23 patients. Transfusion increased median blood hemoglobin levels (Hb) from 9.1 to 11.7 g/dL (p < 0.001) and decreased median sickle hemoglobin (HbS) from 30.9 to 21.7% (p < 0.001). Transfusion decreased OEF by median 5.9% (p < 0.001), CBFi by median 21.2% (p = 0.020), and CBV by median 18.2% (p < 0.001). CMRO2i did not statistically change from pre-transfusion levels (p > 0.05). Multivariable analysis revealed varying degrees of associations between outcomes (i.e., OEF, CBFi, CBV, and CMRO2i), Hb, and demographics. OEF, CBFi, and CBV were all negatively associated with Hb, while CMRO2i was only associated with age. These results demonstrate that diffuse optical spectroscopies are sensitive to the expected decreases of oxygen extraction, blood flow, and blood volume after transfusion. Diffuse optical spectroscopies may be a promising bedside tool for real-time monitoring and goal-directed therapy to reduce stroke risk for sickle cell disease.
Introduction
Sickle cell disease (SCD) is an autosomal recessive blood disorder affecting millions of people worldwide, with ~300,000 newborns diagnosed each year (1). In SCD, a single gene mutation causes production of abnormal hemoglobin, hemoglobin S (HbS) (1). In addition to impaired oxygen-carrying ability, HbS rapidly forms intracellular polymers in the deoxygenated state, distorting red blood cells (RBC) into a characteristic sickle shape (1). Sickling, decreased RBC deformability, and increased cell aggregation and hemolysis, result in increased blood viscosity and decreased microvascular perfusion (1–3). The culmination of impaired oxygen-carrying capacity and altered blood flow dramatically increases the incidence of vascular occlusion and stroke in patients with sickle cell disease (1).
Currently, routine screening with transcranial Doppler ultrasound (TCD) is employed to minimize stroke risk in children with sickle cell disease (4). Patients with persistently elevated TCD blood flow velocities of the large feeding arteries to the brain are placed on chronic transfusion therapy (CTT) to reverse metabolic stress caused by anemia and to prevent vaso-occlusion and stroke (5). CTT involves periodic RBC transfusion to dilute sickle red blood cells (sRBC) with the general goal of maintaining HbS <30% and hemoglobin (Hb) >10 g/dL (5). CTT has drastically reduced the incidence and severity of both overt stroke and silent infarction (92 and 58% relative risk reduction, respectively) (6, 7). However, recurrent infarctions occur in 23–45% of patients receiving CTT, despite successful maintenance of clinical thresholds for HbS and Hb (8–10), suggesting that current standardized CTT guidelines are insufficient for infarct prevention in a substantial fraction of patients.
Transfusion is associated with a reduction in oxygen extraction fraction (OEF) and cerebral blood flow (CBF), both of which are abnormally increased in SCD patients due to reduced arterial oxygen content (CaO2) (11, 12). These reductions are thought to alleviate hemometabolic stress by improving the brain's ability to respond to increased metabolic demand, thereby reducing susceptibility to ischemic injury (11, 12). Monitoring the cerebral hemometabolic response to transfusion may enable individualized management of transfusion thresholds, with the goal of sufficiently restoring cerebrovascular reserve by diluting or replacing sickle red blood cells. In patients for whom CTT does not adequately address metabolic needs, such monitoring may be used to identify those who would benefit from more aggressive therapies (e.g., bone marrow transplant) (12, 13).
Magnetic resonance imaging (MRI) provides excellent, high-resolution images of cerebral blood flow and oxygen extraction fraction that have been used in recent years to elucidate mechanisms underlying regional vulnerabilities to injury in patients with SCD (11, 12, 14). Indeed, recent work has demonstrated the influence of CTT on relieving hemometabolic stress in SCD patients (11, 12). However, MRI is prohibitively expensive for routine monitoring, requires sedation in children <6 y, and quantitative differences exist across scanners and software platforms. Thus, its utility in individualizing CTT management in SCD patients is limited.
Diffuse optical spectroscopies (DOS) present a low-cost, non-invasive alternative to current neuroimaging techniques like MRI. By operating in the near-infrared, DOS techniques exploit the spectral window of low absorption that exists in tissue. Photons emitted from a source placed on the tissue surface propagate several centimeters (through the scalp and skull) before reemission at the tissue surface. The properties of the detected light can be related to hemodynamic properties of the interrogated tissue, including hemoglobin oxygen saturation, blood flow, blood volume, and oxygen metabolism. While limited in depth sensitivity to the superficial cortex, DOS offers numerous advantages to other neuroimaging techniques, including portability, ease of measurements, and cost. Indeed, a handful of studies have employed a type of DOS known as continuous-wave near-infrared spectroscopy (CW-NIRS) to demonstrate the technology is sensitive to expected increases in cerebral oxygen saturation caused by transfusion (15–18). However, to date, these studies have been limited to commercially available CW-NIRS systems. While useful as a trend monitor, CW-NIRS have been shown to produce substantial inaccuracies in estimations of absolute oxygen saturation (19, 20). Thus, although these studies have observed expected trends in hemoglobin oxygen saturation following transfusion, the magnitude of these increases is likely significantly underestimated (19, 20).
Herein we employ two DOS techniques known as frequency-domain NIRS (FDNIRS) and diffuse correlation spectroscopy (DCS) to monitor the effects of blood transfusion on the brain in a cohort of children with sickle cell disease receiving CTT. FDNIRS is an alternative to CW-NIRS that has been shown to more accurately estimate hemoglobin oxygen saturation, while also providing a measurement of cerebral blood volume (CBV). DCS is a type of DOS used to measure cerebral blood flow (CBF). The combination of oxygen saturation from FDNIRS and CBF from DCS also enables us to estimate the cerebral metabolic rate of oxygen (CMRO2) using Fick's law (21). We hypothesize that FDNIRS combined with DCS (FDNIRS/DCS) can non-invasively quantify changes in markers of cerebral hemometabolic stress at the bedside following transfusion. Specifically, we hypothesize that FDNIRS/DCS can detect expected decreases in CBF, CBV, and OEF post-transfusion, while CMRO2 will remain unchanged. Further, we hypothesize that CBF, CBV, and OEF will be inversely associated with hemoglobin.
Methods
Patient Population
Children ages 2 to 18 years old with SCD (HbSS or HbS thalassemia) receiving chronic transfusion therapy were recruited for this study. RBC transfusions were administered by simple infusion, partial manual exchange, or apheresis following our institution's standard practice guidelines for CTT. Volume of transfusion was calculated to target a post-transfusion venous hemoglobin (Hb) of ~11 g/dL based on Hb levels measured between 1–72 h (mean 5 h) prior to transfusion. Patients were excluded on the basis of: significant illness within one month of participation, hypertension, neurologic disorder not related to SCD (e.g., seizures), Moyamoya or previous revascularization surgery, prior history of major head injury requiring a visit to an emergency department, and/or prior curative therapy. All patients and/or their legal guardians provided informed assent/consent. The study was approved by the Institutional Review Board of Emory University.
Clinical and Laboratory Data
Complete blood count [hematocrit and hemoglobin (Hb)] and hemoglobin electrophoresis (Hb S%, HbA%) were performed on a venous blood sample obtained <72 h before transfusion. Measurements were repeated immediately after transfusion. Transcutaneous oxygen saturation (SpO2, %) and heart rate (HR, bpm) were measured with pulse oximetry on the index finger immediately before and after transfusion. Non-invasive cuff blood pressure was also measured before and after transfusion. CaO2 (mL/dL) was estimated from SpO2 and Hb, CaO2 = 1.39 × SpO2 × Hb.
FDNIRS/DCS Experimental Protocol and Analysis
To assess the cerebral hemometabolic effects of transfusion, brief (~15 min) FDNIRS/DCS measurements were obtained within 2 h prior to the start of transfusion and were repeated at the cessation of transfusion. Due to limitations in software acquisition capabilities with our current system, FDNIRS and DCS data sets were taken sequentially, not simultaneously. For each measurement, we manually held an optical sensor over the right and left frontal cortex for 3–5 s intervals. The sensor was repositioned three times per hemisphere per optical modality (FDNIRS, DCS). After confirming that there were no significant hemispheric differences, all repetitions were averaged to yield a global mean of each measured parameter.
In the following sections, we detail the instrumentation utilized as well as the data analysis pipeline for both FDNIRS and DCS.
Frequency-Domain Near-Infrared Spectroscopy (FDNIRS)
FDNIRS enables quantification of oxy- and deoxy-hemoglobin concentrations (HbO and HbR, respectively, μM) of the interrogated tissue. In this study, we employed a customized FDNIRS system (Imagent, ISS Inc.) with eight near-infrared laser diode sources (690, 730, 750, 775, 785, 800, 825, and 830 nm) modulated at 110 MHz and rapidly multiplexed at 20.8 Hz, along with four photomultiplier tube detectors with gain modulation of 110 MHz + 5 kHz for heterodyne detection at 5 kHz. The patient interface consisted of a 3D-printed rigid black sensor containing five 2.5 mm fiber bundles (50 μm multimode fibers, NA = 0.66, FTTIIG23767, FiberOptics Technology, Pomfret, Connecticut), one of which was used as the source, and the other four of which were used as detectors spaced 2.0, 2.5, 3.0, and 3.5 cm from the source.
For FDNIRS data acquisition, AC amplitude and phase data for each wavelength, λ, were acquired for 3-5s at 20Hz. Measured AC amplitude attenuation, AC(r, λ), and phase shift, θ(r, λ), at each separation, r, and wavelength, λ, were first averaged over the 3–5 s acquisition interval and discarded if the phase standard deviation exceeded 5° or if the AC coefficient of variation was > 10%. Averaged data were then fit to the semi-infinite solution to the diffusion equation to extract wavelength-dependent reduced scattering and absorption coefficients ( and μa(λ), respectively) (22, 23). This approximation assumes a linear relationship between ln(AC(r, λ) × r2) and θ(r, λ) vs. r. To ensure the data fit this linear model, we calculated Pearson's correlation coefficient, R, for both of these relationships, and we discarded data for a given λ in which R2 <0.97. The entire dataset was discarded if <5 wavelengths passed this linear fit criterion or if the slope of vs. λ was > 0.
Estimates of HbO and HbR were obtained by fitting μa(λ) vs. λ to the hemoglobin spectrum (24). Next, HbO and HbR were used to derive total hemoglobin concentration (HbT = HbO + HbR), hemoglobin oxygen saturation (SO2 = HbO/HbT × 100%), oxygen extraction fraction (OEF = (SpO2 – SO2)/ (γ × SpO2), and cerebral blood volume [CBV = MW × HbT/(Dbt × Hb)]. Here, γ is the fraction of blood volume within the probed venous compartment of the tissue (assumed to be 1 for all subjects for simplicity), MW = 64,500 g/mol is the molecular weight of hemoglobin, and Dbt is the brain tissue density (assumed to be 1.05 g/mL).
Additionally, because DCS data were obtained at 852 nm to quantify blood flow, we extrapolated FDNIRS-measured and μa to 852 nm. To estimate , a linear model was fit to vs. λ and extrapolated to 852 nm. To estimate μa(852nm), we used the following formula:
where HbO and HbR were obtained from FDNIRS εHbO and εHbR are the extinction coefficients of oxy- and deoxyhemoglobin, and the factor of 0.75 is the assumed water content of the tissue.
Diffuse Correlation Spectroscopy
Diffuse correlation spectroscopy quantifies temporal fluctuations in reflected light intensity measured by a detector located some fixed distance away from a near-infrared light source placed on the tissue surface. These intensity fluctuations, which are caused by the motion of red blood cells, can be used estimate an index of blood flow in the underlying tissue. The DCS system employed herein consisted of an 852 nm long-coherence laser (iBeam Smart, TOPTICA Photonics, Farmington, New York), two four-channel single photon counting modules (SPCMQA4C-IO, Perkin-Elmer, Quebec, Canada), an eight-channel hardware correlator (Flex05-8ch, New Jersey), and a counter/timer data acquisition board (PCIe-6612, National Instruments) (25). Detected photon counts were used to estimate an intensity autocorrelation function, g2(τ), either via the hardware correlator or with a custom software correlator. For the first 26 transfusion events, we used the hardware correlator; for the remaining transfusion events we transitioned to the software correlator to increase versatility of data acquisition [e.g., acquisition rate, temporal resolution of g2(τ)]. In vitro phantom validations were used to confirm that the hardware correlator and the software correlator yielded the same flow index, as demonstrated by Wang et al. (25).
The patient interface for DCS measurements consisted of a black sensor containing one 800 μm multimode source fiber (FT800EMT, Thorlabs) and seven single-mode detector fibers (780-HP, Thorlabs) bundled together and spaced 2.5 cm from the source. Compliance with the American National Standards Institute (ANSI) maximum permissible exposure of skin to laser radiation (<4 mW/mm2 at 852 nm) was ensured by utilizing a 5mm right-angle prism (MRA03-E03, Thorlabs) to couple light from the source fiber to the tissue surface, thereby yielding a spot size radius >2 mm, and by adjusting the laser power so that the output at the tissue surface was <50 mW.
For DCS data acquisition, hardware correlator data was acquired at 1Hz. Software correlator data was acquired at 20 Hz and downsampled by averaging to 1 Hz prior to analysis for consistency. Thus, each measurement repetition consisted of 3–5 data points. Data points with intensity <6 kHz were excluded from analysis to avoid g2(τ) with poor signal-to-noise ratio (SNR).
To estimate CBFi, the measured intensity autocorrelation functions, g2(τ), were first averaged across the 7 detector channels to improve SNR. Averaged curves were fit to the semi-infinite solution of the correlation diffusion equation to derive CBFi (24). When FDNIRS data was available, measured μa and at 852 nm were incorporated into the fit for CBFi. When unavailable (as was the case in 2 measurements), μa and were assumed to be 0.16 cm−1 and 8.4 cm−1, respectively (26). Fits were discarded if ϵ>14% where As a final quality control step, repetitions with < 3 data points were discarded, and entire measurement sessions were discarded if < 2/6 repetitions failed to meet quality control criteria.
To estimate CMRO2i, we employed a derivative of Fick's law that relates CMRO2i to measurable quantities by assuming a compartmentalized model of the vasculature (24, 27):
Statistical Analysis
Primary analyses were performed at the transfusion level, with a total of 35 transfusions. Summary statistics are expressed as median (interquartile range: 1st quartile, 3rd quartile) for continuous measurements and count (percentage) for categorical measurements. Due to the relatively small sample size, non-parametric Wilcoxon signed-rank test for paired data was used to compare pre- and post-transfusion measures. Linear mixed-effects regression models with random-intercept at the transfusion level were used to examine the association of each outcome measure (OEF, CBFi, CBV, and CMRO2i) with demographical (sex and age) and laboratory data (Hb, HbA and HbS). These models were two-level and accounted for repeated measures (pre- and post-transfusion measurements) nested within the same transfusion event. Selection of predictors in the final multivariable model was performed by backward selection using marginally significant predictors from bivariable results with a threshold of p-value < 0.1. We used variance inflation factors to assess collinearity among predictors included in multivariable models and found a certain degree of collinearity among Hb, HbA, and HbS. In these scenarios, Hb was chosen as the representative predictor, since Hb is generally accepted as the clinical parameter to manage RBC transfusion volume. When the slope estimate of a certain predictor was a small decimal number with too many trailing zeros, the predictor was linearly scaled by a simple conversion (e.g., 0.1 × HbS) to produce an easily readable and interpretable slope estimate. As a secondary analysis, a three-level linear mixed-effect model was fit for the 10 patients who had longitudinal measurements from repeated transfusions, where pre- and post-transfusion were nested within each transfusion event, and multiple transfusions were nested within the patient. Due to the limited sample size, results from this analysis are for preliminary information only and should be6g interpreted with care. Further, ordinary least square regression was used to examine the association of the relative change in each outcome measure (rOEF, rCBFi, rCBV, and rCMRO2i) with demographical data (sex and age) and changes in laboratory data from pre- to post-transfusion (dHb, dHbA and dHbS). Relative changes in outcome measures were defined as the percent change in outcome measure from pre- to post-transfusion (e.g., rOEF = (OEFpost – OEFpre)/OEFpre × 100%); changes in laboratory data were defined as the difference in laboratory data from pre- to post- transfusion (e.g., dHb = Hbpost – Hbpre). All statistical analyses were performed with CRAN R (version 3.4.1, R Foundation). Significance was assessed at the 0.05 level.
Results
Patient Characteristics
A total of 23 children with HbSS on chronic transfusion therapy were enrolled. Patients were mostly female (17/23, 73.9%). Of these 23 patients, 8 (34.8%) were monitored on 2 separate transfusions, and 2 (8.7%) were monitored on 3 separate transfusions. Each follow-up measurement was performed > 6 months after the prior transfusion. In total, we measured 35 transfusion events. Of these 35 transfusions, 30 (85.7%) were simple, 4 (11.4%) were partial exchange, and one (2.9%) was apheresis (Table 1). At the time of transfusion, patients had a median (IQR) age of 13.9 (10.7, 15.9) years, and 23% were reported to be receiving hydroxyurea therapy.
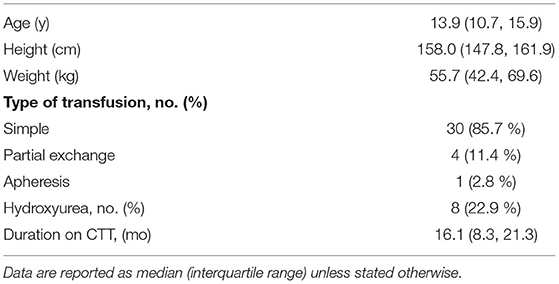
Table 1. Patient characteristics (n = 35).
Effect of Transfusion on Hb and Patient Vitals
Tranfusion significantly increased Hb by median 2.9 (IQR: 1.8, 3.3) g/dL (p < 0.001), HbA by median 10.5 (7.9, 17.2) % (p < 0.001), and decreased HbS by median 8.0 (14.3, 6.8) % (p < 0.001, Table 2). Heart rate decreased significantly by median 8.0 (15.0, 2.3) bpm (p < 0.001) after transfusion, consistent with the known adaptive response from improved oxygen delivery and cardiac output. SpO2 and MAP remained statistically unchanged.

Table 2. Effects of transfusion on hemoglobin and patient vitals.
Effect of Transfusion on Cerebral Hemometabolics
Out of 70 FDNIRS/DCS measurements, 62 FDNIRS (89%) and 62 DCS (89%) measurements passed quality control criteria to be included in analysis. Transfusion was associated with significant decreases in CBFi, OEF, and CBV. CBFi decreased by median 21.5 (46.1, −16.1) % (p = 0.030), OEF decreased by median 5.9 (10.1, 2.9) % (p < 0.001), and CBV decreased by median 18.2 (22.8, 10.2) % (p < 0.001). CMRO2i did not statistically change in response to transfusion (p > 0.05, Figure 1, Table 3). An outlier in both CBFi and CMRO2i made pre-/post- transfusion trends difficult to visualize in the subplots of Figure 2. Supplementary Figure 1 shows this same data with outliers removed. Note, these outliers were included in all analyses; secondary analysis performed by removing outliers did not change results.
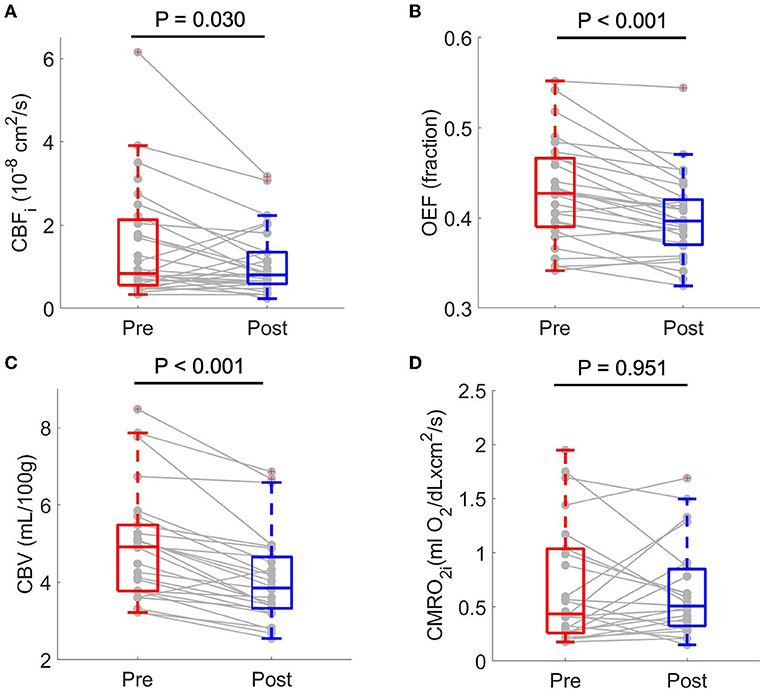
Figure 1. Boxplots of paired pre- and post-transfusion cerebral blood flow index, CBFi (A) oxygen extraction fraction, OEF (B) cerebral blood volume, CBV (C) and cerebral metabolic rate of oxygen index, CMRO2i (D). For each boxplot, the central line denotes the median and the bottom and top edges of the box indicate the 25th and 75th percentiles, respectively. The whiskers extend to the most extreme data points not considered outliers. Individual connected dots represent each pre- and post-transfusion matched pair. p-values were obtained from two-sided paired Wilcoxon signed rank tests. CMRO2i scaled by a factor of 107.
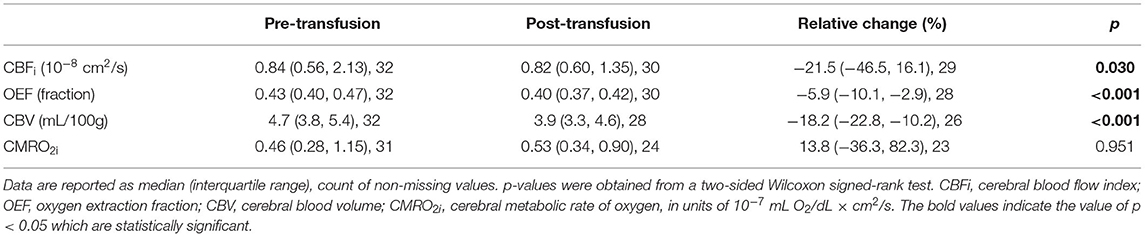
Table 3. Effects of transfusion on blood flow, oxygen extraction, blood volume, and oxygen metabolism.
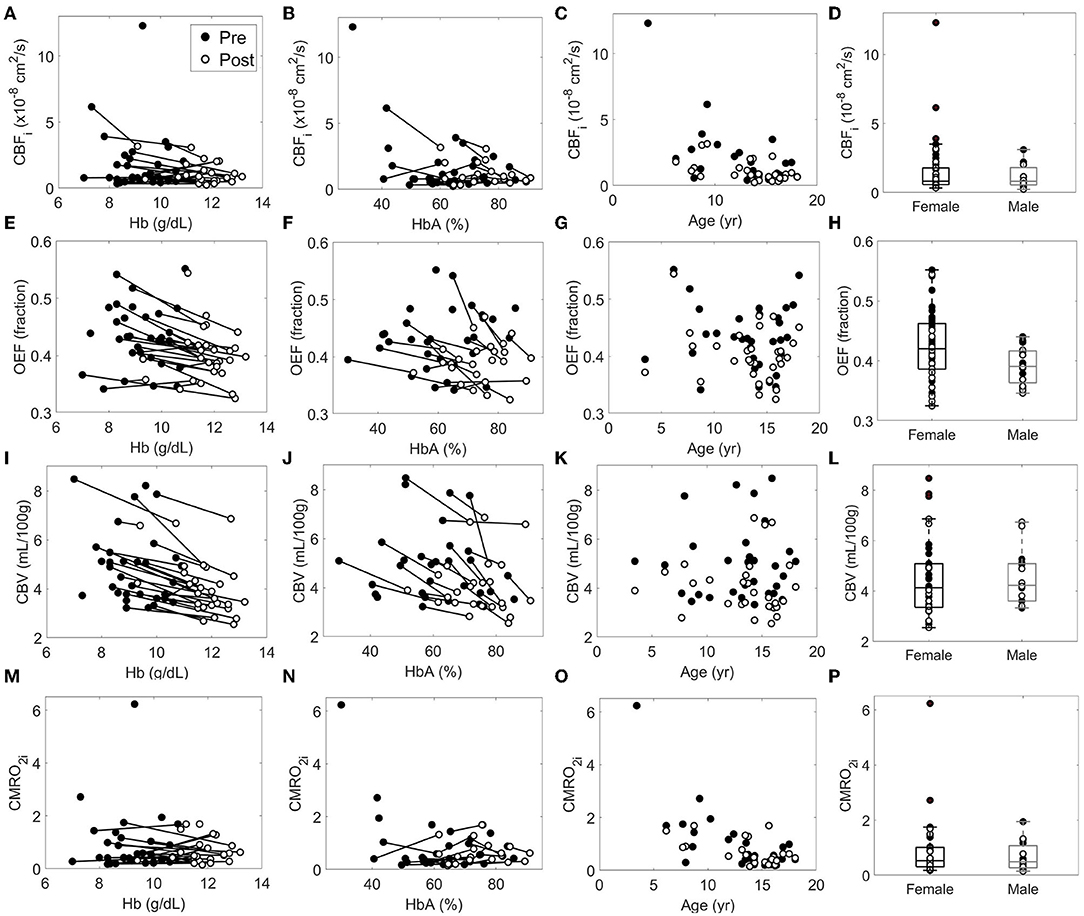
Figure 2. Relationship between each cerebral hemometabolic parameter (A–D: CBFi, E–H: OEF, I–L: CBV and M–P: CMRO2i) and hemoglobin (Hb), hemoglobin A (HbA), age, and sex. In each subplot, solid circles represent pre-transfusion data and hollow circles represent post-transfusion data. Solid lines connect pairs of pre- and post-transfusion data from a single measurement session; solid lines were not included for age and gender panels to aide in visualization, as neither age nor sex changed during pre-post transfusion. CMRO2i, cerebral metabolic rate of oxygen, in units of 10−7 mL O2/dL × cm2/s.
Bivariable relationships between predictors (Hb, HbA, HbS, age, and sex) and cerebral hemometabolic outcomes (CBFi, OEF, CBV, and CMRO2i) are visualized in Figure 2, and linear regression models for bivariable and multivariable relationships are presented in Table 4. Bivariably, CBFi was inversely associated with age (p < 0.001), HbA (p = 0.011), and HbS (p = 0.016). A marginally significant inverse association between CBFi and Hb was also observed (p = 0.053). In multivariable models, age and Hb, as well as age and HbA, remained significant independent predictors of CBFi. For OEF, significant inverse associations were observed with Hb (p < 0.001) and HbA (p = 0.008); additionally, OEF was significantly positively associated with HbS (p = 0.024). OEF was marginally significantly higher in females than in males (p = 0.059). In multivariable analysis, Hb, as well as sex and HbA, remained significant independent predictors of OEF (Hb, HbS and HbA were not modeled together due to multicollinearity). For CBV, bivariable analysis revealed significant inverse associations with Hb (p < 0.001) and HbA (p < 0.001) and a positive association with HbS (p = 0.002). For CMRO2i, age was the only significant correlate (p < 0.001). While the current analysis employed 2-level hierarchical models at the transfusion-level, nesting pre-post observations within transfusions, we also performed a sensitivity analysis wherein repeated transfusions were also nested within patients, resulting in 3-level hierarchical models. The only meaningful change in the results from Table 4 observed in this 3-level analysis was a significant inverse association between HbA and CMRO2i (p = 0.023, Supplementary Table 1).
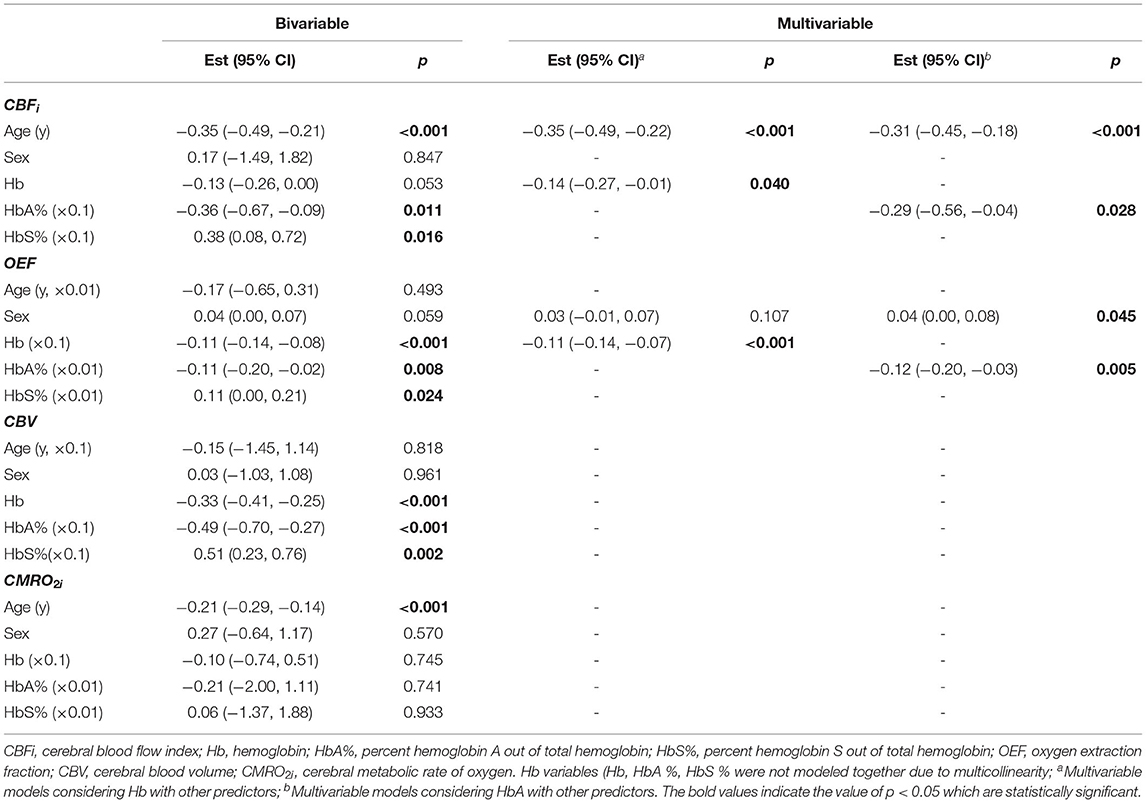
Table 4. Bivariable and multivariable analysis of factors influencing cerebral hemometabolic parameters.
Finally, bivariable models were used to investigate the relationship between predictor variables and relative changes in each cerebral hemometabolic outcome from pre- to post-transfusion (Table 5, Figures 3A-D). Relative change in OEF was inversely associated with dHb (p = 0.010, Figure 3B). Similarly, relative change in CBV was also inversely associated with dHb (p < 0.001, Figure 3C). Relative change in CBFi and CBV were significantly higher in males versus females (p = 0.007 and 0.040, respectively).
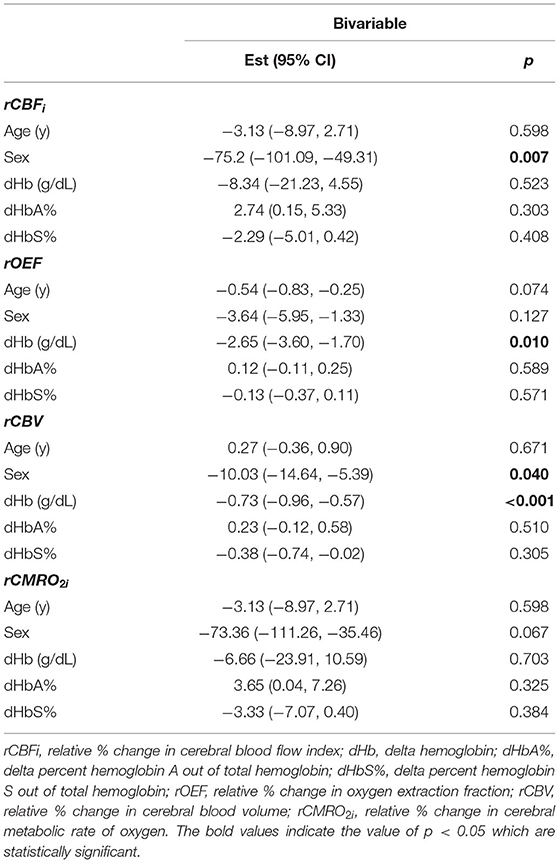
Table 5. Bivariable analysis of factors influencing changes in cerebral hemometabolic parameters.
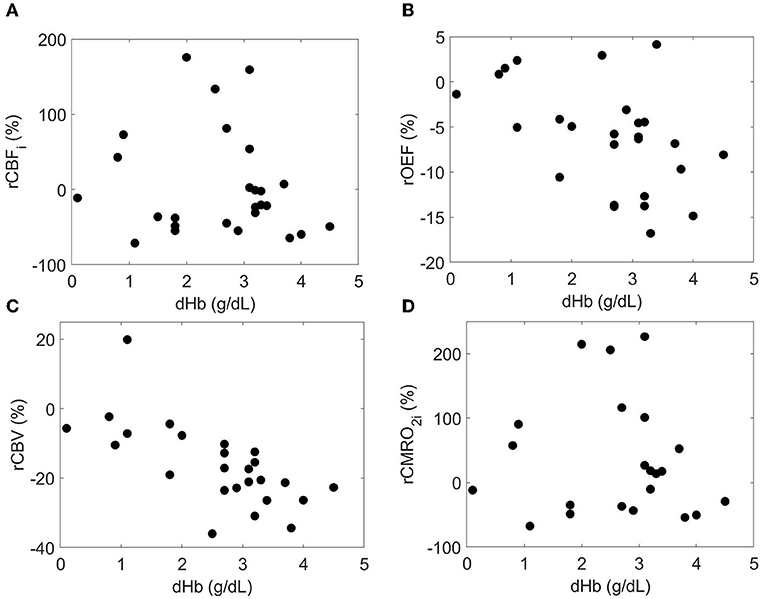
Figure 3. Relationship between the relative each cerebral hemometabolic parameter due to transfusion (A: rCBFi, B: rOEF, C: rCBV and D: rCMRO2i) and the change in hemoglobin (dHb).
Discussion
Herein, we demonstrate the feasibility of using diffuse optical spectroscopies, specifically FDNIRS and DCS, as a low-cost and non-invasive means to evaluate changes in oxygen extraction fraction, cerebral blood flow, blood volume, and oxygen metabolism after transfusion in children with sickle cell disease. We found that FDNIRS/DCS measurements of OEF, CBFi, and CBV were significantly lower post-transfusion than pre-transfusion, while no significant changes were observed in CMRO2i (Figure 1). These observations are consistent with prior neuroimaging studies using MRI and positron emission tomography that demonstrate significant whole-brain decreases in OEF, CBF, and CBV following transfusion (11, 12). Further, OEF, CBFi, and CBV were significantly inversely associated with hemoglobin concentration, and these associations persisted after accounting for the influence of age and sex (Table 4). While our changes in OEF largely agree with previous reports (11, 12), the decreases in CBFi that we measured were larger than expected (26). We hypothesize that the origin of these differences is due to the confounding influence of hematocrit (28) and work is ongoing to develop correction factors that account for this influence.
As expected, when regressed against all cerebral hemometabolic outcome variables, age was significantly inversely correlated with CBFi (Figure 2C, bivariable and multivariable analyses, Table 4) and CMRO2i (Figure 2O, bivariable analysis, Table 4). However, the magnitude of the decreases in CBFi and CMRO2i seen with age are large compared to previous reports (29–33). These exaggerated changes may be due to age-related changes that alter extracerebral signal contributions to the measured optical signal, e.g., increases in scalp/skull thickness, vessel density, and possibly increased concentration of hemoglobin production in skull bone marrow (34).
We note that we found sex was a significant predictor of OEF after adjusting for HbA (Table 4), with females having a higher OEF than males, and that sex was significantly associated with relative changes in both CBF and CBV due to transfusion with males having a higher relative change than females (Table 5). However, these correlations have not been reported in previous studies of children with sickle cell disease (11, 12, 35) and may be an artifact of the relatively small number of males in our cohort.
Finally, we note several limitations of this study. First, hemispheric data was averaged, resulting in a single, whole-brain value for each cerebral hemometabolic marker. While this approach was justified given that no significant differences were observed between hemispheres for the cohort on a whole, marked hemispheric asymmetry was observed in a small subset of patients. Future work with an expanded cohort will explore the complex relationship between vasculopathy and asymmetrical response to transfusion. Second, for subject convenience, post-transfusion measurements were performed immediately after transfusion, which likely missed post-transfusion equilibrium. While previous studies have shown that the most significant changes in cerebral tissue oxygen saturation occur within the first 30 min to 1 h of transfusion start (17, 36), measuring prior to equilibrium could potentially blunt changes in measured cerebral hemometabolic markers (17). Third, our optical measurements are limited in sensitivity to the frontal cortex. While data from MRI suggest the effects of transfusion are global and uniform within gray matter (35), we are unable to directly comment on the whole-brain hemometabolic response to transfusion. Fourth, 11% of data was discarded due to motion artifact and/or poor SNR. With improvements in real-time analysis to ensure adequate data quality at the bedside, we anticipate that this discard rate can be dramatically reduced. Fifth, both our FDNIRS and DCS analyses make the first-order assumption that the head is a homogenous medium of uniform optical properties/flow dynamics. This oversimplification neglects the influence of extracerebral layers (skull, scalp, cerebrospinal fluid), which can be appreciable (37) and, in the case of this cohort, may be variable given the range of ages (2–18y). While the consistency of our results with those of other neuroimaging modalities suggest that this influence is not insurmountable, minimizing these contributions either through advanced analytical modeling (37–39) or through hardware approaches that isolate photons that have traveled deeper in tissue (40, 41) will be an important future step toward the clinical translation of NIRS/DCS. Finally, when estimating OEF with FDNIRS, we assumed that the fraction of our signal that arises from the venous compartment is the same across our subjects (and equal to 1, although the exact magnitude of this fractional value is less important since we assumed it was the same for everyone). Inter-participant variations in this assumed value could lead to errors in the estimation of OEF.
Conclusion
In summary, we demonstrate that diffuse optical spectroscopies (namely, FDNIRS combined with DCS) can be used to detect expected decreases in OEF, CBV, and CBFi that occur in sickle cell patients in response to blood transfusion. These results suggest that FDNIRS/DCS could be useful as a low-cost, non-invasive screening tool to enable individualized management of transfusion thresholds, and to identify patients who might benefit from a more aggressive therapy such as stem cell transplant.
Data Availability Statement
The raw data supporting the conclusions of this article will be made available by the authors, without undue reservation.
Ethics Statement
The study was approved by the Institutional Review Board of Emory University. Written informed consent to participate in this study was provided by the participants' legal guardian/next of kin.
Author Contributions
EB, RCB, and CJ conceived and designed the study. SYL, ROB, KT, ES, KC, AG-Y, and AQ collected data. SYL and ROB analyzed data. SG and SB helped with statistical analysis. SYL, ROB, and EB drafted the manuscript. SYL, ROB, SG, SB, AQ, CJ, RCB, and EB edited the manuscript. All authors contributed to the article and approved the submitted version.
Funding
This project was supported by National Institute of Health R01HL152322 (EB), R21HL138062 (EB), F31HL154703 (ES), and American Heart Association 19POST34380337 (SYL). This work was supported by the National Science Foundation Graduate Research Fellowship Program under Grant No. 1937971 (ROB).
Author Disclaimer
Any opinions, findings, and conclusions or recommendations expressed in this material are those of the author(s) and do not necessarily reflect the views of the National Science Foundation.
Conflict of Interest
The authors declare that the research was conducted in the absence of any commercial or financial relationships that could be construed as a potential conflict of interest.
Publisher's Note
All claims expressed in this article are solely those of the authors and do not necessarily represent those of their affiliated organizations, or those of the publisher, the editors and the reviewers. Any product that may be evaluated in this article, or claim that may be made by its manufacturer, is not guaranteed or endorsed by the publisher.
Acknowledgments
We thank the Aflac Clinical Research Office, especially Amanda Watt, Morgan Hathaway, Lauren Trotter, and Nwanna Ifendu, as well as the clinical staff at the Aflac transfusion clinic for their valuable support.
Supplementary Material
The Supplementary Material for this article can be found online at: https://www.frontiersin.org/articles/10.3389/fneur.2022.869117/full#supplementary-material
References
1. Kato GJ, Piel FB, Reid CD, Gaston MH, Ohene-Frempong K, Krishnamurti L, et al. Sickle cell disease. Nat Rev Dis Primers. (2018) 4:1–22. doi: 10.1038/nrdp.2018.10
2. Schmalzer EA Lee Jo Brown Ak Usami S Chien Chien S Viscosity of mixtures of sickle and normal red cells at varying hematocrit levels. Transfusion. (1987) 27:228–33. doi: 10.1046/j.1537-2995.1987.27387235626.x
3. Alexy T, Pais E, Armstrong JK, Meiselman HJ, Johnson CS, Fisher TC. Rheologic behavior of sickle and normal red blood cell mixtures in sickle plasma: implications for transfusion therapy. Transfusion. (2006) 46:912–8. doi: 10.1111/j.1537-2995.2006.00823.x
4. Adams RJ, McKie VC, Brambilla D, Carl E, Gallagher D, Nichols FT, et al. Stroke prevention trial in sickle cell anemia. Control Clin Trials. (1998) 19:110–29. doi: 10.1016/S0197-2456(97)00099-8
5. DeBaun MR, Jordan LC, King AA, Schatz J, Vichinsky E, Fox CK, et al. American Society of Hematology 2020 guidelines for sickle cell disease: prevention, diagnosis, and treatment of cerebrovascular disease in children and adults. Blood Adv. (2020) 4:1554–88. doi: 10.1182/bloodadvances.2019001142
6. Adams RJ, McKie VC, Hsu L, Files B, Vichinsky E, Pegelow C, et al. Prevention of a first stroke by transfusions in children with sickle cell anemia and abnormal results on transcranial doppler ultrasonography. New England J Med. (1998) 339:5–11. doi: 10.1056/NEJM199807023390102
7. DeBaun MR, Gordon M, McKinstry RC, Noetzel MJ, White DA, Sarnaik SA, et al. controlled trial of transfusions for silent cerebral infarcts in sickle cell anemia. New England J Med. (2014) 371:699–710. doi: 10.1056/NEJMoa1401731
8. Scothorn DJ, Price C, Schwartz D, Terrill C, Buchanan GR, Shurney W, et al. Risk of recurrent stroke in children with sickle cell disease receiving blood transfusion therapy for at least five years after initial stroke. J Pediatr. (2002) 140:348–54. doi: 10.1067/mpd.2002.122498
9. Hulbert ML, Scothorn DJ, Panepinto JA, Scott JP, Buchanan GR, Sarnaik S, et al. Exchange blood transfusion compared with simple transfusion for first overt stroke is associated with a lower risk of subsequent stroke: a retrospective cohort study of 137 children with sickle cell anemia. J Pediatr. (2006) 149:710–2. doi: 10.1016/j.jpeds.2006.06.037
10. Hulbert ML, McKinstry RC, Lacey JL, Moran CJ, Panepinto JA, Thompson AA, et al. Silent cerebral infarcts occur despite regular blood transfusion therapy after first strokes in children with sickle cell disease. Blood. (2011) 117:772–9. doi: 10.1182/blood-2010-01-261123
11. Guilliams KP, Fields ME, Ragan DK, Eldeniz C, Binkley MM, Chen Y, et al. Red cell exchange transfusions lower cerebral blood flow and oxygen extraction fraction in pediatric sickle cell anemia. Blood. (2018) 131:1012–21. doi: 10.1182/blood-2017-06-789842
12. Juttukonda MR, Lee CA, Patel NJ, Davis LT, Waddle SL, Gindville MC, et al. Differential cerebral hemometabolic responses to blood transfusions in adults and children with sickle cell anemia: hemodynamics of transfusions in SCA. J Magn Reson Imaging. (2019) 49:466–77. doi: 10.1002/jmri.26213
13. Jordan LC, Kassim AA, Donahue MJ, Juttukonda MR, Pruthi S, Davis LT, et al. Silent infarct is a risk factor for infarct recurrence in adults with sickle cell anemia. Neurology. (2018) 91:e781–4. doi: 10.1212/WNL.0000000000006047
14. Jordan LC, Gindville MC, Scott AO, Juttukonda MR, Strother MK, Kassim AA, et al. Non-invasive imaging of oxygen extraction fraction in adults with sickle cell anaemia. Brain. (2016) 139:738–50. doi: 10.1093/brain/awv397
15. Nahavandi M, Tavakkoli F, Hasan SP, Wyche MQ, Castro O. Cerebral oximetry in patients with sickle cell disease. Eur J Clin Invest. (2004) 34:143–8. doi: 10.1111/j.1365-2362.2004.01307.x
16. Raj A, Bertolone SJ, Mangold S. Edmonds HL. Assessment of cerebral tissue oxygenation in patients with sickle cell disease: effect of transfusion therapy. J Pediatric Hematol Oncol. (2004) 26:279–83. doi: 10.1097/00043426-200405000-00004
17. Quinn CT, Dowling MM. Cerebral tissue hemoglobin saturation in children with sickle cell disease. Pediatr Blood Cancer. (2012) 59:881–7. doi: 10.1002/pbc.24227
18. Dhabangi A, Ainomugisha B, Cserti-Gazdewich C, Stowell C, Dzik WS. Cerebral oxygenation during transfusion for profound anemia. Transfusion. (2014) 54:2802–2802. doi: 10.1111/trf.12872
19. Kleiser S, Nasseri N, Andresen B, Greisen G, Wolf M. Comparison of tissue oximeters on a liquid phantom with adjustable optical properties. Biomed Opt Express. (2016) 7:2973–92. doi: 10.1364/BOE.7.002973
20. Kleiser S, Ostojic D, Andresen B, Nasseri N, Isler H, Scholkmann F, et al. Comparison of tissue oximeters on a liquid phantom with adjustable optical properties: an extension. Biomed Opt Express. (2017) 9:86–101. doi: 10.1364/BOE.9.000086
21. Jain V, Buckley EM, Licht DJ, Lynch JM, Schwab PJ, Naim MY, et al. Cerebral oxygen metabolism in neonates with congenital heart disease quantified by MRI and optics. J Cerebral Blood Flow Metabolism. (2014) 34:380–8. doi: 10.1038/jcbfm.2013.214
22. Fantini S, Franceschini MA, Fishkin JB, Barbieri B, Gratton E. Quantitative determination of the absorption spectra of chromophores in strongly scattering media: a light-emitting-diode based technique. Appl Opt, AO. (1994) 33:5204–13. doi: 10.1364/AO.33.005204
23. Fantini S, Franceschinifantini MA, Maier JS, Walker SA, Barbieri B, Gratton E. Frequency-domain multichannel optical-detector for noninvasive tissue spectroscopy and oximetry. Optic Eng. (1995) 34:32–42.
24. Durduran T, Choe R, Baker WB, Yodh AG. Diffuse optics for tissue monitoring and tomography. Rep Progress Physics. (2010) 73:43. doi: 10.1088/0034-4885/73/7/076701
25. Wang D, Parthasarathy AB, Baker WB, Gannon K, Kavuri V, Ko T, et al. Fast blood flow monitoring in deep tissues with real-time software correlators. Biomed Opt Express. (2016) 7:776–97. doi: 10.1364/BOE.7.000776
26. Lee SY, Cowdrick KR, Sanders B, Sathialingam E, McCracken CE, Lam WA, et al. Noninvasive optical assessment of resting-state cerebral blood flow in children with sickle cell disease. Neurophoton. (2019) 6:1. doi: 10.1117/1.NPh.6.3.035006
27. Kety SS, Schmidt CF. The effects of altered arterial tensions of carbon dioxide and oxygen on cerebral blood flow and cerebral oxygen consumption of normal young men. J Clinic Investigation. (1948) 27:484–92.
28. Sathialingam E, Williams EK, Lee SY, McCracken CE, Lam WA, Buckley EM. Hematocrit significantly confounds diffuse correlation spectroscopy measurements of blood flow. Biomed Opt Express. (2020) 11:4786. doi: 10.1364/BOE.397613
29. Wu C, Honarmand AR, Schnell S, Kuhn R, Schoeneman SE, Ansari SA, Carr J, Markl M, Shaibani A. Age-related changes of normal cerebral and cardiac blood flow in children and adults aged 7 months to 61 years. J Am Heart Association 5:e002657. doi: 10.1161/JAHA.115.002657
30. Zhang N, Gordon ML, Ma Y, Chi B, Gomar JJ, Peng S, et al. The age-related perfusion pattern measured with arterial spin labeling mri in healthy subjects. Front Aging Neurosci. (2018) 10:214. doi: 10.3389/fnagi.2018.00214
31. Moses P, Hernandez LM, Orient E. Age-related differences in cerebral blood flow underlie the BOLD fMRI signal in childhood. Front Psychol. (2014) 5:300. doi: 10.3389/fpsyg.2014.00300
32. Lu H, Xu F, Rodrigue KM, Kennedy KM, Cheng Y, Flicker B, et al. Alterations in cerebral metabolic rate and blood supply across the adult lifespan. Cerebral Cortex. (2011) 21:1426–34. doi: 10.1093/cercor/bhq224
33. Takahashi T, Shirane R, Sato S, Yoshimoto T. Developmental Changes of Cerebral Blood Flow and Oxygen Metabolism in Children. Am J Neuroradiol. (1999) 20:917–22.
34. Kosaraju V, Harwani A, Partovi S, Bhojwani N, Garg V, Ayyappan S, et al. Imaging of musculoskeletal manifestations in sickle cell disease patients. BJR. (2017) 90:20160130. doi: 10.1259/bjr.20160130
35. Fields ME, Guilliams KP, Ragan DK, Binkley MM, Eldeniz C, Chen Y, et al. Regional oxygen extraction predicts border zone vulnerability to stroke in sickle cell disease. Neurology. (2018) 90:e1134–42. doi: 10.1212/WNL.0000000000005194
36. Dhabangi A, Ainomugisha B, Cserti-Gazdewich C, Ddungu H, Kyeyune D, Musisi E, et al. Cerebral oximetry in ugandan children with severe anemia: clinical categories and response to transfusion. JAMA Pediatr. (2016) 170:995–1002. doi: 10.1001/jamapediatrics.2016.1254
37. Dehaes M, Grant PE, Sliva DD, Roche-Labarbe N, Pienaar R, Boas DA, et al. Assessment of the frequency-domain multi-distance method to evaluate the brain optical properties: monte carlo simulations from neonate to adult. Biomed Opt Express. (2011) 2:552. doi: 10.1364/BOE.2.000552
38. Kienle A, Patterson MS, Dögnitz N, Bays R, Wagnières G, van den Bergh H. Noninvasive determination of the optical properties of two-layered turbid media. Appl Opt. (1998) 37:779. doi: 10.1364/AO.37.000779
39. Martelli F, Sassaroli A, Bianco SD, Zaccanti G. Solution of the time-dependent diffusion equation for a three-layer medium: application to study photon migration through a simplified adult head model. Phys Med Biol. (2007) 52:2827–43. doi: 10.1088/0031-9155/52/10/013
40. Selb J, Ogden TM, Dubb J, Fang Q, Boas DA. Comparison of a layered slab and an atlas head model for Monte Carlo fitting of time-domain near-infrared spectroscopy data of the adult head. J Biomed Opt. (2014) 19:016010. doi: 10.1117/1.JBO.19.1.016010
Keywords: diffuse correlation spectroscopy (DCS), near-infrared spectroscopy, sickle cell disease (SCD), blood transfusion, cerebral hemometabolics, cerebral oxygen extraction fraction, frequency-domain near-infrared spectroscopy, cerebral blood flow
Citation: Lee SY, Brothers RO, Turrentine KB, Quadri A, Sathialingam E, Cowdrick KR, Gillespie S, Bai S, Goldman-Yassen AE, Joiner CH, Brown RC and Buckley EM (2022) Quantifying the Cerebral Hemometabolic Response to Blood Transfusion in Pediatric Sickle Cell Disease With Diffuse Optical Spectroscopies. Front. Neurol. 13:869117. doi: 10.3389/fneur.2022.869117
Received: 03 February 2022; Accepted: 13 May 2022;
Published: 01 July 2022.
Edited by:
Fenella Jane Kirkham, University College London, United KingdomReviewed by:
Ashwin B. Parthasarathy, University of South Florida, United StatesSilvina Ferradal, Indiana University, United States
Copyright © 2022 Lee, Brothers, Turrentine, Quadri, Sathialingam, Cowdrick, Gillespie, Bai, Goldman-Yassen, Joiner, Brown and Buckley. This is an open-access article distributed under the terms of the Creative Commons Attribution License (CC BY). The use, distribution or reproduction in other forums is permitted, provided the original author(s) and the copyright owner(s) are credited and that the original publication in this journal is cited, in accordance with accepted academic practice. No use, distribution or reproduction is permitted which does not comply with these terms.
*Correspondence: Erin M. Buckley, ZXJpbi5idWNrbGV5QGVtb3J5LmVkdQ==
†These authors share first authorship