
95% of researchers rate our articles as excellent or good
Learn more about the work of our research integrity team to safeguard the quality of each article we publish.
Find out more
ORIGINAL RESEARCH article
Front. Neurol. , 15 September 2022
Sec. Pediatric Neurology
Volume 13 - 2022 | https://doi.org/10.3389/fneur.2022.844911
 Ruimin Wu1†
 Yan Gao1†Huaqiong Zhang2Yijia Chen1Fan Tan1Daobing Zeng1Huabing Wan1Yi Yang1Jiaowei Gu3*
 Zhijun Pei1,4*
To explore the cerebral metabolic patterns of cerebral palsy (CP) patients without structural abnormalities by brain magnetic resonance imaging (MRI) scans, we evaluated 18F-fluoro-deoxyglucose positron emission tomography (18F-FDG PET) imaging features in patients. Thirty-one children with CP [Gross Motor Function Classification System (GMFCS) levels II-V] showing no structural abnormalities by MRI were enrolled in this study. Regional glucose metabolic activity values were calculated using Scenium software and compared between the right and left cerebral hemispheres. These comparisons revealed asymmetric metabolic reductions in the central region, cerebellum, frontal lobe, and parietal lobe (p < 0.01). We next determined whether averaged brain metabolic activity values in different brain regions correlated with GMFCS levels. The metabolic activity values of basal ganglia, left temporal lobe, and cerebellum correlated negatively with GMFCS scores (all p < 0.05). This method was applied to the left cerebellum, which showed higher metabolic activity values than those in the right cerebellum in most patients (83.8%), and these values also correlated negatively with GMFCS scores (Spearman's r = −0.36, p = 0.01). Differential cortical glucose metabolism by 18F-FDG PET, may help to distinguish between different CP diagnoses that are not detected by MRI.
Cerebral palsy (CP) is a permanent, non-progressive neurological disorder that is typically characterized by physical disabilities. The majority of patients with CP have motor disabilities including abnormal movement and posture, and cognitive and speech impairments, along with abnormal perceptual symptoms (1). Most cases of CP in children can be attributed to a transient adverse event, such as a preterm birth or non-progressive brain lesions at or around the time of birth. These cases are mainly characterized by CP, which comprises a mixture of dystonic, athetoid, and ataxic features (2). The Gross Motor Function Classification System (GMFCS) is used to classify the severity of motor function deficits in patients with CP, and is graded from 5 (“bad”) to 1 (“good”) (3, 4). Individuals with CP and their families have lower qualities of life than those of the general population (5).
Clinical diagnosis of CP is primarily based on identifying symptoms of motor and cognitive impairments in combination with etiological data and pathological examination. In the last decade, several studies have explored the structural and functional imaging correlates of impairments in social cognition (6–9). Cerebral morphology has been evaluated using radiological imaging methods, especially computed tomography (CT) and magnetic resonance imaging (MRI) (10–12). However, no specific morphological abnormalities have been identified using these structural imaging methods for the earlier stages of CP. Functional MRI has been used to diagnose specific clinical forms of CP in children (13), but it has reported that some children with CP have no abnormalities in their MRI scans (14).
Metabolic activity in the brain can be measured using 18F-fluoro-deoxyglucose positron emission tomography (18F-FDG PET) (15). Radiotracer concentrations in specific regions of the brain reflect disease-related patterns of neurofunctional changes, meaning that these clinical changes can therefore inform disease diagnosis. 18F-FDG PET is used to measure an index of cerebral glucose metabolism for several neurodegenerative brain diseases (16, 17), such as Alzheimer's disease (18), spastic CP (19), and Parkinson's disease (20, 21). PET has recently been introduced for monitoring gene therapy for CP (19, 22) and supranuclear palsy (23), suggesting that it is helpful in the differential diagnosis and therapy improvement of CP (24, 25). 18F-FDG PET/CT results demonstrate differential cell metabolism-related activation and deactivation patterns in the motor areas of children with spastic diplegic CP (26). To date, regional cerebral FDG uptake has been analyzed using several different techniques, and there is no standard approach to the early diagnosis of CP without structural abnormalities. None of the studies described above have explored the correlation of motor function with cerebral glucose metabolism, especially in the cortex, the impairment of which is a fundamental feature of CP.
Therefore, we investigated the distinctive patterns of cerebral metabolism changes in children with retrospectively diagnoses of CP, but who exhibited no structural abnormalities on MRI. This trial study establishes a reference dataset that can be compared with single patient datasets. We hypothesized cerebral glucose metabolism in the brain would correlate with GMFCS scores in CP patients. If so, these findings might eventually be helpful in the clinical diagnosis of individual CP patients.
Medical records of thirty-one CP patients (2–4 years of age; 23 male, 8 female) were recruited from the Taihe Hospital. The inclusion criteria were diagnosed cases of CP caused by transient injury, without clinical complications of epilepsy. During clinical evaluation, the motor, linguistic, and cognitive functions of patients were assessed using the GMFCS (12) as our previous study (27), with all patients in the study classified as level II–V (Table 1). All subjects undergoing conventional MRI showed no structural brain abnormalities with regard to their clinical findings. The exclusion criteria: patients with acute infections, major organs (e.g., liver or kidney) dysfunction, and other space occupying lesion in brain. The present study was approved by the Research Ethics Committee at Taihe Hospital (No. 20140801).
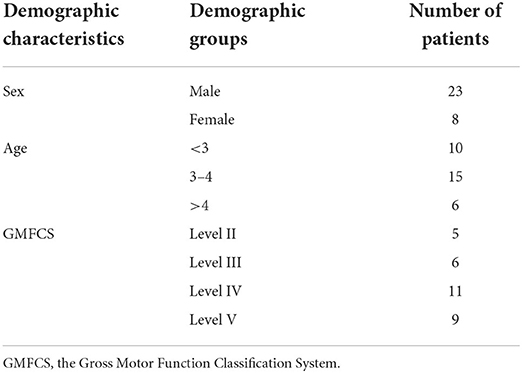
Table 1. Clinical features of the studied cohort (total number = 31).
Images of cerebral glucose metabolism were acquired using an 18F-FDG PET/CT system (Biograph mCT-64; Siemens Healthcare). Most patients fasted for at least 6 h, but some fasted for only 4 h for the risk of hypoglycemia. They had free access to water until the start of the imaging. Children were placed supine on the scan table after sedation in the absence of any factors that could affect their cerebral metabolism before the scan. FDG was administered intravenously at a dose of 3.5 MBq/kg. The head position of the patient was monitored 45 min later, with the monitoring lasting 10 min. The PET images were reconstructed using a posterior-based three-dimensional iterative algorithm. After which, followed by iteratively attenuation correction with a low-dose CT image (28). Then standardized uptake values (SUVs) were normalized to the amount of injected 18F-FDG, patient body weight.
Image processing was performed, and the results were visually evaluated by two experienced nuclear medicine physicians blinded to the final clinical diagnosis. Quantitative analysis of axial, coronal, and sagittal slices of the brain PET images was performed using Scenium software (Siemens Healthcare), as previously described (29). This software uses a standard template containing multiple 3D anatomical regions of interest (ROIs) to find an accurate match for each cortical structure. To analyze the concentration of tracer in the brain, we quantified the activity concentration for the following nine regional volume of interests (VOIs): basal ganglia, central region, cerebellum, cingulate and paracingulate gyri, frontal lobe, mesial temporal lobe, occipital lobe, parietal lobe, and temporal lobe. The 18F-FDG concentration in the whole brain was also calculated as a reference. Averages of the mean standardized uptake value (SUVmean) and the asymmetry index [2 × 100 (L–R)/(L + R)] were calculated in each of the selected brain regions. SUVmean values of all ROIs were divided by the mediastinal blood pool in order to correct for inter-individual variability.
SPSS software (version 24.0; SPSS for Windows) was used to perform the statistical analysis. Spearman's rho test was used to evaluate correlations between the SUVmean and GMFCS levels in patients with CP. The regional SUVmean values were compared between the left and right cerebral hemispheres. Comparisons between two groups were determined using two sample t-test for normally distributed data, otherwise using a non-parametric Mann Whitney U-test. Significance levels were set at p < 0.05.
The demographics of the study population and the GMFCS level results are presented in Table 1. The patients with CP comprised 23 males and 8 females. The median age of them was 3 years, with a range of 2–4 years at the time of 18F-FDG PET imaging. All patients were assessed clinically using the GMFCS, with the levels assigned ranging from II–V and the majority of patients showing severe CP (GMFCS level IV–V, 64.5%).
Based on 18F-FDG PET imaging, regional neuronal activity was determined in each of the patients with CP. The levels of metabolic activity for each ROI are presented in Table 2. In the analysis of regional metabolic activity, a left > right asymmetry was more frequently observed. Figure 1 shows a typical brain 18F-FDG PET image from a CP patient demonstrating left > right asymmetry. In the individual analysis, 24 (77.4%), 26 (83.8%), 22 (71.0%), and 23 patients (74.2%) exhibited left > right asymmetry of glucose metabolism in the central region, cerebellum, frontal lobe and parietal lobe, respectively. Statistical analyses revealed that levels of glucose metabolism in the left central region, cerebellum, frontal lobe, and parietal lobe were significantly higher than those of the corresponding regions in the right hemisphere (p < 0.01).

Table 2. Cerebral metabolic ratio and asymmetry index in CP patients.
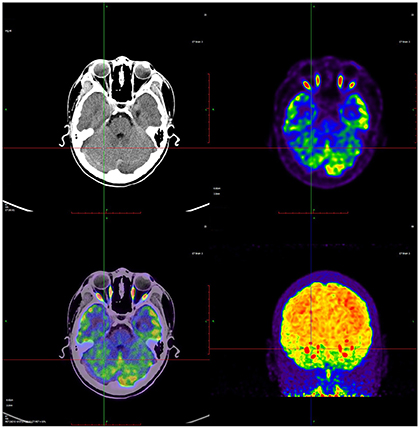
Figure 1. A representative 18F-FDG brain PET image from a CP child showed the relative higher glucose metabolism in left cortex. Red color indicates relatively high glucose metabolism and blue relatively low in comparison to corresponding regions.
To investigate the potential association between regional metabolic activity and motor functioning, the children were divided into four groups according to their GMFCS levels. Figure 2 shows regional increases in the metabolic activity of patients with GMFCS level II compared to those with GMFCS level V. Based on the PET data, correlation analyses between regional SUVmean values and GMFCS scores were calculated and are summarized in Table 3 for each patient. As shown in Table 3, levels of motor function measured by the GMFCS were significantly negatively correlated with SUVmean in: bilateral basal ganglia (e.g., right: Spearman's r = −0.419, p = 0.02; mean: Spearman's r = −0.384, p = 0.03); left cerebellum (Spearman's r = −0.369, p = 0.01); left occipital lobe (Spearman's r = −0.388, p = 0.02); and bilateral temporal lobe (e.g., left: Spearman's r = −0.413, p = 0.03; mean: Spearman's r = −0.381, p = 0.02). Figure 3 shows scatter plots corresponding to these significant correlations from the entire study dataset. There were no other significant correlations in any other ROI.
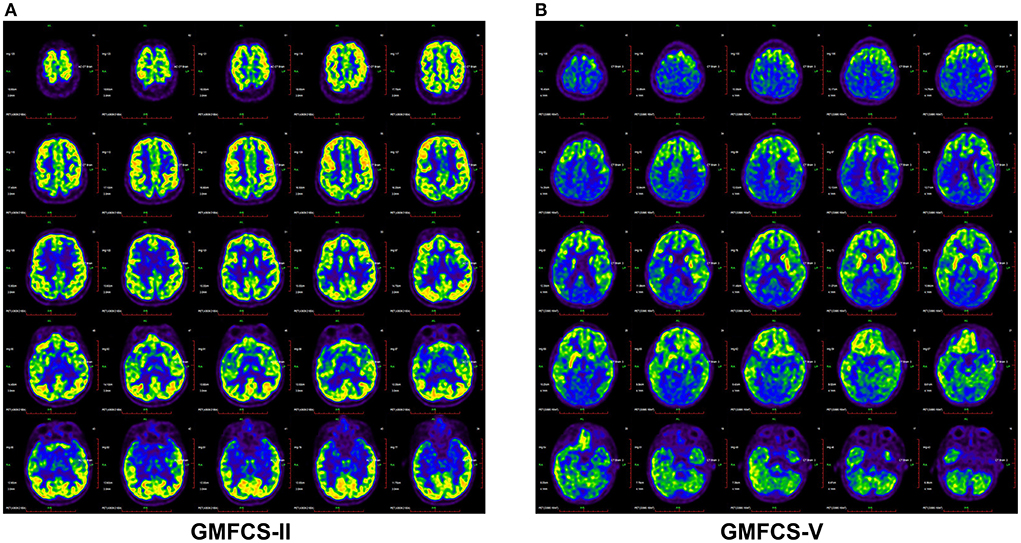
Figure 2. Brain 18F-FDG PET images demonstrated different metabolic activity of CP patients with GMFC level II (A) and V (B). The CP patients with GMFC level V exhibited decreased activity compared with GMFC level II.
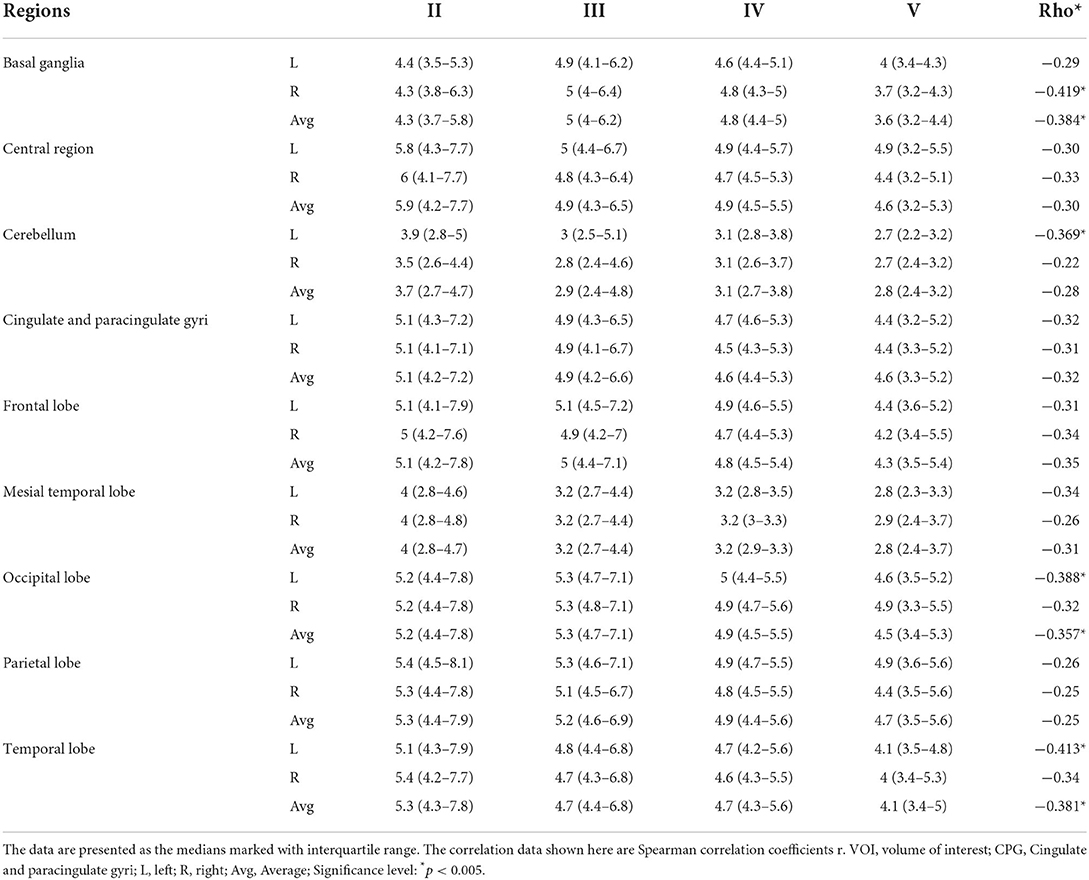
Table 3. Association between the regional 18F-FDG uptake as obtained by volume of interest (VOI) analysis and the GMFCS levels of the CP patients (n = 31).
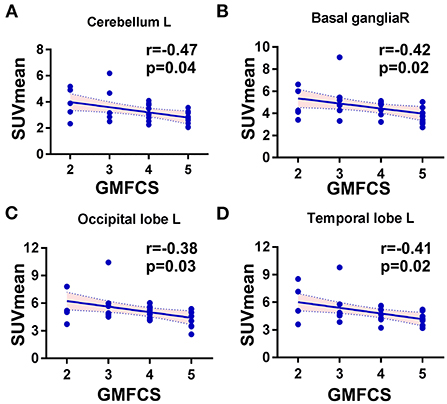
Figure 3. Scatter plots showing the significant correlations between GMFC levels and regional SUVmean in CP patients. (A) The cerebellum, left side: Spearman r = −0.47, p = 0.01. (B) The basal ganglia, right: Spearman r = −0.42, p = 0.02. (C) The occipital lobe, left side: Spearman r = −0.39, p = 0.02. (D) The temporal lobe, left side: Spearman r = −0.41, p = 0.03.
The dataset as whole revealed that the left cerebellum showed higher metabolic activity than the right in most patients (83.8%) (Figure 4), with levels of metabolic activity also negatively correlated with GMFCS scores (Spearman's r = −0.47, p = 0.01). Neural activity in this brain region is known to correlate with different aspects of motor function.
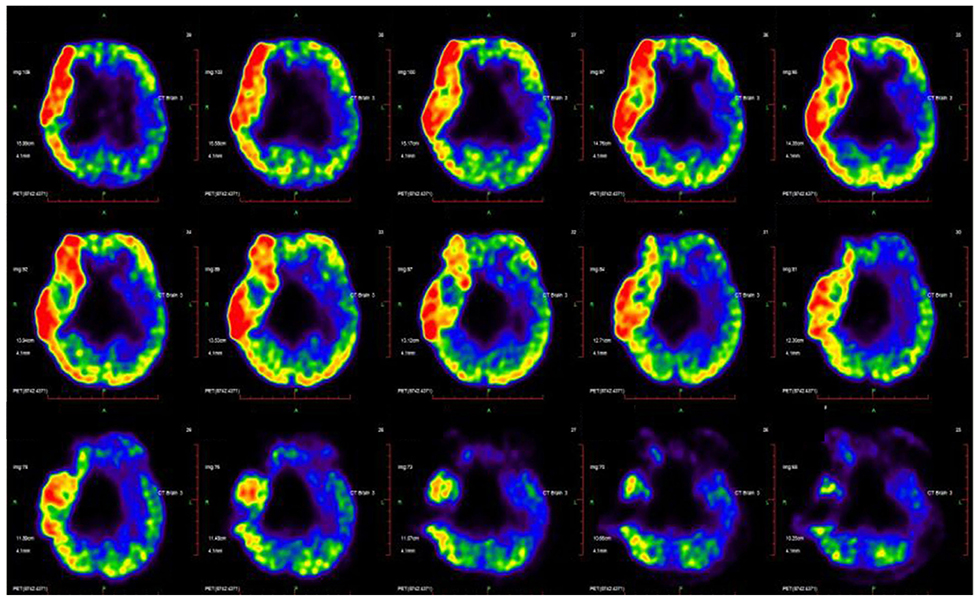
Figure 4. CP's disease-related pattern identified by analysis of FDG PET scans from 31 CP patients. The glucose metabolism in the left cerebellum relative higher than the right hemisphere.
It is important to diagnose patients with CP as soon as possible to enable early interventions and accurate evaluation of any therapeutic effects. We investigated the typical cerebral glucose metabolism of patients with CP using brain 18F-FDG PET imaging, although the patients showed no apparent evidence of structural abnormalities on brain MRI. We found metabolic asymmetries, with a left > right asymmetry in several brain regions in the central region, cerebellum, frontal lobe, and parietal lobe. This marked asymmetric pattern largely reflects physiological developmental changes, rather than structural abnormalities or the clinical presentation of CP. Despite the small size of our patient sample, we were able to define CP-specific brain metabolic patterns based on 18F-FDG PET imaging. Our results indicate a significant correlation between regional glucose metabolism and the extent of motor impairment, as assessed by GMFCS level. These findings are encouraging enough for our approach to be developed further to support the clinical diagnosis of cases of CP without structural abnormalities.
Neuroimaging studies contribute to identifying brain abnormalities and improving the accuracy of CP diagnosis. Previous studies have reported structure–function associations between clinical CP and patterns in MRI data, with structural abnormalities in children with CP corresponding to white matter injury (30) or gray matter injury (31). However, ~15% of children show no abnormalities in their MRI scans. According to Mohan et al. (32), brain single photon emission-computed tomography (SPECT) has also been applied to the diagnosis of CP and can detect abnormalities in the perfusion of cortical regions, subcortical nuclei, and cerebellar regions. Compared with SPECT, MRI, and other anatomical imaging techniques, PET scanning is more sensitive at detecting functional abnormalities associated with CP (22). The molecular imaging modality and brain metabolism measured using 18F-FDG PET scanning reflects regional neuronal activity. Asymmetries in glucose metabolism have also typically been observed in epilepsy (33) and corticobasal degeneration (34), and may help clinicians to diagnose these brain diseases. The present study was the first to use PET to identify typical brain metabolic patterns in CP patients without MRI abnormalities.
A prior PET study revealed thalamic and parieto-occipital-temporal cortical hypometabolism in spastic diplegic patients without apparent structural abnormality (35). In accordance with the PET and SPECT findings of this earlier study, we also observed that children with CP exhibited relatively higher levels of glucose metabolism in several cortical regions. Our study showed asymmetrical metabolism in a number of cortical regions, with left > right asymmetries most prominent in the parietal lobe, hemisphere, central region, cerebellum, and frontal lobe. In contrast, levels of the metabolism in the occipital-temporal cortices were not significantly increased compared with those in the contralateral brain regions.
During the progression of CP, children with the disease but without structural brain abnormalities continue to experience motor and cognitive dysfunction, and language and neurobehavioral impairments (2, 7). In general, the extent of metabolic activity changes measured by 18F-FDG PET imaging correlates with the clinical status and severity of neurodegenerative disease (36, 37). However, few studies to date have investigated brain metabolism in CP correlated with motor function. Fowler et al. found a negative correlation of metabolic activity with selective voluntary motor control in the cerebellum (19). We used the GMFCS in our study to quantify motor function, and observed a significant correlation between GMFCS scores and regional cortical hypometabolism in regions such as the basal ganglia, left cerebellum, left occipital lobe, and temporal lobe. Cerebral metabolic patterns might also be helpful for evaluating the differential effects of treatments on motor function. The efficacies of different treatments have been assessed according to the clinical function and cerebral glucose metabolism activity in children with CP based on the grading of gross motor function (27, 38).
One limitation of the study was the small patient sample size, which did not allow us to collect enough data to cover all of the GMFCS levels. However, similar PET studies have included even fewer participants with CP (19, 38). Another limitation is that we did not include healthy children as a control group in the study. Thus, although we investigated cerebral metabolic patterns in children with CP who had varying levels of motor function, the corresponding patterns in healthy children are unknown. Concerning the effects of radiation, further research is suggested to minimize ionizing radiation to children. This study would have been strengthened by examining the correlations between patients and healthy controls using 18F-FDG PET scanning.
In conclusion, individual levels of glucose metabolism in the cerebral cortex, cerebellum, and basal ganglia correlated well with the severity of clinical motor dysfunction. The diagnosis of CP is based on an interview, observation, and neurological examination. The typical cerebral metabolic patterns of CP identified here based on brain 18F-FDG PET imaging will help clinicians to differentiate between CP associated with different levels of motor impairment. Compared to MRI, it is expensive examination, which limits its popularization. But this is particularly true for cases of CP in which microstructural abnormalities could not detected by MRI. A major benefit of this study is that the findings can be used as a reference CP patient dataset, which might ultimately contribute to diagnosing CP in its early stages. The matabolic pattern could be validated and conducted on the animal model in the further study.
The raw data supporting the conclusions of this article will be made available by the authors, without undue reservation.
The studies involving human participants were reviewed and approved by the Research Ethics Committee at Taihe Hospital. Written informed consent to participate in this study was provided by the participants' legal guardian/next of kin.
RW, JG, and ZP contributed to the study design. HW, HZ, and FT contributed to the data acquisition. YG and RW simulated, analyzed the data, and drafted the manuscript. DZ, YY, and YC were involved in data interpretation. ZP and YG contributed to the critical revision of the manuscript. All authors revised the manuscript, read, and approved the final manuscript.
This work was supported by the Hubei Province's Outstanding Medical Academic Leader program, the Foundation for Innovative Research Team of Hubei Provincial Department of Education (No. T2020025), the General Project of Hubei Provincial Department of Education (No. B2021160), the Hubei Provincial Department of Science and Technology Innovation Group Program (No. 2019CFA034), Innovative Research Program for Graduates of Hubei University of Medicine (No. YC2020011), and the Key Discipline Project of Hubei University of Medicine.
We thanked Long Wang (Hubei University of Medicine) for his assistance in the data analysis.
The authors declare that the research was conducted in the absence of any commercial or financial relationships that could be construed as a potential conflict of interest.
All claims expressed in this article are solely those of the authors and do not necessarily represent those of their affiliated organizations, or those of the publisher, the editors and the reviewers. Any product that may be evaluated in this article, or claim that may be made by its manufacturer, is not guaranteed or endorsed by the publisher.
The Supplementary Material for this article can be found online at: https://www.frontiersin.org/articles/10.3389/fneur.2022.844911/full#supplementary-material
1. Van Naarden Braun K, Doernberg N, Schieve L, Christensen D, Goodman A, Yeargin-Allsopp M. Birth prevalence of cerebral palsy: a population-based study. Pediatrics. (2016) 137:e20152872. doi: 10.1542/peds.2015-2872
2. Korzeniewski SJ, Slaughter J, Lenski M, Haak P, Paneth N. The complex aetiology of cerebral palsy. Nat Rev Neurol. (2018) 14:528–43. doi: 10.1038/s41582-018-0043-6
3. Barthakur JKGS. Single photon emission computed tomography scan as a diagnostic tool in children with cerebral palsy treated with human embryonic stem cells. J Nucl Med Radiat Ther. (2015) 06:1000223. doi: 10.4172/2155-9619.1000223
4. Clutterbuck GL, Auld ML, Johnston LM. Performance of school-aged children with cerebral palsy at GMFCS levels I and II on high-level, sports-focussed gross motor assessments. Disabil Rehabil. (2019) 43:1–9. doi: 10.1080/09638288.2019.1650964
5. Robertson C, Ricci MF, O'Grady K, Oskoui M, Goez H, Yager JY, et al. Prevalence estimate of cerebral palsy in northern alberta: births, 2008-2010. Can J Neurol Sci. (2017) 44:366–74. doi: 10.1017/cjn.2017.33
6. Cauda F, Nani A, Manuello J, Liloia D, Tatu K, Vercelli U, et al. The alteration landscape of the cerebral cortex. Neuroimage. (2019) 184:359–71. doi: 10.1016/j.neuroimage.2018.09.036
7. Chen A, Dyck HS, Oskoui M, Shevell M. Losing a diagnosis of cerebral palsy: A comparison of variables at 2 and 5 years. Dev Med Child Neurol. (2020) 62:83–8. doi: 10.1111/dmcn.14309
8. Valk SL, Bernhardt BC, Trautwein FM, Bockler A, Kanske P, Guizard N, et al. Structural plasticity of the social brain: differential change after socio-affective and cognitive mental training. Sci Adv. (2017) 3:e1700489. doi: 10.1126/sciadv.1700489
9. Yeargin-Allsopp M, Van Naarden Braun K, Doernberg NS, Benedict RE, Kirby RS, Durkin MS. Prevalence of cerebral palsy in 8-Year-Old children in three areas of the united states in 2002: a multisite collaboration. Pediatrics. (2008) 121:547–54. doi: 10.1542/peds.2007-1270
10. Hickeson M, Sfakianaki E. Nuclear and molecular imaging in cerebral. Palsy. (2018) 133–41. doi: 10.1007/978-3-319-67858-0_14
11. Korzeniewski SJ, Birbeck G, DeLano MC, Potchen MJ, Paneth N. A systematic review of neuroimaging for cerebral palsy. J Child Neurol. (2008) 23:216–27. doi: 10.1177/0883073807307983
12. Reid LB, Rose SE, Boyd RN. Rehabilitation and neuroplasticity in children with unilateral cerebral palsy. Nat Rev Neurol. (2015) 11:390–400. doi: 10.1038/nrneurol.2015.97
13. Prasad R, Verma N, Srivastava A, Das BK, Mishra OP. Magnetic resonance imaging, risk factors and co-morbidities in children with cerebral palsy. J Neurol. (2011) 258:471–8. doi: 10.1007/s00415-010-5782-2
14. Colver A, Fairhurst C, Pharoah POD. Cerebral palsy. Lancet. (2014) 383:1240–9. doi: 10.1016/S0140-6736(13)61835-8
15. Hansen TD, Warner DS, Todd MM, Vust LJ. The role of cerebral metabolism in determining the local cerebral blood flow effects of volatile anesthetics: Evidence for persistent flow-metabolism coupling. J Cereb Blood Flow Metab. (1989) 9:323–8. doi: 10.1038/jcbfm.1989.50
16. Jamadar SD, Ward PG, Li S, Sforazzini F, Baran J, Chen Z, et al. Simultaneous task-based BOLD-fMRI and [18-F] FDG functional PET for measurement of neuronal metabolism in the human visual cortex. Neuroimage. (2019) 189:258–66. doi: 10.1016/j.neuroimage.2019.01.003
17. Politis M. Neuroimaging in Parkinson disease: From research setting to clinical practice. Nat Rev Neurol. (2014) 10:708–22. doi: 10.1038/nrneurol.2014.205
18. Sala A, Caprioglio C, Santangelo R, Vanoli EG, Iannaccone S, Magnani G, et al. Brain metabolic signatures across the Alzheimer's disease spectrum. Eur J Nucl Med Mol Imaging. (2020) 47:256–69. doi: 10.1007/s00259-019-04559-2
19. Fowler EG, Oppenheim WL, Greenberg MB, Staudt LA, Silverman DHS. Brain metabolism during a lower extremity voluntary movement task in children with spastic cerebral palsy. Front Hum Neurosci. (2020) 14. doi: 10.3389/fnhum.2020.00159
20. Lipp A, Skowronek C, Fehlner A, Streitberger K, Braun J, Sack I. Progressive supranuclear palsy and idiopathic Parkinson's disease are associated with local reduction of in vivo brain viscoelasticity. Eur Radiol. (2018) 28:3347–54. doi: 10.1007/s00330-017-5269-y
21. Wang R, Xu B, Guo Z, Chen T, Zhang J, Chen Y, et al. Suite PET/CT neuroimaging for the diagnosis of Parkinson's disease: statistical parametric mapping analysis. Nucl Med Commun. (2017) 38:164–9. doi: 10.1097/MNM.0000000000000622
22. Sharma A, Gokulchandran N, Kulkarni P, Mullangi SK, Bhagawanani K, Ganar V, et al. Multiple cellular therapies along with neurorehabilitation in spastic diplegic cerebral palsy: a case report. Innov Clin Neurosci. (2020) 17:31–4.
23. Dodich A, Cerami C, Inguscio E, Iannaccone S, Magnani G, Marcone A, et al. The clinico-metabolic correlates of language impairment in corticobasal syndrome and progressive supranuclear palsy. Neuroimage Clin. (2019) 24:102009. doi: 10.1016/j.nicl.2019.102009
24. Heiss EH, Schachner D, Donati M, Grojer CS, Dirsch VM. Increased aerobic glycolysis is important for the motility of activated VSMC and inhibited by indirubin-3′-monoxime. Vasc Pharmacol. (2016) 83:47–56. doi: 10.1016/j.vph.2016.05.002
25. Heiss W, Zimmermann-Meinzingen S. PET imaging in the differential diagnosis of vascular dementia. J Neurol Sci. (2012) 322:268–73. doi: 10.1016/j.jns.2012.09.023
26. Jimenez-Aguero R, Emparanza JI, Beguiristain A, Bujanda L, Alustiza JM, Garcia E, et al. Novel equation to determine the hepatic triglyceride concentration in humans by MRI: diagnosis and monitoring of NAFLD in obese patients before and after bariatric surgery. BMC Med. (2014) 12:137. doi: 10.1186/s12916-014-0137-y
27. Gu J, Huang L, Zhang C, Wang Y, Zhang R, Tu Z, et al. Therapeutic evidence of umbilical cord-derived mesenchymal stem cell transplantation for cerebral palsy: a randomized, controlled trial. Stem Cell Res Ther. (2020) 11. doi: 10.1186/s13287-019-1545-x
28. López-González FJ, Silva-Rodríguez J, Paredes-Pacheco J, Niñerola-Baizán A, Efthimiou N, Martín-Martín C, et al. Intensity normalization methods in brain FDG-PET quantification. Neuroimage. (2020) 222:117229. doi: 10.1016/j.neuroimage.2020.117229
29. Tzourio-Mazoyer N, Landeau B, Papathanassiou D, Crivello F, Etard O, Delcroix N, et al. Automated anatomical labeling of activations in SPM using a macroscopic anatomical parcellation of the MNI MRI single-subject brain. Neuroimage. (2002) 15:273–89. doi: 10.1006/nimg.2001.0978
30. Stockmaniii J. Clinical and MRI correlates of cerebral palsy: the european cerebral palsy study. Yearbook Pediatr. (2008) 2008:341–3. doi: 10.1016/S0084-3954(08)70458-5
31. Reid SM, Dagia CD, Ditchfield MR, Reddihough DS. Grey matter injury patterns in cerebral palsy: associations between structural involvement on MRI and clinical outcomes. Dev Med Child Neurol. (2015) 57:1159–67. doi: 10.1111/dmcn.12800
32. Mohan P, Shroff G, Mahajan H. Serial brain SPECT imaging in monitoring treatment response to stem cell therapy in cerebral palsy patients. Paper Pres Soc Nucl Med Mol Imaging. (2014) 55:1850.
33. Pilli VK, Jeong JW, Konka P, Kumar A, Chugani HT, Juhász C. Objective PET study of glucose metabolism asymmetries in children with epilepsy: implications for normal brain development. Hum Brain Mapp. (2019) 40:53–64. doi: 10.1002/hbm.24354
34. Hirono N, Ishii K, Sasaki M, Kitagaki H, Hashimoto M, Imamura T, et al. Features of regional cerebral glucose metabolism abnormality in corticobasal degeneration. Dementia Geriatr Cogn Disord. (2000) 11:139–46. doi: 10.1159/000017227
35. Kerrigan JF, Chugani HT, Phelps ME. Regional cerebral glucose metabolism in clinical subtypes of cerebral palsy. Pediatr Neurol. (1991) 7:415–25. doi: 10.1016/0887-8994(91)90024-F
36. Bohnen NI, Minoshima S. FDG-PET and molecular brain imaging in the movement disorders clinic. Neurology. (2012) 79:1306–7. doi: 10.1212/WNL.0b013e31826c1be1
37. Goethals I, Dobbeleir A, Groote JD, Berwouts D, Smeets P, Ham H. Changes in fluor-18 fluorodeoxyglucose distribution in skeletal muscles and viscera in a case of cerebral palsy as shown on positron emission tomography (PET) scan. Xmm Newton Proposal. (2010) 32:493–4.
Keywords: cerebral palsy, FDG-PET, brain metabolism, GMFCS scores, diagnosis
Citation: Wu R, Gao Y, Zhang H, Chen Y, Tan F, Zeng D, Wan H, Yang Y, Gu J and Pei Z (2022) Metabolic assessment of cerebral palsy with normal clinical MRI using 18F-FDG PET imaging: A preliminary report. Front. Neurol. 13:844911. doi: 10.3389/fneur.2022.844911
Received: 04 February 2022; Accepted: 17 August 2022;
Published: 15 September 2022.
Edited by:
Yue Chen, Southwest Medical University, ChinaReviewed by:
Wojciech Kułak, Medical University of Białystok, PolandCopyright © 2022 Wu, Gao, Zhang, Chen, Tan, Zeng, Wan, Yang, Gu and Pei. This is an open-access article distributed under the terms of the Creative Commons Attribution License (CC BY). The use, distribution or reproduction in other forums is permitted, provided the original author(s) and the copyright owner(s) are credited and that the original publication in this journal is cited, in accordance with accepted academic practice. No use, distribution or reproduction is permitted which does not comply with these terms.
*Correspondence: Zhijun Pei, cHpqem1sMTk4MEB0YWloZWhvc3BpdGFsLmNvbQ==; Jiaowei Gu, Z2p3ODhnandAMTYzLmNvbQ==
†These authors have contributed equally to this work
Disclaimer: All claims expressed in this article are solely those of the authors and do not necessarily represent those of their affiliated organizations, or those of the publisher, the editors and the reviewers. Any product that may be evaluated in this article or claim that may be made by its manufacturer is not guaranteed or endorsed by the publisher.
Research integrity at Frontiers
Learn more about the work of our research integrity team to safeguard the quality of each article we publish.