 Florencia Sanmartino1,2Álvaro J. Cruz-Gómez1,2Raúl Rashid-López2,3Elena Lozano-Soto1,2Fernando López-Sosa2Amaya Zuazo4Jesús Riqué-Dormido5
 Raúl Espinosa-Rosso2,3,6
 Javier J. González-Rosa1,2*
- 1Department of Psychology, University of Cadiz, Cádiz, Spain
- 2Psychophysiology and Neuroimaging Group, Institute of Biomedical Research Cadiz (INiBICA), Cádiz, Spain
- 3Department of Neurology, Puerta del Mar University Hospital, Cádiz, Spain
- 4Department of Radiodiagnostic and Medical Imaging, Puerta del Mar University Hospital, Cádiz, Spain
- 5Department of Neurosurgery, Puerta del Mar University Hospital, Cádiz, Spain
- 6Department of Neurology, Jerez de la Frontera University Hospital, Jerez de la Frontera, Spain
Background: Excessive oscillations at beta frequencies (13–35 Hz) in the subthalamic nucleus (STN) represent a pathophysiological hallmark of Parkinson's disease (PD), which correlates well with parkinsonian symptoms and is reduced in response to standard disease treatments. However, the association of disease-specific regional gray matter (GM) atrophy or cortical thickness (CT) with the presence of STN beta oscillatory activity has been poorly investigated but is of relevance given the potential of these variables for extracting information about PD pathophysiology. This exploratory study investigated the involvement of regional GM volume and CT in the basal ganglia-cortical network and its potential association with the presence of STN beta oscillatory activity in PD.
Methods: We acquired preoperative GM densities on T1-weighted magnetic resonance imaging scans and we carried out regional estimation of GM volume and CT. LFP activities from the STN were recorded post-operatively in 7 cognitively preserved PD patients off dopaminergic medication undergoing deep-brain stimulation surgery. Oscillatory beta power was determined by power spectral density of 4-min resting state STN LFP activity. Spearman partial correlations and regression analysis were used to screen the presence of STN beta power for their relationship with GM volume and CT measurements.
Results: After controlling for the effects of age, educational level, and disease duration, and after correcting for multiple testing, enhanced STN beta power showed significant and negative correlations between, first, volume of the right putamen and left caudate nucleus, and second, smaller CT in frontal regions involving the left rostral middle frontal gyrus (MFG) and left medial orbitofrontal gyrus. A lower volume in the right putamen and a lower CT in the left MFG demonstrated the strongest associations with increased STN beta power.
Conclusions: These tentative results seem to suggest that STN LFP beta frequencies may be mainly linked to different but ongoing parallel neurodegenerative processes, on the one hand, to GM volume reduction in dorsal striatum, and on the other hand, to CT reduction of prefrontal-“associative” regions. These findings could further delineate the brain structural interactions underpinning the exaggerated STN beta activity commonly observed in PD patients.
Introduction
A commonly acknowledged way to study oscillatory activity in PD is to record the local field potentials (LFPs), which are thought to represent the summation of local electrical fields near the recording electrodes, through implanted electrodes in the subthalamic nucleus (STN) intraoperatively during or post-operatively after deep-brain stimulation (DBS) surgery (1, 2). The beta rhythm (13–35 Hz) is the longest-studied STN oscillation and has been theorized to play a key role in Parkinson's disease (3). Increased beta oscillations are the most salient LFP event during resting and awake states in PD patients (4), and has been correlated with symptom severity (5). Furthermore, reduction of this excessive beta oscillatory activity by treatment with levodopa (6) and DBS (7) has been linked with motor symptom improvement (8). As a result, there is growing confirmation highlighting the potential utility of STN beta activity as a functional biomarker for PD motor symptom severity and treatment response (9).
There is strong evidence supporting the notion that the progressive degeneration of dopaminergic neurons in the substantia nigra pars compacta (SN) that project to the striatum is a trait of PD pathology (10, 11), although the role of the striatum as a possible source of beta frequency rhythms in PD is still poorly understood (12). In addition, the underlying neural structure(s) and circuit networks accountable for the prominent STN beta oscillations are indeed intensely controversial. Studies have pointed to the dorsal part of the STN as the main source of this pathological synchronization of beta oscillatory activity (13–15), likely influenced by both the interaction of the STN with other basal ganglia structures, particularly the external segment of the globus pallidus (GPe) (16–18), and exogenous or cortical pattering (17, 19, 20).
In this respect, converging studies indicate that the STN is structurally and functionally connected to different cortical and other gray matter (GM) nuclei (21), with significant degeneration and changes in these projection pathways in PD patients (22), which likely impact the structural integrity of their brain networks. Although a variety of studies have reported thinning of both the frontal and posterior cortex (23–25) and increased atrophy in subcortical (particularly caudate and putamen) and cortical networks spanning frontal, temporal and parietal cortices (26–28), disease-specific regional cortical atrophy is still considered to be controversial as a brain marker in PD. In this regard, GM volume reduction or cortical thickness (CT) and their likely association with the presence of beta oscillatory activity have been poorly investigated, despite the attractive relationship between the variables for extracting information regarding cortico-basal ganglia pathophysiology.
In this preliminary study, we explored the presence of STN beta oscillatory activity and the associations with regional GM volume- and surface-based thickness measurements of the basal ganglia–thalamo-cortical regions in PD and proposed a new approach to integrate brain structural changes and STN functional activity that can be used as adjunctive markers to track the effectiveness of disease treatments and disease progression. We speculate that both reduced GM volume (i.e., understood as a hypothetical volume loss or increased atrophy) of basal ganglia nuclei and reduced CT thickness (i.e., understood as a hypothetical increased cortical thinning), particularly from those brain structures influencing STN functioning, may also contribute to abnormal striatal network dynamics and to the mechanism responsible for pathological synchronization of STN oscillations, resulting in enhanced beta frequency oscillations in PD.
Materials and Methods
Participants
Nine patients with idiopathic PD, as defined by the Parkinson's UK Brain Bank (29), undergoing bilateral surgical implantation of DBS electrodes in the STN to treat their motor symptomatology were recruited from the Movement Disorders Neurology Outpatient Clinic at the Puerta del Mar University Hospital. Two participants were excluded from the LFP study based on clinical judgment related to the externalization of DBS leads. The remaining seven participants (aged 37–65 years; five males and two females, mean disease duration: 13 years) included in this study exhibited typical motor symptoms, such as bradykinesia, rigidity, or tremor. Each patient's motor condition was evaluated preoperatively and post-operatively by a specialist in movement disorders with the Unified Parkinson's Disease Rating Scale (UPDRS, part III) (30) in the off- and on-medication states. Additionally, none of the patients showed significant cognitive impairment based on Mini-Mental State Examination (MMSE score <24) performance (31) or major depression based on the Beck Depression Inventory (BDI scores <18) (32). Clinical details are summarized in Table 1 (33, 34).
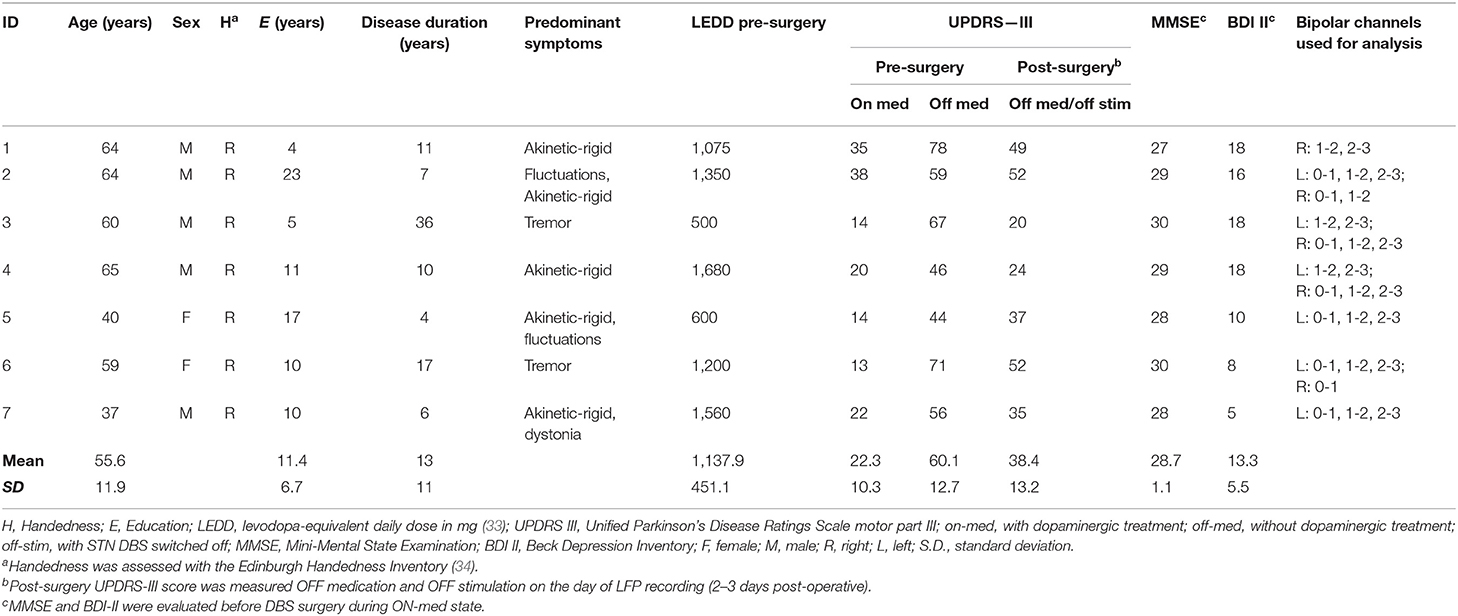
Table 1. Demographic and clinical details of the PD patients included in the study.
Surgical Procedure
Patients were asked to discontinue Parkinson's medications 24 h before DBS surgery. Operative procedures were performed according to the standard approach for bilateral implantation of DBS electrodes into the STN that has been described previously (35). The stereotactic coordinates and trajectories to the simultaneous bilateral STNs were preoperatively targeted using stereotactic magnetic resonance imaging (MRI) on a neuro-navigational platform (StealthStation; Medtronic). All participants received Medtronic 3389 leads (1.27 mm diameter, 1.5 mm contact length, 0.5 mm intercontact spacing) placed in the STNs of both hemispheres. Microelectrode array recordings and intraoperative clinical response to macrostimulation were used to adjust the final DBS electrode placement at the STN.
LFP Recordings
Following the routine DBS procedure of Puerta del Mar University Hospital, participants underwent an LFP study in the interval (2–3 days) between their DBS electrode implantation surgery and subsequent surgery for the implantation of extension wires to the subcutaneous stimulator. All medication doses of dopaminergic drugs were stopped for at least 12 h in participants, and LFP recordings took place in the clinically defined off state while the participants were comfortably seated in an eyes-open rest condition during ~4 min.
The STN DBS leads were connected by electrode extension cables, which were externalized through the scalp to a Physio16 input box and EGI's Geodesic EEG acquisition system (Electrical Geodesics Inc., EGI®, Eugene, OR). LFP signals were recorded during and digitized with a Net Amps 400 amplifier (EGI®) sampled at 1 kHz using Net Station Acquisition 5.4 software (EGI®). LFPs were obtained by rereferencing adjacent contact pairs of the DBS electrode (bipolar: 0–1, 1–2, and 2–3), which resulted in a maximum of three bipolar channels per electrode (see Figure 1A). Contact 0 is the most ventral, and contact 3 is the most dorsal.
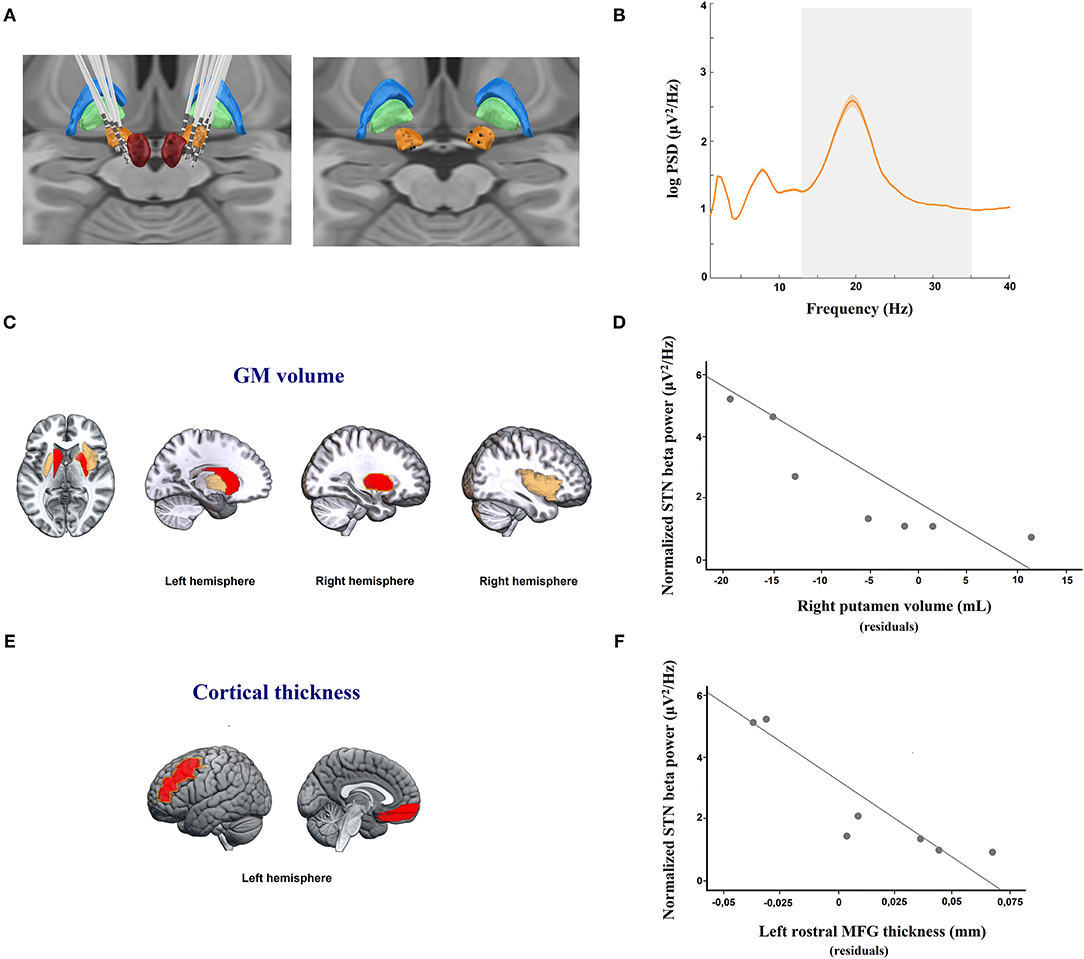
Figure 1. (A) DBS electrode location. Images were reconstructed and 3-D visualized using the Lead-DBS toolbox to determine the coordinates of each electrode contact. Right: DBS electrode localizations of 7 PD patients; and left: simulated location of the position of each bipolar register (black spheres, calculated by averaging the location of each pair of adjacent contacts) in the STN used for LFP analysis. Figures are visualized in the context of a 3D representation of the Morel stereotactic atlas in MNI space (Posterior view). The bilateral subthalamic nucleus (STN; orange), external globus pallidus (GPe; blue), internal globus pallidus (GPi; green), and red nucleus (RN; red) are shown. (B) Resting state STN spectral power in PD patients. Averaged (orange solid line) log-transformed power spectral density for STN-LFPs in 7 patients with Parkinson's disease off medication are shown. Orange shaded areas depict S.E.M of the mean for each frequency bin across patients. The x-axis represents frequency (Hz), and the y-axis represents the normalized power spectral density (log PSD, μV2/Hz). The gray shaded area indicates the beta frequency spectrum (13–35 Hz). (C) Regional analysis of gray matter (GM) volume showing areas negatively correlated, after adjustment for multiple testing, with local field potential (LFP) power in the beta band in the subthalamic nucleus (STN). The yellow line shows the right putamen, which was the only structure retained in the regression model predicting LFP beta activity in the STN (p < 0.01). (E) Regional analysis of cortical thickness (CT) volume showing areas negatively correlated, after adjustemt for multiple testing, with LFP power in the beta band in the subthalamic nucleus (STN). The yellow line shows the left rostral middle frontal gyrus (MFG), which was the only structure retained in the regression model predicting LFP beta activity in the STN (p < 0.01). (C,E) The red color denotes brain areas with significant partial correlations after FDR adjustment between regional GM volumes or CT measures and STN LFP beta activity. The yellow color indicates brain areas with a trend toward statistical significance after FDR adjustment between regional GM volumes and STN LFP beta activity. The red and yellows images are overlaid on a standard MNI T1 template. (D–F) Scatterplot graphs illustrating the partial correlations between STN LFP beta power and (D) right putamen nucleus atrophy and (F) left rostral MFG thinning, controlling for age, educational level, and disease duration. For illustration purposes, the y-axis represents the log-transformed power spectral density (log PSD, μV2/Hz), and the x-axis of each scatterplot graph represents the averaged residuals of age, educational level, and disease duration of (D) regional GM volume in the right putamen and (F) CT in the left rostral MFG.
Electrode Localization and LFP Data Analysis
First, electrodes placed in the STN were individually localized by merging the preoperative MRI and post-operative CT images using Lead-DBS software (36) (www.lead-dbs.org) and following the 2nd pipeline version (37). Thus, all STN leads were visualized post-operatively (see Figure 1A). Consequently, only bipolar channels located inside the STN, according to the DBS electrode reconstructions, were included in the subsequent LFP analysis (see Figure 1A). The LFP data were processed offline using Fieldtrip (38) and custom MATLAB 2018a routines (MathWorks, Natick, MA). The STN LFP data were bandpass-filtered between 0.5 and 98 Hz cutoff frequencies using a fifth-order Butterworth filter. Additionally, a notch filter (band-stop filter at 48–52 Hz, fifth-order Butterworth filters) was applied to remove power line interference at 50 Hz. Subsequently, the continuous recordings were segmented into epochs of 2 s in length. Epochs were rejected when they contained artifacts or non-physiological signals.
Power spectral density (PSD) was calculated by fast Fourier transform (FFT) algorithms using multiple tapers based on discrete prolate spheroidal sequences (DPSS). Beta power frequencies were defined for each participant as the frequency between 13 and 35 Hz at rest. Peak amplitudes for beta power were measured as the highest point of the spectrum in the range of 13–35 Hz. Importantly, no distinction between sensorimotor, associative, or limbic territories of the STN was taken into account for the estimation of LFP power activity, but only contacts including artifact-free data segments that were correctly placed into the STN were considered for further analysis. In 3 patients, bipolar channels of the right or left DBS electrode were specifically excluded from the analysis due to the fact that none of these bipolar channels met the abovementioned LFP inclusion criteria. Further, differences between hemispheres were initially checked by considering only participants in which both hemispheres could be correctly recorded. These analyses confirmed that there were no significant differences regarding the beta frequency peak between right or left hemispheres in our sample patients. As a result, the subsequent analysis distinguishing both hemispheres was not further considered. The resulting data were thus individually averaged across valid contact pairs and hemispheres and were normalized using log transformation for statistical analysis purposes.
MRI Data Acquisition
Brain MRI data were collected using a 1.5 T scanner (Siemens Magnetom, Erlangen, Germany) ~1–2 weeks before DBS surgery. In addition to MRI sequences necessary for neuronavigation in DBS surgery, 3D T1-weighted MRIs were also acquired at the same time for all participants. This additional structural MRI included (1) a sagittal T1-weighted 3D MPRAGE sequence [repetition time (TR) = 2.200 ms; echo time (TE) = 3.25 ms; flip angle = 8°, matrix = 384 × 512 × 176, and voxel size = 0.5 × 0.5 × 1 mm] and (2) a sagittal FLAIR 3D sequence (TR = 6,000 ms; TE = 358 ms; flip angle = 120°, matrix = 224 × 256 × 160, and voxel size = 1.02 × 1.02 × 1 mm).
MRI Data Processing to Obtain GM Volume and CT Values
GM volumes were obtained following a voxel-based morphometry (VBM) methodology using the Computation Anatomy Toolbox (CAT-12, version 12.7) via the current version of Statistical Parametric Mapping (SPM12; fil.ion.ucl.ac.uk/spm/). For this purpose, a visual inspection from all MRI images was performed initially to ensure that artifacts were absent. Subsequently, images were preprocessed following the standard pipeline recommended in the CAT-12 manual, which includes image bias-field correction, segmentation into GM, white matter (WM) and cerebrospinal fluid (CSF) maps, spatial normalization and modulation of GM maps to the Montreal Neurological Institute (MNI) template.
The obtained tissue compartment volumes were used to calculate total intracranial volume (TIV) as the sum of the GM, WM and CSF volumes. Brain parenchymal fraction (BPF) was calculated as an index of global brain atrophy using the following formula: BPF = GM+WM/TIV (39). GM fraction (GMF) was also calculated as an index of specific global GM atrophy as GMF = GM/TIV (39). Finally, GM regional volumes were extracted using the neuromorphometrics atlas (neuromorphometrics.com/) and were normalized for head size using TIV as a covariate in all subsequent statistical analyses.
CT global and regional values were also obtained with the CAT-12 toolbox following an automated method that relies on a tissue segmentation step to estimate distances between WM and GM voxels using projection-based thickness (40). Regional CT values were obtained using the Desikan-Kiliany atlas (41).
Our study only targeted regions of interest (ROIs) of those cortical-subcortical regions described to be part of the basal ganglia-thalamo-cortical network (42–45), which included ROIs located in the thalamus, basal ganglia, amygdala, hippocampus, cerebellum, cingulate, motor, and prefrontal cortices for analysis of gray matter volumes, and only cingulate, motor, and prefrontal cortices for CT values.
Statistical Analysis
Statistical analyses were conducted using SPSS v.24 (IBM, Armonk, NY) and custom SPSS syntax routines. Specifically, the non-parametric Spearman partial correlation coefficient (ρ), adjusted for age, educational level, and disease duration, was calculated to separately screen the regional GM volume- and surface-based thickness variables for their relationship with STN LFP beta power. Only those MRI variables (cortical-subcortical atrophy and cortical thickness) that showed a significant correlation after FDR-adjustment (p < 0.05) for multiple testing were then entered into two forward linear regression models to determine the strongest MRI predictors of STN LFP beta activity. The residuals obtained from partial correlation, after adjusting for age, educational level, and disease duration, for each significant variable were first saved and then entered as new MRI variables into the regression model as predictors of STN LFP beta (log PSD) power.
Results
Table 1 summarizes the main clinical characteristics of the PD patient sample. Briefly, PD patients exhibited a mean preoperative UPDRS-III off medication score of 60.1 ± 12.7 and an on medication score of 22.3 ± 10.3. The mean post-operative UPDRS-III off medication score, i.e., immediately prior to the LFP study, was 38.4 ± 13.2. Importantly, our PD sample exhibited preserved cognitive functioning, as revealed by MNSE scores. Additionally, patients showed minimal and mild ranges of depression symptoms based on BDI scores.
Relationship Between STN LFP Beta Activity and GM Volume and CT
Regarding PSD, the mean STN LFP amplitude spectral density across all subjects showed a single-peaked beta activity of 2.6 μV2/Hz in amplitude at 19.53 Hz (see Figure 1B). Specifically, patients presented maximum peaks of beta PSD in the frequency ranges of 15 Hz to 25 Hz with amplitudes between 0.9 and 6.4 μV2/Hz. Importantly, 35.7% of the bipolar channels were excluded from the LFP analysis because they were located outside the STN or did not have artifact-free segments.
Spearman partial correlations (adjusted for age and disease duration) revealed that elevated post-operative, but not preoperative, UPDRS-III scores were significantly and positively associated with increases in STN LFP beta power (partial, ρ = 0.831, p = 0.041).
To further describe the relationship between regional MRI measures (anatomical regional parcellations for GM atrophy and cortical thickness) and STN LFP beta power, individual tests were assessed using partial correlations adjusted for age, educational level, and disease duration. Exploratory partial correlations results showed that increased LFP beta power in the STN was significantly and negatively correlated to, first, bilateral smaller volume in the putamen, left caudate nucleus, and left external cerebellum, as well as right portions of anterior insula and anterior cingulated gyrus; and second, smaller cortical thickness involving different parcelations of the orbitofrontal gyrus (OFG), left middle frontal gyrus (MFG), and right inferior frontal gyrus (pars triangularis) (see Table 2).
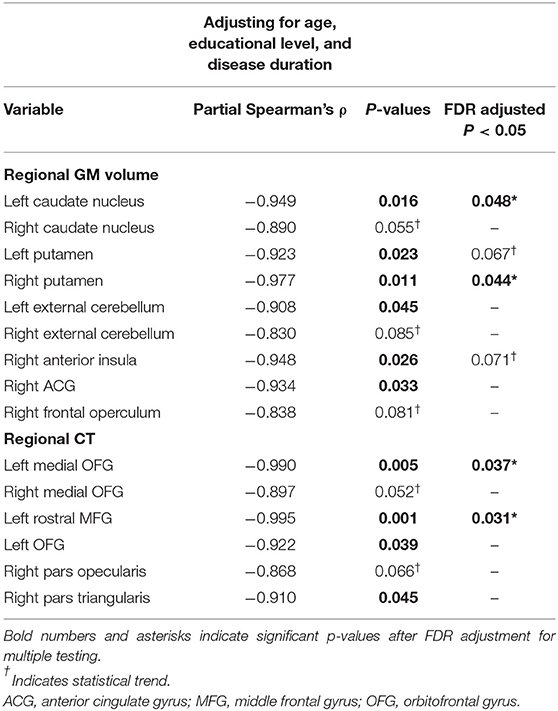
Table 2. Spearman partial correlations analysis controlling for age, educational level, and disease duration between log beta power in the STN and both regional gray matter (GM) volume and cortical thickness (CT).
Nevertheless, regarding GM atrophy, and after multiple testing adjustment, increased LFP beta power in the STN was only significantly and negatively linked to smaller volume in the right putamen (partial ρ = −0.977; p = 0.044) and in the left caudate nucleus (partial ρ = −0.949, p = 0.048) (see Table 2; Figure 1C). Only atrophy of the right putamen remained significant in the regression model after adjusting for the effects of age, educational level, and disease duration, and explaining the enhanced LFP beta activity in the STN (R2 = 0.954, p < 0.05) (see Figure 1D).
With respect to cortical thinning, and after multiple testing adjustment, the left rostral MFG (partial ρ = −0.995, p = 0.031) and in the left medial OFG (partial ρ = −0.990, p = 0.037) were significantly and negatively associated with beta power during resting STN LFP (see Table 2; Figure 1E). Regression analysis, controlling for the effects of age, educational level, and disease duration, confirmed that the cortical thinning of the left rostral MFG accounted for the greatest variance in explaining the STN LFP beta power increase (R2 = 0.990, p < 0.01) (see Figure 1F).
Discussion
After controlling for age, educational level, and disease duration, the main finding of our study was the association between increases in STN LFP beta oscillatory activity and both reduced GM volumes in dorsal striatum (putamen and caudate nucleus) and reduced CT over the middle prefrontal and orbitofrontal cortices. These results suggest that an ongoing neurodegenerative process would be present at the cortical and subcortical levels that could be linked to a dysfunctional pattern of basal ganglia activity in the beta band in PD patient candidates for STN DBS.
Previous research has broadly demonstrated that the STN LFP beta band may represent a sensitive electrophysiological marker of a patient's clinical symptoms in PD (3, 7, 46), which is correlated with motor symptomatology, such as bradykinesia and rigidity (8, 47, 48), and responds to dopamine replacement therapy and DBS (4, 9, 49–51). Our data showed that STN beta band activity was linked to PD symptom severity as measured by post-operative, but not preoperative, UPDRS-III in the off medication state. This emphasizes that the post-operative UPDRS-III scores, controlled by age and disease duration of the patients and evaluated at the time point of the LFP recordings, could be the most precise way to relate both measurements, given that both are collected under the same experimental conditions and could represent a more precise state of parkinsonian symptomatology linked to the impact of the stun effect, which may influence oscillatory activity patterns in the STN (52). Nevertheless, despite this insertional effect, the patient clinical improvement commonly observed and induced by the electrode insertion differs substantially from that obtained with dopaminergic treatment (6) and ON DBS (7).
The current study also demonstrated that volume reduction in the dorsal striatum accounted for somewhat more variance than cortical volume in explaining beta band STN LFP activity. Regarding GM volume, consistent findings have pointed to progressive atrophy accumulation in subcortical areas, such as the putamen and caudate, and in both the early and middle stages of PD (53, 54). Importantly, the putamen, which is a central projection site of the cortical inputs into the basal ganglia, and its activity is primarily movement-related, has been frequently considered one of the first structure that shows both volume and shape variations in PD (44, 45, 55–57), so that putaminal alterations can decidedly contribute to the pathophysiology of cortico-basal ganglia motor loops. Moreover, caudate volume loss has aroused great interest as an MRI biomarker of disease progression from early PD stages (24, 28, 58) and is also linked to conversion to mild cognitive impairment or dementia (27, 28, 59). Therefore, the putamen and caudate (and cerebellum) are considered primarily related to motor function, such as coordination, planning, execution, and movement regulation, and are also increasingly recognized as relevant hubs related to inhibitory control of action, learning, and cognition (60). Our results are consistent with this evidence and underscore that decreased dopaminergic inputs to the basal ganglia, particularly to the dorsal striatum, and likely due to progressive accumulation of atrophy as a consequence of the evolution of the disease, promote synchronized beta LFP activity in the STN and abnormal pallido-striatal feedback (16–18, 61, 62) and could lead to characteristic parkinsonism symptoms (7, 63).
Despite its relevance as a potential neurodegenerative biomarker of disease progression, little emphasis has been previously given to CT and its likely relationship with beta oscillatory activity in the STN. After controlling for the age, educational level, and disease duration, the current study revealed that CT reductions may be associated with enhanced STN beta activity, mainly involving regions in the middle prefrontal and orbitofrontal cortices. In fact, cortical thinning involving prefrontal regions has been previously reported in PD patients. Furthermore, there is converging evidence stressing the so-called “limbic hyperdirect pathway” between the ventral and medial OFG and the STN (64). Hence, enhanced STN beta rhythm may also be linked to a pattern of regional cortical thinning that would correspond to specific nodes of large-scale cortical networks structurally connected to basal ganglia and functionally specialized in limbic processing (e.g., medial PFC/OFC), including language-related regions (pars triangularis and pars opecularis).
It is worth mentioning some limitations to this observational pilot study. First, despite the robustness of our results, the main limitation was the small patient sample size. Increasing the sample size in future studies would allow us to better address the current findings, enabling us to assess different clinical subgroups according to PD symptoms, which would enhance the significance of the present results. Second, our findings are correlational, so we cannot establish causation. Therefore, it is recommended to focus on establishing causal connections to related STN beta activity to neurodegenerative states of the specific brain areas. Third, we did not investigate the lower and upper ranges of the STN beta frequency band or from different territories of the STN, which may have somewhat different functional significance. For example, it has been frequently demonstrated that low beta activity is suppressed by current conventional dopaminergic or DBS therapies, allowing alleviation of PD symptoms, which would mostly reflect a pathological STN-striatal feedback mechanism, while high beta activity is relatively less modulated after dopaminergic medication withdrawal and seems to be more strongly coupled with cortical activity (8, 47, 65–67). Further studies should better address the association between regional cortical-subcortical volume-surface-based MRI measures and the subranges of the STN beta band from three functional territories of the human STN (sensorimotor, associative, limbic). This would provide more precise insight into the functional mapping of STN activity and its relationship with neurodegenerative processes of cortical-subcortical large-scale networks in PD.
Conclusions
The results of this pilot study support the investigation of how exaggerated synchrony at beta frequencies within the STN might be accompanied by both GM volume reductions in dorsal striatal motor circuits and more widespread thinning of prefrontal associative territories, and suggest that this association remains to be elucidated in detail. Taken together, these findings support the hypothesis that spreading neurodegeneration of nigrostriato regions may also functionally and structurally impair distinct striato-cortical connections, likely contributing to the malfunctioning of oscillatory activity of the STN observed in PD. The use of multiple brain markers resulting from multimodal imaging techniques may provide new insights into the neuroanatomical and pathophysiological mechanisms associated with the underlying disease.
Data Availability Statement
The original contributions presented in the study are included in the article/supplementary material, further inquiries can be directed to the corresponding author.
Ethics Statement
All the participants provided written informed consent for the STN DBS and LFP study before participation in accordance with the Declaration of Helsinki. The study was approved by the Andalusian Biomedical Research Ethics Committee (Ref.: PI-0025-2017/Acta03/2018).
Author Contributions
JJG-R conceived and designed the study and drafted the manuscript. FS, ÁJC-G, and JJG-R wrote the manuscript, performed statistical analysis, and interpreted results of study. ÁJC-G and AZ collected MRI data. RR-L and RE-R recruited and performed clinical evaluations of patients, conducted patient testing during and after the surgery, and contributed to interpretation of the results. JR-D performed the DBS surgeries and contributed to data collection. EL-S and ÁJC-G provide clinical and neuropsychological information. FS and FL-S prepared the recording setting and collected the LFP data. FS performed the LFP analysis and electrode localization. ÁJC-G performed MRI analysis. FS, ÁJC-G, RR-L, EL-S, FL-S, and JJG-R edited and revised the manuscript. All authors approved the final version of the manuscript.
Funding
This work has been supported by the Spanish Ministry of Science, Innovation and Universities (MICINN) under Grants (RYC-2015-18467; PSI2017-85951-R) and by the European Regional Development Fund through the Andalusian Ministry of Health and Families under Grants (PI-0025-2017; PI-0034-2019).
Conflict of Interest
RR-L and RE-R received speaker fees and travel support from Teva, AbbVie, Zambon, BIAL, Italfarmaco, Biogen, Merck Serono, Novartis, Sanofi, and Roche. JR-D received travel support and training from Medtronic, but not related to this study.
The remaining authors declare that the research was conducted in the absence of any commercial or financial relationships that could be construed as a potential conflict of interest.
Publisher's Note
All claims expressed in this article are solely those of the authors and do not necessarily represent those of their affiliated organizations, or those of the publisher, the editors and the reviewers. Any product that may be evaluated in this article, or claim that may be made by its manufacturer, is not guaranteed or endorsed by the publisher.
Acknowledgments
We acknowledge funding supported by University of Cádiz through predoctoral scholarships to FS and EL-S and clinical support from Puerta del Mar University Hospital. The authors especially want to thank patients and their families for their collaboration.
References
1. Galvan A, Devergnas A, Wichmann T. Alterations in neuronal activity in basal ganglia-thalamocortical circuits in the parkinsonian state. Front Neuroanat. (2015) 9:5. doi: 10.3389/fnana.2015.00005
2. Hammond C, Bergman H, Brown P. Pathological synchronization in Parkinson's disease: networks, models and treatments. Trends Neurosci. (2007) 30:357–64. doi: 10.1016/j.tins.2007.05.004
3. McGregor MM, Nelson AB. Circuit mechanisms of Parkinson's disease. Neuron. (2019) 101:1042–56. doi: 10.1016/j.neuron.2019.03.004
4. Brown P, Oliviero A, Mazzone P, Insola A, Tonali P, Di Lazzaro V. Dopamine dependency of oscillations between subthalamic nucleus and pallidum in Parkinson's disease. J Neurosci. (2001) 21:1033–8. doi: 10.1523/JNEUROSCI.21-03-01033.2001
5. Kühn AA, Kupsch A, Schneider G-H, Brown P. Reduction in subthalamic 8-35 Hz oscillatory activity correlates with clinical improvement in Parkinson's disease. Eur J Neurosci. (2006) 23:1956–60. doi: 10.1111/j.1460-9568.2006.04717.x
6. Giannicola G, Marceglia S, Rossi L, Mrakic-Sposta S, Rampini P, Tamma F, et al. The effects of levodopa and ongoing deep brain stimulation on subthalamic beta oscillations in Parkinson's disease. Exp Neurol. (2010) 226:120–7. doi: 10.1016/j.expneurol.2010.08.011
7. Bronte-Stewart H, Barberini C, Koop MM, Hill BC, Henderson JM, Wingeier B. The STN beta-band profile in Parkinson's disease is stationary and shows prolonged attenuation after deep brain stimulation. Exp Neurol. (2009) 215:20–8. doi: 10.1016/j.expneurol.2008.09.008
8. Kühn AA, Tsui A, Aziz T, Ray N, Brücke C, Kupsch A, et al. Pathological synchronisation in the subthalamic nucleus of patients with Parkinson's disease relates to both bradykinesia and rigidity. Exp Neurol. (2009) 215:380–7. doi: 10.1016/j.expneurol.2008.11.008
9. Brittain J-S, Brown P. Oscillations and the basal ganglia: motor control and beyond. Neuroimage. (2014) 85:637–47. doi: 10.1016/j.neuroimage.2013.05.084
10. Kish SJ, Shannak K, Hornykiewicz O. Uneven pattern of dopamine loss in the striatum of patients with idiopathic Parkinson's disease. N Engl J Med. (1988) 318:876–80. doi: 10.1056/NEJM198804073181402
11. Wichmann T, Smith Y VJ. Basal ganglia anatomy and physiology. In: Factor S, Weiner W, editors. Parkinson's Disease: Diagnosis and Clinical Management. New York, NY: Demos Medical Publishing. p. 245–65.
12. McCarthy MM, Moore-Kochlacs C, Gu X, Boyden ES, Han X, Kopell N. Striatal origin of the pathologic beta oscillations in Parkinson's disease. Proc Natl Acad Sci. (2011) 108:11620–5. doi: 10.1073/pnas.1107748108
13. Alavi M, Dostrovsky JO, Hodaie M, Lozano AM, Hutchison WD. Spatial extent of beta oscillatory activity in and between the subthalamic nucleus and substantia nigra pars reticulata of Parkinson's disease patients. Exp Neurol. (2013) 245:60–71. doi: 10.1016/j.expneurol.2012.09.021
14. Tamir I, Wang D, Chen W, Ostrem JL, Starr PA, de Hemptinne C. Eight cylindrical contact lead recordings in the subthalamic region localize beta oscillations source to the dorsal STN. Neurobiol Dis. (2020) 146:105090. doi: 10.1016/j.nbd.2020.105090
15. Lourens MAJ, Meijer HGE, Contarino MF, van den Munckhof P, Schuurman PR, van Gils SA, et al. Functional neuronal activity and connectivity within the subthalamic nucleus in Parkinson's disease. Clin Neurophysiol. (2013) 124:967–81. doi: 10.1016/j.clinph.2012.10.018
16. Plenz D, Kital STA. basal ganglia pacemaker formed by the subthalamic nucleus and external globus pallidus. Nature. (1999) 400:677–82. doi: 10.1038/23281
17. Bevan M. Move to the rhythm: oscillations in the subthalamic nucleus–external globus pallidus network. Trends Neurosci. (2002) 25:525–31. doi: 10.1016/S0166-2236(02)02235-X
18. Holgado AJN, Terry JR, Bogacz R. Conditions for the generation of beta oscillations in the subthalamic nucleus-globus pallidus network. J Neurosci. (2010) 30:12340–52. doi: 10.1523/JNEUROSCI.0817-10.2010
19. Magill P, Bolam J, Bevan M. Dopamine regulates the impact of the cerebral cortex on the subthalamic nucleus–globus pallidus network. Neuroscience. (2001) 106:313–30. doi: 10.1016/S0306-4522(01)00281-0
20. Koelman LA, Lowery MM. Beta-band resonance and intrinsic oscillations in a biophysically detailed model of the subthalamic nucleus-globus pallidus network. Front Comput Neurosci. (2019) 13:77. doi: 10.3389/fncom.2019.00077
21. Brunenberg EJL, Moeskops P, Backes WH, Pollo C, Cammoun L, Vilanova A, et al. Structural and resting state functional connectivity of the subthalamic nucleus: identification of motor STN parts and the hyperdirect pathway. PLoS ONE. (2012) 7:e39061. doi: 10.1371/journal.pone.0039061
22. Patriat R, Niederer J, Kaplan J, Amundsen Huffmaster S, Petrucci M, Eberly L, et al. Morphological changes in the subthalamic nucleus of people with mild-to-moderate Parkinson's disease: a 7T MRI study. Sci Rep. (2020) 10:8785. doi: 10.1038/s41598-020-65752-0
23. Ibarretxe-Bilbao N, Junque C, Segura B, Baggio HC, Marti MJ, Valldeoriola F, et al. Progression of cortical thinning in early Parkinson's disease. Mov Disord. (2012) 27:1746–53. doi: 10.1002/mds.25240
24. Jia X, Liang P, Li Y, Shi L, Wang D, Li K. Longitudinal study of gray matter changes in Parkinson disease. Am J Neuroradiol. (2015) 36:2219–26. doi: 10.3174/ajnr.A4447
25. Yau Y, Zeighami Y, Baker TE, Larcher K, Vainik U, Dadar M, et al. Network connectivity determines cortical thinning in early Parkinson's disease progression. Nat Commun. (2018) 9:12. doi: 10.1038/s41467-017-02416-0
26. Tinaz S, Courtney MG, Stern CE. Focal cortical and subcortical atrophy in early Parkinson's disease. Mov Disord. (2011) 26:436–41. doi: 10.1002/mds.23453
27. Foo H, Mak E, Yong TT, Wen MC, Chander RJ, Au WL, et al. Progression of subcortical atrophy in mild Parkinson's disease and its impact on cognition. Eur J Neurol. (2017) 24:341–8. doi: 10.1111/ene.13205
28. Sarasso E, Agosta F, Piramide N, Filippi M. Progression of grey and white matter brain damage in Parkinson's disease: a critical review of structural MRI literature. J Neurol. (2021) 268:3144–79. doi: 10.1007/s00415-020-09863-8
29. Hughes AJ, Daniel SE, Kilford L, Lees AJ. Accuracy of clinical diagnosis of idiopathic Parkinson's disease: a clinico-pathological study of 100 cases. J Neurol Neurosurg Psychiatry. (1992) 55:181–4. doi: 10.1136/jnnp.55.3.181
30. Stebbins GT, Goetz CG, Burn DJ, Jankovic J, Khoo TK, Tilley BC. How to identify tremor dominant and postural instability/gait difficulty groups with the movement disorder society unified Parkinson's disease rating scale: comparison with the unified Parkinson's disease rating scale. Mov Disord. (2013) 28:668–70. doi: 10.1002/mds.25383
31. Folstein MF, Folstein SE, McHugh PR. Mini-mental state. J Psychiatr Res. (1975) 12:189–98. doi: 10.1016/0022-3956(75)90026-6
32. Beck AT, Steer RA, Brown GK. Manual for the Beck Depression Inventory-II. San Antonio, TX: Psychological Corporation (1996).
33. Tomlinson CL, Stowe R, Patel S, Rick C, Gray R, Clarke CE. Systematic review of levodopa dose equivalency reporting in Parkinson's disease. Mov Disord. (2010) 25:2649–53. doi: 10.1002/mds.23429
34. Oldfield RC. The assessment and analysis of handedness: the Edinburgh inventory. Neuropsychologia. (1971) 9:97–113. doi: 10.1016/0028-3932(71)90067-4
35. Starr PA. Placement of deep brain stimulators into the subthalamic nucleus or globus pallidus internus: technical approach. Stereotact Funct Neurosurg. (2002) 79:118–45. doi: 10.1159/000070828
36. Horn A, Kühn AA. Lead-DBS: a toolbox for deep brain stimulation electrode localizations and visualizations. Neuroimage. (2015) 107:127–35. doi: 10.1016/j.neuroimage.2014.12.002
37. Horn A, Li N, Dembek TA, Kappel A, Boulay C, Ewert S, et al. Lead-DBS v2: Towards a comprehensive pipeline for deep brain stimulation imaging. Neuroimage. (2019) 184:293–316. doi: 10.1016/j.neuroimage.2018.08.068
38. Oostenveld R, Fries P, Maris E, Schoffelen J-M. FieldTrip: open source software for advanced analysis of MEG, EEG, and invasive electrophysiological data. Comput Intell Neurosci. (2011) 2011:1–9. doi: 10.1155/2011/156869
39. Sanfilipo MP, Benedict RHB, Sharma J, Weinstock-Guttman B, Bakshi R. The relationship between whole brain volume and disability in multiple sclerosis: a comparison of normalized gray vs. white matter with misclassification correction. Neuroimage. (2005) 26:1068–77. doi: 10.1016/j.neuroimage.2005.03.008
40. Dahnke R, Yotter RA, Gaser C. Cortical thickness and central surface estimation. Neuroimage. (2013) 65:336–48. doi: 10.1016/j.neuroimage.2012.09.050
41. Desikan RS, Ségonne F, Fischl B, Quinn BT, Dickerson BC, Blacker D, et al. An automated labeling system for subdividing the human cerebral cortex on MRI scans into gyral based regions of interest. Neuroimage. (2006) 31:968–80. doi: 10.1016/j.neuroimage.2006.01.021
42. Alexander GE, DeLong MR, Strick PL. Parallel organization of functionally segregated circuits linking basal ganglia and cortex. Annu Rev Neurosci. (1986) 9:357–81. doi: 10.1146/annurev.ne.09.030186.002041
43. Alexander GE, Crutcher MD, DeLong MR. Basal ganglia-thalamocortical circuits: parallel substrates for motor, oculomotor, “prefrontal” and “limbic” functions. Prog Brain Res. (1990) 85:119–46. doi: 10.1016/S0079-6123(08)62678-3
44. DeLong MR, Wichmann T. Circuits and circuit disorders of the basal ganglia. Arch Neurol. (2007) 64:20–4. doi: 10.1001/archneur.64.1.20
45. DeLong M, Wichmann T. Changing views of basal ganglia circuits and circuit disorders. Clin EEG Neurosci. (2010) 41:61–7. doi: 10.1177/155005941004100204
46. Neumann W-J, Staub-Bartelt F, Horn A, Schanda J, Schneider G-H, Brown P, et al. Long term correlation of subthalamic beta band activity with motor impairment in patients with Parkinson's disease. Clin Neurophysiol. (2017) 128:2286–91. doi: 10.1016/j.clinph.2017.08.028
47. Ray NJ, Jenkinson N, Wang S, Holland P, Brittain JS, Joint C, et al. Local field potential beta activity in the subthalamic nucleus of patients with Parkinson's disease is associated with improvements in bradykinesia after dopamine and deep brain stimulation. Exp Neurol. (2008) 213:108–13. doi: 10.1016/j.expneurol.2008.05.008
48. Chen CC, Hsu YT, Chan HL, Chiou SM, Tu PH, Lee ST, et al. Complexity of subthalamic 13–35Hz oscillatory activity directly correlates with clinical impairment in patients with Parkinson's disease. Exp Neurol. (2010) 224:234–40. doi: 10.1016/j.expneurol.2010.03.015
49. Kuhn AA, Kempf F, Brucke C, Gaynor Doyle L, Martinez-Torres I, Pogosyan A, et al. High-frequency stimulation of the subthalamic nucleus suppresses oscillatory activity in patients with Parkinson's disease in parallel with improvement in motor performance. J Neurosci. (2008) 28:6165–73. doi: 10.1523/JNEUROSCI.0282-08.2008
50. Eusebio A, Thevathasan W, Doyle Gaynor L, Pogosyan A, Bye E, Foltynie T, et al. Deep brain stimulation can suppress pathological synchronisation in parkinsonian patients. J Neurol Neurosurg Psychiatry. (2011) 82:569–73. doi: 10.1136/jnnp.2010.217489
51. Johnson LA, Nebeck SD, Muralidharan A, Johnson MD, Baker KB, Vitek JL. Closed-loop deep brain stimulation effects on parkinsonian motor symptoms in a non-human primate – is beta enough? Brain Stimul. (2016) 9:892–6. doi: 10.1016/j.brs.2016.06.051
52. Neumann W-J, Degen K, Schneider G-H, Brücke C, Huebl J, Brown P, et al. Subthalamic synchronized oscillatory activity correlates with motor impairment in patients with Parkinson's disease. Mov Disord. (2016) 31:1748–51. doi: 10.1002/mds.26759
53. Tessa C, Lucetti C, Giannelli M, Diciotti S, Poletti M, Danti S, et al. Progression of brain atrophy in the early stages of Parkinson's disease: a longitudinal tensor-based morphometry study in de novo patients without cognitive impairment. Hum Brain Mapp. (2014) 35:3932–44. doi: 10.1002/hbm.22449
54. Lewis MM, Du G, Lee E-Y, Nasralah Z, Sterling NW, Zhang L, et al. The pattern of gray matter atrophy in Parkinson's disease differs in cortical and subcortical regions. J Neurol. (2016) 263:68–75. doi: 10.1007/s00415-015-7929-7
55. Tanner JJ, McFarland NR, Price CC. Striatal and hippocampal atrophy in idiopathic Parkinson's disease patients without dementia: a morphometric analysis. Front Neurol. (2017) 8:139. doi: 10.3389/fneur.2017.00139
56. Nemmi F, Sabatini U, Rascol O, Péran P. Parkinson's disease and local atrophy in subcortical nuclei: insight from shape analysis. Neurobiol Aging. (2015) 36:424–33. doi: 10.1016/j.neurobiolaging.2014.07.010
57. Geng D, Li Y-X, Zee C-S. Magnetic resonance imaging-based volumetric analysis of basal ganglia nuclei and substantia nigra in patients with Parkinson's disease. Neurosurgery. (2006) 58:256–62. doi: 10.1227/01.NEU.0000194845.19462.7B
58. Sampedro F, Martínez-Horta S, Marín-Lahoz J, Pagonabarraga J, Kulisevsky J. Longitudinal intracortical diffusivity changes in de-novo Parkinson's disease: a promising imaging biomarker. Parkinsonism Relat Disord. (2019) 68:22–5. doi: 10.1016/j.parkreldis.2019.09.031
59. Zhou C, Guan X, Guo T, Zeng Q, Gao T, Huang P, et al. Progressive brain atrophy in Parkinson's disease patients who convert to mild cognitive impairment. CNS Neurosci Ther. (2020) 26:117–25. doi: 10.1111/cns.13188
60. Koziol LF, Budding D, Andreasen N, D'Arrigo S, Bulgheroni S, Imamizu H, et al. Consensus paper: the cerebellum's role in movement and cognition. Cerebellum. (2014) 13:151–77. doi: 10.1007/s12311-013-0511-x
61. Ribeiro M-J, Vidailhet M. Loc'h C, Dupel C, Nguyen JP, Ponchant M, et al. Dopaminergic function and dopamine transporter binding assessed with positron emission tomography in Parkinson disease. Arch Neurol. (2002) 59:580–6. doi: 10.1001/archneur.59.4.580
62. Blenkinsop A, Anderson S, Gurney K. Frequency and function in the basal ganglia: the origins of beta and gamma band activity. J Physiol. (2017) 595:4525–48. doi: 10.1113/JP273760
63. Levy R, Ashby P, Hutchison WD, Lang AE, Lozano AM, Dostrovsky JO. Dependence of subthalamic nucleus oscillations on movement and dopamine in Parkinson's disease. Brain. (2002) 125:1196–209. doi: 10.1093/brain/awf128
64. Haynes WIA, Haber SN. The organization of prefrontal-subthalamic inputs in primates provides an anatomical substrate for both functional specificity and integration: implications for basal ganglia models and deep brain stimulation. J Neurosci. (2013) 33:4804–14. doi: 10.1523/JNEUROSCI.4674-12.2013
65. Whitmer D, de Solages C, Hill B, Yu H, Henderson JM, Bronte-Stewart H. High frequency deep brain stimulation attenuates subthalamic and cortical rhythms in Parkinson's disease. Front Hum Neurosci. (2012) 6:155. doi: 10.3389/fnhum.2012.00155
66. Oswal A, Beudel M, Zrinzo L, Limousin P, Hariz M, Foltynie T, et al. Deep brain stimulation modulates synchrony within spatially and spectrally distinct resting state networks in Parkinson's disease. Brain. (2016) 139:1482–96. doi: 10.1093/brain/aww048
Keywords: Parkinson's disease, subthalamic nucleus, beta oscillations, local field potentials, cortical thickness, gray matter volume
Citation: Sanmartino F, Cruz-Gómez ÁJ, Rashid-López R, Lozano-Soto E, López-Sosa F, Zuazo A, Riqué-Dormido J, Espinosa-Rosso R and González-Rosa JJ (2022) Subthalamic Beta Activity in Parkinson's Disease May Be Linked to Dorsal Striatum Gray Matter Volume and Prefrontal Cortical Thickness: A Pilot Study. Front. Neurol. 13:799696. doi: 10.3389/fneur.2022.799696
Received: 21 October 2021; Accepted: 24 February 2022;
Published: 23 March 2022.
Edited by:
Aristide Merola, The Ohio State University, United StatesReviewed by:
Carlo Alberto Artusi, University of Turin, ItalyAlan Bush, Massachusetts General Hospital and Harvard Medical School, United States
Copyright © 2022 Sanmartino, Cruz-Gómez, Rashid-López, Lozano-Soto, López-Sosa, Zuazo, Riqué-Dormido, Espinosa-Rosso and González-Rosa. This is an open-access article distributed under the terms of the Creative Commons Attribution License (CC BY). The use, distribution or reproduction in other forums is permitted, provided the original author(s) and the copyright owner(s) are credited and that the original publication in this journal is cited, in accordance with accepted academic practice. No use, distribution or reproduction is permitted which does not comply with these terms.
*Correspondence: Javier J. González-Rosa, amF2aWVyLnJvc2FAdWNhLmVz