
94% of researchers rate our articles as excellent or good
Learn more about the work of our research integrity team to safeguard the quality of each article we publish.
Find out more
ORIGINAL RESEARCH article
Front. Neurol., 28 February 2022
Sec. Applied Neuroimaging
Volume 13 - 2022 | https://doi.org/10.3389/fneur.2022.594711
This article is part of the Research TopicNeuroimaging in Parkinson’s Disease and ParkinsonismView all 27 articles
 Ji-tian Guan1†
 Xin Zheng2†
 Lingfeng Lai1†Shuyi Sun1†Yiqun Geng3
 Xiaolei Zhang1Teng Zhou4Huan-ze Wu5
 Jia-qing Chen5Zhong-xian Yang1Xiao-hong zheng5
 Jia-xu Wang5
 Wei Chen5*You-qiao Zhang5*
Background: The current diagnosis of Parkinson's disease (PD) is mainly based on the typical clinical manifestations. However, 60% dopaminergic neurons have died when the typical clinical manifestations occur. Predictive neurobiomarkers may help identify those PD patients having non-motor disorders or in different stage and achieving the aim of early diagnosis. Up to date, few if any neuroimaging techniques have been described useful for non-movement disorders diagnosis in PD patients. Here, we investigated the alteration of metabolites in PD patients in different stage of PD and non-motor symptoms including sleep, gastrointestinal and cognitive dysfunction, by using the 1H-MRS.
Methods: A total of 48 subjects were included between 2017 and 2019: 37 PD (15 men, age 47–82 years) and 11 healthy people (8 men, age 49–74 years). All participants underwent MRI and multi-voxel 1H-MRS examination within 3 days in admission. Six kinds of metabolites, such as creatine (Cr), N-acetyl aspartate/creatine (NAA/Cr), N-acetyl aspartate/choline (NAA/Cho), choline/creatine (Cho/Cr), lipid/creatine (LL/Cr), and myo-Inositol/creatine ratio (mI/Cr) were tested among the PD group and the control groups. Statistical analyses and correlation analyses were performed by using SPSS. The p < 0.05 was considered statistically significant.
Results: Compared late PD group with a control group or early group, higher Cr ratio and lower NAA/Cr ratio were observed in the late PD group (p < 0.05). The mI/Cr in the late PD group was also lower than that in the early PD group (p < 0.05). Regarding the relationship between metabolites and NMS, Cho/Cr was higher in the sleep disorder group, whereas mI/Cr was lower in the gastrointestinal dysfunction group in comparison with the non-symptom groups. Moreover, Cr, Cho/Cr, mI/Cr, and LL/Cr were identified to have higher concentrations in the cognitive group in thalamus.
Conclusions: Proton magnetic resonance spectroscopy is an advanced tool to quantify the metabolic changes in PD. Three biomarkers (Cr, NAA/Cr, and mI/Cr) were detected in the late stage of PD, suggesting that these markers might be potential to imply the progression of PD. In addition, subgroups analysis showed that MRS of thalamus is a sensitive region for the detection of cognitive decline in PD, and the alteration of neurochemicals (involving Cr, Cho, mI, and LL) may be promising biomarkers to predict cognitive decline in PD.
With an estimated prevalence of 1–2 case per 1,000 persons above 60 years, Parkinson's disease (PD) is the second common neurodegenerative disease after Alzheimer's disease (AD) (1). Clinical symptoms of PD include motor disorders (such as, quiescent tremor, motor retardation, muscular rigidity, and postural gait abnormalities) (2) and non-motor disorders (sleep disturbances, cognitive disorders, emotional disorders, olfactory impairment, gastrointestinal dysfunction, bladder dysfunction, etc.) (3). The most important pathological change is the degeneration of dopamine (DA) neurons in the substantia nigra where it has been identified to have an accumulation of intracytoplasmic inclusions called Lewy bodies containing α-synuclein (4). Aggregates of α-synuclein have been found to spread from peripheral regions (olfactory bulb and gastrointestinal tract) to the lower brainstem, resulting in early emergence of premotor and non-motor symptoms (NMS) (5). A total of 60% dopaminergic neurons have died when the typical clinical manifestations occur (6). The Hoehn and Yahr scale (H&Y) is commonly used to assess the disease progression (Stage I–II for the early stage of PD, and Stage III–IV for the progressive PD) (7). The Movement Disorder Society–Unified Parkinson's Disease Rating Scale (MDS–UPDRS) and the NMS Scale (NMSS) are, respectively, used to evaluate the clinical severity of motor symptoms (8) and NMS for PD (9). The score of “Recall/Memory” in Mini-Mental State Examination (MMSE) is used to identify the cognitive state in patients with PD (10). However, a lack of objective data may result in decreased diagnostic accuracy of clinical NMS. In addition, early diagnosis before the onset of motor symptoms remains challenging since lack of distinguishable clinical and laboratory markers in premotor PD. Given the background, finding sensitive biomarkers in NMS and early stage PD via neuroimaging may not only help understand PD pathogenesis and progression, but also provide better early diagnosis and therapies for patients with PD (11).
Magnetic resonance spectroscopy (MRS) is a MRI technique that allows for direct quantifying microstructural, biochemical, and functional changes in human brain (12). Proton MRS (1H-MRS) has been utilized to detect a wide range of endogenous neurochemicals in PD, such as N-acetylaspartate (NAA) as a marker reflecting the density of healthy neurons and the activity of neuronal function, Creatine (Cr) as a marker of energy metabolism, Choline (Cho) as a marker of both membrane catabolism and anabolism, and myo-Inositol (mI) as a marker of glial reaction. Besides, some magnetic resonance peaks overlap between lipid (Lip) and lactic acid (Lac), so the term “LL” is used in this study to qualify the sum of these two substances and to subsequently indicate the ischemia and the hypoxia in the neurodegenerative regions. Whole-brain MRS imaging was performed and the regions associated with NMS were selected for the spectral analysis, such as substantia nigra, pallidum, thalamus, prefrontal cortex, hippocampus, and parahippocampal gyrus (13).
In the previous study, we demonstrated that 1H-MRS is a sensitive tool that is able to detect the alterations of neural-related metabolites in multiple cerebral regions, such as lower ratios of NAA/Cr and NAA/Cho in substantia nigra, globus pallidus, prefrontal lobe, hippocampus, cuneus gyrus, and dorsal thalamus (14). In addition, the reduced NAA/Cr and NAA/Cho were positively correlated with the unilateral disorder and cognitive impairment, while negatively correlated with UPDRS score. In the present study, we recollected data and mainly focused on assessing the cerebellar biochemical profile in different stages of patients with PD, especially patients with NMS, by using the 1H-MRS. Correlation analysis will subsequently be conducted to investigate the relationship between metabolism levels and the H&Y stage, UPDRS scale, NMSS scale, MMSE score, or clinical factors in patients with PD.
This study was approved by the Ethics Committee of the Second Affiliated Hospital of Shantou University Medical College and was performed according to the Declaration of Helsinki. Written informed consent was obtained from all participants. A total of 48 subjects were included in our hospital between 2017 and 2019: 37 PD (15 mens, age 47–82 years) and 11 health people (8 mens, age 49–74 years). All subjects complied with the diagnostic criteria (2) and diagnosed by a neurologist. Exclusion criteria include (1) history of brain disease (cerebral infarction or cerebral hemorrhage), (2) presence of mental illness or metabolic syndrome, (3) severe heart, lung, liver, kidney, and other organ dysfunction, and (4) inability to provide consent. Patients were evaluated by the modified Hoehn-Yahr stage, UPDRS, NMSS, and MMSE scales. The Hoehn-Yahr stage included stages 1–5, ≤ 1.5 defined as the early stage of PD, while ≥ 1.5 defined as late-stage PD. All participants underwent MRI and multi-voxel 1H-MRS examination within 3 days of admission.
The 3-T MRI system was used for conventional MRI and 1H-MRS (GE signa excite 3T HD Ecospeed) with a standard 8-channel head coil, MR ADW 4.3 workstation Functool software. The axial scanning direction was parallel to the anterior cranial fossa, with a thickness of 5 mm, an interval of 1.5 mm, and a field of vision (FOV) of 24 cm. A total of 20 MRI images were obtained by scanning downward from the cranial top. Scanning parameters of each sequence are as follows: (1) T1WI: Using T1-weighted flux-Attenuated Inversion recovery imaging (T1-FLAIR), repetition time (TR) 2,000 ms, echo time (TE) 24 ms, number of excitations (NEX) = 2, FOV 24 × 18 cm, Matrix 320 × 224, slice thickness 5 mm and interlayer thickness 1.5 mm. (2) T2WI: Using T2-Weighted fast Recovery fast spin-echo imaging (T2-FRfSE), TR 4,600 ms, TE 106 ms, NEX 1.5, FOV 24 × 24 cm, Matrix 384 × 384, slice thickness 5 mm and interlayer thickness 1.5 mm. Multi-voxel 1H-MRS was performed using a 2D point resolved spectroscopy (2D PROBE-CSI PRESS) with the following parameters: TR, 1,500 ms; TE, 35 ms; phase × frequency = 18 × 18, volume of interest, 8 × 10 × 1 cm; FOV, 240 × 240 mm and NEX, 1. Voxel regions of interest (ROI) is located in the substantia nigra, pallidum, thalamus, prefrontal cortex, hippocampus, and parahippocampal gyrus. Typical ROI were chosen from the examined brain regions (Figure 1).
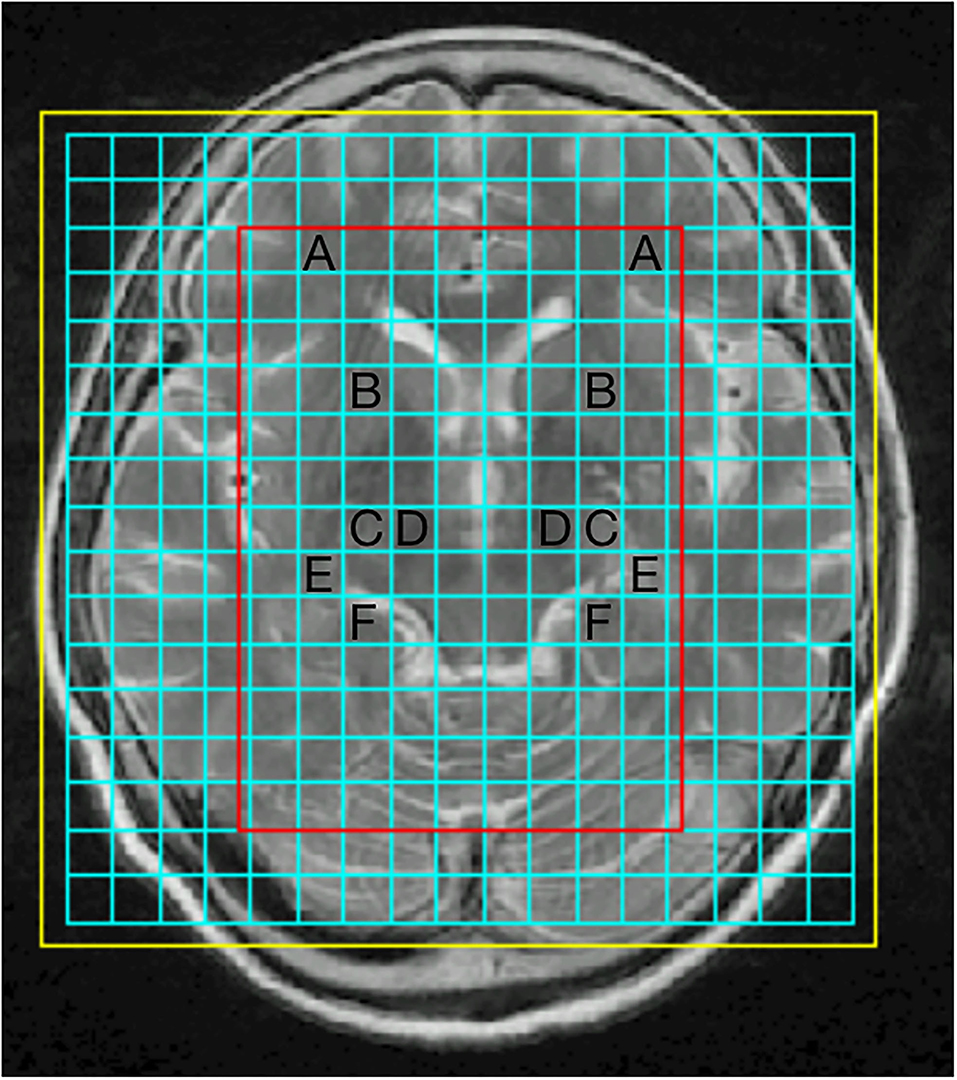
Figure 1. Representative proton magnetic resonance spectroscopy (1H-MRS) spectra for four brain regions: prefrontal cortex (A), pallidum (B), thalamus (C), substantia nigra (D), hippocampus (E), parahippocampal gyrus (F).
The spectral data obtained by GE MR imaging system were analyzed by using Cr as internal reference to calculate the neurometabolites ratio. Original data were sent to ADW4.3 workstation (GE Mediacel System Advantage Window 4.3), and the Functool software was used to process the 1H-MRS image. Six kinds of metabolites, such as creatine (Cr), N-acetyl aspartate-to-creatine (NAA/Cr), N-acetylaspartate-to-choline (NAA/Cho), choline-to-creatine (Cho/Cr), lipid-to-creatine (LL/Cr), and myo-Inositol-to-creatine (mI/Cr) ratios were tested among PD group and the control groups. Examples of spectra are presented in Figure 2.
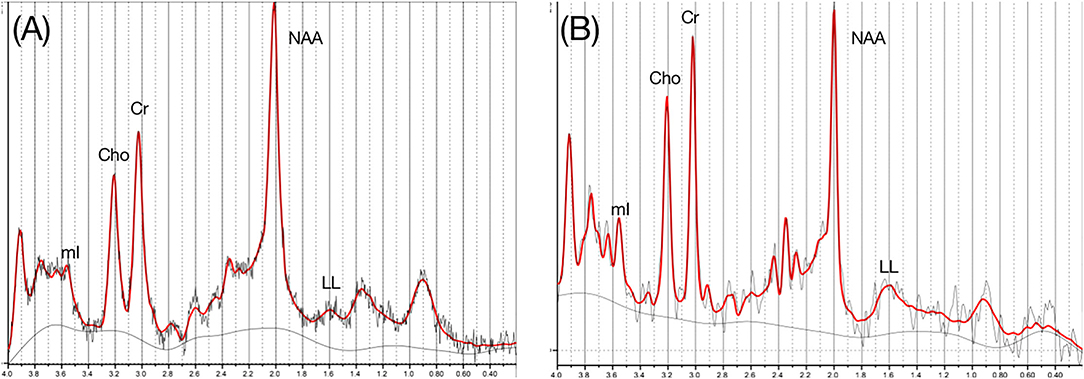
Figure 2. 1H-MRS spectra obtained from a control subject (A) and a patient with PD (B).
The cerebral metabolites (Cr, NAA/Cr, NAA/Cho, Cho/Cr, LL/Cr, and mI/Cr ratios) of the early PD group, the progressive PD group and the control group were tested by using SPSS26.0 statistical analysis software. According to the homogeneity of variance, two independent sample t-test or approximate t-test (t-test) were used to compare the cerebral metabolites among the NMS subgroups in the case group. Spearman's correlation analysis was used to analyze the correlation of cerebral metabolites with gender, age, H&Y stage, MDS-UPDRS, NMSS, MMSE scales, hypertension, and diabetes in patients with PD. The p < 0.05 was considered statistically significant.
The 24 cases (H&Y: 1.29 ± 0.46) showed premotor symptoms and 13 cases (H&Y: 3.15 ± 0.38) showed progressive symptoms. Three groups had statistical difference in Age, H&Y score, MDS-UPDRS score, and NMSS score (all p < 0.05). The baseline characteristics of the cases are showed in Table 1.
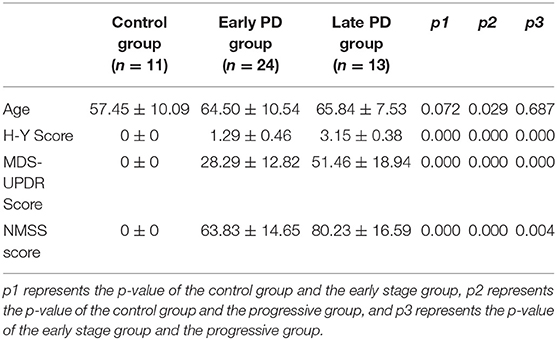
Table 1. Demographics and clinical characteristics of the PD patients.
There were statistically significant differences between two compared group (late PD group and control group; late PD group and early PD group) in metabolite ratios, while no statistically differences between early PD group and control group (p > 0.05). Due to the limit on the scope of this article, we predominantly presented the positive MRS results in Table 2. Detail metabolic information of MRS results will be summarized in the Supplementary Table 1.
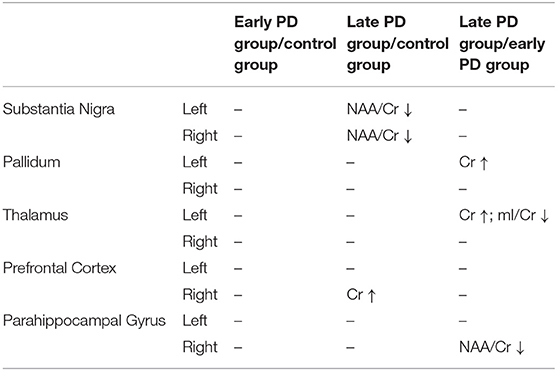
Table 2. Summary of the positive MRS results shown in left/right cerebral hemisphere in the early, late PD group and the control group.
Compared late PD group with the control group, Cr in the right prefrontal cortex in the late PD group was higher than that in the control group (p < 0.05). NAA/Cr ratio in the bilateral substantia nigra in the late PD group was lower than that in the control group (p < 0.05). Compare late PD group with early group, Cr in the left pallium and the left thalamic in the late PD group was higher than that in the early PD group (p < 0.05). NAA/Cr in the right parahippocampal gyrus in the late PD group was lower than that in the early PD group (p < 0.05). The mI/Cr in the left thalamic in the late PD group was lower than that in the early PD group (p < 0.05). Cho/Cr and NAA/Cho were almost no statistically differences between the early PD group, the late PD group, and the control group (p > 0.05). Error bars of mean and standard deviation values of Cr, NAA/Cr were shown in Figure 3.

Figure 3. Error bars of mean and standard deviation values of creatine (Cr) (A), N-acetyl aspartate-to-creatine (NAA/Cr) (B), and myo-Inositol-to-creatine (mI/Cr) (C), at different sites in the early, late PD group, and the control group.
Overall, 37 patients (24 for early stage PD, 13 for progressive PD) and 11 controls were recruited in the study. For the cases, 70% patients suffering with sleep disorders, nearly 67% patients have gastrointestinal and/or bladder dysfunction, 35% for memory decline (shown in Table 3). The NMS gradually increase and worsen as PD disease progresses.
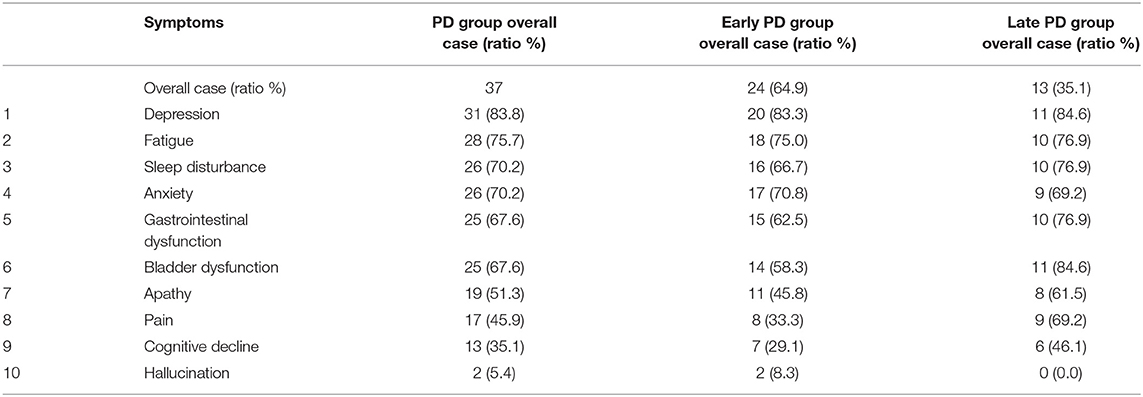
Table 3. Number and rate of non-motor symptoms (according to the results of MDS-UPDRS and NMSS scale).
Non-motor symptoms were categorized into three subgroups according to sleep condition, bowel condition, and cognitive state (as shown in Table 4). Cho/Cr in the right hippocampus in sleep disorder group was higher than that in the non-sleep disorder group (t = 2.184, p < 0.005). The mI/Cr in the right parahippocampal gyrus in gastrointestinal dysfunction group was lower than that in the non-gastrointestinal dysfunction group (t = −2.210, p < 0.005).
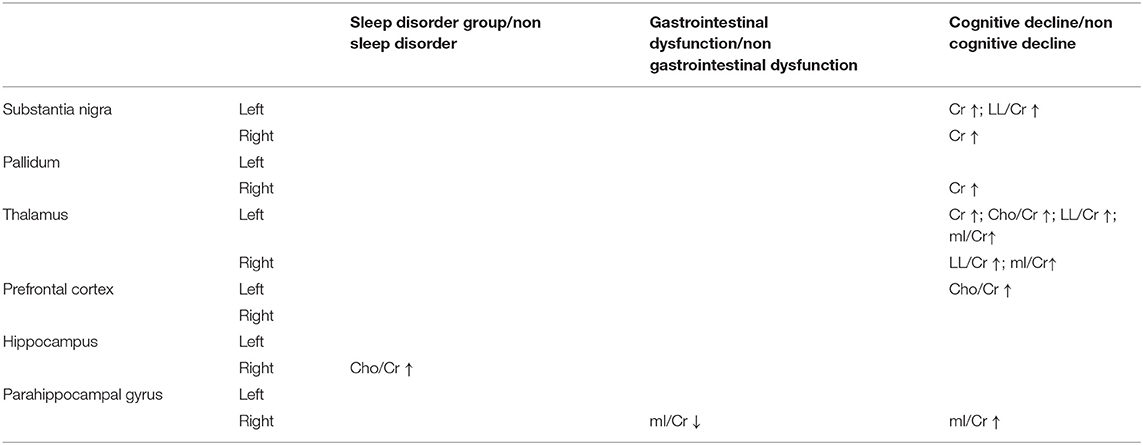
Table 4. The results of MRS in left/right cerebral hemisphere among the three subgroups of NMS-PD.
Comparing the cognitive group with non-cognitive group, four metabolites in twelve brain sites showed statistically difference (Cr, Cho/Cr, LL/Cr, mI/Cr, bilateral substantia nigra, bilateral globus pallidus, bilateral thalami, left prefrontal cortex, and right hippocampus), shown in Figure 4: (1) Cr in cognitive decline group was higher than non-cognitive declined group in bilateral substantia nigra (left: t = 2.575, p < 0.05, right: t = 4.701, p < 0.01), in the right pallidum (t = 2.245, p < 0.05), and in the left thalamus (t = 2.442, p < 0.05). (2) Cho/Cr in cognitive decline group was higher than non-cognitive declined group in the left thalamus (t = 2.467, p < 0.05) and the left prefrontal cortex (t = −2.142, p < 0.05). (3) LL/Cr in cognitive decline group was higher than non-cognitive declined group in left substantia nigra (t = 2.766, p < 0.05) and bilateral thalamus (t = 2.746 for left, 3.561 for right, p < 0.05). (4) mI/Cr in cognitive decline group was higher than non-cognitive declined group in bilateral thalamus (t = 2.184 for left, 2.096 for right, p < 0.05) and in right parahippocampal gyrus (t = 3.147, p < 0.05). Notably, other metabolites such as NAA/Cr and NAA/Cho had almost no statistical difference in all brain region in NMS subgroups (p > 0.05). Moreover, there was no statistically significant difference in Age and Score of H&Y, MDS-UPDRS, NMSS among the three subgroups. For more detail please see the Supplementary Table 2.
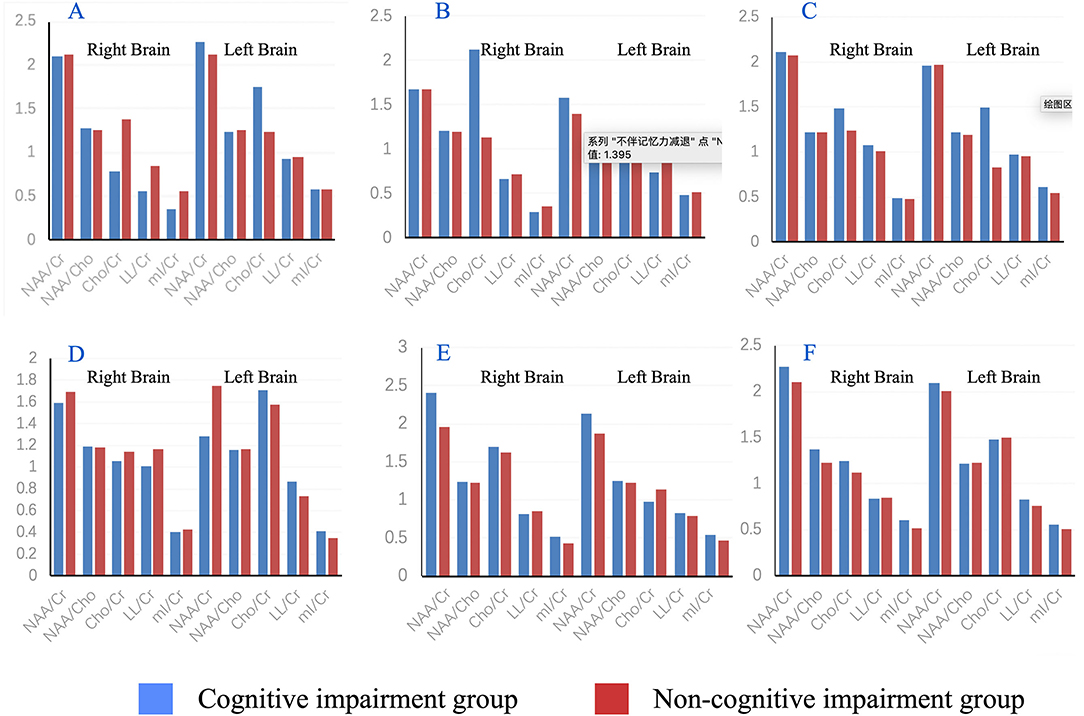
Figure 4. Histogram of mean metabolite results in substantia nigra (A), pallidum (B), thalamus (C), prefrontal cortex (D), hippocampus (E) and parahippocampal gyrus (F) with comparison between the cognitive impairment group and non-memory impairment group.
Spearman's correlation analysis was used to learn the relationship between cerebral metabolites and clinical factors such as age, gender, disease duration, H&Y scale, UPDRS score, NMSS score, hypertension, and diabetes in patients with PD (as shown in Table 5). Regarding to the correlation of age and metabolites in patients with PD, positive correlation between age and Cr was observed in bilateral substantia nigra (r = 0.413 for left, 0.420 for right, p < 0.05), in bilateral pallidum (r = 0.356 for left side, 0.360 for right, p < 0.05), in left prefrontal cortex (r = 0.337, p < 0.05), in right hippocampus (r = 0.387, p < 0.05), and in left parahippocampal gyrus (r = 0.338, p < 0.05). For the correlation of gender and MRS in PD, NAA/Cr in the right substantia nigra or thalamus, NAA/Cho in the right parahippocampal gyrus were found to be positively correlated with men.
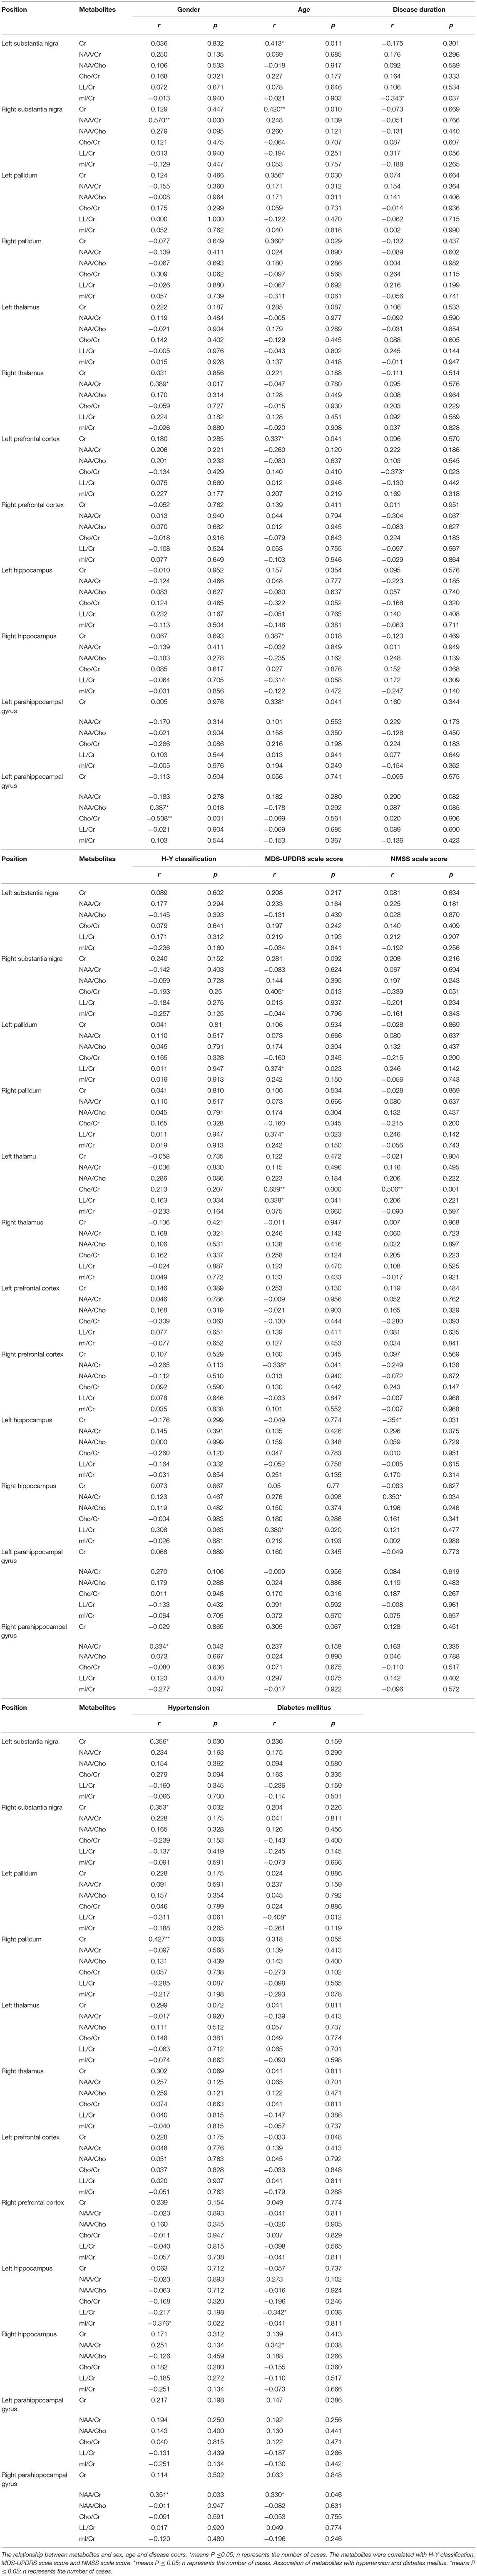
Table 5. Relationship between cerebral metabolites and clinical factors including age, gender, disease duration, H&Y scale, UPDRS score, NMSS score, hypertension and diabetes in PD patients was shown by using spearman correlation analysis.
In terms of the correlation of UPDRS score and metabolites in patients with PD, LL/Cr were positively correlated with MDS-UPDRS in bilateral pallidum (r = 0.374 for both side, p < 0.05), in left thalamus (r = 0.338, p < 0.05) and right hippocampus (r = 0.380, p < 0.05). Cho/Cr was positively correlated in the right substantia nigra (r = 0.405, p < 0.05) and the left thalamus (r = 0.639, p < 0.05). NAA/Cr was statistically significant negative correlation in the right prefrontal gyrus (r = −0.338, p < 0.05). For the correlation of MMSS and metabolites in PD, there was statistically significant positive correlation between Cho/Cr in the left thalamus (r = 0.506), whereas negative correlation in the substantia nigra. Of note, there was no statistically correlation between metabolites and disease duration or H&Y scale (p > 0.05).
When analyzing the correlation between MRS and common chronic diseases (such as hypertension and diabetes) in patients with PD, positive correlations in hypertension were observed in Cr in bilateral substantia nigra (r = 0.356 for left, 0.353 for right) and in the right pallidum (r = 0.427), and identified in NAA/Cr in the right parahippocampal gyrus (r = 0.351). Similarly, positive correlations in diabetes were observed in NAA/Cr in the right parahippocampal gyrus and hippocampus (r = 0.330, 0.242, respectively). By contrast, negative correlation was found between hypertension and MRS in mI/Cr in the left hippocampus (r = −0.376), and between diabetes and MRS in LL/Cr in the left pallidum and hippocampus (r = −0.408 to −0.342, respectively).
We enrolled 48 participants (37 patients and 11 controls) and conducted the statistical difference between control group, the early stage of PD, and the late stage of PD in age, clinical characteristics. A total of 24 cases (H&Y: 1.29 ± 0.46) showed premotor symptoms and 13 cases (H&Y: 3.15 ± 0.38) showed progressive symptoms. Statistical difference was observed in Age, H&Y score, MDS-UPDRS score, and NMSS score among different groups (all p < 0.05). MRS was then performed in the specific cerebral regions, such as substantia nigra, pallidum, thalamus, prefrontal cortex, hippocampus, and parahippocampal gyrus, to investigate the change of neurometabolic in different stage of PD. There were no statistical differences between the early PD group and the control group with regard to the metabolites (p > 0.05), suggesting that no metabolic abnormalities were detectable in early stage patients with PD in our study, which is consistent with another study by Nora Weiduschat et al., who also used MRS but did not detect any effects of PD on the concentrations of NAA, Cho, and Cr in striatal and gray matter in early stage patients with PD (15). Of note, the olfactory center and the dorsal nucleus of the vagus oblongata, which were mainly affected by the lesions in the early stage of Braak's study (13), were not selected in the present and Nora's study. The failure to detect changes in early biomarkers may be related to the inadequate coverage of ROIs. However, some studies had pointed out that the neurodegenerative process can affect different brain regions in the early PD stage, not just affect local areas by dopaminergic denervation. Martin Klietz et al. utilized the MRS technique to estimate the changes in neurometabolic characteristics of early patients with PD in subcortical basal ganglia structures of bilateral frontal lobes, temporal lobes, parietal lobes, occipital lobes, and the cerebellum (16). Decreased NAA, Cho, and Cr were calculated in temporal-parietal, frontal, and occipital lobe. To put it in a nutshell, the alteration of pathology and neurometabolites in the present study may not spread to the substantia nigra, thalamus, hippocampus, and prefrontal lobes. Future studies should engage more ROIs for spectral analysis to identify more metabolic alterations and regions involved in the early pathological changes.
Compared late PD group with a control group or early group, higher Cr ratio and lower NAA/Cr ratio were observed in the late PD group (p < 0.05), which reflects the occurrence of neural cells apoptosis and compensatory for the neuronal energy consumption in certain regions. In addition, mI/Cr in the left thalamus in the late PD group was lower and suggested the activation and proliferation of glial cells in thalamic nuclei. In comparison to the early stage of PD, the disease has progressed and lesion-related metabolites were detected in the globus pallidus, thalamus, and hippocampus, which are consistent with the expansion of clinical symptom dimensions such as fatigue, abnormalities of sensation, and motor disorders. Notably, Cho/Cr and NAA/Cho had almost no statistically difference between the early PD group, the late PD group, and the control group (p > 0.05). The results in comparison with the late PD group and control group or early group suggested that higher Cr ratio, lower NAA/Cr, and lower mI/Cr might be potential biomarkers to imply the progression of PD.
Different severity and progression of neuropathology are determinants of Parkinson's symptoms (5). Pathology of the inclusion body was limited to the medulla oblongata/pontine tegmentum and olfactory bulb/anterior olfactory nucleus during pre-symptomatic stages 1–2, resulting in the obvious appearance of NMS, whereas relatively slight damage of motor symptoms, neural cells and glial cell disorder. In stages 3–4, the lesions gradually spread upward to the midbrain substantia nigra and nuclear grays, causing the gradual reduction of dopamine transmitters in caudate and putamen regions. Motor symptoms emerged at this point. In the end-stages 5–6, pathologies enter to the cerebral cortex and limbic system, which give rise to the manifestation of cerebral cortex dysfunction such as cognitive impairment and emotional disorders.
To find out the specific neurometabolites in NMS patients, we first counted the number of NMS in our included sample. More than 10 kinds of NMS occur in the early stage of patients with PD, mainly depression, anxiety, fatigue, and sleep disorders, and it gradually increases and worse as PD disease progresses. Specific markers presented in different cerebral regions were identified via comparing the alteration of neurochemicals between certain symptoms. The results of this study suggested that Cho/Cr in the right hippocampus in sleep disorder group was higher than that in the non-sleep disorder group (t = 2.184, p < 0.005). The increased level of Cho/Cr reflects the enhanced of membrane catabolism in the damaged site of hippocampus, which is consistent with a study showed the reduced of hippocampal volume in patients with insomnia (17). Of note, the underlying neuropathology of rapid eye movement (REM) sleep behavior disorder (RBD) is the degeneration of cholinergic neurons and neurons in brain stem and limbic system caused by aggregation of α-synuclein (18). Considering the high incidence of RBD (up to 65% of patients with PD), we speculated that sleep disturbances in patients may be related to RBD. Future study about the relationship between MRS metabolic results and RBD should be carried out.
A previously study conducted in patients with mild cognitive impairment or dementia, indicated a significant reductions of NAA in occipital region (19), dorsolateral prefrontal cortex and hippocampus (20), and a dramatically decreased NAA/Cr in temporoparietal cortex (21), occipital lobe (22), and posterior cingulate cortex (23). In contrast, the Cho/Cr ratio increased in the posterior cingulate in patient with mild cognitive impairment (22, 23). However, these statistical differences became no significant after adjusting for age, gender, and MDS-UPDRS, suggesting that MRS of posterior cingulate is not a useful biomarker for revealing the cognitive impairment in PD (23). In the present study, multiple metabolites in cognitive group were higher than that in non-cognitive group, such as Cr in bilateral substantia nigra, right pallidum, and left thalamus, Cho/Cr in the left thalamus and left prefrontal cortex, mI/Cr in bilateral thalamus and right parahippocampal gyrus, LL/Cr in left substantia nigra and bilateral thalamus. Together, pathologies associated with cognitive impairment were identified to gradually spread from midbrain to cerebral cortex. Cr, Cho/Cr, mI/Cr, and LL/Cr were all relatively high in the thalamus, suggesting that MRS of thalamus is sensitive for the detection of cognitive decline in PD. In addition, the alteration of neurochemicals in specific regions (such as Cr, Cho, MI, and LL) may be promising biomarkers to predict or identify cognitive decline in PD. Notably, other metabolites such as NAA/Cr and NAA/Cho had almost no statistical difference in the brain region in NMS subgroups (p > 0.05). There were no statistically differences between three NMS subgroups in Age, Score of H&Y, MDS-UPDRS, and NMSS.
Spearman's correlation analysis was used to study the connection between cerebral metabolites and clinical factors such as age, gender, disease duration, H&Y scale, UPDRS score, NMSS score, hypertension, and diabetes in patients with PD. Ratio of four metabolites, Cr, NAA/Cr, Cho/Cr, LL/Cr, mI/Cr, and NAA/Cho in twelve brain sites were obtained. Cr showed positive correlation with age. Normally, the decreased NAA was mainly associated with decreased gray matter volume and healthy neurons, while the increased Cho, Cr, and mI were related to the increased of white matter (24). The increased level of Cr is consistent with the reduced ratio of gray to white matter and the increased of energy metabolism requirements in the brain. On the other hand, for the relationship between metabolites and clinical symptoms, both Cho/Cr and LL/Cr had positive correlation with motor symptoms, while only Cho/Cr was positively correlated with the NMS. Choline is a component of cerebral myelin and cell membrane (16). The level of Cho might be a helpful hint to imply pathological changes in patients with PD.
In the present study, it is difficult to acquire an accurate metabolic profile in the early stage of PD since some cerebral structures, which are too subtle to be detected and this neuroimaging technique may not be capable to avoid the partial volume effect of the adjacent structures. In addition, the metabolite concentrations of glutamate and GABA, as well as the region of the dorsal nucleus of the vagus oblongata and the olfactory center, were not measured due to a lack of appropriate processing software or equipment. Moreover, the sample size and the study time are not enough. The difference in the incidence of NMS between patients with PD and healthy individuals was not statistically analyzed. Further study could expand the sample size, extend the observation time, conduct more subgroups analysis, and engage more regions of interest (ROIs) for spectral analysis to identify more metabolic alteration. Currently, imaging techniques in the diagnosis of PD are still no clear. With the rapid development of MRS parameters, sequences, software and other technologies, the accuracy of MRS will continuously improve. Further study should be focused on the finding techniques which can directly reflect the changes of cell metabolites in different damaged sites so as to find out more objective markers that can be used to evaluate the site and severity of brain damage. Interestingly, the three-dimensional (3D) midbrain organoids, which are able to recapitulate features of the midbrain and simulate disease progression, can be combined with advanced neuroimaging techniques to investigate the complex pathological development.
Proton magnetic resonance spectroscopy is an advanced tool to quantify neuronal integrity deficits and metabolic changes in PD. Although no symbolic biomarkers were detected in early patients with PD in our study, three biomarkers (Cr, NAA/Cr, and mI/Cr) experienced statistically significant differences, with an increased level of Cr, whereas reduced ratio of NAA/Cr and mI/Cr. In addition, NMS were classified into several subgroups (such as sleep disorder group, gastrointestinal dysfunction group, and cognitive impairment group). Cho/Cr might be a useful marker to identify sleep disorder, while decreased mI/Cr ratio might imply gastrointestinal dysfunction. MRS of thalamus is sensitive for the detection of cognitive decline in PD. The alteration of neurochemicals in specific regions (such as Cr, Cho, mI, and LL) may be promising biomarkers to predict or identify cognitive decline in PD. Furthermore, patients in the late stage of PD, or with cognitive impairment, have relatively extensive and severe brain lesions.
The raw data supporting the conclusions of this article will be made available by the authors, without undue reservation.
The studies involving human participants were reviewed and approved by the Ethics Committee of the Second Affiliated Hospital of Shantou University Medical College and was performed according to the Declaration of Helsinki. The participants provided their written informed consent to participate in the study.
J-tG, XZ, L-fL, and S-yS contributed equally to study design and manuscript writing. Y-qG, Xl-Z, TZ, H-zW, J-qC, and Z-xY reviewed literature and analyzed data. X-hZ and T-xW conducted the neuroimaging. CW and Y-qZ assessed and treated the patients. All authors contributed to the article and approved the submitted version.
This study was supported by the clinical research promotion project of Shantou University Medical College (201409), Guangdong Science and Technology Special Foundation (2021)88-27, and 2020 Li Ka Shing Foundation Cross-Disciplinary Research Grant (No. 2020LKSFG05D).
The authors declare that the research was conducted in the absence of any commercial or financial relationships that could be construed as a potential conflict of interest.
All claims expressed in this article are solely those of the authors and do not necessarily represent those of their affiliated organizations, or those of the publisher, the editors and the reviewers. Any product that may be evaluated in this article, or claim that may be made by its manufacturer, is not guaranteed or endorsed by the publisher.
The Supplementary Material for this article can be found online at: https://www.frontiersin.org/articles/10.3389/fneur.2022.594711/full#supplementary-material
1. Tysnes OB, Storstein A. Epidemiology of Parkinson's disease. J Neural Transm. (2017) 124:901–5. doi: 10.1007/s00702-017-1686-y
2. Postuma RB, Berg D, Stern M, Poewe W, Olanow CW, Oertel W, et al. MDS clinical diagnostic criteria for Parkinson's disease. Mov Disord. (2015) 30:1591–601. doi: 10.1002/mds.26424
3. Schapira AHV, Chaudhuri KR, Jenner P. Non-motor features of Parkinson disease. Nat Rev Neurosci. (2017) 18:435–50. doi: 10.1038/nrn.2017.62
4. Poewe W, Seppi K, Tanner CM, Halliday GM, Brundin P, Volkmann J, et al. Parkinson disease. Nat Rev Dis Primers. (2017) 3:17013. doi: 10.1038/nrdp.2017.13
5. Braak H, Del Tredici. K. Neuropathological staging of brain pathology in sporadic parkinson's disease: separating the wheat from the Chaff. J Parkinsons Dis. (2017) 7:S71–85. doi: 10.3233/jpd-179001
6. Kordower JH, Olanow CW, Dodiya HB, Chu Y, Beach TG, Adler CH, et al. Disease duration and the integrity of the nigrostriatal system in Parkinson's disease. Brain. (2013) 136:2419–31. doi: 10.1093/brain/awt192
7. Hoehn MM, Yahr MD. Parkinsonism: onset, progression and mortality. Neurology. (1967) 17:427–42. doi: 10.1212/wnl.17.5.427
8. Goetz CG, Tilley BC, Shaftman SR, Stebbins GT, Fahn S, Martinez-Martin P, et al. Movement disorder society-sponsored revision of the Unified Parkinson's disease rating scale (MDS-UPDRS): scale presentation and clinimetric testing results. Mov Disord. (2008) 23:2129–70. doi: 10.1002/mds.22340
9. Chaudhuri KR, Martinez-Martin P, Brown RG, Sethi K, Stocchi F, Odin P, et al. The metric properties of a novel non-motor symptoms scale for Parkinson's disease: results from an international pilot study. Mov Disord. (2007) 22:1901–11. doi: 10.1002/mds.21596
10. Folstein MF, Folstein SE, McHugh PR. Mini-mental state. A practical method for grading the cognitive state of patients for the clinician. J Psychiatr Res. (1975) 12:189–98. doi: 10.1016/0022-3956(75)90026-6
11. Le W, Dong J, Li S, Korczyn AD. Can biomarkers help the early diagnosis of Parkinson's disease? Neurosci Bull. (2017) 33:535–42. doi: 10.1007/s12264-017-0174-6
12. Posse S, Otazo R, Dager SR, Alger J. MR spectroscopic imaging: principles and recent advances. J Magn Reson Imag. (2013) 37:1301–25. doi: 10.1002/jmri.23945
13. Braak H, Ghebremedhin E, Rüb U, Bratzke H, Del Tredici. K. Stages in the development of Parkinson's disease-related pathology. Cell Tissue Res. (2004) 318:121–34. doi: 10.1007/s00441-004-0956-9
14. Guan J, Rong Y, Wen Y, Wu H, Qin H, Zhang Q, et al. Detection and application of neurochemical profile by multiple regional (1)H-MRS in Parkinson's disease. Brain Behav. (2017) 7:e00792. doi: 10.1002/brb3.792
15. Weiduschat N, Mao X, Beal MF, Nirenberg MJ, Shungu DC, Henchcliffe C. Usefulness of proton and phosphorus MR spectroscopic imaging for early diagnosis of Parkinson's disease. J Neuroimaging. (2015) 25:105–10. doi: 10.1111/jon.12074
16. Klietz M, Bronzlik P, Nösel P, Wegner F, Dressler DW, Dadak M, et al. Altered neurometabolic profile in early parkinson's disease: a study with short echo-time whole brain MR spectroscopic imaging. Front Neurol. (2019) 10:777. doi: 10.3389/fneur.2019.00777
17. Winkelman JW, Benson KL, Buxton OM, Lyoo IK, Yoon S, O'Connor S, et al. Lack of hippocampal volume differences in primary insomnia and good sleeper controls: an MRI volumetric study at 3 Tesla. Sleep Med. (2010) 11:576–82. doi: 10.1016/j.sleep.2010.03.009
18. Adler CH, Beach TG. Neuropathological basis of nonmotor manifestations of Parkinson's disease. Mov Disord. (2016) 31:1114–9. doi: 10.1002/mds.26605
19. Summerfield C, Gómez-Ansón B, Tolosa E, Mercader JM, Martí MJ, Pastor P, et al. Dementia in Parkinson disease: a proton magnetic resonance spectroscopy study. Arch Neurol. (2002) 59:1415–20. doi: 10.1001/archneur.59.9.1415
20. Pagonabarraga J, Gómez-Ansón B, Rotger R, Llebaria G, García-Sánchez C, Pascual-Sedano B, et al. Spectroscopic changes associated with mild cognitive impairment and dementia in Parkinson's disease. Dement Geriatr Cogn Disord. (2012) 34:312–8. doi: 10.1159/000345537
21. Hu MT, Taylor-Robinson SD, Chaudhuri KR, Bell JD, Morris RG, Clough C, et al. Evidence for cortical dysfunction in clinically non-demented patients with Parkinson's disease: a proton MR spectroscopy study. J Neurol Neurosurg Psychiatry. (1999) 67:20–6. doi: 10.1136/jnnp.67.1.20
22. Nie K, Zhang Y, Huang B, Wang L, Zhao J, Huang Z, et al. Marked N-acetylaspartate and choline metabolite changes in Parkinson's disease patients with mild cognitive impairment. Parkinsonism Relat Disord. (2013) 19:329–34. doi: 10.1016/j.parkreldis.2012.11.012
23. Almuqbel M, Melzer TR, Myall DJ, MacAskill MR, Pitcher TL, Livingston L, et al. Metabolite ratios in the posterior cingulate cortex do not track cognitive decline in Parkinson's disease in a clinical setting. Parkinsonism Relat Disord. (2016) 22:54–61. doi: 10.1016/j.parkreldis.2015.11.008
Keywords: early diagnosis, biomarker, Parkinson's disease, proton magnetic resonance spectroscopy, MRI
Citation: Guan J-t, Zheng X, Lai L, Sun S, Geng Y, Zhang X, Zhou T, Wu H-z, Chen J-q, Yang Z-x, zheng X-h, Wang J-x, Chen W and Zhang Y-q (2022) Proton Magnetic Resonance Spectroscopy for Diagnosis of Non-Motor Symptoms in Parkinson's Disease. Front. Neurol. 13:594711. doi: 10.3389/fneur.2022.594711
Received: 14 August 2020; Accepted: 04 January 2022;
Published: 28 February 2022.
Edited by:
Wang Zhan, University of Maryland, United StatesReviewed by:
Joseph O'Neill, University of California, Los Angeles, United StatesCopyright © 2022 Guan, Zheng, Lai, Sun, Geng, Zhang, Zhou, Wu, Chen, Yang, zheng, Wang, Chen and Zhang. This is an open-access article distributed under the terms of the Creative Commons Attribution License (CC BY). The use, distribution or reproduction in other forums is permitted, provided the original author(s) and the copyright owner(s) are credited and that the original publication in this journal is cited, in accordance with accepted academic practice. No use, distribution or reproduction is permitted which does not comply with these terms.
*Correspondence: Wei Chen, Y2h3NzIwM0AxMjYuY29t; You-qiao Zhang, eW91cWlhb3poYW5nQDE2My5jb20=
†These authors share first authorship
Disclaimer: All claims expressed in this article are solely those of the authors and do not necessarily represent those of their affiliated organizations, or those of the publisher, the editors and the reviewers. Any product that may be evaluated in this article or claim that may be made by its manufacturer is not guaranteed or endorsed by the publisher.
Research integrity at Frontiers
Learn more about the work of our research integrity team to safeguard the quality of each article we publish.