 Yanyan Jiang
 Chuancheng Ren1†
 Yuncheng Wu
 Dongya Huang
 Weiting Yang
- 1Department of Neurology, Shanghai East Hospital, Tongji University School of Medicine, Shanghai, China
- 2Department of Neurology, Shanghai General Hospital, Shanghai Jiao Tong University School of Medicine, Shanghai, China
Purpose: The aim of our study was to determine whether delta red blood cell distribution (ΔRDW) improves neurological outcomes in acute ischemic stroke (AIS) patients 2 years after intravenous thrombolysis (IVT) therapy.
Methods: AIS patients who received IVT between January 2013 and December 2019 were retrospectively analyzed. In accordance with their mRS scores, the patients were divided into two groups. A binary logistic regression analysis was conducted to determine the influencing factors of adverse functional outcomes. It was decided to evaluate the variables' the predictive ability by using the area under the receiver operating characteristic. For the poor neurological recovery risk model, features were selected using the LASSO regression model. We also developed a predictive model based on logistic regression analysis, which combined the features selected in the minimum absolute contraction and selection operator regression models. An evaluation of the discrimination, calibration, and clinical applicability of the predictive model was conducted using the C index, calibration chart, and decision curve analysis. Internal validation was evaluated via bootstrapping.
Results: Binary logistic regression analysis showed that ΔRDW was an independent influencing factor for poor neurofunctional outcomes. The most appropriate ΔRDW cut-off value for predicting the recovery of poor neurological outcomes was 18.9% (sensitivity: 89.9%, specificity: 78.6%, p < 0.001). The predictive factors included in the nomogram were age, the occurrence of CHD, stroke, AF, ΔRDW, NIHSS score at onset, interval time from onset to IVT, and whether there were indwelling urine catheters and gastric tubes. The model has not only a good discrimination ability, which was indicated by an overall C index of 0.891 (95% confidence interval: 0.829–0.953), but also a considerable calibration ability. Decision curve analysis showed that the nomogram of adverse neurological outcomes recovery was useful in the clinical practice when intervention was implemented above the threshold of 1% possibility of adverse neurological outcomes recovery.
Conclusion: In patients with AIS after thrombolysis, the ΔRDW is a potential influencing factor that can be readily used to predict the likelihood of poor neurological function recovery.
Introduction
Acute ischemic stroke (AIS) is a condition caused by blood circulation disorders and ischemia-hypoxia of the brain that causes tissue necrosis. One of the most common forms of stroke is an ischemic stroke, which is characterized by a focal brain infarction, along with sudden and persistent neurological deficits. Globally, a stroke, whether ischemic or hemorrhagic, is the most common cause of serious adverse events, like deaths and disability (1, 2). AIS is a severe acute disease of the nervous system that accounts for over 65% of all stroke cases (3). Intravenous thrombolysis rapidly restores blood flow (perfusion), which is vital for neuronal survival and recovery, and improves clinical outcomes. However, it is estimated that only 2–5% of stroke patients have been treated with intravenous recombinant tissue plasminogen activator (rt-PA) (4), although patients suffering from AIS responded well to intravenous rt-PA treatment (5). Furthermore, the effective therapeutic time window for cerebral reperfusion via thrombolysis is limited to approximately 4.5 h after ischemia (6, 7). Due to its complications of ischemic stroke, which worsened patients' prognosis, treatment with rt-PA should be carefully considered, both for risks and benefits. Hence, better decision strategies and effective implementation are of urgent need to mitigate the disease burden of ischemic stroke in China (8).
Red blood cell distribution width (RDW) could be obtained from a complete blood count (CBC), which is a convenient and inexpensive way to measure erythrocyte size variability. Anemia and inflammation are commonly assessed by RDW clinically. The normal range of RDW is 11.0 to 16.0%, and it can rise under some pathological or even physiological conditions (9, 10). Anemia could be diagnosed, classified, and treated guided by analyzing the size of erythrocytes using RDW. Previously, Higher RDW used to be closely related to increased mortality in patients with cardiovascular and cerebrovascular events, such as ischemic stroke, coronary disease, and peripheral artery disease (11–13). Nowadays, clinical diagnosis of AIS relies on history, neurological examinations and neuroimaging, while several scoring systems and RDW are adopted to assess the severity of stroke (14). There is still no surrogate biomarker to diagnose stroke. RDW by flow cytometry, on the other hand, is one of the most promising optional markers for predicting the occurrence of stroke and prognosis after rt-PA therapy in ischemic stroke.
Studies showed that RDW change from day 1 to day 4 was an independent predictor of mortality in patients with community-acquired pneumonia (15). However, there is no literature reporting the association between the difference in RDW from before to after thrombolysis (ΔRDW) and AIS, especially neurological recovery after rt-PA therapy. It is hypothesized that changes in ΔRDW may affect neurological outcome in acute stroke patients. In this study, we sought to evaluate the prognostic effect of RDW difference on mRS score in patients with AIS 2 years after rt-PA therapy, which may be. It is of great significance for the prognostic analysis and treatment of acute ischemic cerebral infarction.
Subjects, materials and methods
Subjects and designs
We got a formal ethical approval from the Shanghai East Hospital Ethics Committee prior to implementation. Clinical, laboratory, and neuroimaging data of 361 AIS patients who received reperfusion therapy with intravenous thrombolysis (IVT) consecutively were retrospectively analyzed at Shanghai East Hospital between January 2013 and December 2019. Stroke-specialized neurologist diagnosed AIS based on radiographic and clinical findings from a brain imaging study.
Criteria for inclusion and exclusion
Including criteria: (1) As defined by Guidelines for the Diagnosis and Treatment of AIS (16). (2) Rt-PA intravenous thrombolysis was performed based on the latest guidelines of the American Heart Association (ASA) (17). (3) All patients and family members signed informed consent forms.
Excluding criteria
(1) Patients with malignant tumors and severe heart, liver, or kidney dysfunction; (2) Patients with cerebral hemorrhage, imaging changes of early large-scale cerebral infarction by craniocerebral computed tomography (CT) examination or epilepsy; (3) Patient with contraindications to thrombolysis; (4) Patients that was treated with anticoagulant. (5) Patients under the age of 18, or with incomplete clinical or laboratory data.
Neurological deficits were graded from 0 to 42 using the NIH Stroke Scale (NIHSS) score (18) and a higher score indicates a more severe condition. In addition to collecting demographic information, neurologists trained and certified in neurology collected modified Rankin Scale (mRS) scores. We grouped the patients according to the mRS score system (19), which was used to measure the outcome of functional recovery after stroke by the following: 0–2 being favorable and 3–6 being unfavorable. We recorded the NIHSS and mRS scores of patients on admission, discharge, and 2 years after hospital discharge.
Observation of indexes
We documented the baseline characteristics, including gender, age, cerebrovascular risk factors (hypertension, diabetes mellitus, heart disease, current smoking and drinking, blood glucose (BG) and blood lipid on admission. The ethylene-diamine-tetra-acetic acid (EDTA) tubes were used for collecting blood samples on admission and the third day after IVT, respectively. Hematology automated analyzer XE-2100 (Sysmex Company, Japan) was used to conduct the CBC within 20 min (min) after the sample was collected. ΔRDW values were calculated as the difference between the RDW value measured upon the third day after IVT and on admission (i.e., [the third day after IVT hospitalization RDW] - [on admission RDW]). All the enrolled subjects underwent CT imaging using an 64-detector row CT scanner (Philips brilliance, Japan) and MR imaging using a 3.0 T scanner (Discovery MR750, GE Healthcare, Milwaukee, WI, USA) on admission or in outpatient in this study.
Follow-up and study endpoints
A 2-year follow-up was performed on all patients to track their neurological recovery. A favorable functional outcome was defined as a mRS score of 0–2 and an unfavorable functional outcome as 3–6 based on the mRS score system. 2-year mortality was the endpoint. Outpatient visits and telephone follow-ups were used to collect follow-up information.
Statistical analysis
The patients' baseline characteristics were presented as the total percentage and the mean ± SD in the categorical variables or median and interquartile range (IQR) in the continuous variables based on the normality of the distribution. Pearson's χ test or Fisher's exact test Student's t-test and Mann-Whitney U test were selected to calculate the differences for numerical and categorical variables, as appropriate.
The least absolute shrinkage and selection operator (LASSO) regression technique was adopted for the selection of data dimension and predictors. Models incorporating multivariate logistic regression were used to determine risk levels and develop a nomogram for poor prognoses. The probability of each variate contributing to the outcomes was assigned based on the regression coefficient value for each variate in our study. To further assess the accuracy of the nomogram in predicting patient prognoses, plotted the receiver operating characteristic (ROC) curve and calculated the area under curve of ROC (AUC) for receiver operating characteristics. The calibration curve was then introduced to evaluate the consistency of prediction and observation. In order to evaluate the clinical applicability of the nomogram, the decision curve analysis (DCA) was conducted by quantifying the net benefit across all threshold probabilities. Internal validation completed by the bootstrapping method (Resampling = 1,000).
The statistical analysis in this article was performed using R software (version 4.2.0, https://www.r-project.org). The nomogram was generated using the “rms” package of R software. Statistical significance levels reported were all two-way, with P < 0.05 considered statistically significant.
Results
Patients' characteristics
A total of 361 patients visited our clinic from January 2013 to December 2019. All participants were presented in Table 1 with their baseline characteristics. A mean age of 66 years was found among the patients, including the 129 women (35.7%). The cohort consisted of 248 participants with hypertension, 56 with CHD, 80 with AF, and 42 with stroke (previous stroke history). One hundred and forty two patients (39.3%) had a history of tobacco smoking and alcohol consumption was mentioned in 86 patients (23.8%). The median ΔRDW, LDL, and BG concentrations were 0, 2.75, and 7.07 mmol/L. The mean interval time from stroke onset to IVT was 180.00 min. All patients were divided into good and poor neurological outcomes recovery groups based on mRS scores. Table 1 provided all the clinical data regarding demographics, disease features, and treatment in each two groups.
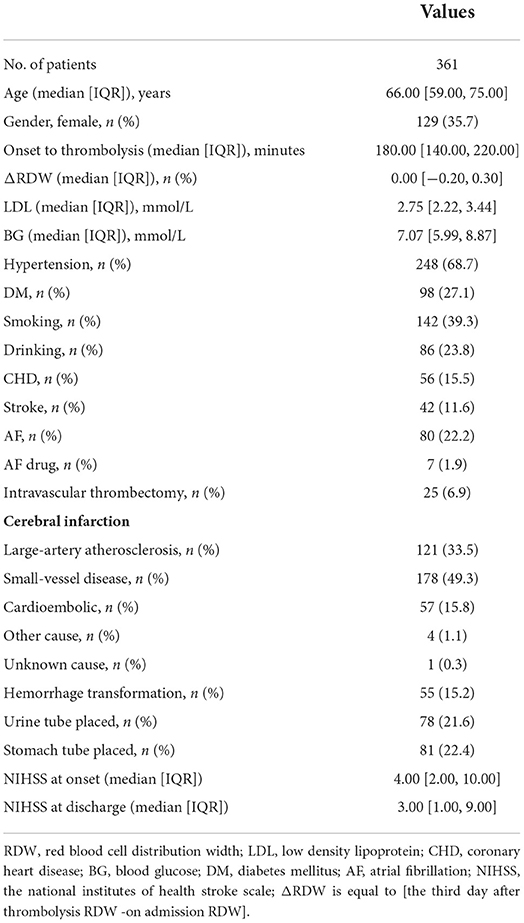
Table 1. Baseline characteristics.
Feature selection
Among all the demographics and clinical parameters, nine out of 21 features were thought to be potential predictors based on 361 patients in the cohort (Figures 1A,B) and showed non-zero coefficients in the LASSO regression model. These features included age, the occurrence of CHD, AF, stroke, ΔRDW, NIHSS score at onset, interval time from onset to IVT, and whether there were indwelling urine catheters and gastric tubes (Table 2).
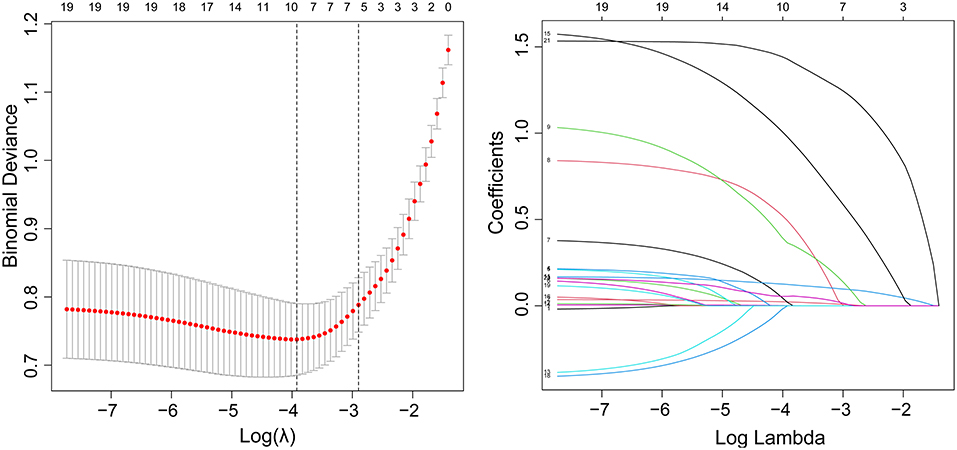
Figure 1. Demographic and clinical feature selection using the LASSO binary logistic regression model. (A) Fivefold cross-validation of the LASSO model's optimal parameter (lambda) was used. Plotted against log (lambda) is the partial likelihood deviance (binomial deviance). A minimum criteria and a 1 SE of the minimum criteria (the 1-SE criteria) were used to draw the dots representing the optimal values. (B) Profiles of the 21 features calculated by LASSO coefficients. This function plots coefficients vs. log (lambda) sequence. When lambda was optimal, there were nine features with non-zero coefficients, which was drawn as a vertical line. SE stands for standard error, and LASSO stands for least absolute shrinkage and selection operator.
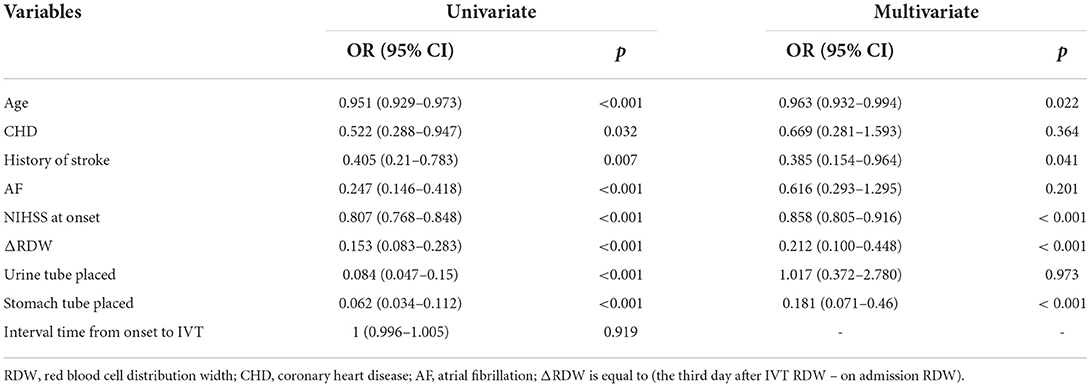
Table 2. Univariate and multivariate analysis of risk factors for poor neurological outcomes recovery.
Development of an individualized and applicable predictive model
Uni-variable binary logistic regression analysis showed that each additional unit of age (p < 0.001), the incidence of CHD (p = 0.032), stroke (previous history of stroke) (0.007), and AF (p < 0.001), NIHSS score at onset (p < 0.001), ΔRDW (p < 0.001), and indwelling urine catheters (p < 0.001) and gastric tubes (p < 0.001) were significantly associated with patients' neurological outcomes recovery after thrombolysis for acute ischemic stroke (Table 2). AUC (ΔRDW) = 0.905 with a 95% confidence interval of AUC = 0.869 to 0.934 was obtained from and the statistically significant difference (p < 0.001) made by this model using ROC analysis (endpoint: poor neurological outcomes recovery) (see Figure 2). The optimal critical value for ΔRDW was 18.9%, while at this point with a sensitivity of 89.9% and specificity of 78.6% to calculated the maximum approximate index. Furthermore, in view of clinical parameters, multivariable binary logistic regression model demonstrated that every one unit increase in age (OR: 0.963; 95%CI: 0.932–0.994; p = 0.022), RDW (OR: 0.212; 95%CI: 0.100–0.448; p < 0.001), NIHSS score at onset (OR: 0.858; 95%CI: 0.805–0.916; p < 0.001), indwelling gastric tubes (OR: 0.181; 95%CI: 0.071–0.460; p < 0.001), and the occurrence of stroke (OR: 0.385; 95% CI: 0.154–0.964; p = 0.041) were considered to be independent predictors of patients' neurological outcomes recovery after stroke thrombolysis for AIS. An integrated model incorporating the aforementioned statistically independent predictors in multivariable binary logistic regression was designed and presented in the form of a nomogram in Figure 3.
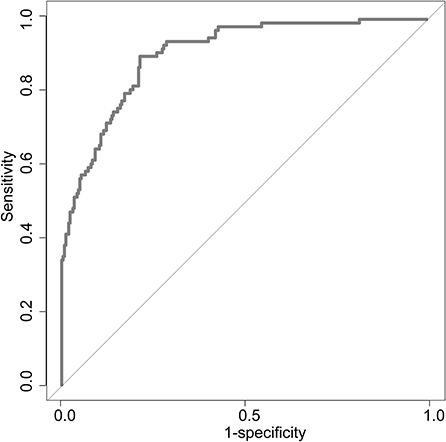
Figure 2. ROC curve to determine the predictive performance of ΔRDW for poor neurological outcomes recovery. ROC, Receiver operating characteristic; ΔRDW, the third day after IVT red blood cell distribution width – on admission red blood cell distribution width.
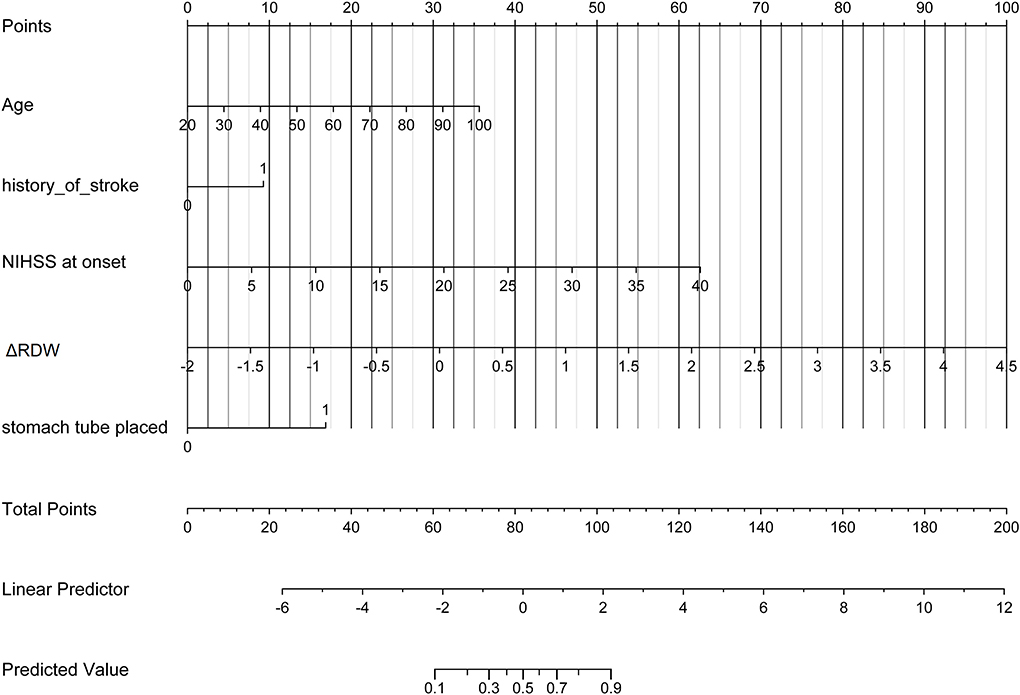
Figure 3. Developed poor neurological outcomes recovery nomogram. With the age, the history of stroke, NIHSS score at onset, ΔRDW, and indwelling gastric tubes in the cohort, a poor neurological outcomes recovery nomogram was developed. In our research, depending on the size of the regression coefficient, the nomogram scored the value of each variable. By converting each patient's score into a probability, the probability of different outcomes for each patient could be calculated. ΔRDW, the third day after IVT red blood cell distribution width – on admission red blood cell distribution width.
Apparent performance of the nonadherence risk nomogram and clinical application
The calibration curve of risk nomogram for predicting poor neurological outcomes recovery risk in patients after thrombolysis for AIS demonstrated a good fit (Figure 4). The C-index of the prediction nomogram was 0.891 (95% CI: 0.829–0.953) for the cohort and was confirmed through 1,000 bootstrapping validation, which suggested the model's good discrimination (Figure 5). The decision curve analysis for the poor neurological outcomes recovery nomogram was presented in Figure 6 and indicated that ΔRDW was a negative independent risk factor of poor neurological outcomes with clinical net benefit in a range of risk thresholds (threshold >1%) where the net benefit was comparable within this range, though there were several overlaps in the poor function recovery risk nomogram.
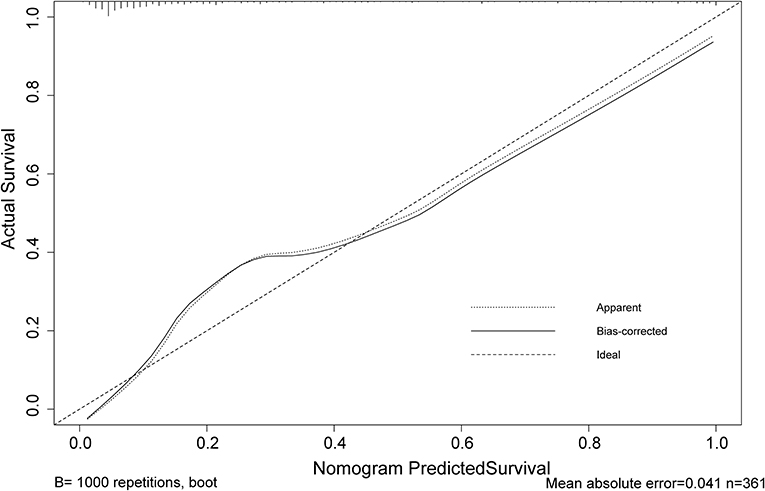
Figure 4. Calibration curve of the poor neurological outcomes recovery nomogram prediction in the cohort. Predicted poor neurological outcomes recovery risk is represented by the x-axis. The y-axis represents the actual diagnosed poor neurological outcomes recovery. Ideal model predictions are represented by the diagonal dotted line. The solid line represents the predictive performance of our nomogram, and a closer fit to the diagonal dotted line indicates a better prediction.
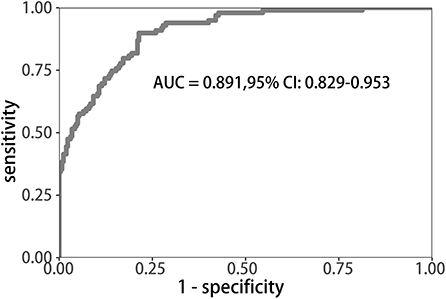
Figure 5. C-index analysis for the sensitivity and specificity of the nomogram.

Figure 6. Decision curve analysis for the poor neurological outcomes recovery nomogram. The y-axis measures the net benefit. The blue line represents the poor neurological outcomes recovery risk nomogram. The light gray line represents the assumption that all patients suffer from poor neurological outcomes recovery. The black solid line represents the assumption that no patients suffer from poor neurological outcomes recovery.
Discussion
Table 1 and Supplementary materials showed that, compared to favorable functional outcome group after IVT, the unfavorable outcome group varied in not only ΔRDW, but also seven other features, including age, NIHSS score at onset or over, the occurrence of CHD, previous history of stroke, hemorrhagic transformation, incidence of thrombectomy and whether there were indwelling urine catheters or gastric tubes, which was in accordance with previous studies. Previous studies have shown that age identified as an unmodifiable risk factor for stroke (20), NIHSS score strongly affects stroke outcomes (21), hemorrhagic transformation after thrombolysis will affect prognosis (22), etc. It has been shown that thrombolytic therapy can improve the outcome of neurological injury and death in AIS patients when the indications for thrombolytic therapy are met, and contraindications are not present (16). In nursing and managing patients with AIS, proper and timely management plays an important role (23, 24), including an accurate diagnosis and prognosis. It is therefore necessary to determine the severity of neurological impairment and cognitive impairment on admission when treating AIS patients and to identify the risk factors that are associated with adverse outcomes following thrombolysis. Among many examinations, including physical examination and imaging examination, the value of routine laboratory parameters (such as RDW) is often underestimated. There has been an increase in the use of simple and inexpensive RDW tests in whole blood over the past few years to help predict many disease (25–27). As we all know, there are still a small portion of patients with cerebral infarction who suffer from serious conditions such as post-thrombotic hemorrhage after receiving thrombolytic therapy. Studies have shown that high RDW levels increase the risk of hemorrhagic transformation and stroke recurrence in patients with cerebral infarction receiving thrombolytic therapy (28, 29). Another research shows that high levels of RDW before thrombolysis can predict poor neurological recovery in patients with cerebral infarction at 1 year after IVT therapy (30) which means that RDW, as a fast, simple, and cheap method, is capable of distinguishing poor recovery of nerve function following thrombolysis. According to the ROC curve, the appropriate cutoff value for detection was 0.189, with 0.786 specificity and 0.899 sensitivity in our study. Furthermore, a logistic regression model was developed using several clinical and demographic parameters, including age, CHD, history of stroke, AF, ΔRDW, indwelling catheters, and the NIHSS score at the onset and after thrombolysis and was proven to have good discrimination and calibration capabilities. The results showed that the changes in RDW at the time of admission and that on the third day after thrombolysis were associated with poor prognoses for neurological outcomes. The decision curve analysis showed that when the intervention is implemented above the threshold of 1% of the possibility of poor neurological recovery, the nomogram of poor neurological recovery had a certain practical value in clinical practice. Previous studies have shown that high RDW levels are closely related to complications and death risks of various diseases (31–33). For example, RDW can be used as a prognostic factor for the severity and progression of AIS after antithrombotic therapy (34). Other studies have shown that RDW may become a biomarker of a high inflammatory response (35). Nevertheless, the biological mechanism that underlies the changes in RDW before and after thrombolysis and the recovery of function following thrombolysis in AIS remains unclear, inflammation and oxidative stress have been suggested as potential mechanisms.
The increase in RDW level can be attributed to the following reasons: (1) It is possible that metabolic pathway disorders contribute to the increase in RDW level (36, 37). (2) Since the increase in RDW levels is directly related to hypertension, a risk factor for cerebrovascular disease, a relationship between RDW and inflammation is highlighted, which supports the hypothesis that chronic inflammation contributes to elevated RDW levels (38). (3) As a result of large red blood cells occluding the carotid arteries, RDW may promote the progression of ischemic stroke (39). (4) An increase in RDW levels is associated with oxidative stress and the production of free radicals, which can further contribute to the occurrence of atherosclerosis following an ischemic stroke (40). (5) Studies have suggested that malnutrition may be a contributing factor to the increase in RDW level (41). (6) There is a correlation between an increase in RDW level and cerebrovascular diseases, suggesting that it may play a role in the changes in cerebral hemodynamics (42). Erythropoietin-induced erythrocyte maturation is inhibited by proinflammatory cytokines (43), which is partially reflected in an increase in RDW. Then, an inflammatory response to the body can affect bone marrow function and iron metabolism (44, 45). Moreover, oxidative stress has been implicated in increased RDW by shortened RBC survival and increasing the number of large premature RBC (46). Hence, resolution of inflammation and oxidative stress after thrombolysis in acute cerebral infarction may reduce RDW level.
It appears that cerebrovascular events may be a trigger for red blood cell abnormalities in AIS events as well as after thrombolysis. Likewise, regression analysis found a significant correlation between the changes in RDW before and after thrombolysis and the recovery of neurological function. Consequently, RDW represents a valuable diagnostic biomarker in these patients. In this regard, abnormal erythropoiesis and metabolic processes might lead to acute cerebrovascular disease or even exacerbate it. It is well-known that red blood cells, as oxygen carriers in the blood, can increase RDW level when their structures are abnormal, thus promoting thrombosis (47). Secondly, anisocytosis can cause a rise in nitric oxide, decreasing blood flow-dependent arterial dilatation, triggering ischemic injury events, or aggravating previously existing ischemic injuries.
It is true that this study has some limitations. First, patients' compliance varies after discharge. It is possible for some patients to die as a result of other major diseases or accidents. Additionally, we did not perform a stratified analysis of risk factors. Meanwhile, we only investigated the relationship between ΔRDW value and poor neurological outcomes. Considering that other factors may be influenced RDW level, continuous monitoring may be necessary. Finally, this clinical study focused more on correlation than causality, without exploring the mechanism behind the relationship. The conclusion needs to be supported and verified by further animal experiments. We will also conduct multicenter research in our next experiment to obtain more reliable results. Moreover, larger sample sizes and multicenter studies are required to evaluate our results, primarily to determine whether ΔRDW affected the results and if the results are clinically significant or not.
Conclusion
Our study showed that ΔRDW is an independent risk factor for poor neurological recovery after thrombolysis in AIS patients. It is a reference value for treatment strategy for those patients with poor neurological recovery within 2 years of thrombolysis based on ΔRDW prediction.
Data availability statement
The original contributions presented in the study are included in the article/supplementary material, further inquiries can be directed to the corresponding authors.
Ethics statement
The studies involving human participants were reviewed and approved by the Shanghai East Hospital Ethics Committee. The patients/participants provided their written informed consent to participate in this study. Written informed consent was obtained from the individual(s) for the publication of any potentially identifiable images or data included in this article.
Author contributions
Project administration, supervision, and resources: DH. Conceptualization, investigation, and resources: WY. Writing—review and editing: YW. Data curation and validation: AA. Methodology, funding acquisition, and visualization: CR. Formal analysis, writing—original draft, and software: YJ. All authors have read and agreed to the published version of the manuscript.
Funding
This study was supported by the National Natural Science Foundation of China (Grant No. 81571277).
Conflict of interest
The authors declare that the research was conducted in the absence of any commercial or financial relationships that could be construed as a potential conflict of interest.
Publisher's note
All claims expressed in this article are solely those of the authors and do not necessarily represent those of their affiliated organizations, or those of the publisher, the editors and the reviewers. Any product that may be evaluated in this article, or claim that may be made by its manufacturer, is not guaranteed or endorsed by the publisher.
Supplementary material
The Supplementary Material for this article can be found online at: https://www.frontiersin.org/articles/10.3389/fneur.2022.1011946/full#supplementary-material
Abbreviations
AIS, Acute ischemic stroke; rt-PA, recombinant tissue plasminogen activator; IVT, intravenous thrombolysis; CBC, complete blood count; ΔRDW, the third day after IVT RDW – on admission RDW, ; NIHSS, NIH Stroke Scale; mRS, Modified Rankin Scale; CT, computed tomography; 3.0T MR, 3.0 Tesla magnetic resonance; EDTA, The ethylene-diamine-tetra-acetic acid; lasso, The least absolute shrinkage and selection operator; AUC, The area under the curve; BP, blood pressure; BG, blood glucose; CHD, coronary heart disease; AF, atrial fibrillation.
References
1. Mahon SR, Krishnamurthi AV, Witt E, Barker-Collo S, Parmar P. Primary prevention of stroke and cardiovascular disease in the community (PREVENTS): methodology of a health wellness coaching intervention to reduce stroke and cardiovascular disease risk, a randomized clinical trial. Int J Stroke. (2018) 13:223–32. doi: 10.1177/1747493017730759
2. Ma Q, Li R, Wang L, Yin P, Wang Y, Yan C. Temporal trend and attributable risk factors of stroke burden in China, 1990–2019: an analysis for the global burden of disease study 2019. Lancet Public Health. (2021) 6:E897–906. doi: 10.1016/S2468-2667(21)00228-0
3. Irfan M, Jawaid W, Hashmat O, Nisa Q, Khastoori II DR, Shahbaz NN. association between hyperuricemia and acute ischemic stroke in patients at a tertiary care hospital. Cureus J Med Sci. (2020) 12:10899. doi: 10.7759/cureus.10899
4. Demaerschalk BM, Kleindorfer DO, Adeoye OM, Demchuk AM, Fugate JE, Grotta JC, et al. Scientific rationale for the inclusion and exclusion criteria for intravenous alteplase in acute ischemic stroke: a statement for healthcare professionals from the American heart association/American stroke association. Stroke. (2016) 47:581–641. doi: 10.1161/STR.0000000000000086
5. National Institute of Neurological D and P.A.S.S.G. Stroke. Tissue plasminogen activator for acute ischemic stroke. N Engl J Med. (1995) 333:1581–7. doi: 10.1056/NEJM199512143332401
6. Gil-Rojas Y, Lasalvia P. Budgetary impact analysis of alteplase - recombinant tissue plasminogen activator (rtPA) - as a thrombolytic treatment for acute ischemic stroke in Colombia. Expert Rev Pharmacoecon Outcomes Res. (2022) 3:1–8. doi: 10.1080/14737167.2022.2089655
7. Roth JM. Recombinant tissue plasminogen activator for the treatment of acute ischemic stroke. Proc Bayl Univ Med Cent. (2011) 24:257–9. doi: 10.1080/08998280.2011.11928729
8. Norrving B, Davis SM, Feigin VL, Mensah GA, Sacco RL, Varghese C. Stroke prevention worldwide - what could make it work? Neuroepidemiology. (2015) 45:215–20. doi: 10.1159/000441104
9. Lippi G, Plebani M. Red blood cell distribution width (RDW) and human pathology. One size fits all. Clin Chem Lab Med. (2014) 52:1247–9. doi: 10.1515/cclm-2014-0585
10. Salvagno GL, Sanchis-Gomar F, Picanza A, Lippi G. Red blood cell distribution width: a simple parameter with multiple clinical applications. Crit Rev Clin Lab Sci. (2015) 52:86–105. doi: 10.3109/10408363.2014.992064
11. Song SY, Hua C, Dornbors III D, Kang RJ, Zhao XX, Du X. Baseline red blood cell distribution width as a predictor of stroke occurrence and outcome: a comprehensive meta-analysis of 31 studies. Front Neurol. (2019) 10:1237. doi: 10.3389/fneur.2019.01237
12. Abrahan IV LL, Ramos JD, Cunanan EL, Tiongson MD, Punzalan FE. Red cell distribution width and mortality in patients with acute coronary syndrome: a meta-analysis on prognosis. Cardiol Res. (2018) 9:144–52. doi: 10.14740/cr732w
13. Poz D, De Falco E, Pisano C, Madonna R, Ferdinandy P, Balistreri CR. Diagnostic and prognostic relevance of red blood cell distribution width for vascular aging and cardiovascular diseases. Rejuvenation Res. (2019) 22:146–62. doi: 10.1089/rej.2018.2094
14. Kara H, Degirmenci S, Bayir A, Ak A, Akinci M, Dogru A. Red cell distribution width and neurological scoring systems in acute stroke patients. Neuropsychiatr Dis Treat. (2015) 11:733–9. doi: 10.2147/NDT.S81525
15. Lee SM, Lee JH, Kim K, Jo YH, Lee J, Kim J. The clinical significance of changes in red blood cell distribution width in patients with community-acquired pneumonia. Clin Exp Emerg Med. (2016) 3:139–47. doi: 10.15441/ceem.15.081
16. Jauch EC, Saver JL, Adams Jr HP, Bruno A, Connors JJ, Demaerschalk BM, et al. Guidelines for the early management of patients with acute ischemic stroke: a guideline for healthcare professionals from the American Heart Association/American Stroke Association. Stroke. (2013) 44:870–947. doi: 10.1161/STR.0b013e318284056a
17. Powers WJ, Rabinstein AA, Ackerson T, Adeoye OM, Bambakidis NC, Becker K, et al. Guidelines for the early management of patients with acute ischemic stroke: 2019 update to the 2018 guidelines for the early management of acute ischemic stroke: a guideline for healthcare professionals from the American heart association/American stroke association. Stroke. (2019) 50:e344–418. doi: 10.1161/STR.0000000000000211
18. Brott T, Adams Jr HP, Olinger CP, Marler JR, Barsan WG, Biller J, et al. Measurements of acute cerebral infarction: a clinical examination scale. Stroke. (1989) 20:864–70. doi: 10.1161/01.STR.20.7.864
19. Van Swieten JC, Koudstaal PJ, Visser MC, Schouten HJ, Van Gijn J. Interobserver agreement for the assessment of handicap in stroke patients. Stroke. (1988) 19:604–7. doi: 10.1161/01.STR.19.5.604
20. Mishra NK, Ahmed N, Andersen G, Egido JA, Lindsberg PJ, Ringleb PA, et al. Thrombolysis in very elderly people: controlled comparison of SITS international stroke thrombolysis registry and virtual international stroke trials archive. BMJ. (2010) 341:c6046. doi: 10.1136/bmj.c6046
21. Song TJ Chang Y Chun MY Lee CY Kim AR Kim Y et al High dietary glycemic load is associated with poor functional outcome in patients with acute cerebral infarction. J Clin Neurol. (2018) 14:165–73. doi: 10.3988/jcn.2018.14.2.165
22. Yu S, Ma SJ, Liebeskind DS, Qiao XJ, Yan L, Saver JL, et al. Reperfusion into severely damaged brain tissue is associated with occurrence of parenchymal hemorrhage for acute ischemic stroke. Front Neurol. (2020) 11:586. doi: 10.3389/fneur.2020.00586
23. Writing Group, Mozaffarian D, Benjamin EJ, Go AS, Arnett DK, Blaha MJ, et al. Heart disease and stroke statistics-2016 update: a report from the American heart association. Circulation, (2016) 133:e38–360. doi: 10.1161/CIR.0000000000000350
24. Kernan WN, Ovbiagele B, Black HR, Bravata DM, Chimowitz MI, Ezekowitz MD, et al. Guidelines for the prevention of stroke in patients with stroke and transient ischemic attack: a guideline for healthcare professionals from the American Heart Association/American Stroke Association. Stroke. (2014). 45:2160–236. doi: 10.1161/STR.0000000000000024
25. Jo YH, Kim K, Lee JH, Kang C, Kim T, Park HM, et al. Red cell distribution width is a prognostic factor in severe sepsis and septic shock. Am J Emerg Med. (2013) 31:545–8. doi: 10.1016/j.ajem.2012.10.017
26. Matsui H, Taniguchi Y, Maru N, Utsumi T, Saito T, Hino H, et al. Prognostic effect of preoperative red cell distribution width on the survival of patients who have undergone surgery for non-small cell lung cancer. Mol Clin Oncol. (2021) 14:108. doi: 10.3892/mco.2021.2270
27. Felker GM, Allen LA, Pocock SJ, Shaw LK, McMurray JJ, Pfeffer MA, et al. Red cell distribution width as a novel prognostic marker in heart failure: data from the CHARM program and the duke databank. J Am Coll Cardiol. (2007) 50:40–7. doi: 10.1016/j.jacc.2007.02.067
28. Fan H, Liu X, Li S, Liu P, Song Y, Wang H, et al. High red blood cell distribution width levels could increase the risk of hemorrhagic transformation after intravenous thrombolysis in acute ischemic stroke patients. Aging. (2021) 13:20762–73. doi: 10.18632/aging.203465
29. He M, Wang H, Tang Y, Cui B, Xu B, Niu X, et al. Red blood cell distribution width in different time-points of peripheral thrombolysis period in acute ischemic stroke is associated with prognosis. Aging. (2022) 14:5749–67. doi: 10.18632/aging.204174
30. Ye WY, Li J, Li X, Yang XZ, Weng YY, Xiang WW, et al. Predicting the 1-year prognosis and mortality of patients with acute ischemic stroke using red blood cell distribution width before intravenous thrombolysis. Clin Interv Aging. (2020) 15:255–63. doi: 10.2147/CIA.S233701
31. Agarwal S. Red cell distribution width, inflammatory markers and cardiorespiratory fitness: results from the national health and nutrition examination survey. Indian Heart J. (2012). 64:380–7. doi: 10.1016/j.ihj.2012.06.006
32. Yesil AE, Senates IV, Bayoglu ED, Erdem R, Demirtunc, Kurdas Ovunc AO. Red cell distribution width: a novel marker of activity in inflammatory bowel disease. Gut Liver. (2011) 5:460–7. doi: 10.5009/gnl.2011.5.4.460
33. Ramírez-Moreno JM, Gonzalez-Gomez M, Ollero-Ortiz A, Roa-Montero AM, Gómez-Baquero MJ, Constantino-Silva AB. Relation between red blood cell distribution width and ischemic stroke: a case-control study. Int J Stroke. (2013) 8:E36. doi: 10.1111/ijs.12091
34. Turcato G, Cappellari M, Follador L, Dilda A, Bonora A, Zannoni M. Red blood cell distribution width is an independent predictor of outcome in patients undergoing thrombolysis for ischemic stroke. Semin Thromb Hemost. (2017) 43:30–5. doi: 10.1055/s-0036-1592165
35. Lippi G, Targher G, Montagnana M, Salvagno GL, Zoppini G, Guidi GC. Relation between red blood cell distribution width and inflammatory biomarkers in a large cohort of unselected outpatients. Arch Pathol Lab Med. (2009) 133:628–32. doi: 10.5858/133.4.628
36. Lippi G, Cervellin G, Sanchis-Gomar F. Red blood cell distribution width and cardiovascular disorders. Does it really matter which comes first, the chicken or the egg? Int J Cardiol. (2016) 206:129–30. doi: 10.1016/j.ijcard.2016.01.122
37. Vayá A, Alis R, Suescún M, Rivera L, Murado J, Romagnoli M, et al. Association of erythrocyte deformability with red blood cell distribution width in metabolic diseases and thalassemia trait. Clin Hemorheol Microcirc. (2015) 61:407–15. doi: 10.3233/CH-141859
38. Bilal A, Farooq JH, Kiani I, Assad S, Ghazanfar H, Ahmed I. Importance of mean red cell distribution width in hypertensive patients. Cureus. (2016) 8:e902. doi: 10.7759/cureus.902
39. Jia H, Li H, Zhang Y, Li C, Hu Y, Xia C. Association between red blood cell distribution width (RDW) and carotid artery atherosclerosis (CAS) in patients with primary ischemic stroke. Arch Gerontol Geriatr. (2015) 61:72–5. doi: 10.1016/j.archger.2015.04.005
40. Kaya A, Isik T, Kaya Y, Enginyurt O, Gunaydin ZY, Iscanli MD, et al. Relationship between red cell distribution width and stroke in patients with stable chronic heart failure: a propensity score matching analysis. Clin Appl Thromb Hemost. (2015) 21:160–5. doi: 10.1177/1076029613493658
41. Förhécz Z, Gombos T, Borgulya G, Pozsonyi Z, Prohászka Z, Jánoskuti L. Red cell distribution width in heart failure: prediction of clinical events and relationship with markers of ineffective erythropoiesis, inflammation, renal function, and nutritional state. Am Heart J. (2009) 158:659–66. doi: 10.1016/j.ahj.2009.07.024
42. Ani C, Ovbiagele B. Elevated red blood cell distribution width predicts mortality in persons with known stroke. J Neurol Sci. (2009) 277:103–8. doi: 10.1016/j.jns.2008.10.024
43. Pierce CN, Larson DF. Inflammatory cytokine inhibition of erythropoiesis in patients implanted with a mechanical circulatory assist device. Perfusion. (2005) 20:83–90. doi: 10.1191/0267659105pf793oa
44. Chiari MM, Bagnoli R, De Luca P, Monti M, Rampoldi E, Cunietti E. Influence of acute inflammation on iron and nutritional status indexes in older inpatients. J Am Geriatr Soc. (1995) 43:767–71. doi: 10.1111/j.1532-5415.1995.tb07047.x
45. Deswal A, Petersen NJ, Feldman AM, Young JB, White BG, Mann DL. Cytokines and cytokine receptors in advanced heart failure: an analysis of the cytokine database from the Vesnarinone trial (VEST). Circulation. (2001) 103:2055–9. doi: 10.1161/01.CIR.103.16.2055
46. Ghaffari S. Oxidative stress in the regulation of normal and neoplastic hematopoiesis. Antioxid Redox Signal. (2008) 10:1923–40. doi: 10.1089/ars.2008.2142
Keywords: acute ischemic stroke, red blood cell distribution width, recombinant tissue plasminogen activator, predictive factor, 2-year follow-up
Citation: Jiang Y, Ren C, Alimujiang A, Wu Y, Huang D and Yang W (2022) The difference in red blood cell distribution width from before to after thrombolysis as a prognostic factor in acute ischemic stroke patients: A 2-year follow-up. Front. Neurol. 13:1011946. doi: 10.3389/fneur.2022.1011946
Received: 04 August 2022; Accepted: 20 September 2022;
Published: 13 October 2022.
Edited by:
Yuping Tang, Fudan University, ChinaReviewed by:
Pingyi Xu, First Affiliated Hospital of Guangzhou Medical University, ChinaYouyong Tian, Nanjing Medical University, China
Copyright © 2022 Jiang, Ren, Alimujiang, Wu, Huang and Yang. This is an open-access article distributed under the terms of the Creative Commons Attribution License (CC BY). The use, distribution or reproduction in other forums is permitted, provided the original author(s) and the copyright owner(s) are credited and that the original publication in this journal is cited, in accordance with accepted academic practice. No use, distribution or reproduction is permitted which does not comply with these terms.
*Correspondence: Yuncheng Wu, eXVuY2h3QG1lZG1haWwuY29tLmNu; Dongya Huang, ZG9uZ3lhaHVhbmc3N0Bob3RtYWlsLmNvbQ==; Weiting Yang, ZHJ5YW5nd3RAMTI2LmNvbQ==
†These authors have contributed equally to this work