 Lichun Liu1†
 Yuelian Jiang
95% of researchers rate our articles as excellent or good
Learn more about the work of our research integrity team to safeguard the quality of each article we publish.
Find out more
ORIGINAL RESEARCH article
Front. Neurol. , 14 February 2022
Sec. Pediatric Neurology
Volume 12 - 2021 | https://doi.org/10.3389/fneur.2021.816393
This article is part of the Research Topic Insights in Pediatric Neurology: 2021 View all 20 articles
Background: Friedreich's ataxia (FRDA) is a familial hereditary disorder that lacks available therapy. Therefore, the identification of novel biomarkers and key mechanisms related to FRDA progression is urgently required.
Methods: We identified the up-regulated and down-regulated differentially expressed genes (DEGs) in children and adult FRDA from the GSE11204 dataset and intersected them to determine the co-expressed DEGs (co-DEGs). Enrichment analysis was conducted and a protein-protein interaction (PPI) network was constructed to identify key pathways and hub genes. The potential diagnostic biomarkers were validated using the GSE30933 dataset. Cytoscape was applied to construct interaction and competitive endogenous RNA (ceRNA) networks.
Results: Gene Set Enrichment Analysis (GSEA) indicated that the genes in both the child and adult samples were primarily enriched in their immune-related functions. We identified 88 co-DEGs between child and adult FRDA samples. Gene Ontology (GO), Kyoto Encyclopedia of Genes and Genomes (KEGG), and Reactome enrichment analysis suggested that these co-DEGs were primarily enriched in immune response, inflammatory reaction, and necroptosis. Immune infiltration analysis showed remarkable differences in the proportions of immune cell subtype between FRDA and healthy samples. In addition, ten core genes and one gene cluster module were screened out based on the PPI network. We verified eight immune-specific core genes using a validation dataset and found CD28, FAS, and ITIF5 have high diagnostic significance in FRDA. Finally, NEAT1-hsa-miR-24-3p-CD28 was identified as a key regulatory pathway of child and adult FRDA.
Conclusions: Downregulation of three immune-specific hub genes, CD28, FAS, and IFIT5, may be associated with the progression of child and adult FRDA. Furthermore, NEAT1-hsa-miR-24-3p-CD28 may be the potential RNA regulatory pathway related to the pathogenesis of child and adult FRDA.
Friedreich's ataxia (FRDA) is a familial hereditary disorder involving the spinal cord and cerebellum, which is mainly caused by repeat amplification of homozygous guanine–adenine–adenine (GAA) triplet located in the frataxin gene (1). Such repeat amplification and mutation eventually lead to a decrease in the expression level of functional Frataxin. Frataxin deficiency can promote the activation of oxidative stress and ferroptosis, resulting in mitochondrial dysregulation (2, 3). Children often manifest with initial symptoms including disturbance of balance and progressive ataxia. With the progress of disease and age, patients may gradually develop dysarthria and loss of tendon reflex, and in many patients this is accompanied by myocardial injury and diabetes (4). At present, no effective therapies have been proven to prevent FRDA progression, most of which are symptomatic treatment (5). Therefore, further elucidating the underlying pathogenesis and developing more valid treatment strategies is an urgent demand. Presently, some serum biomarkers have been reported as potential key signatures in the pathogenesis of FRDA. For example, the levels of neurofilament light chain and heavy chain are enhanced significantly in Friedreich's ataxia patients and decrease with age (6, 7). In addition, serum hsTnT, NT-proBNP, and miRNAs have also been demonstrated to be associated with the progression of cardiomyopathy in adult FRDA (8, 9). However, the effectiveness of these biomarkers has either not been validated in prospective cohorts, or the clinical correlation between them is barely understood. Moreover, these biomarkers have not yet been used in clinical diagnosis of FRDA. Therefore, identifying additional biomarkers may provide critical insights into the diagnosis and treatment of FRDA.
Currently, bioinformatics analysis has been extensively applied in a variety of diseases, including cancer, cardiac disease, and neurodegenerative disease, to identify key biomarkers closely related to the prognosis of the disease (10–12). Additionally, competitive endogenous RNA (ceRNA) networks will help to clarify the novel mechanism of transcriptional regulatory networks in advancing disease progression (13). Although recent studies have concentrated on FRDA-induced transcriptome changes, only a few studies have explored the association between differentially expressed genes (DEGs) in children and adult FRDA.
In this study, we identified co-expressed differentially expressed genes (co-DEGs) by intersecting the up-regulated and down-regulated DEGs in child and adult FRDA samples (GSE11204). Next, we performed various enrichment analysis and constructed a PPI network to ascertain the key pathways and hub genes related to the progression of FRDA in children and adults. In addition, we predicted target miRNAs of hub genes and validated the diagnostic significance of selected hub genes using the GSE30933 dataset, Finally, we constructed FRDA-related ceRNA networks based on mRNAs-miRNAs-long noncoding RNAs (lncRNAs) interactions. Our study provides a novel perspective for revealing the pathophysiological mechanism of FRDA progression at the transcriptome level and investigates potential targets for the diagnosis and treatment of FRDA in children and adults.
All microarray datasets were downloaded from Gene Expression Omnibus (GEO) (www.ncbi.nlm.nih.gov/geo/) (14). GSE11204 dataset (GPL887 platform) (15), including whole gene expression profiles of peripheral blood from 10 healthy children, 28 children with FRDA, 15 healthy adults, and 14 adults with FRDA, were selected as the test set. The GSE30933 dataset (GPL6255 platform) (16), which included whole gene expression profiles of peripheral blood from 40 healthy and 34 FRDA samples, was selected as the validation set.
The whole gene expression profiles obtained from the GEO database have been pre-processed and normalized by the robust multi-array average (RMA) method according to the “affy” package (http://www.bioconductor.org/packages/release/bioc/html/affy.html) (version 1.70.0) of R software. The “limma” package (http://www.bioconductor.org/packages/release/bioc/html/limma.html) (version 3.48.1) was performed to analyze the differentially expressed genes (DEGs). Original p-values were adjusted by the Benjamini-Hochberg method, and the fold-changes (FC) were calculated based on the false detection rate (FDR) procedure. Genes expression values of |log2 FC| > 1 and p < 0.05 were considered to be statistically significant. In order to visualize the identified DEGs, the R packages of “ggpubr” and “pheatmap” were conducted to make the volcano plots and heatmaps, respectively. The online tool Draw Venn Diagram (http://bioinformatics.psb.ugent.be/webtools/Venn/) was conducted to generate Venn diagrams of co-DEGs.
To identify the distribution trend of overall genes between the FRDA and the control groups, the “clusterProfiler” (http://www.bioconductor.org/packages/release/bioc/html/clusterProfiler.html) (version 4.0.2) and “msigdbr” (https://cran.r-project.org/web/packages/msigdbr/index.html) (version 7.4.1) packages were conducted to make Gene Set Enrichment Analysis (GSEA) enrichment analysis. In brief, the gene symbols with corresponding FC were imported, and the c5: GO:BP gene sets (c5.go.bp.v7.4.symbols) were then applied for functional enrichment analysis. Gene sets with p < 0.05, Q <0.25, and | normalized enrichment score (NES)| > 1.5 were defined as significantly enriched gene sets.
Next, Gene Ontology (GO) enrichment analysis of co-DEGs was carried out based on the Database for Annotation, Visualization and Integrated Discovery (DAVID) (https://david.ncifcrf.gov/summary.jsp) (17). The biological process (BP), cell composition (CC), and molecular function (MF) of co-DEGs were then identified. Enriched GO terms (BP) with FDR <0.05 were defined as significant and visualized using the “GOplot” package (https://wencke.github.io/) (version 1.0.2).
In addition, Kyoto Encyclopedia of Genes and Genomes (KEGG) and Reactome enrichment analysis of co-DEGs were conducted with the “clusterProfile” package (18). A value of adjusted p < 0.05 was considered as significantly enriched functions and pathways. The top 5 KEGG and Reactome enrichment pathways were exhibited in a bubble plot.
The PPI network of co-DEGs was established using the online database STRING (https://string-db.org/) based on the Screening criteria: combined score > 0.4 (19). Afterward, the protein-protein interaction information was imported into the Cytoscape software (3.8.2) to realize the visualization of the PPI network. Then, the Minimal Common Oncology Data Elements (MCODE) plugin was applied for identifying key gene clusters with the default parameters. CytoHubba plugin was carried out to screen out hub genes based on the PPI network (20). The first 20 hub genes were calculated using the five algorithms: Degree, Stress, Maximum Neighborhood Component (MNC), Closeness, and Radiality (21, 22). Finally, a total of 10 hub genes were screened out by intersecting all the results.
Gene-miRNA interactions were identified using the online database miRWalk 3.0 (http://mirwalk.umm.uni-heidelberg.de/) (23). The target miRNAs of selected genes were predicted using the miRWalk and miRDB databases with the default parameters (p < 0.05, seed sequence lengths more than 7 mer, the target gene-binding regions: 3′ UTR). The miRNAs were selected by intersecting all the results. Finally, mRNA-miRNA interaction network was constructed and visualized using Cytoscape software.
All the predicted target miRNAs were uploaded to the Funrich software (3.1.2), the molecular functions and biological pathways of target miRNAs were then identified. p < 0.05 was defined as markedly enriched functions and pathways.
The target lncRNAs interacting with the selected miRNAs were predicted using the online database StarBase 3.0 (24). We selected the lncRNAs with most of the cross-linked miRNAs as our predicted lncRNAs according to the following screening criteria: mammalian, human h19 genome, CLIP-Data more than 5, and with or without degradome data. CeRNA networks based on the mRNAs-miRNAs-lncRNAs interactions were constructed and visualized using Cytoscape software.
CIBERSORT is an analytic algorithm based on the gene expression profiles of 547 genes. The CIBERSORT could calculate the compositions of different immune cell subtypes using the deconvolution precisely on the algorithm, thus exhibiting the signature of each immune cell subtype (25). The gene expression profiles of all genes or co-DEGs including Control and FRDA samples were imported to perform the immune infiltration analysis using the CIBERSORT algorithm through R software. Student's T-tests were conducted to analyze the difference in the proportion of each immune cell subtype between Control and FRDA samples. A value of p < 0.05 was considered statistically significant. Finally, the “ggplot” (https://cran.r-project.org/src/contrib/Archive/ggplot/) (version 0.4.2) and “ggplot2” (http://had.co.nz/ggplot2/) (version 3.3.5) packages were performed to visualize the results.
The “ggpubr” package (https://cran.r-project.org/web/packages/ggpubr/index.html) version 0.4.0) was applied to perform statistical analyses, the “ggplot2” and “ggplot” packages were conducted to draw boxplots and bar plots, respectively. The “GOplot” package was used to draw a chord plot. Student's t-test was performed to analyze the differences between the two groups.
The dataset GSE11204, which included 10 healthy children, 28 children with FRDA, 15 healthy adults, and 14 adults with FRDA, were selected to analyze and identify the DEGs. We screened out a total of 530 (177 up-regulated and 353 down-regulated) DEGs in child samples and a total of 857 (483 up-regulated and 374 down-regulated) DEGs in adult samples. The volcano plots exhibited the number of DEGs identified from child and adult samples, respectively. The heatmaps displayed the expression of the top 25 up-regulated and down-regulated DEGs in child and adult samples, respectively (Figures 1A–D). The expression levels of all DEGs in child and adult samples were also visualized in heatmaps (Supplementary Figures 1A,B).
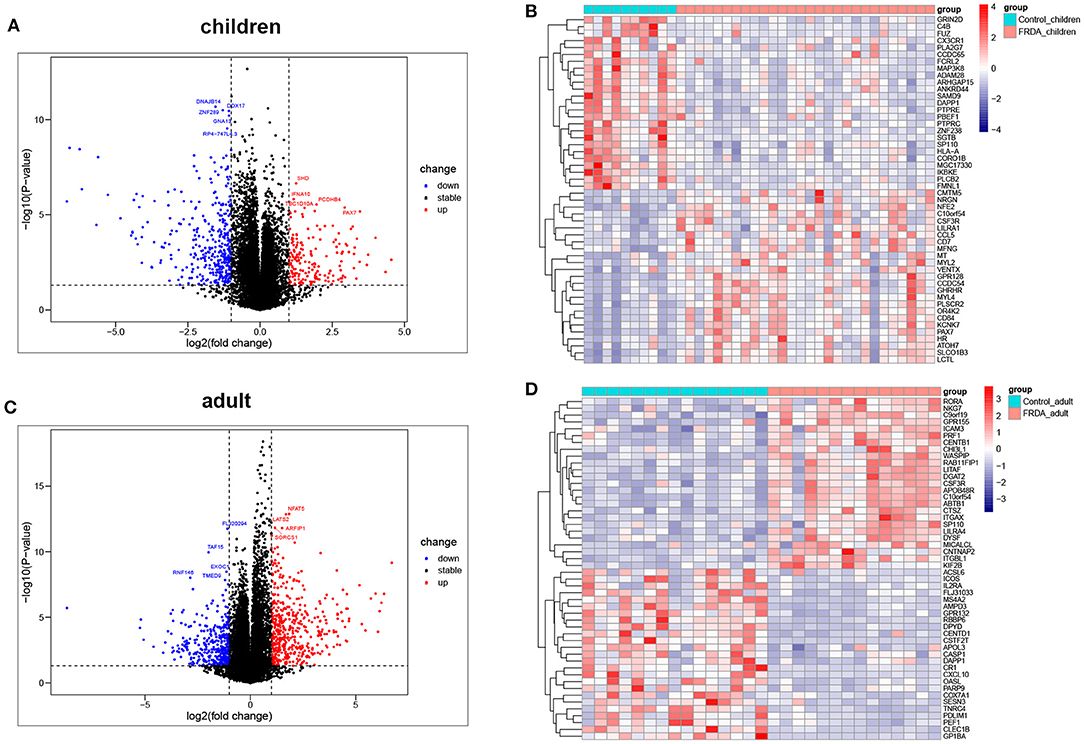
Figure 1. Identification of DEGs between Control and FRDA samples. (A) The volcano plot of the genes in children samples. (B) Representative heatmap of DEGs in children samples. The top 25 up-regulated and down-regulated DEGs are shown, respectively. (C) The volcano plot of the genes in adult samples. (D) Representative heatmap of DEGs in adult samples. The top 25 up-regulated and down-regulated DEGs are exhibited, respectively. Red points: up-regulated DEGs, blue points: down-regulated DEGs, gray points: no changed genes; Red rectangles: high expression, blue rectangles: low expression.
In order to clarify the biological process and the immune cell subtype involved in the child and adult samples, respectively, we firstly performed the GSEA and found the genes in children were significantly enriched in antigen-receptor mediated signaling pathway, defense response to virus, NF-κB signaling, regulation of immune response signaling pathways, and T cell receptor signaling pathways (Figure 2A). In adults, the enriched gene sets were mainly involved in defense response to virus, regulation of T cell differentiation, response to interferon-gamma, response to virus, and viral gene expression (Figure 2B). Subsequently, we applied immune infiltration analysis and found the proportions of immune cell subtype distinct between groups (Figures 2C,D). Compared with the Control_children group, the FRDA_children group contained a greater number of resting memory CD4+ T cells and Neutrophils (Figure 2E). In addition, the FRDA_adult group markedly elevated the number of CD8+ T cells and activated NK cells, whereas the number of memory B cells, resting memory CD4+ T cells, activated memory CD4+ T cells, M1 Macrophages, resting Dendritic cells, activated Dendritic cells, and resting Mast cells decreased when compared with the Control_adult group (Figure 2F).
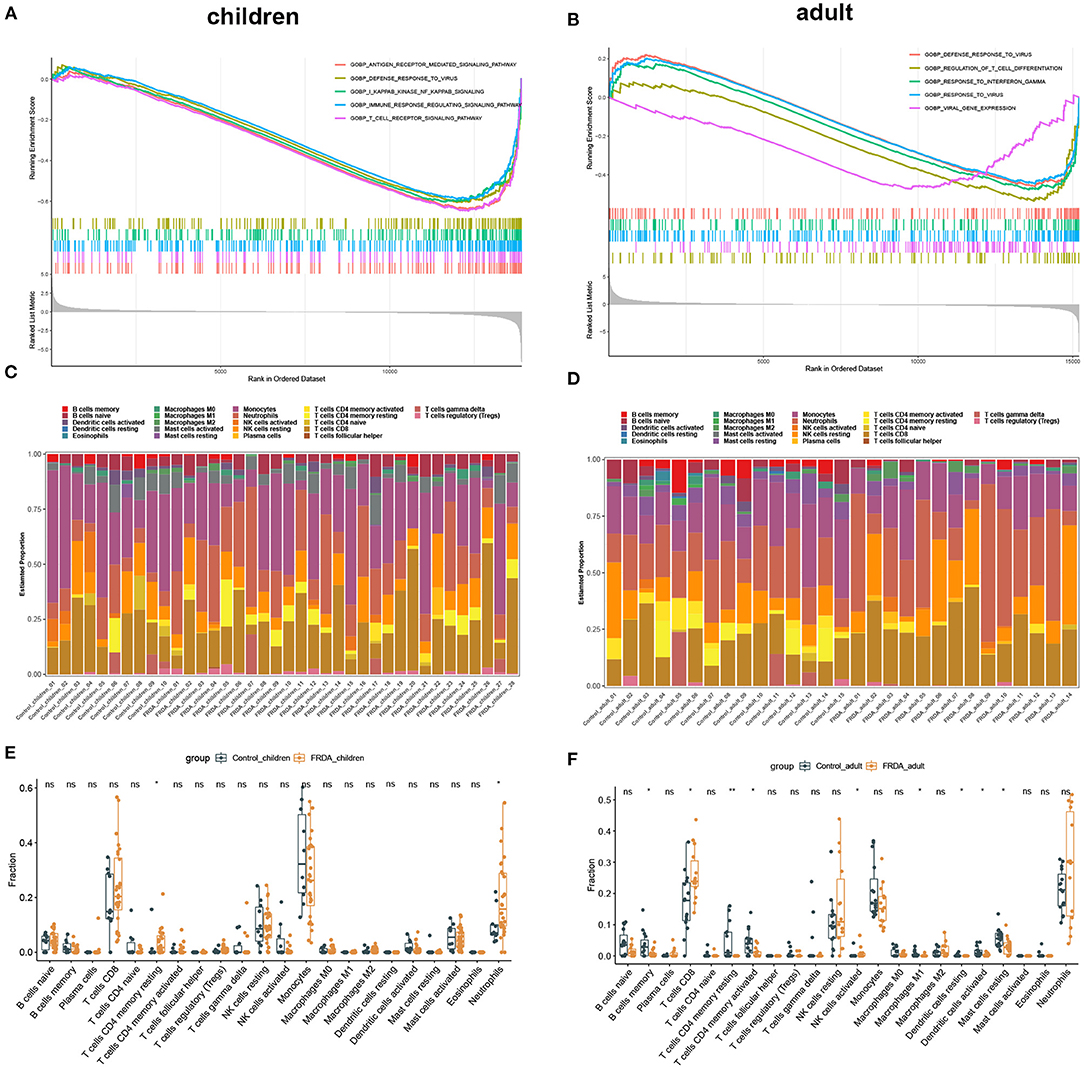
Figure 2. GSEA and Immune infiltration analysis in children and adult samples. (A,B) GSEA between Control and FRDA group in children (A) and adult (B). The top 5 gene sets were exhibited. (C,D) The landscape of all 22 types of immune cell components in children (C) and adults (D). (E,F) Boxplots of the differentially infiltrated immune cells between Control and FRDA group in children (E) and adult (F). *p < 0.05, **p < 0.01 when compared with the Control group.
The DEGs from the child and adult datasets were intersected and eventually identified 29 co-up-regulated and 59 co-down-regulated DEGs (Figures 3A,B). Therefore, we screened out a total of 88 co-DEGs. To further explore the enrichment pathways involved in these co-DEGs, we firstly performed GO enrichment analysis using the DAVID website. These co-DEGs were primarily involved in the biological processes including the immune effector process, defense response to virus, immune system process, defense response to other organisms, and hemopoiesis (Table 1 and Figures 3C,D). In addition, KEGG pathway enrichment analysis suggested that these co-DEGs were mainly involved in the intestinal immune network for IgA production, autoimmune thyroid disease, measles, lysosome, necroptosis, and influenza A (Figure 3E). Reactome enrichment analysis indicated that these co-DEGs were primarily enriched in the immune system, inflammatory reaction, necrosis, and signal transduction (Figure 3F).

Figure 3. The intersections of DEGs between groups and functional enrichment analysis of co-DEGs. (A,B) Venn diagram of common up-regulated and down-regulated DEGs between children (A) and adults (B). (C) Top 6 GO terms (BP) of the 88 co-DEGs with the DAVID analysis. (D) Representative chord plot of the top 6 GO terms (BP) of co-DEGs. (E,F) Representative bubble plot of the top 5 enriched KEGG (E) and Reactome (F) pathways of co-DEGs.
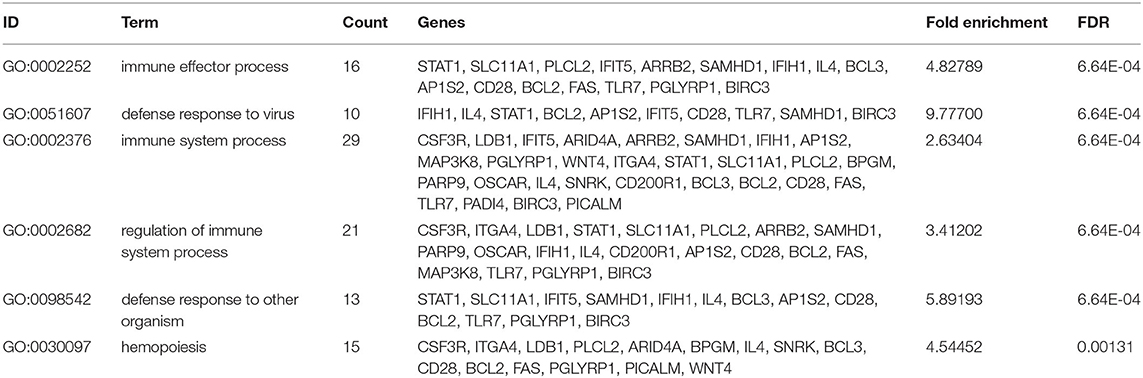
Table 1. Top 6 GO terms (BP) of the 88 co-DEGs with the DAVID analysis.
Next, we perform the immune infiltration analysis of co-DEGs in child and adult datasets, respectively. The obvious proportions of immune cell subtypes were exhibited in different groups (Figures 4A,B). The number of Plasma cells, M0 Macrophages, and Neutrophils were significantly increased, while the number of resting memory CD4+ T cells, activated memory CD4+ T cells, Monocytes, M1 Macrophages, and M2 Macrophages were remarkably attenuated in the FRDA _children group (Figure 4C). Additionally, the FRDA _adult group notably elevated the number of naïve B cells, Plasma cells, M0 Macrophages, and Neutrophils, whereas markedly decreased the number of naïve T cells CD4, M1 Macrophages, M2 Macrophages, and resting Mast cells when compared with the Control_adult group (Figure 4D).
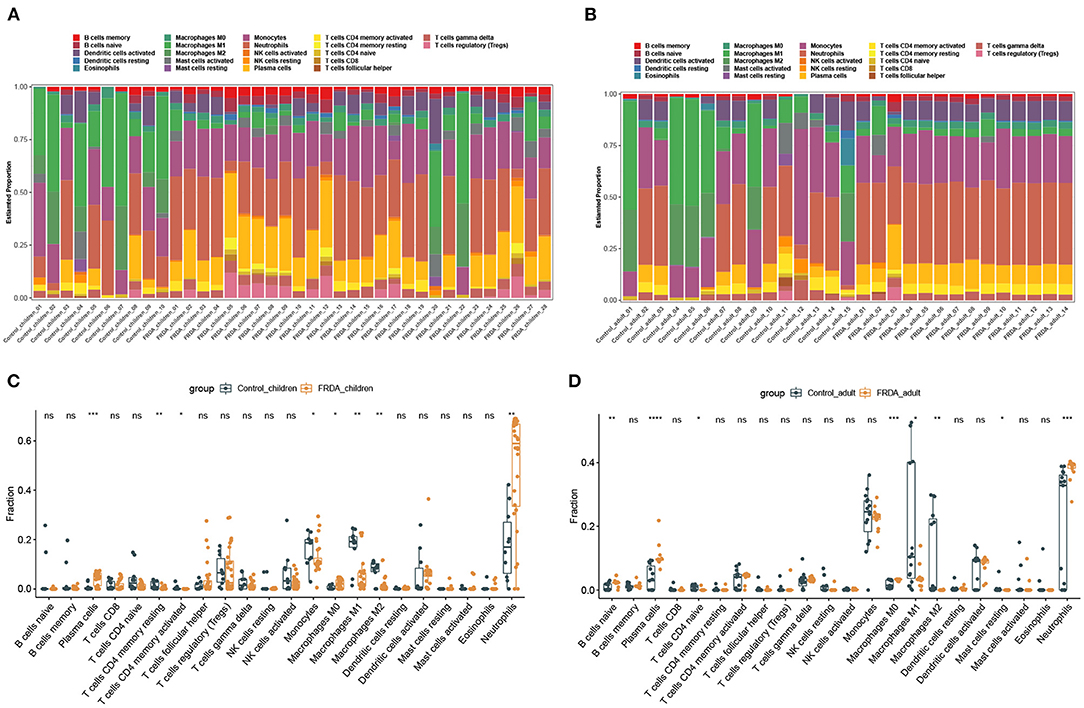
Figure 4. Immune infiltration analysis of co-DEGs in children and adult samples. (A,B) The landscape of all 22 types of immune cell components in children (A) and adults (B). (C,D) Boxplots of the differentially infiltrated immune cells between the Control and FRDA group in children (C) and adults (D). *p < 0.05, **p < 0.01, ***p < 0.001, ****p < 0.0001 when compared with the Control group.
The PPI network of co-DEGs, including 45 nodes and 56 edges, was constructed using the STRING website and visualized by Cytoscape software (Figure 5A). Next, we screened out a cluster module containing 6 down-regulated genes using the MCODE plugin (Figure 5B). Subsequently, a total of 10 hub genes were identified by intersecting the results of five algorithms from the cytoHubba plugin (Degree, MNC, Closeness, Stress, and Radiality) (Figure 5C). These identified hub genes were all significantly down-regulated in FRDA samples and were primarily enriched in the immune system process and response to other organisms (Table 2). These results evidence the major role of the declined expression of these hub genes in the pathogenesis of FRDA.
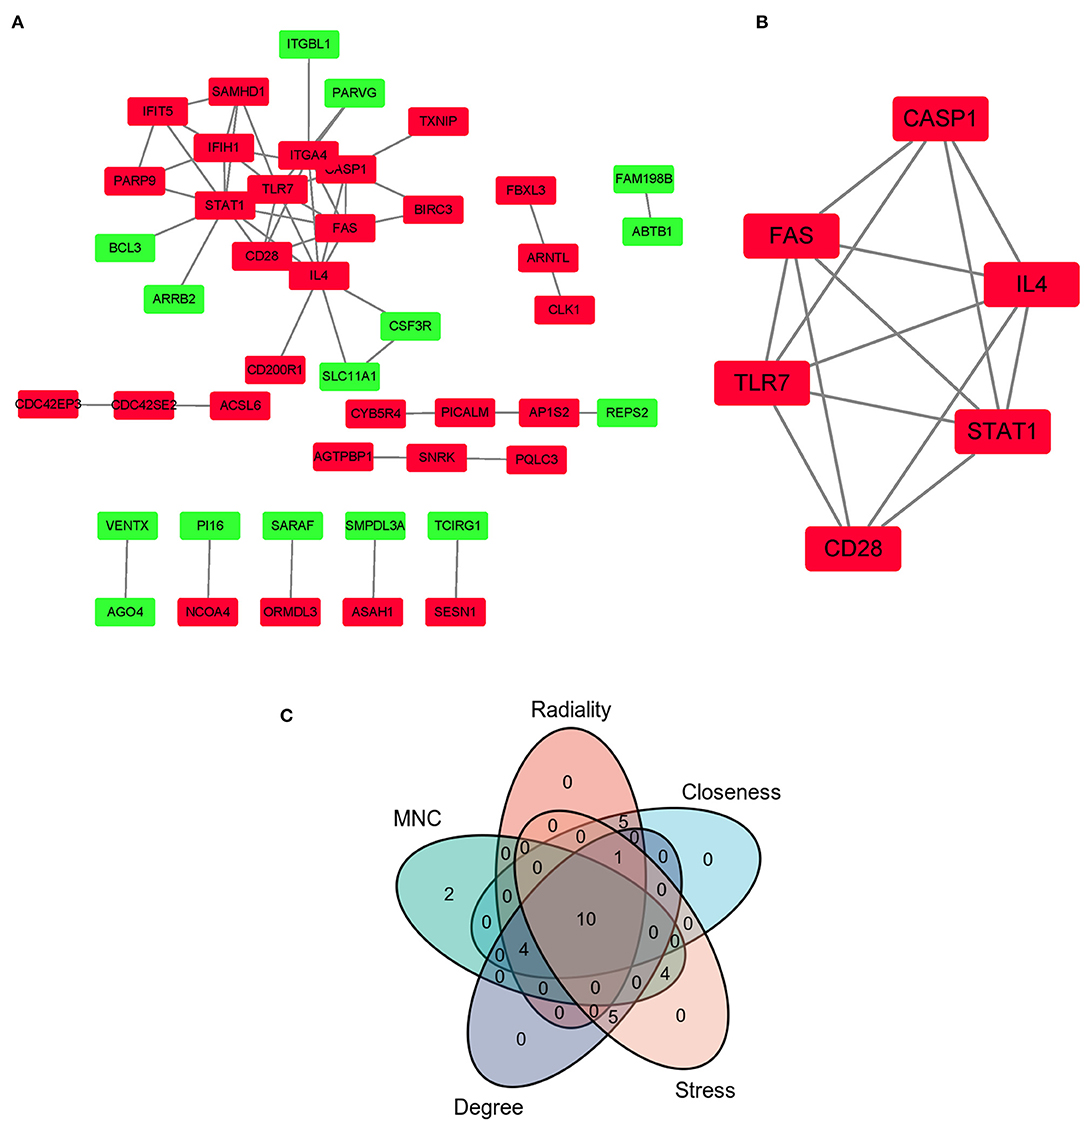
Figure 5. PPI network of co-DEGs and hub gene selection. (A) PPI network of co-DEGs was comprised of 45 nodes and 56 edges. Red rectangles: down-regulated genes; Green rectangles: up-regulated genes. (B) The key cluster module identified was by the MCODE plugin. (C) Hub genes were screened out by intersecting the first 20 genes in the five algorithms of cytoHubba.
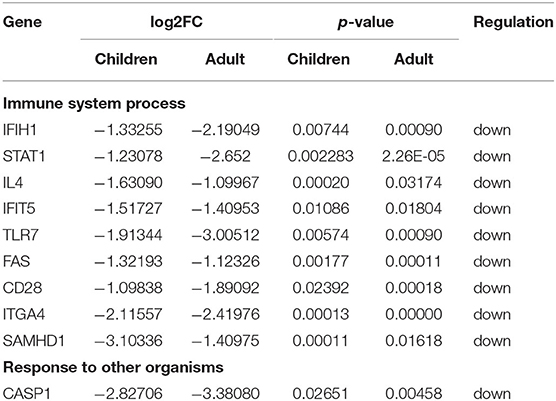
Table 2. A total of 10 hub genes were identified by intersecting the results of five algorithms from the cytoHubba plugin.
miRNAs play a vital role in inducing gene degradation by binding the 3'UTR of mRNAs, thus exerting a negative regulation mechanism. We obtained a total of 150 target miRNAs of 8 identified hub genes and ascertained 156 mRNA-miRNA pairs. In addition, based on the prediction results, a mRNA-miRNA interaction network with 158 nodes and 156 edges was constructed and visualized by the Cytoscape software (Figure 6). The miRNAs with a greater number of cross-linked genes (≥2) were identified (Table 3).
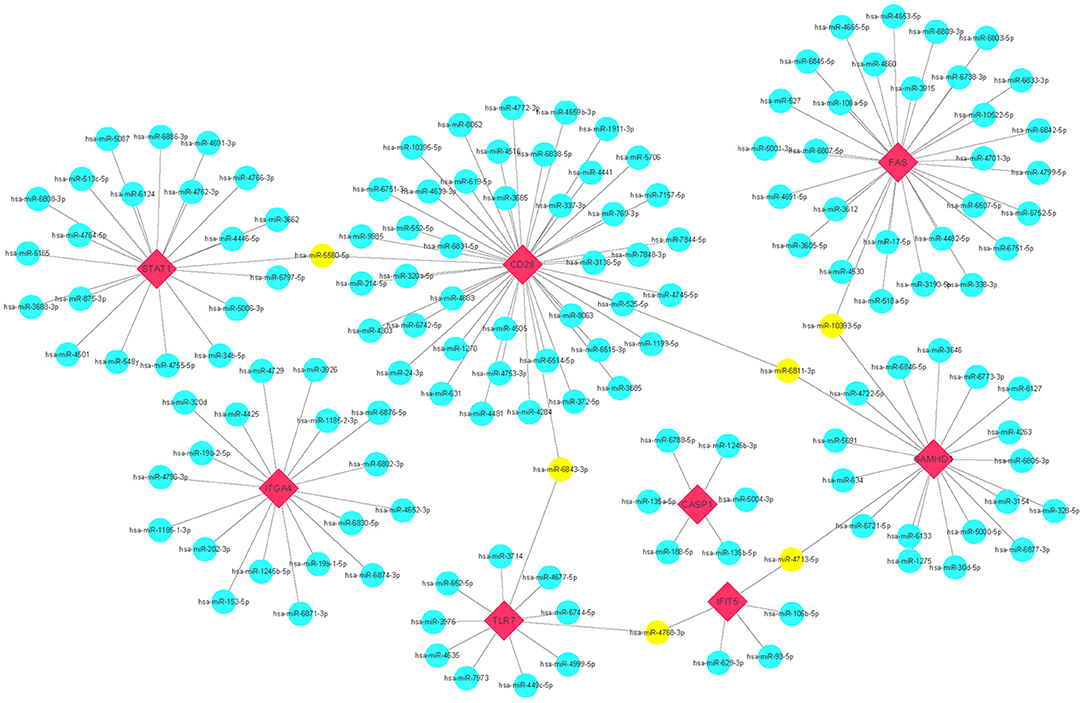
Figure 6. Predicted interactions among 8 hub genes and their target miRNAs. mRNA-miRNA co-expressed network was comprised of 158 nodes and 156 edges. Red diamonds: hub genes; Cyan circles: miRNAs; Yellow circles: miRNAs with more than 2 cross-linked genes.
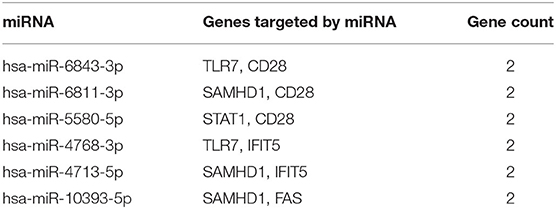
Table 3. Predicted miRNAs and genes targeted by miRNAs.
In addition, the results of miRNAs functional analysis indicated that the molecular functions were markedly enriched in protein serine/threonine kinase activity, transcription factor activity, GTPase activity, ubiquitin-specific protease activity, receptor binding, and receptor signaling protein serine/threonine kinase activity. The main biological pathways involved were glypican pathway, syndecan-1-mediated signaling, proteoglycan syndecan-mediated signaling, IFN-gamma pathway, ErbB receptor signaling, and c-Met-mediated signaling (Figures 7A,B).
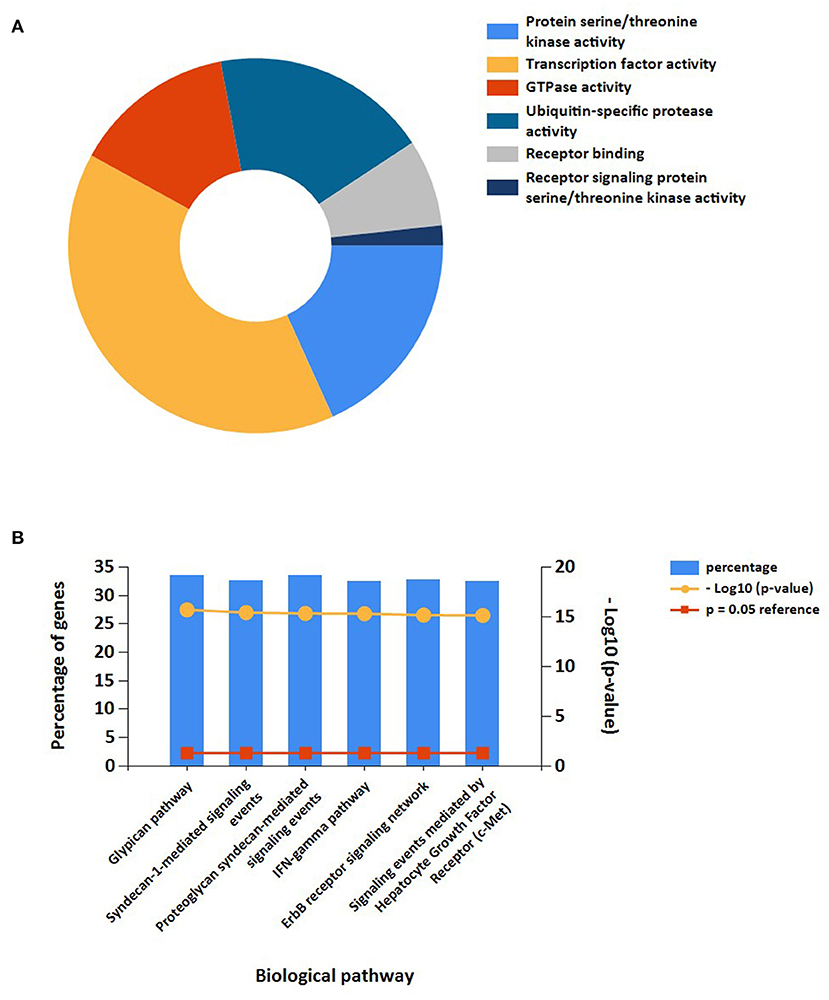
Figure 7. Functional enrichment analysis of target miRNAs. (A) Representative Pie chart of molecular functions of target miRNAs. (B) Representative Bar chart of Biological pathways of target miRNAs.
The GSE30933 dataset, which included 40 healthy and 68 FRDA samples, was applied for validating the expression of 8 hub genes that interacted with target miRNAs. We found the mRNA expression of CD28, FAS, and IFIT5 were significantly attenuated in the FRDA group when compared with the Control group (Figure 8). Next, we performed SPSS software to analyze the expression profiles of 8 hub genes in healthy and FRDA samples and draw the ROC curves. CD28 (AUC = 0.818), FAS (AUC = 0.659), and IFIT5 (AUC = 0.701) genes all had the ability to differentiate FRDA from normal samples, and CD28 had the highest diagnostic value in FRDA samples (Figures 9A–H). Therefore, combined with the expression levels of these hub genes in the GSE30933 dataset, we assume that the downregulation of CD28, FAS, and IFIT5 might be potential diagnostic biomarkers for FRDA progression.
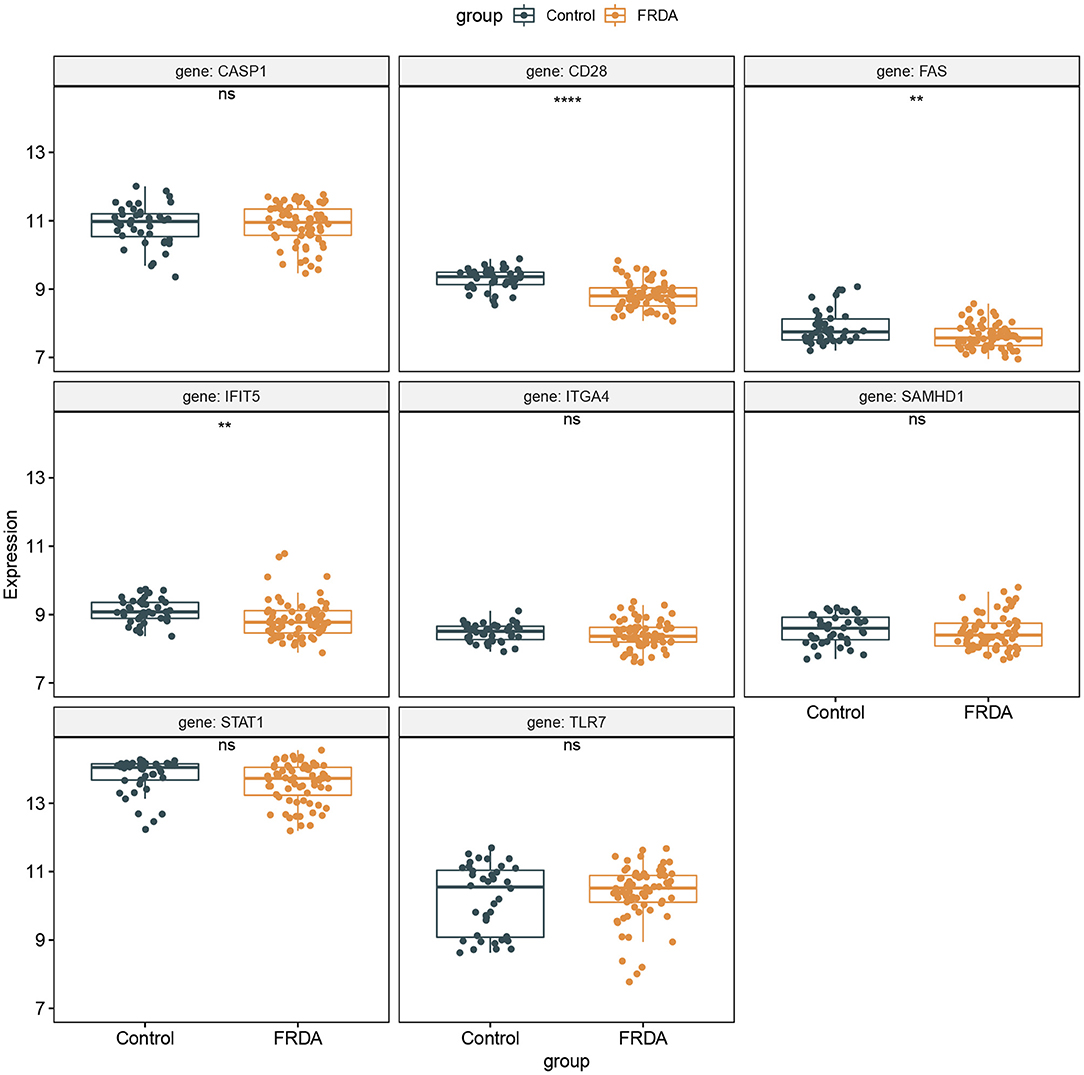
Figure 8. Validation of the 8 specifically expressed core genes using the GSE30933 dataset. **p < 0.01, ****p < 0.0001 when compared with the Control group.
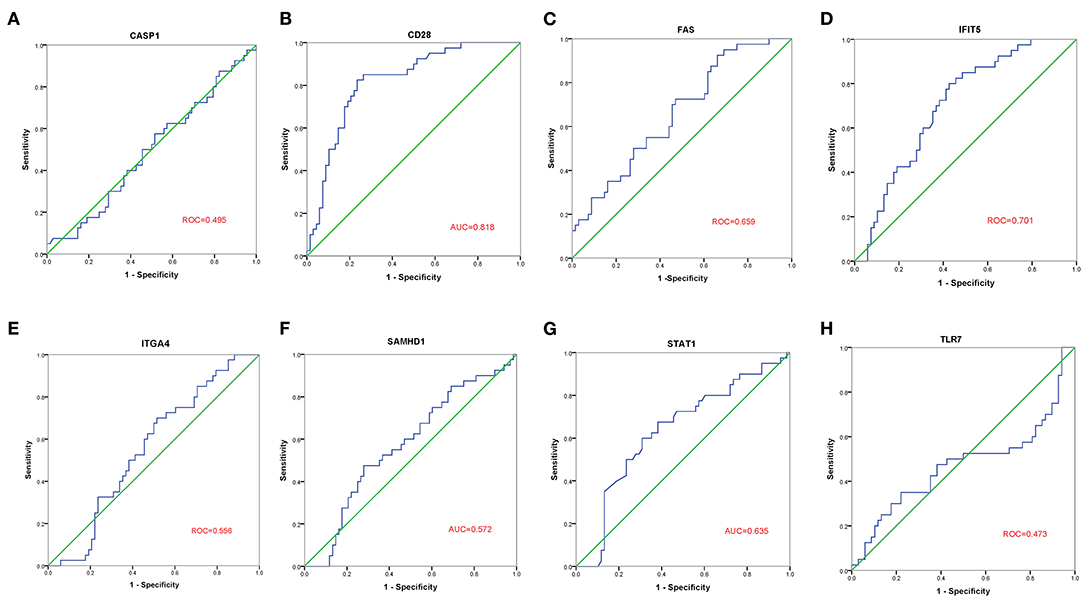
Figure 9. ROC curve analysis of the 8 specifically expressed core genes using the GSE30933 dataset. (A–H) ROC curve analysis of the 8 specifically expressed core genes.
As the upstream molecules of miRNAs, lncRNAs could regulate the biological function of miRNAs. Therefore, we predicted the target lncRNAs of the miRNAs interacting with CD28, FAS, and IFIT5 genes. A total of 5 target lncRNAs were obtained in the CD28-miRNA interaction network, 3 and 12 target lncRNAs were identified in FAS-miRNA and IFIT5-miRNA interaction networks, respectively. Three ceRNA networks were established and visualized by Cytoscape software (Figures 10A–C). Subsequently, we performed a literature search and only found miR-24-3p had been reported in FRDA. Therefore, we proposed that NEAT1-hsa-miR-24-3p-CD28 may be the potential RNA regulatory pathway involved in the progression of child and adult FRDA (Figure 10D).
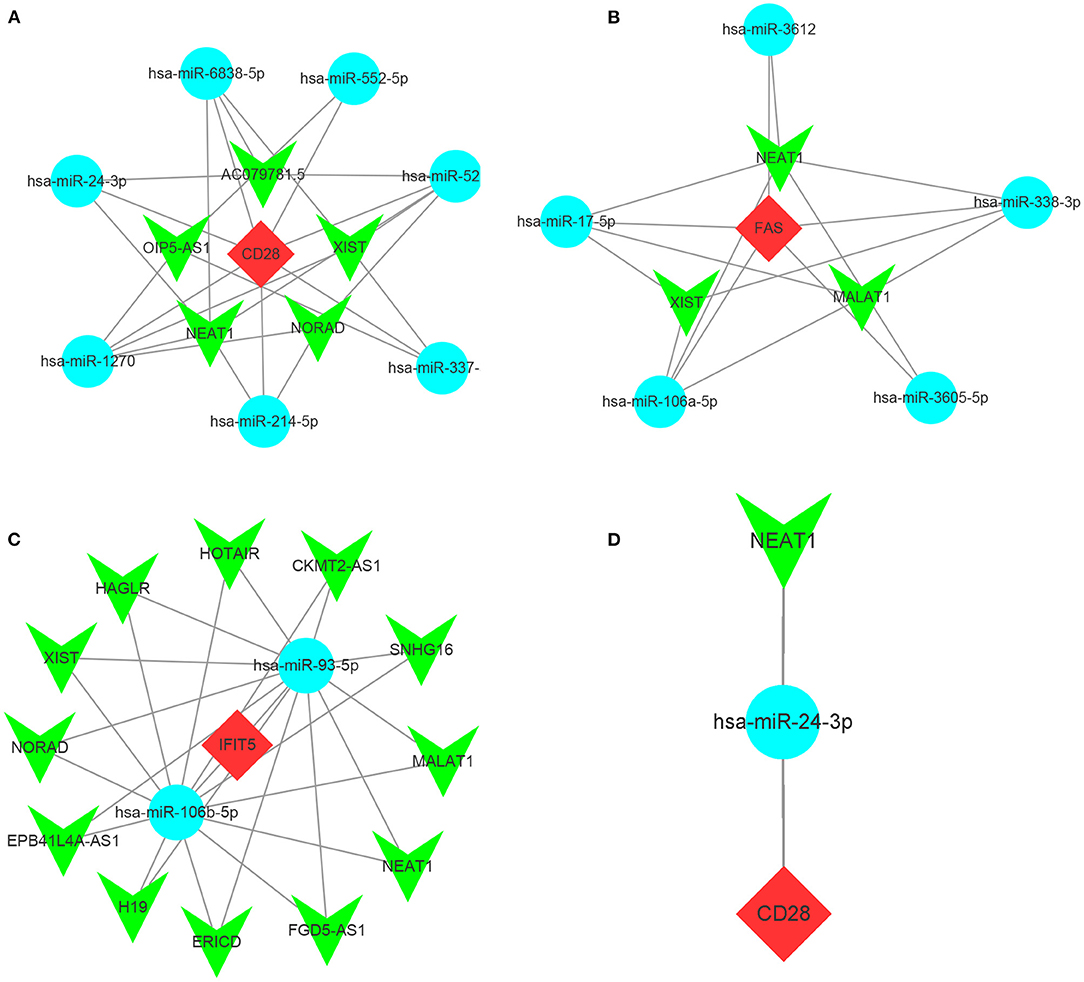
Figure 10. Construction of ceRNA networks and the identification of potential RNA regulatory pathways (a-c) Construction of ceRNA network of CD25 (A), FAS (B), and IFIT5 (C). (D) NEAT1-hsa-miR-24-3p-CD28 RNA regulatory pathway. Red diamonds: hub genes; Cyan circles: miRNAs; Green V: lncRNAs.
FRDA is an autosomal recessive genetic disease with multiple system damage. In recent years, bioinformatics analysis has been widely developed and applied in various diseases, which reveals the underlying pathogenesis of disease and identifies vital biomarkers related to the diagnosis and prognosis of the disease (26). Nevertheless, the comprehensive research on the relationship between child and adult FRDA based on bioinformatics has not been systematically reported so far.
In this study, we screened out 530 DEGs in child samples, including 177 up-regulated and 353 down-regulated genes, and 857 DEGs in adult samples, including 483 up-regulated and 374 down-regulated genes. Eventually, 88 co-DEGs were identified by intersecting the up-regulated and down-regulated DEGs between the child and adult datasets. The results of GSEA and immune infiltration analysis indicated that these genes in both the child and adult datasets were mainly enriched in the immune response. GO and KEGG pathway enrichment analysis of co-DEGs suggested that the immune response characterized by the activation of immune cells and regulation of innate immune response were significantly stronger in FRDA samples. In addition, Reactome analysis revealed that immune system activation, necrosis, and signal transduction were closely related to the progression of child and adult FRDA.
Dysfunction of the immune system function is vital for the prognosis of diseases, including FRDA. Recently, Nachun et al. demonstrate that there are significant differences in the proportion of natural killer (NK) cells among control, carrier, and FRDA groups through bioinformatics analysis, and they are found significantly decreased in FRDA patients (27). In addition, IL-6, a cytokine produced by macrophages, has been proven to be increased in the blood plasma of FRDA patients, which suggests the activation of macrophages may be implicated in the neuropathology of FRDA (28). The current study, however, found a significant decrease in the number of macrophages and a remarkable increase in the number of activated NK cells in the FRDA_adult group; no statistical significance was found in the number of natural killer cells and macrophages between the FRDA_children and Control_children group. The following facts may have led to this discrepancy: Firstly, different datasets used for analysis create batch effects, thus may result in distinct results. Secondly, subjects from different regions or with different ethnicities may also have a certain impact on the results. Thirdly, in our current study, we have classified FRDA into adult and child groups and explored the association between FRDA and immune cell types in adults and children, which may also be another factor for the inconsistent results. Moreover, in our study, we performed the CIBERSORT algorithm instead of the quadratic programming method for immune infiltration analysis, which suggests that the impact of distinct analysis methods on the results could also not be ignored.
In order to further narrow the scope of research, we constructed the PPI network of co-DEGs, and screened out a total of 10 hub genes by intersecting the results of five algorithms in the CytoHubba plugin. These genes were mainly involved in the immune system process and response to other organisms. Afterward, we selected eight hub genes that interact with target miRNA and verified these hub genes using the GSE30933 dataset. We found the expression of three immune-related genes (CD28, FAS, and IFIT5) in FRDA samples were significantly lower than that in the Control group. The ROC analysis revealed these genes had greater diagnostic significance for FRDA. Therefore, we hypothesize that the downregulation of CD28, FAS, and IFIT5 may be the potential mechanisms involved in the progression of FRDA.
CD28, a member of cell surface glycoprotein receptor, primarily expressed on CD4+ T cells and CD8+ T cells, belongs to costimulatory molecules superfamily and plays a vital role in immune system response including T cell proliferation and differentiation, the production of cytokine and chemokines (28, 29). However, CD28 has not been mentioned in FRDA-related studies. In our current study, we found CD28 was remarkably down-regulated in both child and adult FRDA. In addition, the results of GSEA indicated that the T cell receptor signaling pathway was negatively correlated with child FRDA, and the ability of T cell differentiation was markedly inhibited in adult FRDA. These results revealed the insult of FRDA to the T cells-related immune process to some extent. Therefore, we conclude the downregulation of CD28 might play a critical role in the progression of children and adult FRDA.
FAS (also known as CD95 and TNFRSF6), a death receptor, belongs to the tumor necrosis factor (TNF) receptor superfamily and is mainly involved in the regulation of caspase-8-dependent apoptosis by interacting with its ligand FasL (30). Several studies have found the expression of FAS in plasma, gray matter, and white matter is significantly enhanced in Alzheimer's disease (AD) patients (31–33). This indicates that FAS might be markedly related to the progression of AD. However, recent studies also demonstrate that FAS engagement evokes non-apoptotic signals including cell migration and differentiation and cytokine processing (34, 35). Consistently, our study found plasma FAS decreased in both child and adult FRDA samples. Combined with the result of ROC analysis, we considered FAS as a potent protective factor for FRDA, and the downregulation of FAS may be closely related to the progression of FRDA in children and adults.
IFIT5, a member of the IFIT1 family, can be activated under stress conditions including virus infection, the production of type I interferon, and lipopolysaccharides stimulation (36, 37). IFIT5 has been proven to be implicated in the regulation of a wide variety of functions, such as viral restriction, translation initiation, cell migration and proliferation, and double-stranded RNA signaling (38, 39). Currently, IFIT5 has not been reported in FRDA. In our study, we identified that IFIT5 has a low level of expression in both child and adult FRDA, which indicated that the decrease of IFIT5 may be a key factor leading to pathological changes in FRDA.
Moreover, in order to clarify the potential regulatory mechanisms related to FRDA progression at the transcriptome level, we predicted the target lncRNAs of the miRNAs interacting with CD28, FAS, and IFIT5 genes and constructed a ceRNA network using Cytoscape software. Afterward, we applied the literature search and only found miR-24-3p was linked with ataxia (40). Therefore, we propose that NEAT1-hsa-miR-24-3p-CD28 may be the potential RNA regulatory pathway involved in the progression of child and adult FRDA.
Several limitations need to be highlighted in this study. Firstly, the sample size for analysis and validation is relatively insufficient. A greater number of samples are needed to verify these results. Secondly, our study preliminarily identified the potential RNA regulatory pathways during the progression of child and adult FRDA, which needs to be further clarified in vitro, in vivo, and clinical trials studies.
In summary, our study found the downregulation of three immune-specific hub genes, CD28, FAS, and IFIT5, may be associated with the progression of child and adult FRDA. Furthermore, NEAT1-hsa-miR-24-3p-CD28 may be a potential RNA regulatory pathway related to the pathogenesis of child and adult FRDA. These findings provide a novel perspective for exploring the pathophysiological mechanism of FRDA progression at the transcriptome level.
Publicly available datasets were analyzed in this study. This data can be found here: National Center for Biotechnology Information (NCBI) Gene Expression Omnibus (GEO), https://www.ncbi.nlm.nih.gov/geo/, GSE11204 and GSE30933.
LL and YL designed the study. ZZ and QF collected and analyzed the data and searched the literature. YL and ZZ interpreted the results. LL wrote and prepared the original manuscript. YL revised the manuscript. All authors have read and approved the final manuscript.
The authors declare that the research was conducted in the absence of any commercial or financial relationships that could be construed as a potential conflict of interest.
All claims expressed in this article are solely those of the authors and do not necessarily represent those of their affiliated organizations, or those of the publisher, the editors and the reviewers. Any product that may be evaluated in this article, or claim that may be made by its manufacturer, is not guaranteed or endorsed by the publisher.
The Supplementary Material for this article can be found online at: https://www.frontiersin.org/articles/10.3389/fneur.2021.816393/full#supplementary-material
FRDA, Friedreich's ataxia; GEO, Gene Expression Omnibus; DEGs, Differentially expressed genes; FDR, false detection rate; co-DEGs, co-expressed Differentially expressed genes; PPI, Protein-protein interaction; GO, Gene Ontology; KEGG, Kyoto Encyclopedia of Genes and Genomes; ceRNA, Competitive endogenous RNA; GSEA, Gene Set Enrichment Analysis; RMA, Robust Multiarray Average; lncRNAs, long noncoding RNAs; FC, fold-changes; NES, normalized enrichment score; DAVID, Database for Annotation, Visualization, and Integrated Discovery; BP, biological process; CC, cell composition; MF, molecular function; MCODE, Minimal Common Oncology Data Elements; MNC, Maximum Neighborhood Component; ROC, Receiver operating characteristic; AUC, Area under the ROC curve.
1. Vankan P. Prevalence gradients of Friedreich's ataxia and R1b haplotype in Europe co-localize, suggesting a common Palaeolithic origin in the Franco-Cantabrian ice age refuge. J Neurochem. (2013) 126 Suppl 1:11–20. doi: 10.1111/jnc.12215
2. Liu J, He H, Wang J, Guo X, Lin H, Chen H, et al. Oxidative stress-dependent frataxin inhibition mediated alcoholic hepatocytotoxicity through ferroptosis. Toxicology. (2020) 445:152584. doi: 10.1016/j.tox.2020.152584
3. Chiang S, Kovacevic Z, Sahni S, Lane DJ, Merlot AM, Kalinowski DS, et al. Frataxin and the molecular mechanism of mitochondrial iron-loading in Friedreich's ataxia. Clin Sci (Lond). (2016) 130:853–70. doi: 10.1042/CS20160072
4. Campuzano V, Montermini L, Moltò MD, Pianese L, Cossée M, Cavalcanti F, et al. Friedreich's ataxia: autosomal recessive disease caused by an intronic GAA triplet repeat expansion. Science. (1996) 1271:423–7. doi: 10.1126/science.271.5254.1423
5. Cook A, Giunti P. Friedreich's ataxia: clinical features, pathogenesis and management. Br Med Bull. (2017) 124:19–30. doi: 10.1093/bmb/ldx034
6. Hayer SN, Liepelt I, Barro C, Wilke C, Kuhle J, Martus P, et al. NfL and pNfH are increased in Friedreich's ataxia. J Neurol. (2020) 267:1420–30. doi: 10.1007/s00415-020-09722-6
7. Clay A, Obrochta KM, Soon RK Jr, Russell CB, Lynch DR. Neurofilament light chain as a potential biomarker of disease status in Friedreich ataxia. J Neurol. (2020) 267:2594–8. doi: 10.1007/s00415-020-09868-3
8. Legrand L, Maupain C, Monin ML, Ewenczyk C, Isnard R, Alkouri R, et al. Significance of NT-proBNP and High-sensitivity Troponin in Friedreich Ataxia. J Clin Med. (2020) 9:1630. doi: 10.3390/jcm9061630
9. Seco-Cervera M, González-Rodríguez D, Ibáñez-Cabellos JS, Peiró-Chova L, González-Cabo P, García-López E, et al. Circulating miR-323-3p is a biomarker for cardiomyopathy and an indicator of phenotypic variability in Friedreich's ataxia patients. Sci Rep. (2017) 7:5237. doi: 10.1038/s41598-017-04996-9
10. Yu W, Yu W, Yang Y, Lü Y. Exploring the key genes and identification of potential diagnosis biomarkers in Alzheimer's disease using bioinformatics analysis. Front Aging Neurosci. (2021) 13:602781. doi: 10.3389/fnagi.2021.602781
11. Zhang W, Yao S, Huang H, Zhou H, Zhou H, Wei Q, et al. Molecular subtypes based on ferroptosis-related genes and tumor microenvironment infiltration characterization in lung adenocarcinoma. Oncoimmunology. (2021) 10:1959977. doi: 10.1080/2162402X.2021.1959977
12. Liang J, Cao Y, He M, Li W, Huang G, Ma T, et al. AKR1C3 and its transcription factor HOXB4 are promising diagnostic biomarkers for acute myocardial infarction. Front Cardiovasc Med. (2021) 8:694238. doi: 10.3389/fcvm.2021.694238
13. Salmena L, Poliseno L, Tay Y, Kats L, Pandolfi PP. A ceRNA hypothesis: the Rosetta Stone of a hidden RNA language? Cell. (2011) 146:353–8. doi: 10.1016/j.cell.2011.07.014
14. Barrett T, Wilhite SE, Ledoux P, Evangelista C, Kim IF, Tomashevsky M, et al. NCBI GEO: archive for functional genomics data sets–update. Nucleic Acids Res. (2013) 41:D991–5. doi: 10.1093/nar/gks1193
15. Haugen AC, Di Prospero NA, Parker JS, Fannin RD, Chou J, Meyer JN, et al. Altered gene expression and DNA damage in peripheral blood cells from Friedreich's ataxia patients: cellular model of pathology. PLoS Genet. (2010) 6:e1000812. doi: 10.1371/journal.ppat.1000812
16. Coppola G, Burnett R, Perlman S, Versano R, Gao F, Plasterer H, et al. A gene expression phenotype in lymphocytes from Friedreich ataxia patients. Ann Neurol. (2011) 70:790–804. doi: 10.1002/ana.22526
17. Huang da W, Sherman BT, Lempicki RA. Systematic and integrative analysis of large gene lists using DAVID bioinformatics resources. Nat Protoc. (2009) 4:44–57. doi: 10.1038/nprot.2008.21
18. Yu G, Wang LG, Han Y, He QY. clusterProfiler: an R package for comparing biological themes among gene clusters. OMICS. (2012) 16:284–7. doi: 10.1089/omi.2011.0118
19. Szklarczyk D, Franceschini A, Wyder S, Forslund K, Heller D, Huerta-Cepas J, et al. STRING v10: protein-protein interaction networks, integrated over the tree of life. Nucleic Acids Res. (2015) 43:D447–52. doi: 10.1093/nar/gku1003
20. Chin CH, Chen SH, Wu HH, Ho CW, Ko MT, Lin CY. cytoHubba: identifying hub objects and sub-networks from complex interactome. BMC Syst Biol. (2014) 8 Suppl 4:S11. doi: 10.1186/1752-0509-8-S4-S11
21. Luan H, Zhang C, Zhang T, He Y, Su Y, Zhou L. Identification of key prognostic biomarker and its correlation with immune infiltrates in pancreatic ductal adenocarcinoma. Dis Markers. (2020) 2020:8825997. doi: 10.1155/2020/8825997
22. Yang X, Li Y, Lv R, Qian H, Chen X, Yang CF. Study on the multitarget mechanism and key active ingredients of herba siegesbeckiae and volatile oil against rheumatoid arthritis based on network pharmacology. Evid Based Complement Alternat Med. (2019) 2019:8957245. doi: 10.1155/2019/8957245
23. Dweep H, Sticht C, Pandey P, Gretz N. miRWalk–database: prediction of possible miRNA binding sites by “walking” the genes of three genomes. J Biomed Inform. (2011) 44:839–47. doi: 10.1016/j.jbi.2011.05.002
24. Li JH, Liu S, Zhou H, Qu LH. Yang JH. starBase v20: decoding miRNA-ceRNA, miRNA-ncRNA and protein-RNA interaction networks from large-scale CLIP-Seq data. Nucleic Acids Res. (2014) 42:D92–7. doi: 10.1093/nar/gkt1248
25. Newman AM, Steen CB, Liu CL, Gentles AJ, Chaudhuri AA, Scherer F, et al. Determining cell type abundance and expression from bulk tissues with digital cytometry. Nat Biotechnol. (2019) 37:773–82. doi: 10.1038/s41587-019-0114-2
26. Akalin PK. Introduction to bioinformatics. Mol Nutr Food Res. (2006) 50:610–9. doi: 10.1002/mnfr.200500273
27. Nachun D, Gao F, Isaacs C, Strawser C, Yang Z, Dokuru D, et al. Peripheral blood gene expression reveals an inflammatory transcriptomic signature in Friedreich's ataxia patients. Hum Mol Genet. (2018) 27:2965–77. doi: 10.1093/hmg/ddy198
28. Bluestone JA, St Clair EW, Turka LA. CTLA4Ig: bridging the basic immunology with clinical application. Immunity. (2006) 24:233–8. doi: 10.1016/j.immuni.2006.03.001
29. Esensten JH, Helou YA, Chopra G, Weiss A, Bluestone JA. CD28 Costimulation: from mechanism to therapy. Immunity. (2016) 44:973–88. doi: 10.1016/j.immuni.2016.04.020
30. Sang A, Yin Y, Zheng YY, Morel L. Animal models of molecular pathology systemic lupus erythematosus. Prog Mol Biol Transl Sci. (2012) 105:321–70. doi: 10.1016/B978-0-12-394596-9.00010-X
31. Richartz E, Noda S, Schott K, Günthner A, Lewczuk P, Bartels M. Increased serum levels of CD95 in Alzheimer's disease. Dement Geriatr Cogn Disord. (2002) 13:178–82. doi: 10.1159/000048650
32. Kobayashi K, Hayashi M, Nakano H, Shimazaki M, Sugimori K, Koshino Y. Correlation between astrocyte apoptosis and Alzheimer changes in gray matter lesions in Alzheimer's disease. J Alzheimers Dis. (2004) 6:623–32; discussion 673-81. doi: 10.3233/JAD-2004-6606
33. Kobayashi K, Hayashi M, Nakano H, Fukutani Y, Sasaki K, Shimazaki M, et al. Apoptosis of astrocytes with enhanced lysosomal activity and oligodendrocytes in white matter lesions in Alzheimer's disease. Neuropathol Appl Neurobiol. (2002) 28:238–51. doi: 10.1046/j.1365-2990.2002.00390.x
34. Guégan JP, Legembre P. Nonapoptotic functions of Fas/CD95 in the immune response. FEBS J. (2018) 285:809–27. doi: 10.1111/febs.14292
35. Guégan JP, Ginestier C, Charafe-Jauffret E, Ducre T, Quignard JF, Vacher P, et al. CD95/Fas and metastatic disease: what does not kill you makes you stronger. Semin Cancer Biol. (2020) 60:121–31. doi: 10.1016/j.semcancer.2019.06.004
36. Schoggins JW, Wilson SJ, Panis M, Murphy MY, Jones CT, Bieniasz P, et al. A diverse range of gene products are effectors of the type I interferon antiviral response. Nature. (2011) 472:481–5. doi: 10.1038/nature09907
37. Ovstebø R, Olstad OK, Brusletto B, Møller AS, Aase A, Haug KB, et al. Identification of genes particularly sensitive to lipopolysaccharide (LPS) in human monocytes induced by wild-type versus LPS-deficient Neisseria meningitidis strains. Infect Immun. (2008) 76:2685–95. doi: 10.1128/IAI.01625-07
38. D'Andrea LD, Regan L. TPR proteins: the versatile helix. Trends Biochem Sci. (2003) 28:655–62. doi: 10.1016/j.tibs.2003.10.007
39. Fensterl V, Sen GC. The ISG56/IFIT1 gene family. J Interferon Cytokine Res. (2011) 31:71–8. doi: 10.1089/jir.2010.0101
Keywords: Friedreich's ataxia, biomarker, hub genes, bioinformatics, RNA regulatory pathways
Citation: Liu L, Lai Y, Zhan Z, Fu Q and Jiang Y (2022) Downregulation of Three Immune-Specific Core Genes and the Regulatory Pathways in Children and Adult Friedreich's Ataxia: A Comprehensive Analysis Based on Microarray. Front. Neurol. 12:816393. doi: 10.3389/fneur.2021.816393
Received: 16 November 2021; Accepted: 29 December 2021;
Published: 14 February 2022.
Edited by:
Hong Ni, Children's Hospital of Soochow University, ChinaReviewed by:
Siwei Bi, Sichuan University, ChinaCopyright © 2022 Liu, Lai, Zhan, Fu and Jiang. This is an open-access article distributed under the terms of the Creative Commons Attribution License (CC BY). The use, distribution or reproduction in other forums is permitted, provided the original author(s) and the copyright owner(s) are credited and that the original publication in this journal is cited, in accordance with accepted academic practice. No use, distribution or reproduction is permitted which does not comply with these terms.
*Correspondence: Yuelian Jiang, eXVlcmFpbkAxMjYuY29t
†These authors have contributed equally to this work and share first authorship
Disclaimer: All claims expressed in this article are solely those of the authors and do not necessarily represent those of their affiliated organizations, or those of the publisher, the editors and the reviewers. Any product that may be evaluated in this article or claim that may be made by its manufacturer is not guaranteed or endorsed by the publisher.
Research integrity at Frontiers
Learn more about the work of our research integrity team to safeguard the quality of each article we publish.