 Dae Jong Oh1,2†
 Ji-Jung Jung3†
 Seong A. Shin4Hairin Kim2
 Soowon Park5Bo Kyung Sohn6
 Bo Kyung Koo7,8Min Kyong Moon7,8
 Yu Kyeong Kim4*
 Jun-Young Lee2,9*
- 1Department of Psychiatry, Seoul National University College of Medicine, Seoul, South Korea
- 2Department of Psychiatry, SMG-SNU Boramae Medical Center, Seoul, South Korea
- 3Department of Surgery, Seoul National University Bundang Hospital, Seongnam, South Korea
- 4Department of Nuclear Medicine, SMG-SNU Boramae Medical Center, Seoul, South Korea
- 5Division of Teacher Education, College of General Education for Truth, Sincerity and Love, Kyonggi University, Suwon, South Korea
- 6Department of Psychiatry, Inje University Sanggye Paik Hospital, Seoul, South Korea
- 7Department of Internal Medicine, Seoul National University College of Medicine, Seoul, South Korea
- 8Department of Internal Medicine, SMG-SNU Boramae Medical Center, Seoul, South Korea
- 9Department of Psychiatry and Neuroscience Research Institute, Seoul Nation University College of Medicine, Seoul, South Korea
Despite the high risk of dementia in older adults with type 2 diabetes, the neuroanatomical correlates of cognitive dysfunction that are particularly affected by diabetes are not well characterized. This study is aimed to examine the structural brain alterations in dysglycemic older adults. Using voxel-based morphometric and tract-based spatial statistics, we examined changes in gray matter volume, white matter volume, and microstructural integrity in older adults with prediabetes and diabetes. We also assessed the correlation of these structural changes with diabetes biomarkers and cognitive performance. A total of 74 non-demented older adults (normal, n = 14; prediabetes, n = 37; and diabetes, n = 23) participated in this study and underwent structural and diffusion magnetic resonance imaging (MRI) scans and neuropsychological tests. Subjects with diabetes showed reduced volume of cerebellar gray matter and frontal white matter and diffuse white matter dysintegrity, while those with prediabetes only showed reduced volume of insular gray matter. Atrophic changes in the cerebellum and frontal lobe and frontal white matter dysintegrity were correlated with chronic hyperglycemia and insulin resistance and worse performance in verbal memory recognition and executive function tests. Our findings suggest that chronic hyperglycemia and insulin resistance may alter brain structures forming the fronto-cerebellar network, which may cause cognitive dysfunction in older adults.
Introduction
The prevalence rates of both type 2 diabetes and dementia increase with age, and older adults are often concomitantly affected by both diseases (1). Previous studies have found that type 2 diabetes increases the risk of cognitive decline and incident dementia (2–4). However, the neuroanatomical correlates that can be affected by diabetes-related pathophysiology and finally lead to neurodegeneration are not well characterized.
Many researchers have reported alterations of brain structures in diabetes; however, there are several unresolved questions. It remains unclear whether volume changes in specific brain areas are particularly associated with diabetes. With the exception of a few studies that estimated the regional distribution of brain atrophy (5–8), most previous studies have only focused on the volumes of total brain, total gray matter, total white matter, and hippocampus in diabetes (9–22). The lack of voxel-based morphometry (VBM) studies in this field has limited the identification of unexpected regions related to the pathophysiology of diabetes. Furthermore, it has not been identified whether alteration of brain atrophy in specific regions is correlated with cognitive decline in dysglycemic older adults. Finally, as most prior studies did not include a separate prediabetes group, the structural brain alterations in the early stage of dysglycemia are not clear. Although several studies compared brain volumes of prediabetes with normal control, none of these studies (8, 15, 17, 20), with the exception of the Maastricht study (22), found any significant difference in this respect. Use of diffusion tensor imaging (DTI) or VBM analysis may help overcome the limitations of previous studies; however, these modalities have not been applied to participants with prediabetes.
In the present study, using structural magnetic resonance imaging (MRI), we applied voxel-based morphometry to localize specific and unexpected regions with reduced gray and white matter volume and tract-based spatial statistics to identify regions with microstructural alterations in older adults with dysglycemia, including prediabetes and diabetes. We also assessed whether the volume of specific brain regions is affected by diabetes biomarkers, and whether these regions are associated with poor cognitive performance.
Materials and Methods
Study Design and Participants
In this cross-sectional study, we recruited 74 participants (age range: 52–85 years) from the Dementia and Memory Disorder Clinic at the SMG-SNU Boramae Medical Center (Seoul, Korea) and via advertisements. The clinical characteristics (age, sex, education, dementia status) and laboratory data (plasma glycosylated hemoglobin, HbA1c; fasting plasma glucose, FPG; Homeostatic Model Assessment for Insulin Resistance, HOMA-IR) were obtained by reviewing medical records. The exclusion criteria included dementia, structural lesions on brain imaging, major neurological or physical illness that may affect cognitive performance, history of alcohol or drug abuse in the preceding ten years, presence of visual or hearing difficulties or motor impairment, and inadequate or uncooperative attitude during the test.
This study was approved by the Institutional Review Board of the Seoul National University Hospital, and written informed consent was obtained from all participants.
Assessment for Diabetes and Related Biomarkers
All participants fasted for over 14 h prior to venous blood sampling for laboratory testing. On the basis of FPG, HbA1c, and previous medical history, the participants were classified into the following three groups based on the 2016 revision of the diagnostic criteria for diabetes by American Diabetes Association (23): type 2 diabetes group (n = 23) with HbA1c ≥ 6.5% or FPG ≥ 126 mg/dL; prediabetes group (n = 37) with HbA1c 5.7–6.4% or FPG 100–125 mg/dL; and normal control group with normal glucose tolerance (NL; n = 14) with HbA1c < 5.7% and FPG <100 mg/dL. Dysglycemia was defined as either having prediabetes or diabetes according to the above cutoffs.
Insulin resistance according to the Homeostatic model assessment of insulin resistance (HOMA-IR) was calculated using the following formula: HOMA-IR = fasting plasma insulin (U/mL) × FPG (mg/dL)/405 (24).
Assessment of Cognitive Performance
Geriatric psychiatrists administered a standardized diagnostic interview with neurological and physical examinations to all participants using the Korean version of the Consortium to Establish a Registry for Alzheimer's Disease (CERAD-K) Assessment Packet Clinical Assessment Battery (25). Professional neuropsychologists administered the CERAD-K neuropsychological battery tests to all participants (26). CERAD-K neuropsychological battery was composed of the following subtests: word list memory test, word list recall test, word list recognition test, constructional recall test, constructional praxis test, verbal fluency test, trail making test (A and B), and modified Boston naming test. The diagnostic panel consisting of geriatric psychiatrists and neuropsychologists confirmed the diagnosis of dementia, and participants diagnosed as having dementia were excluded from the current study.
Brain Image Acquisition and Preprocessing Procedures
Brain structural T1-weighted and DTI sequences were obtained using a 3.0 Tesla MRI scanner (Achieva, Philips Healthcare, Netherlands). The acquisition parameters for structural T1-weighted image were as follows: repetition time, 9.9 ms; echo time, 4.6 ms; slice thickness, 1; image size, 224 × 224 × 180; voxel size, 1.00 × 0.98 × 0.98 mm. The protocols for DTI were as follows: number of diffusion gradient directions, 32 [one b0 image and 31 diffusion-weighted images (b = 1000 s/mm2)]; slice thickness, 2 mm; repetition time, 8,097 ms; echo time, 68 ms; flip angle, 90°; image size, 144 × 144 × 70; voxel size, 1.53 × 1.53 × 2.00 mm.
The structural T1-weighted image preprocessing steps for VBM analysis were performed using Statistical Parametric Mapping 12 (SPM12, Wellcome Department of Imaging Neuroscience, UCL, UK, https://www.fil.ion.ucl.ac.uk/spm/software/spm12/) and Computational Anatomy Toolbox (CAT12, http://dbm.neuro.uni-jena.de/cat) implemented in Matlab [(27), http://www.mathworks.com]. Initially, structural T1-weighted images were corrected for inhomogeneity and were noise- and skull-stripped. Gray matter and white matter were then segmented and normalized into a standard space using DARTEL (diffeomorphic anatomical registration using exponentiated lie algebra) algorithms and tissue probability maps. The images were modulated to preserve tissue volume after warping and finally smoothed with an isotropic Gaussian kernel of 8 × 8 × 8 mm at full-width at half-maximum.
DTI images were preprocessed using FSL 6.0 (FMRIB Software Library, http://www.fmrib.ox.ac.uk/fsl). Diffusion data were corrected for eddy currents and motion using b0 image of each subject. Following brain extraction, individual fractional anisotropy (FA) and mean diffusivity (MD) maps were generated using DTIFIT. The following steps were then processed using the tract-based spatial statistics toolbox in FSL. The FA and MD maps were non-linearly registered to a FMRIB58_FA standard space template, and a mean FA image was created and skeletonized. The mean FA skeleton image was then thresholded at 0.2 to exclude non-white matter voxels, and the FA and MD data of each subject were projected to the mean skeleton.
Statistical Analyses
For the group comparison of demographic and clinical characteristics of participants, we performed Chi-square test for sex and Kruskal-Wallis test for other variables.
Group comparisons of gray matter and white matter volume were performed in a voxel-wise manner using one-way analysis of covariance (ANCOVA) with age, sex, years of education, and total intracranial volume added as covariates. In addition, correlation analyses of these volumes with diabetes biomarkers (HbA1c and HOMA-IR) in participants with dysglycemia were also performed in a voxel-wise manner using multiple regression analysis with age, sex, years of education, and total intracranial volume added as covariates of no interest. The initial statistical threshold was set at p-value of < 0.005 without correction for false discovery rate, and then we used p-value of < 0.05 with family wise error correction at cluster level to report the result of statistical significance in the following analyses.
The ANCOVA for group comparisons and the multiple regression for correlation analyses with diabetes biomarkers in participants with dysglycemia were performed by voxel-wise statistics of the FA and MD skeleton maps, using a permutation-based nonparametric test with multiple comparison correction and threshold-free cluster enhancement methods (10,000 permutations). Results were considered significant at p < 0.05 corrected for threshold-free cluster enhancement and family-wise error. The potential impact of age, sex, and years of education on the results were minimized by adding these as covariates of no interest.
The gray and white matter volumes from the clusters that showed a significant correlation with diabetes biomarkers in whole-brain correlation analyses were extracted and their correlation with cognitive performance examined in participants with dysglycemia, using Pearson's correlation test.
Results
Table 1 summarizes the characteristics of the study population disaggregated by study group. There were significant between-group differences with respect to sex distribution and diabetes biomarker levels (FPG, HbA1c, HOMA-IR). There were no significant differences with respect to cognitive performance.
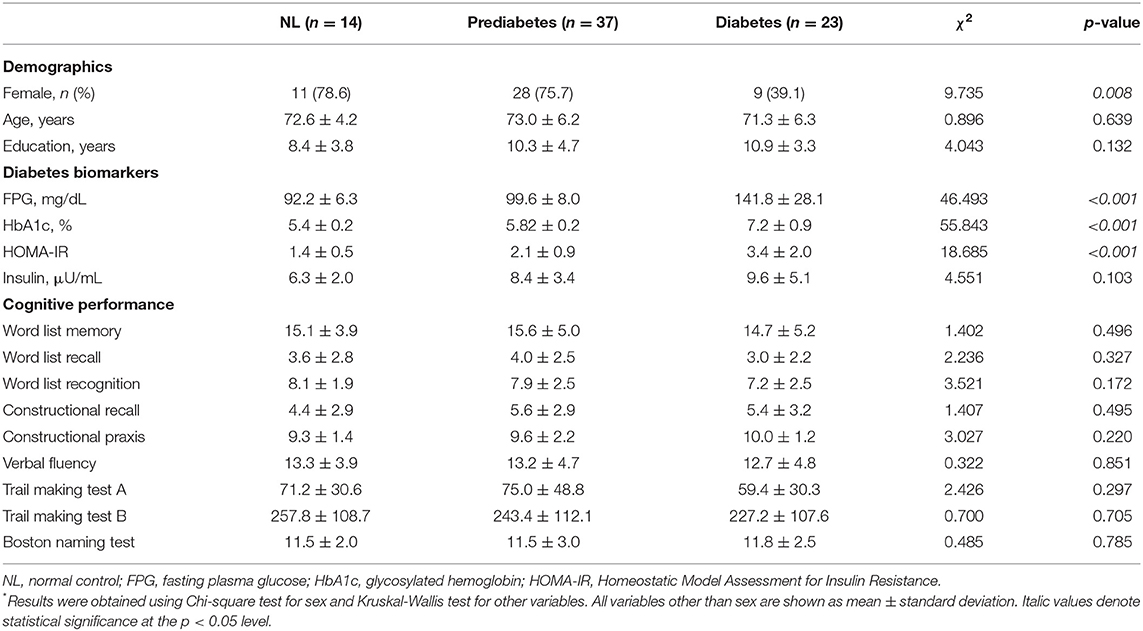
Table 1. Demographic and clinical characteristics of subjects*.
As illustrated in Figure 1, the diabetes group had smaller gray matter volume in the bilateral cerebellum and occipital lobe and smaller white matter volume in the right prefrontal lobe than the NL group. The prediabetes group had smaller gray matter volume in the left anterior insula and left frontal lobe than the NL group; however, there was no significant difference between prediabetes group and NL group with respect to white matter volume (see Supplementary Table 1). With respect to white matter microstructural alterations, the diabetes group showed widespread reduction in FA and increase in MD compared to the NL group (Figure 2). There was no significant difference in white matter microstructure between prediabetes and NL groups.
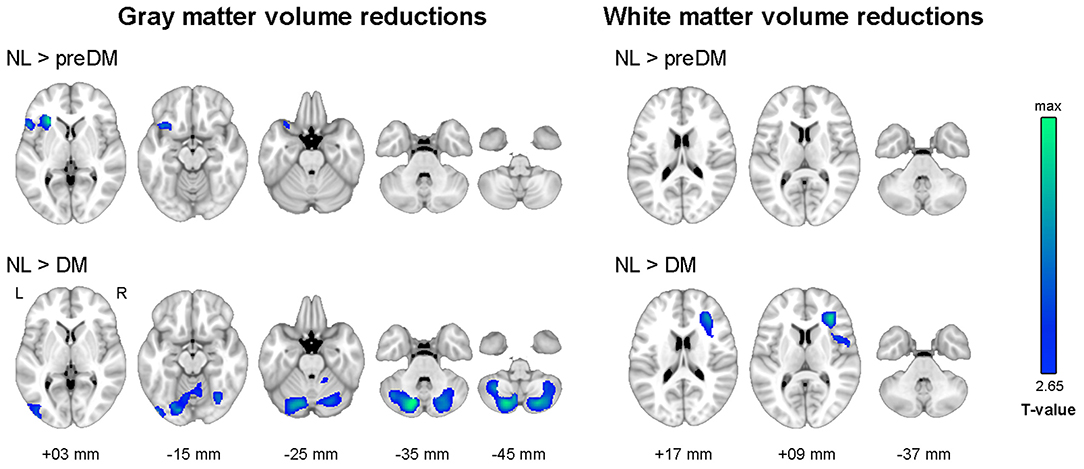
Figure 1. Results of whole-brain analyses showing reduced gray and white matter volume in dysglycemia compared to normal glucose tolerance. Family-wise error corrected p < 0.05 at cluster level with underlying voxel level of uncorrected p < 0.005. NL, normal control group; preDM, prediabetes group; DM, type 2 diabetes group.
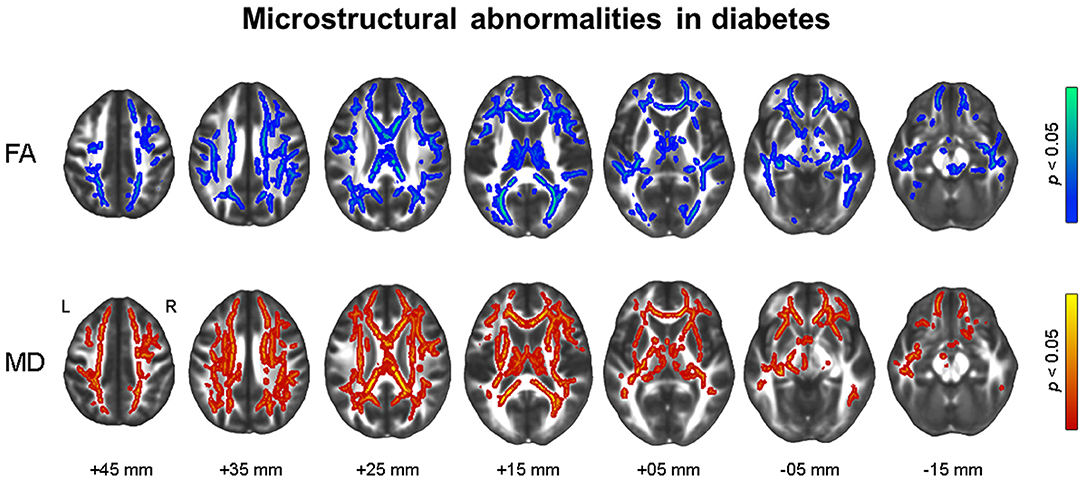
Figure 2. Results of tract-based spatial statistics analysis showing microstructural alterations in diabetes. Threshold-free cluster enhancement and family-wise corrected p < 0.05 using nonparametric test. Red color indicates an increase, and blue color indicates a decrease in microstructural measures in diabetes compared to normal glucose tolerance. FA, fractional anisotropy; MD, mean diffusivity.
Figure 3 shows the results of voxel-wise correlation analyses between altered brain volumes and diabetes biomarkers in participants with dysglycemia. HbA1c and HOMA-IR levels showed a negative correlation with cerebellar gray matter volume in participants with dysglycemia. HOMA-IR showed a negative correlation with white matter volume in the right frontal area and left cerebellum (see also Supplementary Table 2). With respect to white matter microstructure, increasing HbA1c level showed a correlation with reduction in frontal FA and more widespread MD in participants with dysglycemia (Figure 4). There was no significant correlation between HOMA-IR level and alteration of white matter microstructure.
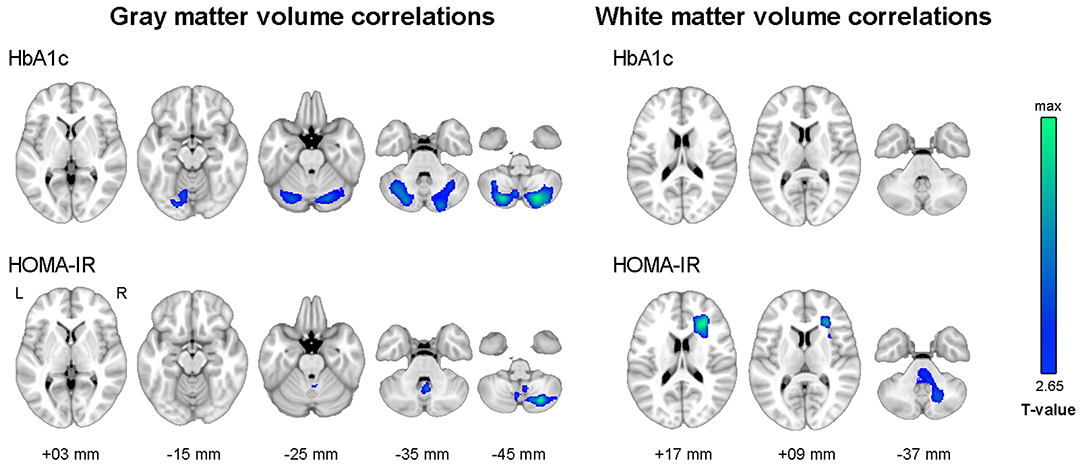
Figure 3. Results of whole-brain correlation analyses between regional brain volume and diabetes biomarkers in dysglycemia. Family-wise error corrected p < 0.05 at cluster level with underlying voxel level of uncorrected p < 0.005. HbA1c, glycosylated hemoglobin level; HOMA-IR, Homeostatic Model Assessment for Insulin Resistance.
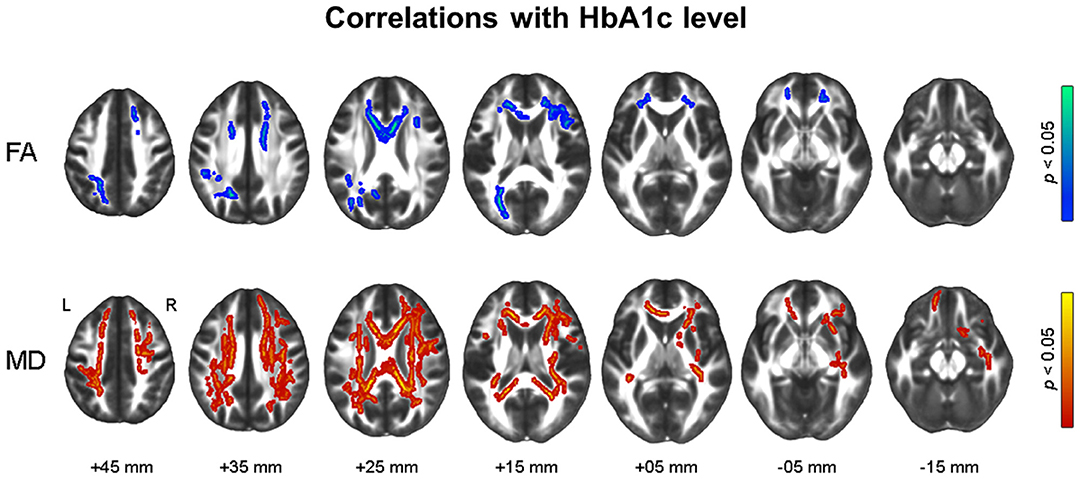
Figure 4. Results of tract-based spatial statistics analysis showing correlations with HbA1c level in dysglycemia. Threshold-free cluster enhancement and family-wise corrected p < 0.05 using nonparametric test. Red indicates a positive relationship, and blue a negative relationship of microstructural measures with HbA1c. HbA1c, glycosylated hemoglobin; FA, fractional anisotropy; MD, mean diffusivity.
Table 2 shows the correlation between cognitive performance and the volume of brain regions which showed a significant correlation with diabetes biomarkers in the preceding analyses. Smaller cerebellar gray matter volume showed a significant correlation with worse performance in the word list recognition test, verbal fluency test, and trail making test B. In particular, the association of cerebellar atrophy with poor performance in word list recognition met the stringent threshold for Bonferroni correction (p < 0.005). Smaller white matter volume in the right frontal region showed a significant correlation with worse performance in the word list memory test, word list recognition test, and constructional recall test.
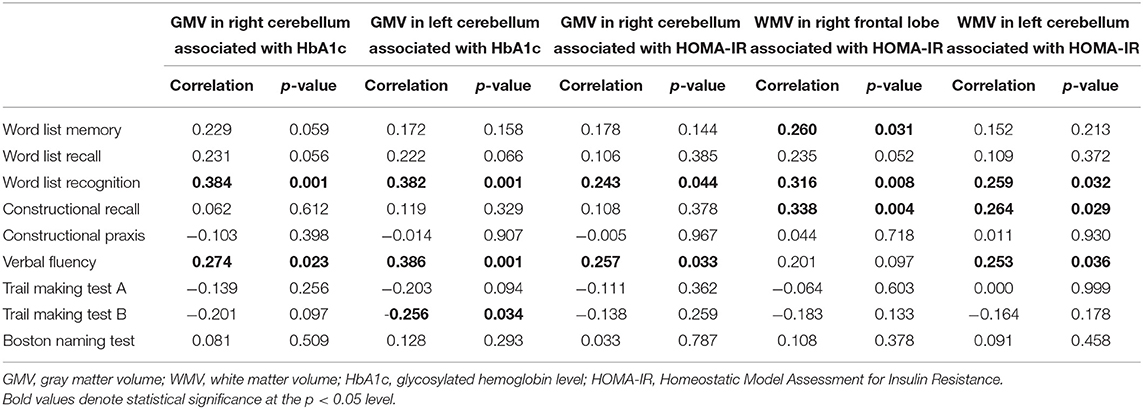
Table 2. Correlations between regional volume changes associated with diabetes biomarkers and cognitive performances.
Discussion
Our study examined whole-brain morphological alterations in older adults with dysglycemia. The volume of cerebellar gray matter and frontal white matter, as well as diffuse white matter microstructure, were affected by diabetes, while the insular gray matter was reduced in prediabetes. In particular, structural alterations in cerebellar and frontal areas in dysglycemia showed a correlation with diabetes biomarkers and worse cognitive performance.
To the best of our knowledge, this is the first study to demonstrate a correlation of the levels of hyperglycemia and insulin resistance with cerebellar atrophy in older adults with dysglycemia. We also demonstrated an association of cerebellar atrophy with poor performance in verbal memory recognition and executive function, which is similar to the findings reported in a diabetic middle-aged adult (28). Cerebellum regulates various cognitive functions (such as working memory, executive function, attention, language, and emotional processing) in addition to motor functions (29, 30). Furthermore, cerebellum is one of the brain regions with the most abundant insulin receptors (31). Aberrant insulin receptor-mediated signaling can induce mitochondrial dysfunction, oxidative stress, and proinflammatory cytokine expression, which lead to neural plasticity deficits and atrophic change in the cerebellum (32–34). In addition, impaired glucose homeostasis per se alters the expression of cholinergic receptors in the cerebellum, which causes motor and cognitive dysfunction (35). However, none of the previous studies that used region-of-interest analytic methods included cerebellar volume in their analyses (5–22), except for one study which focused only on the motor outcome of diabetes (36). Based on its probable relationship with diabetes biomarkers and cognitive outcomes presented in this study, future research should focus on the structural and functional changes of the cerebellum in dysglycemia.
In line with the previous findings (8, 33, 37–41), this study found reduced frontal white matter volume as well as diffuse white matter dysintegrity involving the frontal area in diabetes. We also found that these structural alterations were affected by hyperglycemia and insulin resistance. Along with cerebellar atrophy discussed above, we speculate that structural changes in the fronto-cerebellar network may be an important neural correlate in diabetic older adults. The cerebellum is connected to the prefrontal cortex and other non-motor cortical regions via projecting fibers and synapses (29). In a recent functional neuroimaging study, patients with type 2 diabetes showed decreased functional connectivity between the cerebellum and dorsolateral prefrontal cortex compared to normal controls (42). Atrophic changes of related structures in diabetes are linked to gait disturbance even in patients without diabetic peripheral neuropathy (36). This study further suggests that impairment of the fronto-cerebellar network may affect not only motor function but also cognitive function, particularly frontal lobe or executive functions which are known to be modulated by feedback mechanisms supported by the cerebellum (29).
Our findings were inconsistent with previous VBM studies (37, 39, 43, 44) that reported a significant difference in the volume of the frontal lobe between diabetes and controls, but not in cerebellar volume. This discrepancy with our results may be attributable to substantial differences in study participants. Unlike the present study, none of the previous studies differentiated their control groups into normal glucose tolerance and prediabetes. Inclusion of a higher proportion of subjects with prediabetes in the control group in previous studies would have obviated the volumetric difference. In addition, the previous studies did not exclude participants with dementia or had used cutoff values of simple screening tests to exclude dementia rather than clinical interview. Furthermore, two of the previous studies (37, 44) included middle-aged adults whose mean age was much lower than those of the current study. As the atrophic change of brain volume is determined by both normal aging and neurodegenerative processes, the differences in age of participants and prevalence of dementia may have contributed to the inconsistent findings compared to the present study.
This study found reduced gray matter volume in anterior insula in prediabetes compared to the NL group, which is consistent with a previous work that reported atrophic changes of the insula and related structures such as cingulate cortex in prediabetes (45). However, we found no significant insular atrophy in diabetes in this study. Insula is known to control interoceptive awareness and executive function against dysglycemia along with the prefrontal cortex, basal ganglia, and cerebellum (46). In patients with type 1 diabetes, chronic dysglycemia was shown to increase functional connectivity of this insula-mediated network to facilitate neuroplastic adaptation to impaired metabolic homeostasis. Furthermore, chronic exposure to dysglycemia decreased cerebellar gray matter volume but increased insular gray matter volume in type 1 diabetes (47). This paradoxical increase of insular volume under chronic dysglycemia may be the result of a neuroinflammatory response to oxidative stress (48) or the compensation for the cerebellar atrophy in diabetes (47). Our results indicate that the alteration of the insula may be more specific to the early stage of dysglycemia, which could be recovered in the later stage of type 2 diabetes.
Our study has strengths over the previous studies. Voxel-based analyses implemented in the current study are automated and observer-independent approaches characterized by accuracy and high sensitivity for identification of local changes (49, 50). The methods allow detection of specific and unexpected structural changes prior to the appearance of clinically relevant symptoms. Additionally, we included a prediabetes group to analyze the structural alterations in the early stage of dysglycemia. However, some limitations of our study should be acknowledged. First, the cross-sectional study design does not permit causal inferences, although we included subjects in the prediabetes and diabetes stage. Second, the small sample size limits the power of the study. Finally, some studies revealed that the disease duration accounts for the brain dysfunction in diabetes. However, information about the disease duration was not available and could not be controlled for in the analyses. Future longitudinal studies with larger sample size are warranted to explore the association between dysglycemia and macro-and micro-structural alterations in the brain.
In summary, the present study using voxel-wise analyses indicates that older adults with dysglycemia may have altered brain structures in the fronto-cerebellar network, and these alterations may reflect diabetes severity and worse cognitive performance. Further longitudinal studies using region-of-interest methods may better clarify the neural correlates involving this network and their cognitive outcomes.
Data Availability Statement
Data are available on reasonable request to corresponding authors.
Ethics Statement
The studies involving human participants were reviewed and approved by the Institutional Review Board of the Seoul National University Hospital. The patients/participants provided their written informed consent to participate in this study.
Author Contributions
DO, J-JJ, SS, YK, and J-YL conceptualized and designed this work. DO, J-JJ, and J-YL drafted the manuscript. All authors were involved in data acquisition and analysis, read, and approved the final version of the manuscript.
Funding
This work was supported by a clinical research grant-in-aid from the Seoul Metropolitan Government Seoul National University (SMG-SNU), Boramae Medical Center (03-2012-6), and by the National Research Foundation of Korea (NRF) grant funded by the Ministry of Science, ICT and Future Planning (NRF-2014M3C7A1046042), and the Ministry of Education and Science Technology (NRF-2018R1A5A2025964).
Conflict of Interest
The authors declare that the research was conducted in the absence of any commercial or financial relationships that could be construed as a potential conflict of interest.
Publisher's Note
All claims expressed in this article are solely those of the authors and do not necessarily represent those of their affiliated organizations, or those of the publisher, the editors and the reviewers. Any product that may be evaluated in this article, or claim that may be made by its manufacturer, is not guaranteed or endorsed by the publisher.
Supplementary Material
The Supplementary Material for this article can be found online at: https://www.frontiersin.org/articles/10.3389/fneur.2021.766216/full#supplementary-material
References
1. Barnett K, Mercer SW, Norbury M, Watt G, Wyke S, Guthrie B. Epidemiology of multimorbidity and implications for health care, research, and medical education: a cross-sectional study. Lancet. (2012) 380:37–43. doi: 10.1016/S0140-6736(12)60240-2
2. Biessels GJ, Deary IJ, Ryan CM. Cognition and diabetes: a lifespan perspective. Lancet Neurol. (2008) 7:184–90. doi: 10.1016/S1474-4422(08)70021-8
3. Rawlings AM, Sharrett AR, Schneider AL, Coresh J, Albert M, Couper D, et al. Diabetes in midlife and cognitive change over 20 years: a cohort study. Ann Intern Med. (2014) 161:785–93. doi: 10.7326/M14-0737
4. Reaven GM, Thompson LW, Nahum D, Haskins E. Relationship between hyperglycemia and cognitive function in older NIDDM patients. Diabetes Care. (1990) 13:16–21. doi: 10.2337/diacare.13.1.16
5. Espeland MA, Bryan RN, Goveas JS, Robinson JG, Siddiqui MS, Liu S, et al. Influence of type 2 diabetes on brain volumes and changes in brain volumes: results from the women's health initiative magnetic resonance imaging studies. Diabetes Care. (2013) 36:90–7. doi: 10.2337/dc12-0555
6. Falvey CM, Rosano C, Simonsick EM, Harris T, Strotmeyer ES, Satterfield S, et al. Macro- and microstructural magnetic resonance imaging indices associated with diabetes among community-dwelling older adults. Diabetes Care. (2013) 36:677–82. doi: 10.2337/dc12-0814
7. Roy B, Ehlert L, Mullur R, Freeby MJ, Woo MA, Kumar R, et al. Regional brain gray matter changes in patients with type 2 diabetes mellitus. Sci Rep. (2020) 10:9925. doi: 10.1038/s41598-020-67022-5
8. Schneider ALC, Selvin E, Sharrett AR, Griswold M, Coresh J, Jack CR, et al. Diabetes, prediabetes, and brain volumes and subclinical cerebrovascular disease on MRI: the atherosclerosis risk in communities neurocognitive study (ARIC-NCS). Diabetes Care. (2017) 40:1514–21. doi: 10.2337/dc17-1185
9. Brundel M, van den Heuvel M, de Bresser J, Kappelle LJ, Biessels GJ, Utrecht Diabetic Encephalopathy Study Group. Cerebral cortical thickness in patients with type 2 diabetes. J Neurol Sci. (2010) 299:126–30. doi: 10.1016/j.jns.2010.08.048
10. Bryan RN, Bilello M, Davatzikos C, Lazar RM, Murray A, Horowitz K, et al. Effect of diabetes on brain structure: the action to control cardiovascular risk in diabetes MR imaging baseline data. Radiology. (2014) 272:210–6. doi: 10.1148/radiol.14131494
11. Callisaya ML, Beare R, Moran C, Phan T, Wang W, Srikanth VK. Type 2 diabetes mellitus, brain atrophy and cognitive decline in older people: a longitudinal study. Diabetologia. (2019) 62:448–58. doi: 10.1007/s00125-018-4778-9
12. de Bresser J, Tiehuis AM, van den Berg E, Reijmer YD, Jongen C, Kappelle LJ, et al. Progression of cerebral atrophy and white matter hyperintensities in patients with type 2 diabetes. Diabetes Care. (2010) 33:1309–14. doi: 10.2337/dc09-1923
13. Enzinger C, Fazekas F, Matthews PM, Ropele S, Schmidt H, Smith S, et al. Risk factors for progression of brain atrophy in aging: six-year follow-up of normal subjects. Neurology. (2005) 64:1704–11. doi: 10.1212/01.WNL.0000161871.83614.BB
14. Exalto LG, van der Flier WM, Scheltens P, Vrenken H, Biessels GJ. Dysglycemia, brain volume and vascular lesions on MRI in a memory clinic population. J Diabetes Complications. (2014) 28:85–90. doi: 10.1016/j.jdiacomp.2012.12.003
15. Hirabayashi N, Hata J, Ohara T, Mukai N, Nagata M, Shibata M, et al. Association between diabetes and hippocampal atrophy in elderly Japanese: the Hisayama study. Diabetes Care. (2016) 39:1543–9. doi: 10.2337/dc15-2800
16. Li W, Risacher SL, Huang E, Saykin AJ. Type 2 diabetes mellitus is associated with brain atrophy and hypometabolism in the ADNI cohort. Neurology. (2016) 87:595–600. doi: 10.1212/WNL.0000000000002950
17. Marseglia A, Fratiglioni L, Kalpouzos G, Wang R, Backman L, Xu W. Prediabetes and diabetes accelerate cognitive decline and predict microvascular lesions: a population-based cohort study. Alzheimers Dement. (2019) 15:25–33. doi: 10.1016/j.jalz.2018.06.3060
18. Reitz C, Guzman VA, Narkhede A, DeCarli C, Brickman AM, Luchsinger JA. Relation of dysglycemia to structural brain changes in a multiethnic elderly cohort. J Am Geriatr Soc. (2017) 65:277–85. doi: 10.1111/jgs.14551
19. Roberts RO, Knopman DS, Przybelski SA, Mielke MM, Kantarci K, Preboske GM, et al. Association of type 2 diabetes with brain atrophy and cognitive impairment. Neurology. (2014) 82:1132–41. doi: 10.1212/WNL.0000000000000269
20. Saczynski JS, Siggurdsson S, Jonsson PV, Eiriksdottir G, Olafsdottir E, Kjartansson O, et al. Glycemic status and brain injury in older individuals: the age gene/environment susceptibility-Reykjavik study. Diabetes Care. (2009) 32:1608–13. doi: 10.2337/dc08-2300
21. Tiehuis AM, van der Graaf Y, Mali WP, Vincken K, Muller M, Geerlings MI, et al. Metabolic syndrome, prediabetes, and brain abnormalities on mri in patients with manifest arterial disease: the SMART-MR study. Diabetes Care. (2014) 37:2515–21. doi: 10.2337/dc14-0154
22. van Agtmaal MJM, Houben A, de Wit V, Henry RMA, Schaper NC, Dagnelie PC, et al. Prediabetes is associated with structural brain abnormalities: the maastricht study. Diabetes Care. (2018) 41:2535–43. doi: 10.2337/dc18-1132
23. American Diabetes Association. 2. Classification and diagnosis of diabetes. Diabetes Care. (2016) 39:S13–22. doi: 10.2337/dc16-S005
24. Matthews DR, Hosker JP, Rudenski AS, Naylor BA, Treacher DF, Turner RC. Homeostasis model assessment: insulin resistance and beta-cell function from fasting plasma glucose and insulin concentrations in man. Diabetologia. (1985) 28:412–9. doi: 10.1007/BF00280883
25. Lee JH, Lee KU, Lee DY, Kim KW, Jhoo JH, Kim JH, et al. Development of the Korean version of the Consortium to establish a registry for Alzheimer's Disease Assessment Packet (CERAD-K): clinical and neuropsychological assessment batteries. J Gerontol B Psychol Sci Soc Sci. (2002) 57:P47–53. doi: 10.1093/geronb/57.1.P47
26. Lee DY, Lee KU, Lee JH, Kim KW, Jhoo JH, Kim SY, et al. A normative study of the CERAD neuropsychological assessment battery in the Korean elderly. J Int Neuropsychol Soc. (2004) 10:72–81. doi: 10.1017/S1355617704101094
27. Matlab. MATLAB and Statistics Toolbox Release. Natick, MA: The MathWorks Inc. (2014). Available online at: http://www.mathworks.com
28. Garcia-Casares N, Jorge RE, Garcia-Arnes JA, Acion L, Berthier ML, Gonzalez-Alegre P, et al. Cognitive dysfunctions in middle-aged type 2 diabetic patients and neuroimaging correlations: a cross-sectional study. J Alzheimers Dis. (2014) 42:1337–46. doi: 10.3233/JAD-140702
29. Buckner RL. The cerebellum and cognitive function: 25 years of insight from anatomy and neuroimaging. Neuron. (2013) 80:807–15. doi: 10.1016/j.neuron.2013.10.044
30. Stoodley CJ. The cerebellum and cognition: evidence from functional imaging studies. Cerebellum. (2012) 11:352–65. doi: 10.1007/s12311-011-0260-7
31. Pomytkin I, Costa-Nunes JP, Kasatkin V, Veniaminova E, Demchenko A, Lyundup A, et al. Insulin receptor in the brain: mechanisms of activation and the role in the CNS pathology and treatment. CNS Neurosci Ther. (2018) 24:763–74. doi: 10.1111/cns.12866
32. Biessels GJ, Reagan LP. Hippocampal insulin resistance and cognitive dysfunction. Nat Rev Neurosci. (2015) 16:660–71. doi: 10.1038/nrn4019
33. Ryu SY, Coutu JP, Rosas HD, Salat DH. Effects of insulin resistance on white matter microstructure in middle-aged and older adults. Neurology. (2014) 82:1862–70. doi: 10.1212/WNL.0000000000000452
34. Willette AA, Xu G, Johnson SC, Birdsill AC, Jonaitis EM, Sager MA, et al. Insulin resistance, brain atrophy, and cognitive performance in late middle-aged adults. Diabetes Care. (2013) 36:443–9. doi: 10.2337/dc12-0922
35. Antony S, Peeyush Kumar T, Mathew J, Anju TR, Paulose CS. Hypoglycemia induced changes in cholinergic receptor expression in the cerebellum of diabetic rats. J Biomed Sci. (2010) 17:7. doi: 10.1186/1423-0127-17-7
36. Manor B, Newton E, Abduljalil A, Novak V. The relationship between brain volume and walking outcomes in older adults with and without diabetic peripheral neuropathy. Diabetes Care. (2012) 35:1907–12. doi: 10.2337/dc11-2463
37. Chen Z, Li L, Sun J, Ma L. Mapping the brain in type II diabetes: voxel-based morphometry using DARTEL. Eur J Radiol. (2012) 81:1870–6. doi: 10.1016/j.ejrad.2011.04.025
38. Hsu JL, Chen YL, Leu JG, Jaw FS, Lee CH, Tsai YF, et al. Microstructural white matter abnormalities in type 2 diabetes mellitus: a diffusion tensor imaging study. Neuroimage. (2012) 59:1098–105. doi: 10.1016/j.neuroimage.2011.09.041
39. Moran C, Phan TG, Chen J, Blizzard L, Beare R, Venn A, et al. Brain atrophy in type 2 diabetes: regional distribution and influence on cognition. Diabetes Care. (2013) 36:4036–42. doi: 10.2337/dc13-0143
40. Reijmer YD, Brundel M, de Bresser J, Kappelle LJ, Leemans A, Biessels GJ, et al. Microstructural white matter abnormalities and cognitive functioning in type 2 diabetes: a diffusion tensor imaging study. Diabetes Care. (2013) 36:137–44. doi: 10.2337/dc12-0493
41. Xiong Y, Sui Y, Xu Z, Zhang Q, Karaman MM, Cai K, et al. A diffusion tensor imaging study on white matter abnormalities in patients with type 2 diabetes using tract-based spatial statistics. AJNR Am J Neuroradiol. (2016) 37:1462–9. doi: 10.3174/ajnr.A4740
42. Zhang D, Qi F, Gao J, Yan X, Wang Y, Tang M, et al. Altered cerebellar-cerebral circuits in patients with type 2 diabetes mellitus. Front Neurosci. (2020) 14:571210. doi: 10.3389/fnins.2020.571210
43. Liu J, Liu T, Wang W, Ma L, Ma X, Shi S, et al. Reduced gray matter volume in patients with type 2 diabetes mellitus. Front Aging Neurosci. (2017) 9:161. doi: 10.3389/fnagi.2017.00161
44. Zhang Y, Zhang X, Zhang J, Liu C, Yuan Q, Yin X, et al. Gray matter volume abnormalities in type 2 diabetes mellitus with and without mild cognitive impairment. Neurosci Lett. (2014) 562:1–6. doi: 10.1016/j.neulet.2014.01.006
45. Hou YC, Lai CH, Wu YT, Yang SH. Gray matter alterations and correlation of nutritional intake with the gray matter volume in prediabetes. Medicine. (2016) 95:e3956. doi: 10.1097/MD.0000000000003956
46. Simmons WK, Avery JA, Barcalow JC, Bodurka J, Drevets WC, Bellgowan P. Keeping the body in mind: insula functional organization and functional connectivity integrate interoceptive, exteroceptive, and emotional awareness. Hum Brain Mapp. (2013) 34:2944–58. doi: 10.1002/hbm.22113
47. Marzelli MJ, Mazaika PK, Barnea-Goraly N, Hershey T, Tsalikian E, Tamborlane W, et al. Neuroanatomical correlates of dysglycemia in young children with type 1 diabetes. Diabetes. (2014) 63:343–53. doi: 10.2337/db13-0179
48. Fang F, Lue LF, Yan S, Xu H, Luddy JS, Chen D, et al. RAGE-dependent signaling in microglia contributes to neuroinflammation, Abeta accumulation, and impaired learning/memory in a mouse model of Alzheimer's disease. FASEB J. (2010) 24:1043–55. doi: 10.1096/fj.09-139634
49. Ashburner J, Friston KJ. Why voxel-based morphometry should be used. Neuroimage. (2001) 14:1238–43. doi: 10.1006/nimg.2001.0961
Keywords: diabetes, prediabetes, dysglycemia, brain structure, white matter integrity, cognition
Citation: Oh DJ, Jung J-J, Shin SA, Kim H, Park S, Sohn BK, Koo BK, Moon MK, Kim YK and Lee J-Y (2021) Brain Structural Alterations, Diabetes Biomarkers, and Cognitive Performance in Older Adults With Dysglycemia. Front. Neurol. 12:766216. doi: 10.3389/fneur.2021.766216
Received: 01 September 2021; Accepted: 30 September 2021;
Published: 28 October 2021.
Edited by:
Erwin Lemche, King's College London, United KingdomReviewed by:
Jim Wan, University of Tennessee Health Science Center (UTHSC), United StatesAlexandra Economou, National and Kapodistrian University of Athens, Greece
Copyright © 2021 Oh, Jung, Shin, Kim, Park, Sohn, Koo, Moon, Kim and Lee. This is an open-access article distributed under the terms of the Creative Commons Attribution License (CC BY). The use, distribution or reproduction in other forums is permitted, provided the original author(s) and the copyright owner(s) are credited and that the original publication in this journal is cited, in accordance with accepted academic practice. No use, distribution or reproduction is permitted which does not comply with these terms.
*Correspondence: Yu Kyeong Kim, eWszMTgxQHNudS5hYy5rcg==; Jun-Young Lee, YmVuamlAc251LmFjLmty
†These authors have contributed equally to this work and share first authorship