 Xinjie Chen1†
 Xiaoxiao Zhao2,3†
 Fan Xu4†
 Mingjin Guo5
 Yifan Yang6
 Lianmei Zhong2,3
 Xiechuan Weng7*
 Xiaolei Liu2,3*
- 1Department of Neurology, The First Affiliated Hospital of Dali University, Dali, China
- 2Department of Neurology, The First Affiliated Hospital of Kunming Medical University, Kunming, China
- 3Yunnan Provincial Clinical Research Center for Neurological Diseases, Kunming, China
- 4Department of Public Health, Chengdu Medical College, Chengdu, China
- 5Department of Vascular Surgery, The Affiliated Hospital of Qingdao University, Qingdao, China
- 6Department of Pain Medicine, Peking University Peoples Hospital, Beijing, China
- 7Department of Neuroscience, Beijing Institute of Basic Medical Sciences, Beijing, China
Objective: To evaluate and compare the predictive value of Face, Arm, Speech Test (FAST) and Balance, Eyes, Face, Arm, Speech, Time (BEFAST) scale in the acute ischemic stroke (AIS).
Methods: We searched Medline and Ovid databases for relevant literature in the English language. There were no limitations on the date. The sensitivity, specificity, likelihood ratio, and diagnostic odds ratio were pooled for meta-analysis. The symmetric receiver operator characteristic curve and Fagan's Nomogram were drawn, and meta-regression and subgroup analysis were used to explore the source of heterogeneity.
Results: A total of 9 studies, including 6,151 participants, were analyzed. The combined sensitivity of FAST was 0.77 [95% CI (0.64–0.86)], specificity was 0.60 [95% CI (0.38–0.78)], the area under the ROC curve was 0.76, and the diagnostic ratio was 1.57, while the sensitivity of BEFAST was 0.68 [95% CI (0.23–0.93)], specificity was 0.85 [95% CI (0.72–0.92)], the area under the ROC curve was 0.86, and the diagnostic odds ratio was 2.44. No publication bias was detected in Deeks' funnel plot. For FAST, meta-regression analysis showed that the prospective design, satisfactory description of the index test, and a broad spectrum of disease contributed to the heterogeneity in sensitivity, while no sources contributed to the heterogeneity in sensitivity. When the pretest probability was set as 20%, the posterior probability in Fagan's Nomogram was 32%; however, when the pretest probability was set as 20% in BEFAST, the posterior probability in Fagan's Nomogram was 52%.
Conclusions: Our findings indicated that FAST and BEFAST might be useful in the diagnosis of acute ischemic stroke. The diagnostic value of BEFAST in acute ischemic stroke was higher than in FAST; thus, it might have an important role in the fast recognition of acute ischemic stroke.
Introduction
Stroke is one of the most common acute and severe diseases presented to an emergency department (ED). Stroke is a major global burden, with 10.3 million new strokes and 113 million disability-adjusted life years (DALYs) per year worldwide (1). It can be divided into transient ischemic attack (TIA), ischemic stroke (IS), hemorrhagic stroke (HS), and subarachnoid hemorrhage. Acute ischemic stroke (AIS) can have serious lifelong consequences. In contrast to HS, significantly improved survival in IS patients has been reported since the early 2000s (2). Therefore, early recognition of stroke is of utmost importance. Rapid recognition of stroke warning signs is a crucial factor in the acute treatment of stroke. Prehospital stroke scales are helpful to guide the prehospital selection of people suspected of having a stroke (3). The screening tools can develop to help the public recognize stroke early. Earlier and improved stroke detection by ED and ambulance may reduce treatment delays (4).
Insufficient knowledge on stroke among the general public may lead to serious consequences. Several screening tools, including the Cincinnati Prehospital Stroke Scale (CPSS), Face, Arm, Speech Test (FAST), Los Angeles Prehospital Stroke, Screen (LAPSS), Melbourne Ambulance Stroke Screen (MASS), Medic Prehospital Assessment for Code Stroke (Med PACS) and Recognition of Stroke in the Emergency Room score (ROSIER), which are characterized by simple, structured, and easy-to-use stroke recognition scores, have been developed to help the public identify if a person is having an acute stroke so as to facilitate rapid access to medical care. Among these scales, the FAST provides the highest sensitivity with 85%. However, the available stroke recognition scores have a huge variety of length and complexity, which complicates choosing the optimal score in the emergency setting (5). Furthermore, it is truly difficult to compare the reported diagnostic accuracies of recognition scores. The FAST fails to detect 40% of those with posterior circulation events, especially those with ataxia and visual disturbances (6). A previous study showed that “FAST” failed in 14% of AIS patients (7).
BEFAST (Balance, Eyes, Face, Arm, Speech, Time), which was previously studied to determine whether adding gait or visual abnormalities to the FAST scale would improve stroke detection rates, revealed statistically lower Sensitivity for the detection of AIS in the inpatient population compared with the ED (8). However, a prospective study in 2018 has shown that BEFAST assessment does not improve stroke detection in the prehospital setting (4).
It is necessary to improve the accuracy of scales. This systematic review and meta-analysis aimed to explore the diagnostic value of the FAST and BEFAST for AIS patients; a quantitative reference for clinical practice was provided.
Methods
Search Strategy
Two reviewers (CXJ and ZXX) independently searched the PubMed, Embase, and Cochrane libraries for all the relevant publications published thus far. We chose the keywords “stroke,” “ischemic stroke,” and “hemorrhagic stroke” as text words and MeSH terms to identify related studies, language, region, or publication type. The search was limited to published clinical studies. Search terms are listed as follows:
1. (FAST)[Title/Abstract]
2. (BEFAT)[Title/Abstract]
3. 1 OR 2
4. (“stroke” or “ischemic stroke” or “hemorrhagic stroke”) [Title/Abstract]
5. 3 AND 4
6. From 2011 to 2021
Inclusion and Exclusion Criteria
Inclusion criteria were: (1) all types of strokes; (2) included FAST or/and BEFAST; (3) clinical study; (4) published within past 10 years; and (5) published in the English language.
Exclusion criteria were: (1) no described outcomes; (2) no control groups; (3) impossible to find original paper; and (4) the sensitivity, specificity (Sp), positive predictive value, and negative predictive value cannot be extracted.
Data Extraction
Two authors (CXJ and ZXX) independently extracted the demographic data and treatment information, and if a disagreement occurred, a third author (XF) was involved. Baseline information extracted from 9 studies contained the first author name, year of publication, title, design type, study subjects (number, age, male/female ratio), disease degree, and length of the disease. Besides, the primary outcomes included True positives (Tp), False positives (Fp), False negatives (Fn), true negatives (Tn) with FAST and BEFAST.
Quality Assessment
The Agency for Healthcare Research and Quality (AHRQ) was used to rate the methodological quality of cross-sectional studies. An item was scored with “0” if it was answered “NO” or “UNCLEAR”; if it was answered “YES,” then it was scored “1.” Article quality was assessed as follows: low quality = 0–3; moderate-quality = 4–7; and high quality = 8–11. The quality of studies was assessed by using the Newcastle Ottawa scale (NOS), which generated a maximum of nine stars for each study, including four stars for the selection of participants, two stars for the comparability of participants, and three stars for the assessment of outcomes. Quality was assigned according to the final scores, where 7–9 stars indicated high quality, 4–6 stars for middle quality, and 0–3 stars for low quality (9).
Statistical Analysis
Stata 15.0 software (Stata Corp 4905 Lakeway Drive, College Station, TX, USA) was used to perform a meta-analysis. The bivariate model was used to calculate the combined Sensitivity (Se), Specificity (Sp), the positive likelihood ratio (PLR), the negative likelihood ratio (NLR), and diagnostic odds ratio (DOR), and to draw the symmetric receiver operator characteristic curve (SROC) so as to estimate the total diagnostic accuracy. Pre-test probabilities may be estimated from routine data, practice data, or clinical judgment. Post-test probabilities are used to determine whether the probability of diagnosis has raised or fallen, compared with pre-test probabilities. The heterogeneity was assessed by Cochrane's Q statistics (chi-square), or inverse variance (I2). I2 <50% and p > 0.1 indicated that these studies could be considered as homogeneous by using a fixed-effect model; otherwise, I2 ≥ 50%, p <0.10, the random effect model, was used for meta-analysis. If heterogeneity among studies was recorded, the potential source of heterogeneity was investigated via meta-regression. A p value <0.05 was considered statistically significant.
Results
Flowchart and Study Quality
A total of 7,690 papers with FAST and BEFAST (including documents, reviews, animal experiments, case reports, and repeated studies) were retrieved from each database. After 1,825 duplicate records were removed, the full text of the remaining 5,865 studies was read. Among those studies, 201 were excluded because the articles were reviews, meta-analyses, or case reports, while 5,642 studies did not have related titles and abstracts. The full text of the remaining 21 studies was read, and 12 studies were removed due to incomplete data. The remaining 9 papers were extracted from the corresponding data according to the data extraction requirements. Seven studies used the FAST; one study used the BEFAST and one study used the FAST and BEFAST. The literature screening process is shown in Figure 1. The basic characteristics and inclusive and exclusive criteria of each included study are shown in Tables 1, 2.
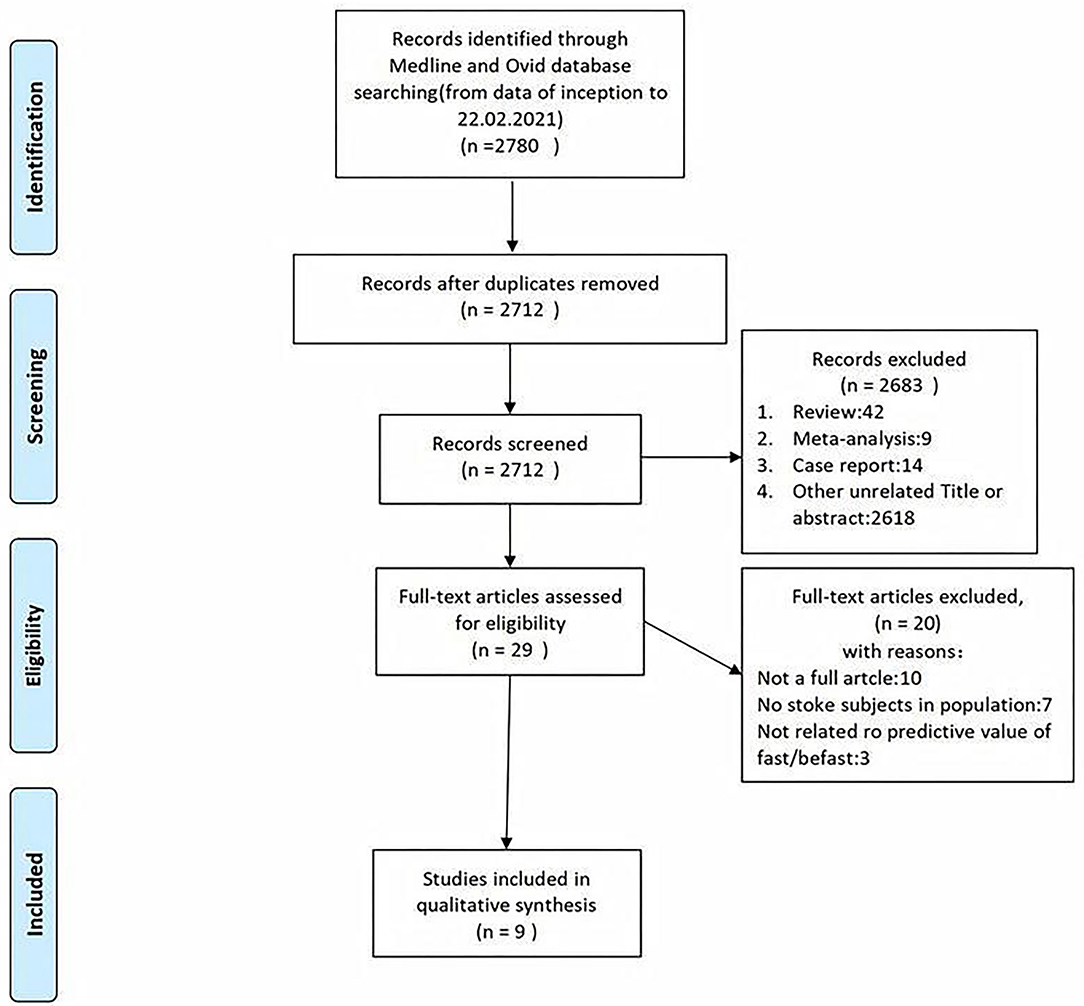
Figure 1. The literature with Face Arm Speech Test (FAST) and Balance, Eyes, Face, Arm, Speech, Time (BEFAST) screening process of the meta-analysis.
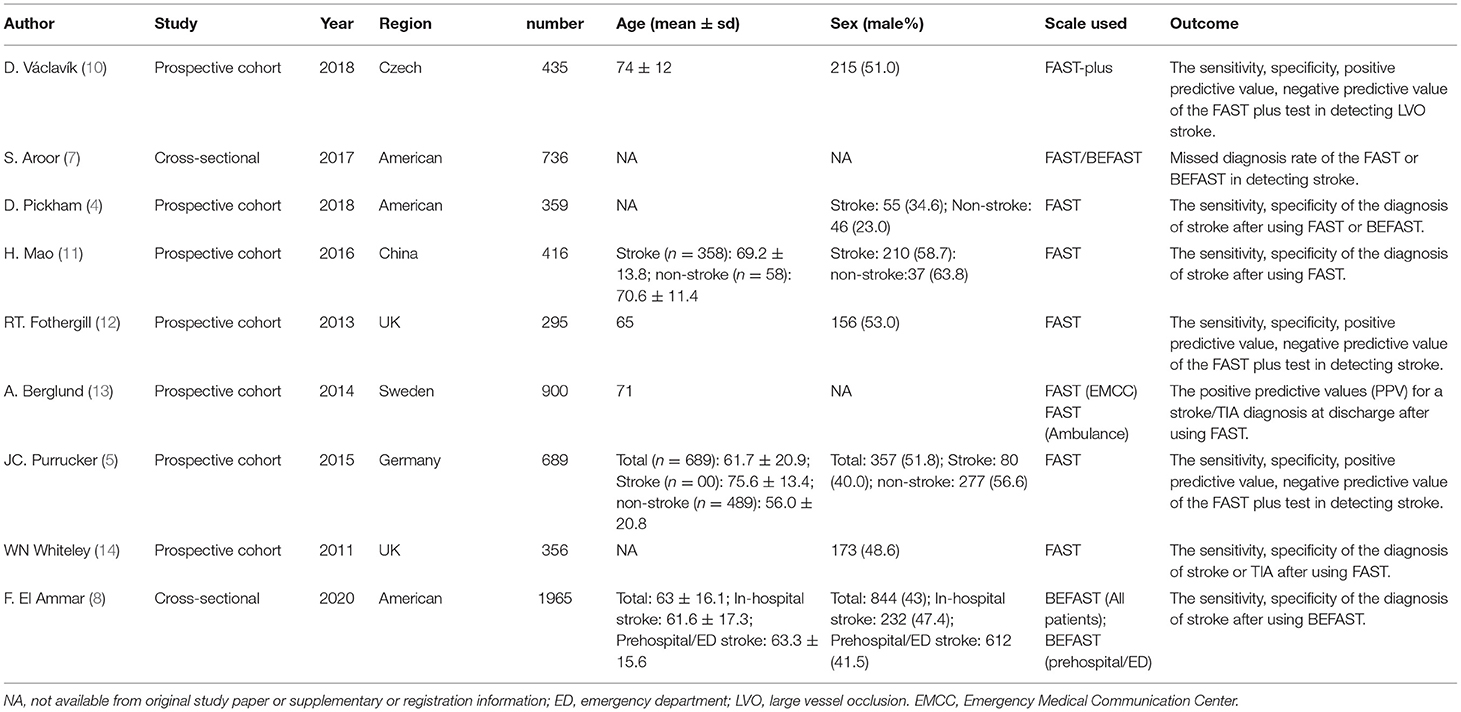
Table 1. Basic characteristics of enrolled studies.
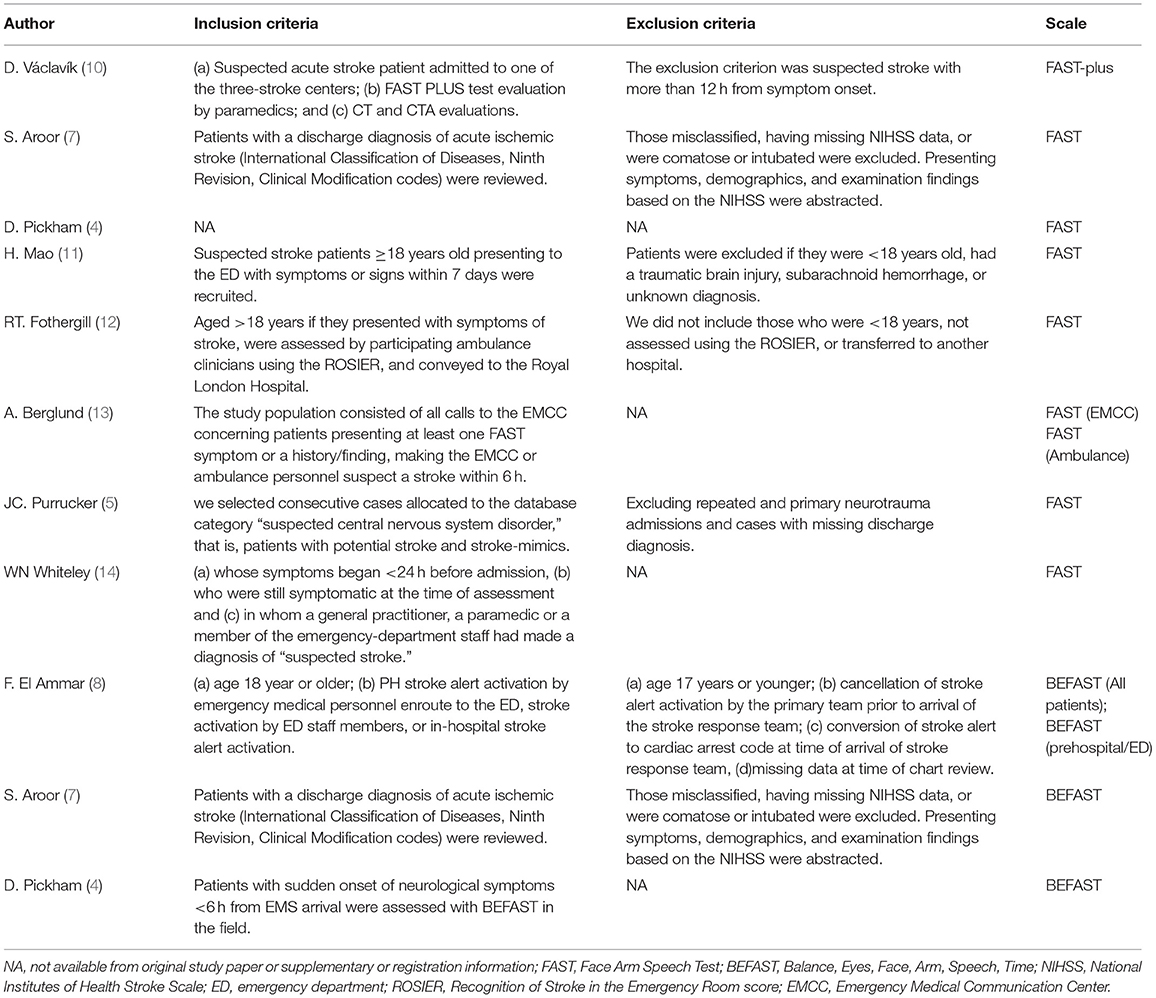
Table 2. Inclusion and exclusion criteria.
FAST Against AIS
The combined Se of FAST in AIS was 0.77 [95% CI (0.64, 0.86)], Sp was 0.60 [95% CI (0.38, 0.78)], PLR was 1.90 [95% CI (1.18, 3.04)], NLR was 0.39 [95% CI (0.25, 0.61)], area under ROC curve was 0.76, and DOR was 4.82, which indicated the FAST had a medium value in the screen of AIS. As all heterogeneity was I2 > 50%, the random model was used. The details of the combined Se and Sp forest plot are shown in Figure 2A, the combined likelihood ratio forest plot in Figure 2B, and the combined diagnosis ratio forest plot in Figure 2C.
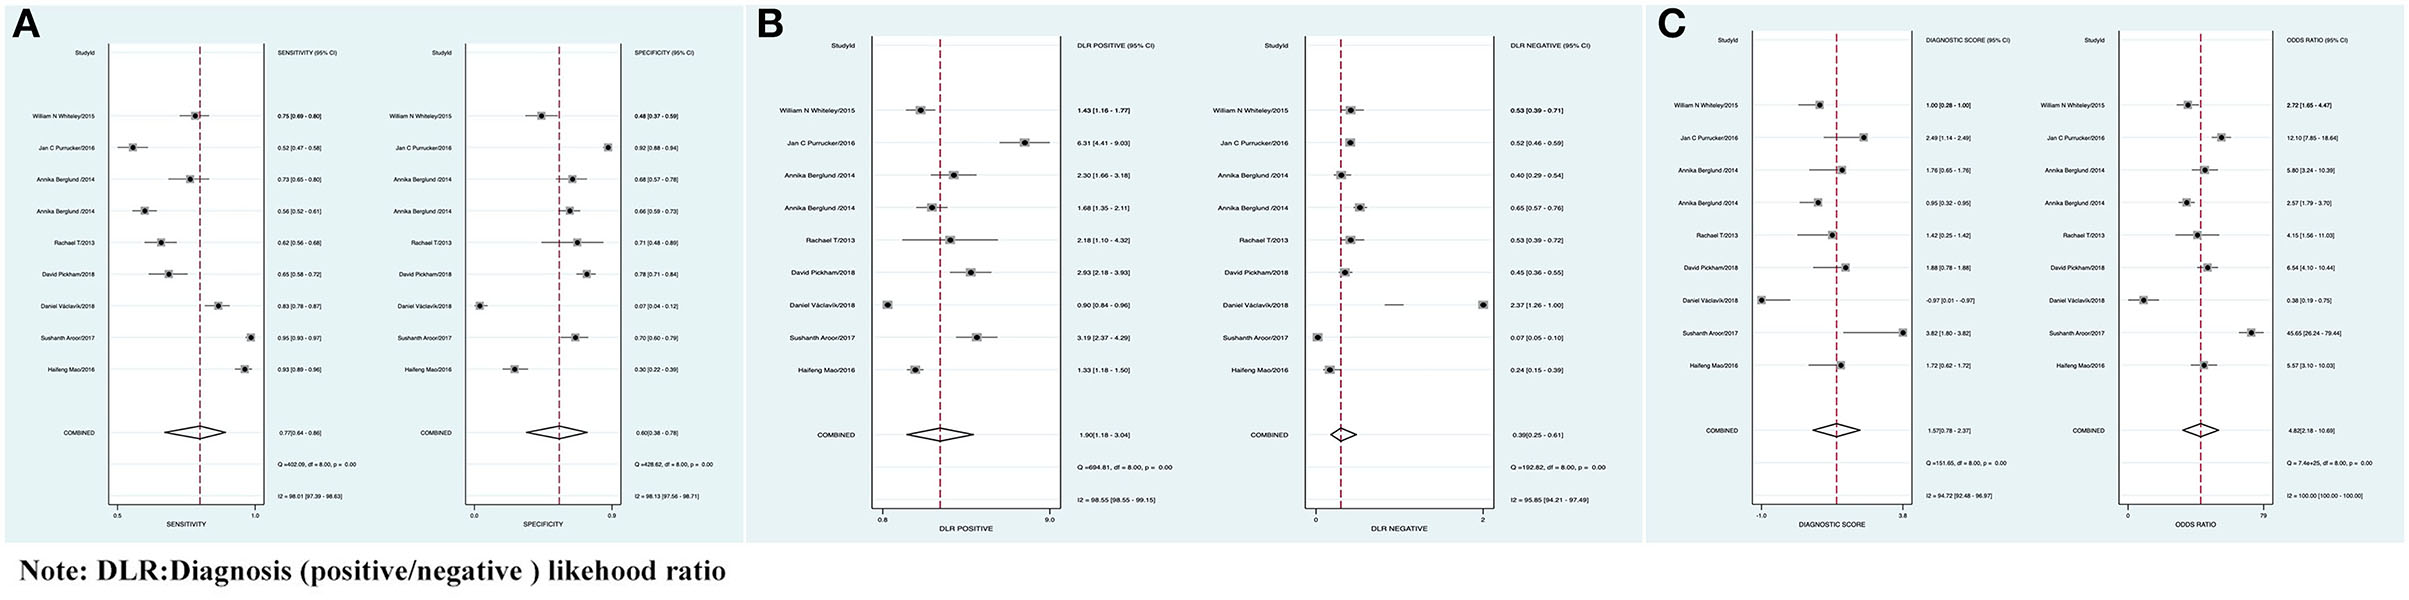
Figure 2. (A) Forest plot of sensitivity (Se) and specificity (Sp) of FAST in the diagnosis of acute ischemic stroke (AIS). (B) Forest plot of diagnosis (positive/negative) likehood ratio (DLR) positive and negative of AIS. (C) Forest map of the diagnostic odds ratio (DOR) of FAST in the diagnosis of AIS.
Publication Bias
The linear regression was used to test funnel asymmetry so as to evaluate publication bias. The results showed no asymmetry, while the linear regression test p was 0.82, which indicated no publication bias, as shown in Figure 3.
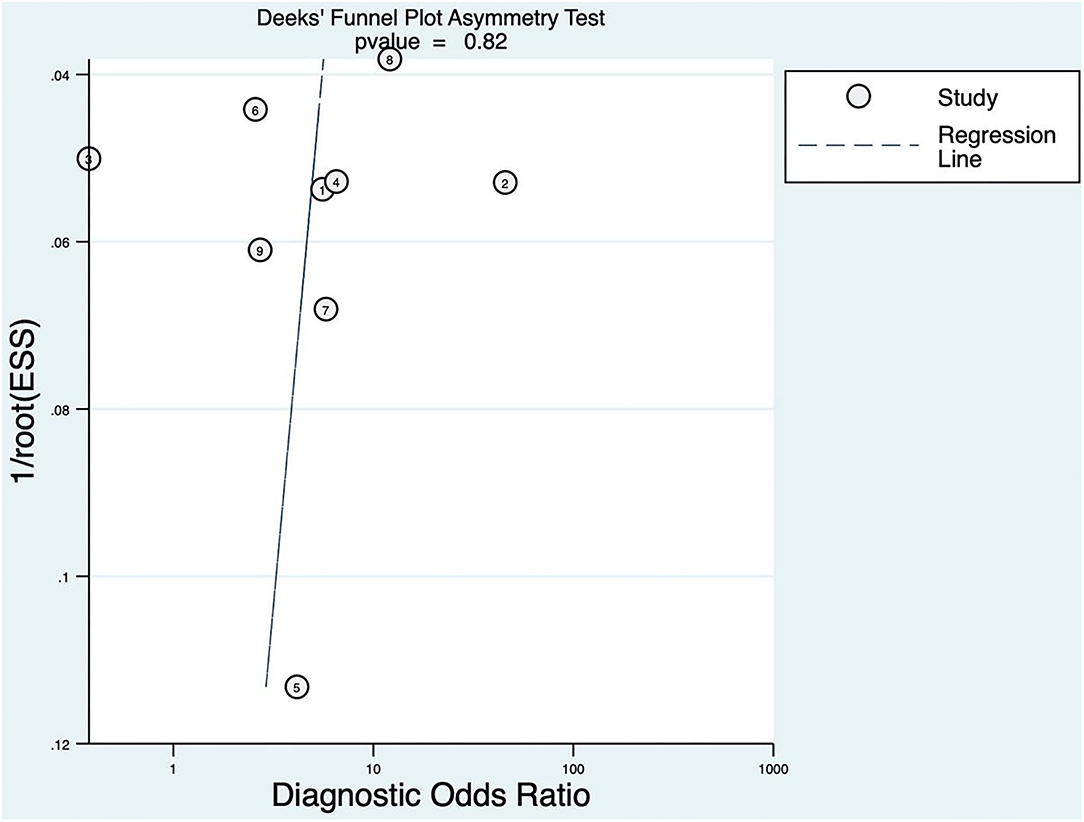
Figure 3. Deeks' funnel plot asymmetry test for FAST.
Threshold Effect
The SROC curve plane test was used to threshold effect. However, there was no typical “shoulder arm” found, indicating no threshold effect. Moreover, Cochran's Q value was 59.49, and the p was <0.05, which indicated that the heterogeneity was caused by the non-threshold effect. A moderate diagnostic value could be concluded by the value of the area under the SROC curve (AUC), which was 0.76 [95% CI (0.72–0.79)], as shown in Figure 4.
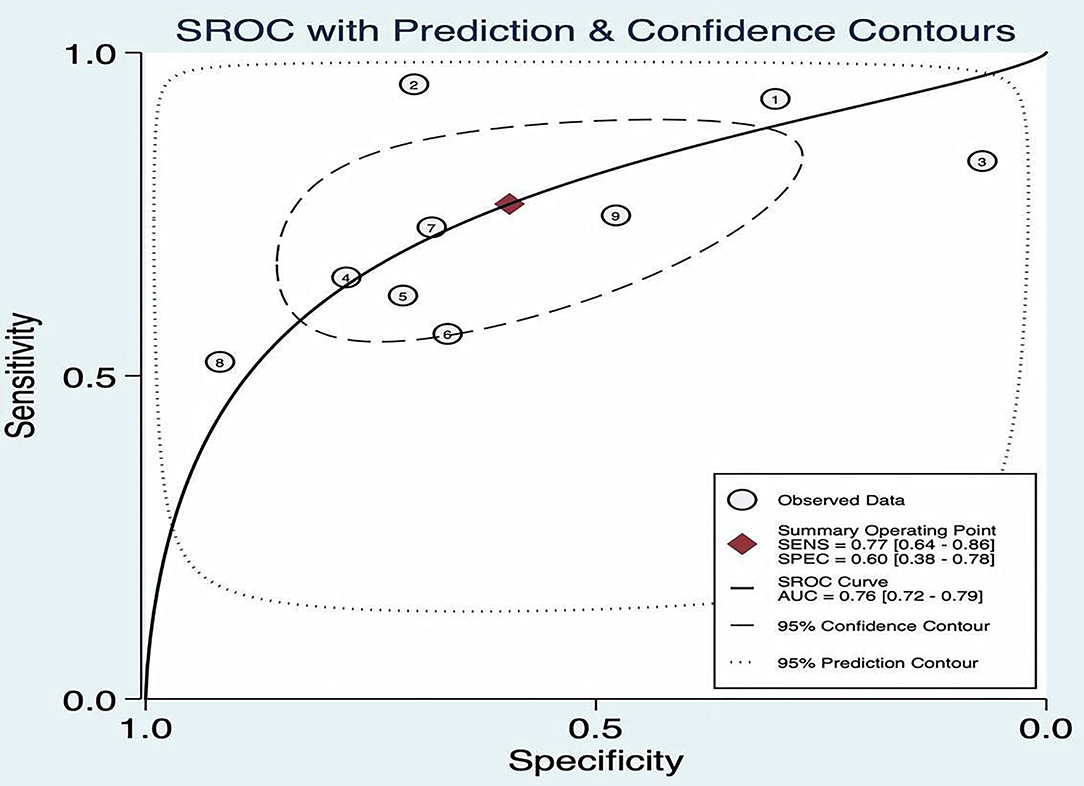
Figure 4. Summary receiver operating characteristic (ROC) of FAST.
Meta-Regression and Subgroup Analysis
In this study, we evaluated the factors that may affect the heterogeneity, such as non-threshold effect, prospective design (prodesign), satisfactory description of index test (testdescr), an adequate description of study subjects (subjdescr), satisfactory description of ref test (refdescr), report, a broad spectrum of disease (brdspect), and whether the test results were evaluated by a blind method. The meta-regression analysis of the above factors revealed that although the sources of heterogeneity of Se were statistically related to the prodesign, testdescr, and brdspect, the sources of heterogeneity of Sp were not related to these factors, as shown in Figure 5.
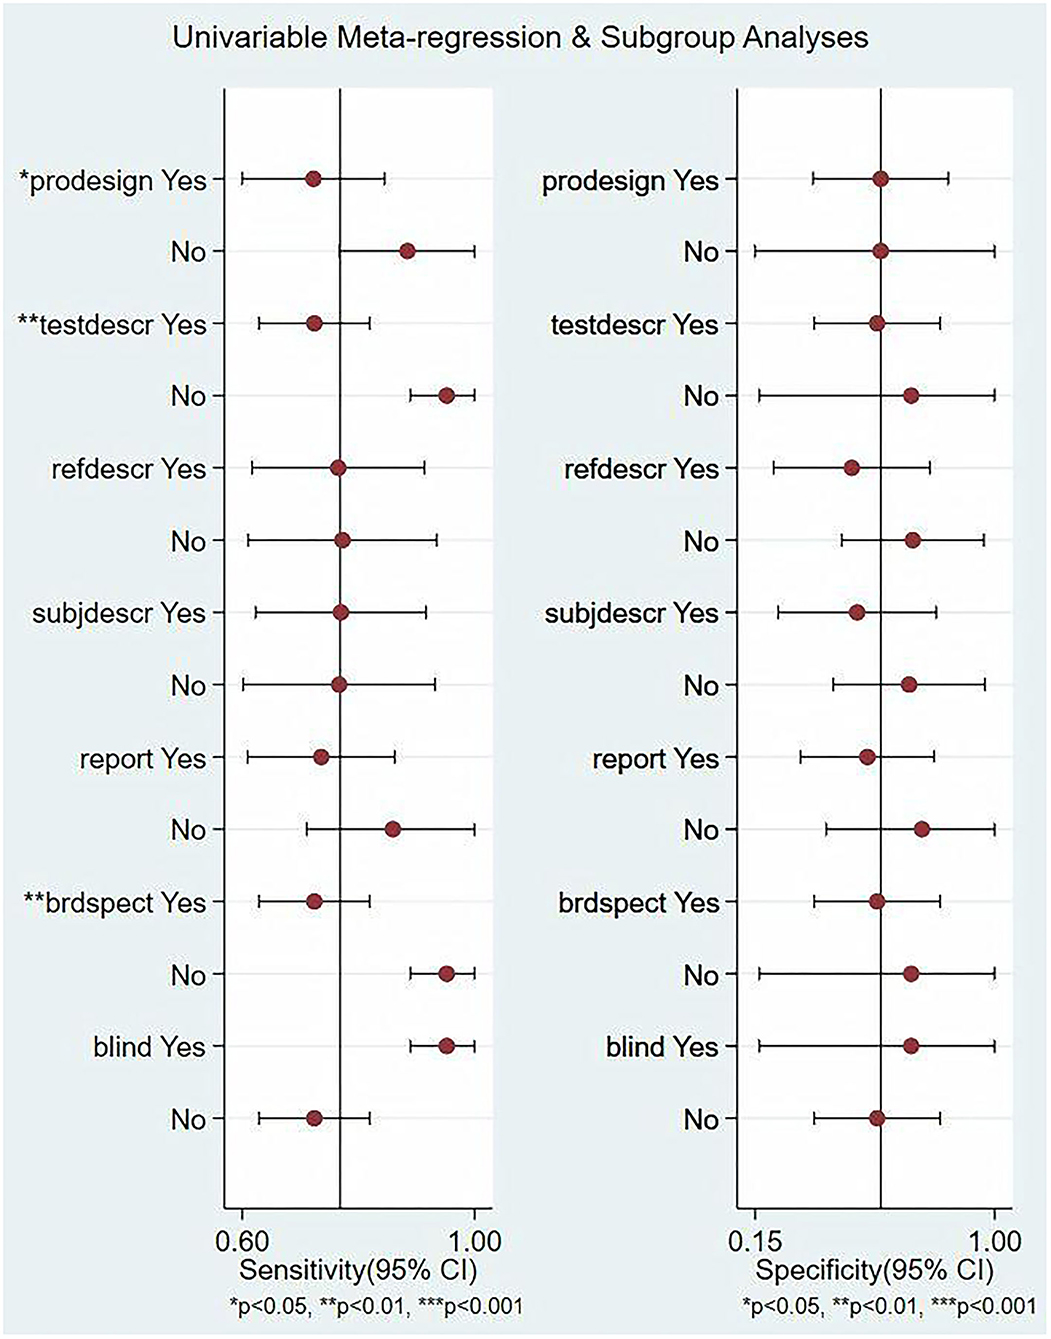
Figure 5. Single-factor meta-regression and subgroup analysis. Prospective design: prodesign, testdescr: satisfactory description of the index test, subjdescr: adequate description of study subjects, refdescr: satisfactory description of ref test, and brdspect: broad spectrum of disease1.
Pre-test Probability, Likelihood Ratio, and Post-test Probability
The Fagan graph was plotted to show the relationship among the prior probability, the likelihood ratio, and the posterior probability. The pretest probability was 20%, and the post-test probability of AIS was 32%. In addition, the PLR was <10 (PLR = 1.90), and the NLR was >0.1(NLR = 0.39), indicating that the diagnosis can neither be confirmed nor excluded. Their diagnostic value of FAST in AIS was limited, as shown in Figure 6.
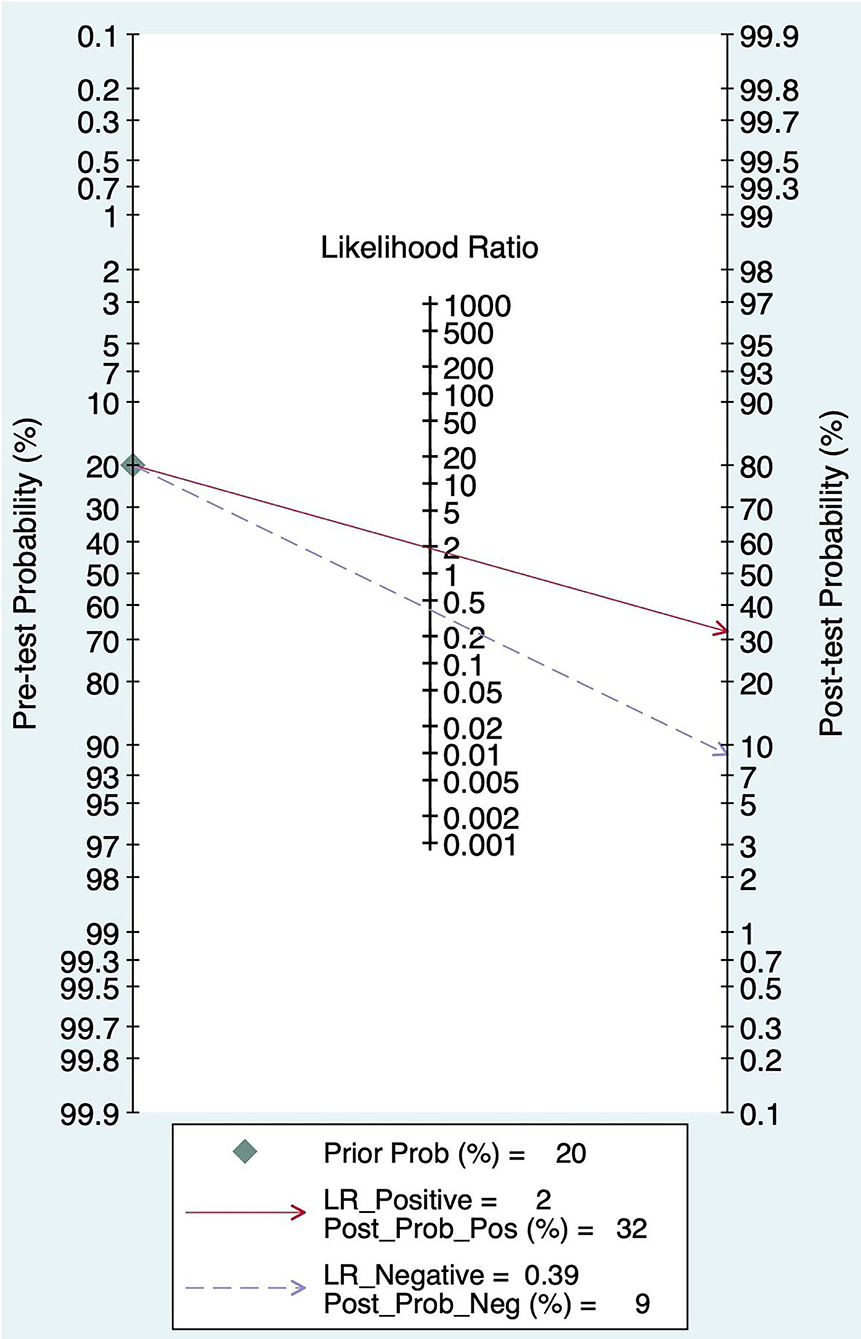
Figure 6. Fagan diagram of FAST in the diagnosis of AIS.
BEFAST Against AIS
The combined Se was 0.68 [95% CI (0.23, 0.93)], Sp was 0.85 [95% CI (0.72, 0.92)], PLR was 4.41 [95% CI (3.48, 5.58)], NLR was 0.38 [95% CI (0.12, 1.25)], AUC was 0.86, and DOR was 11.49, which indicated that the BEFAST had a medium value in the screening of AIS. All heterogeneity was I2 > 50%; therefore, the random model was used in Figure 7.
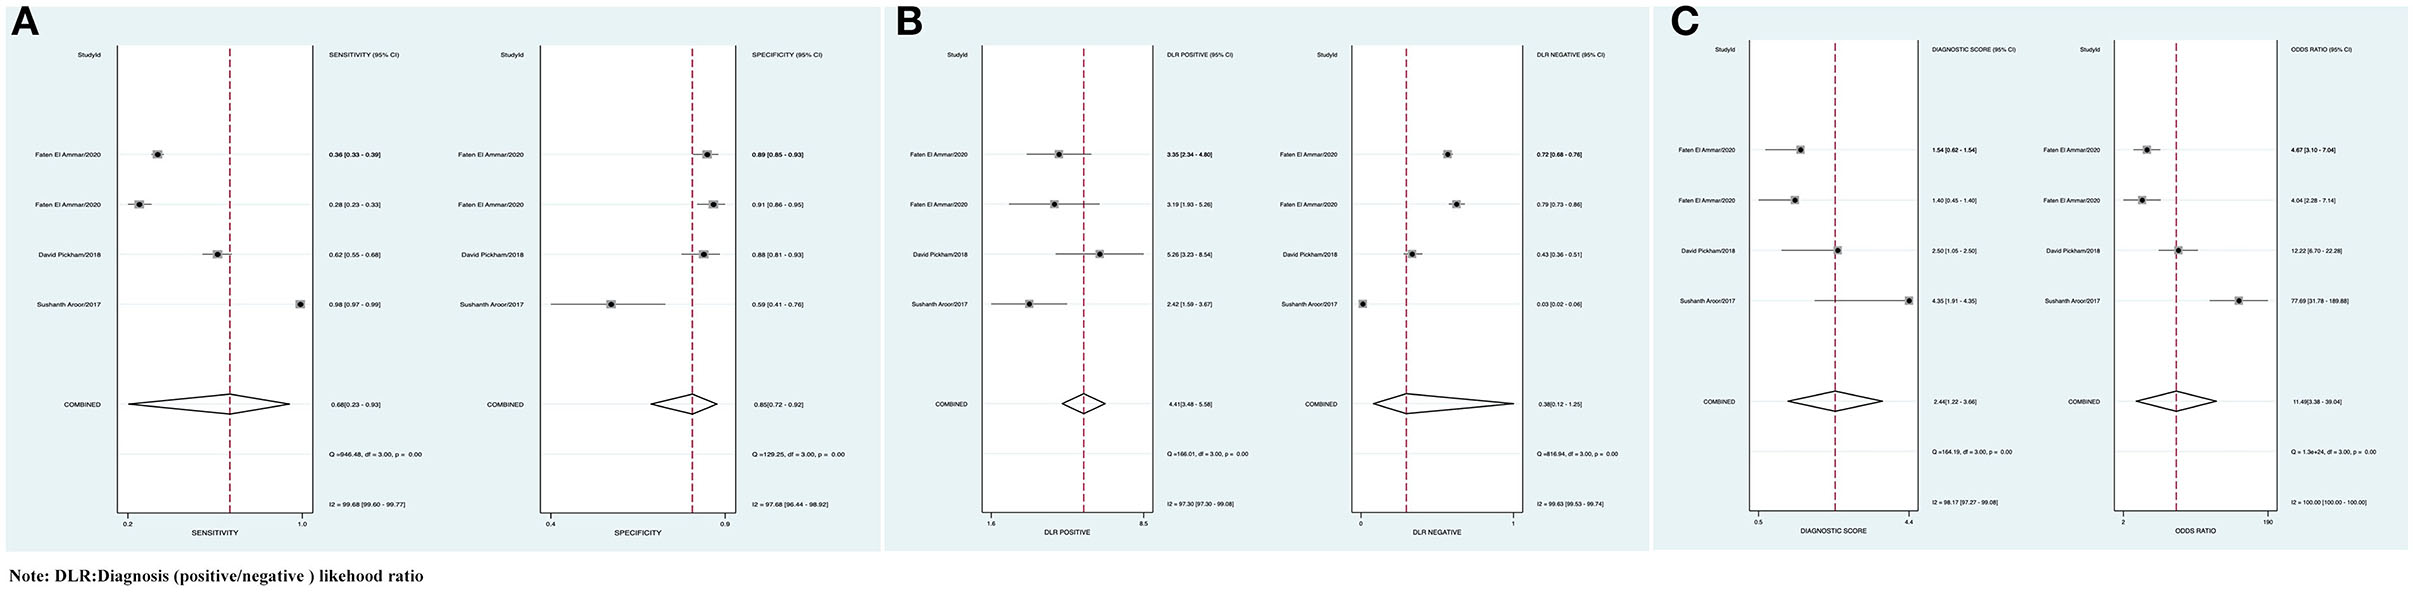
Figure 7. (A) Forest plot of Se and Sp of BEFAST in the diagnosis of AIS. (B) Forest plot of diagnosis (positive/negative) likehood ratio (DLR) positive and negative of AIS. (C) Forest map of the DOR of BEFAST in the diagnosis of AIS.
Publication Bias
The p of Deeks' funnel plot asymmetry test was 0.09 (p > 0.05). There was no evidence of publication bias; the details are shown in Figure 8.
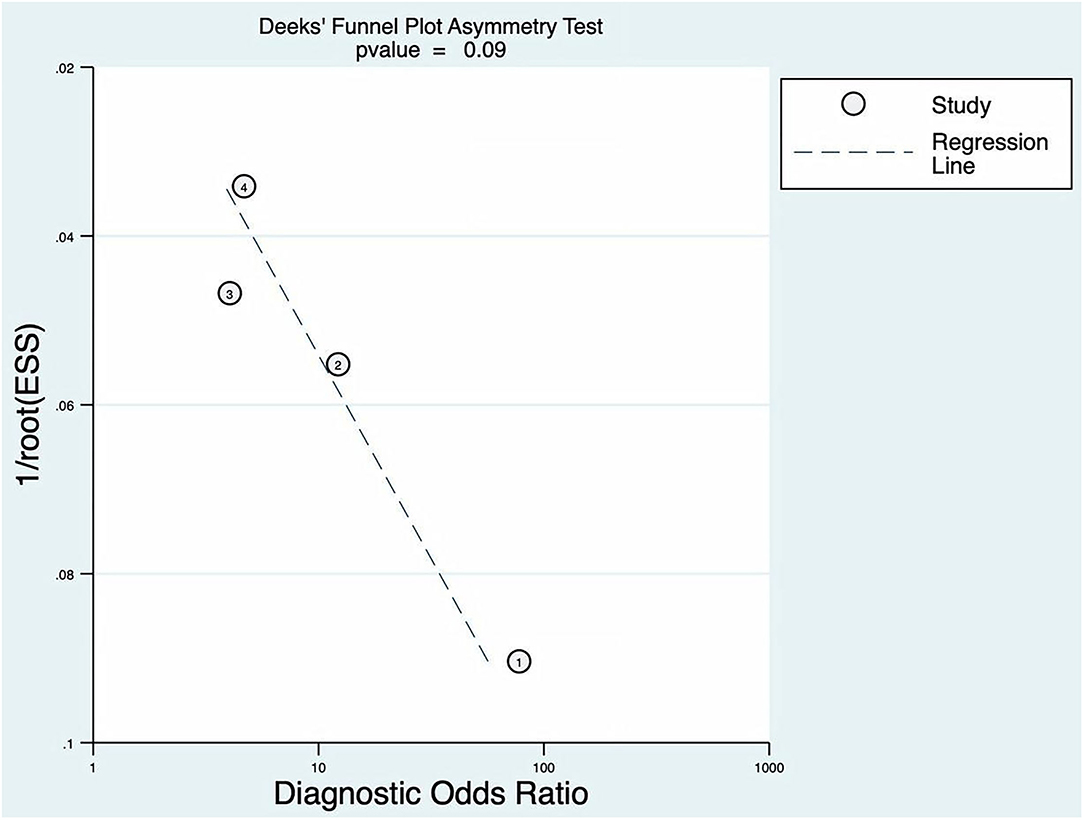
Figure 8. Deeks' funnel plot asymmetry test for BEFAST.
Threshold Effect
The threshold effect was assessed by the SROC curve plane test. As no typical “shoulder arm” was found, there was no threshold effect. A moderate diagnostic value was concluded by the value of the AUC, which was 0.86 [95% CI (0.83–0.89)]; details are shown in Figure 9.
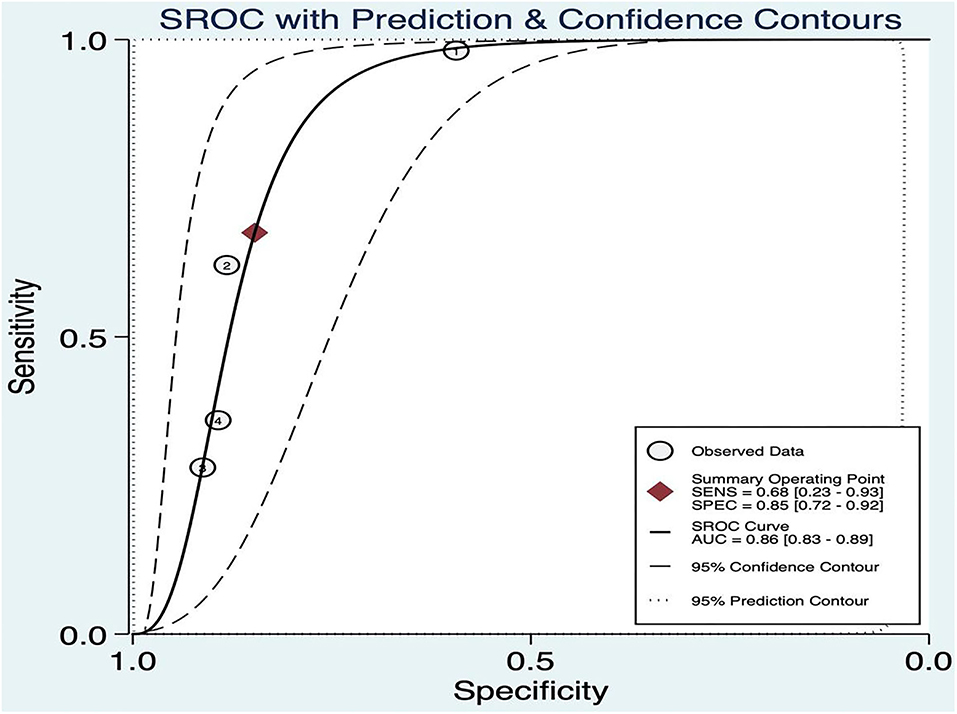
Figure 9. Summary ROC of BEFAST.
Pre-test Probability, Likelihood Ratio, and Post-test Probability
The pretest probability was 20%, and the probability of AIS was 52%. In addition, the PLR was <10 (PLR = 4.41), and the NLR was >0.1(NLR = 0.38), which indicated that the diagnosis could be neither confirmed nor excluded. Their diagnostic value of BEFAST in AIS was also limited; details are shown in Figure 10.
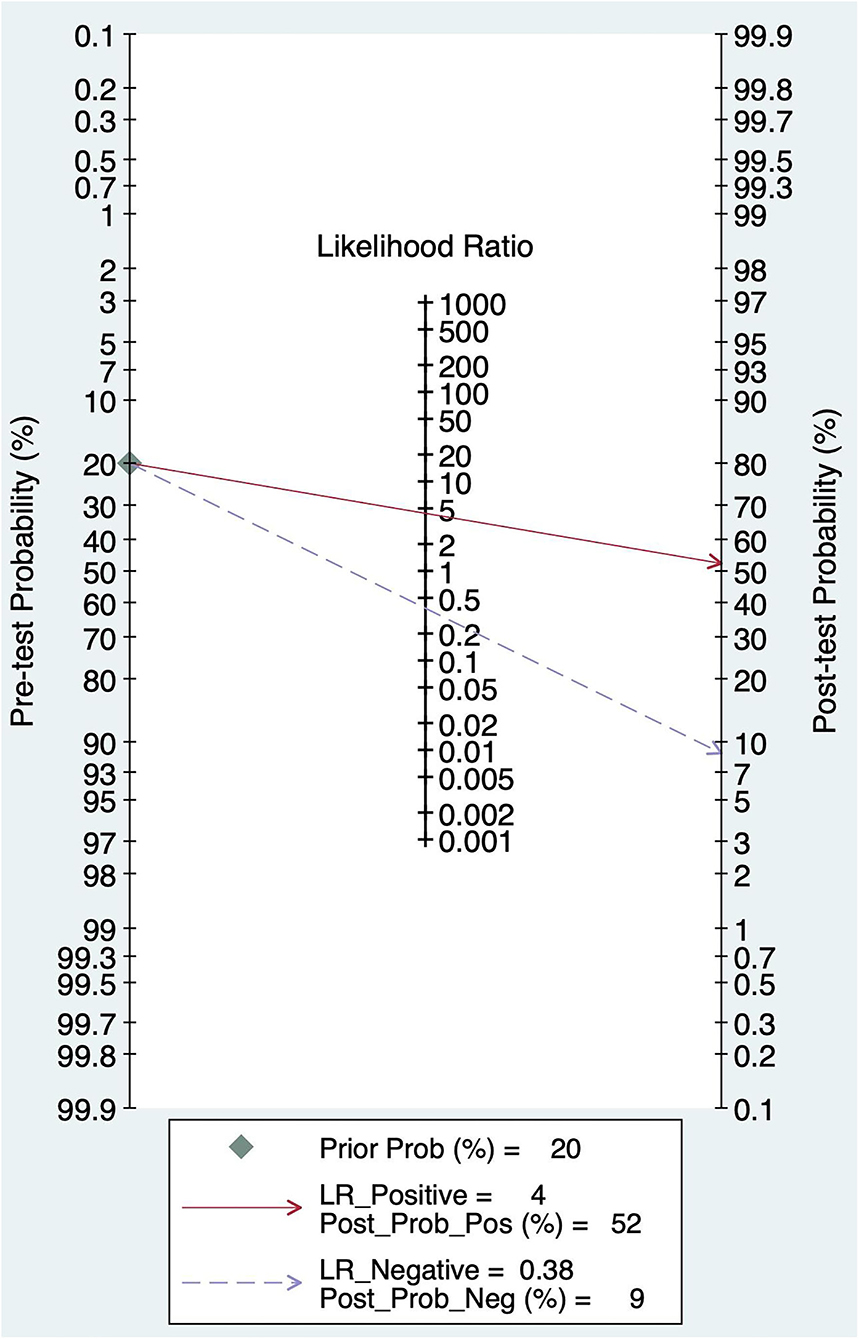
Figure 10. Fagan diagram of BEFAST in the diagnosis of AIS.
Comparison of FAST, BEFAST, and FAST in Combination With BEFAST
Comparison of FAST, BEFAST, and FAST in combination with BEFAST was performed using ROC, Se, and Sp analysis. Among them, the BEFAST had the best diagnostic value; details are shown in Table 3.
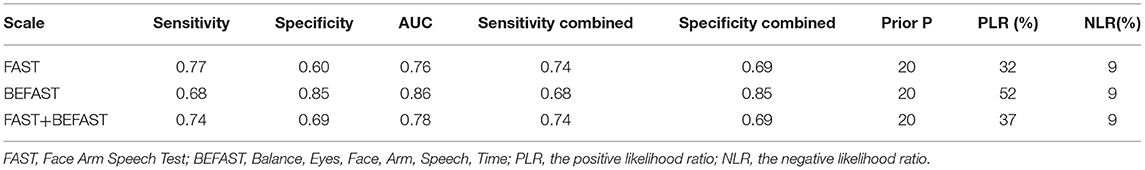
Table 3. Diagnostic performance of FAST, BEFAST, and FAST in combination with BEFAST.
Quality of All Studies
For prospective studies, the NOS scores varied from 6 to7 stars (Table 4A). For cross-sectional studies, the AHRQ scores varied from 4 to 6 (Table 4B).
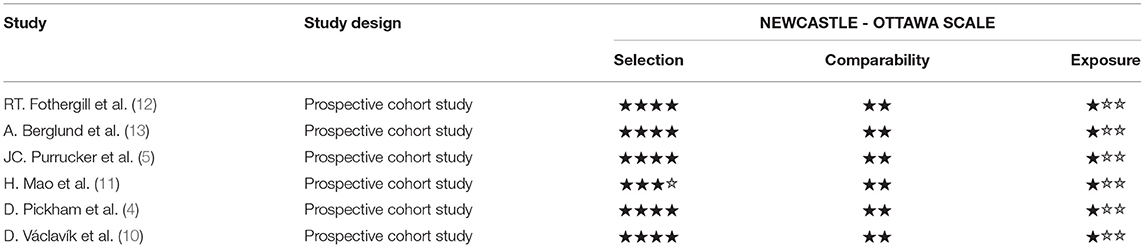
Table 4A. Methodological quality assessments of included observational studies by Newcastle Ottawa scale (NOS).
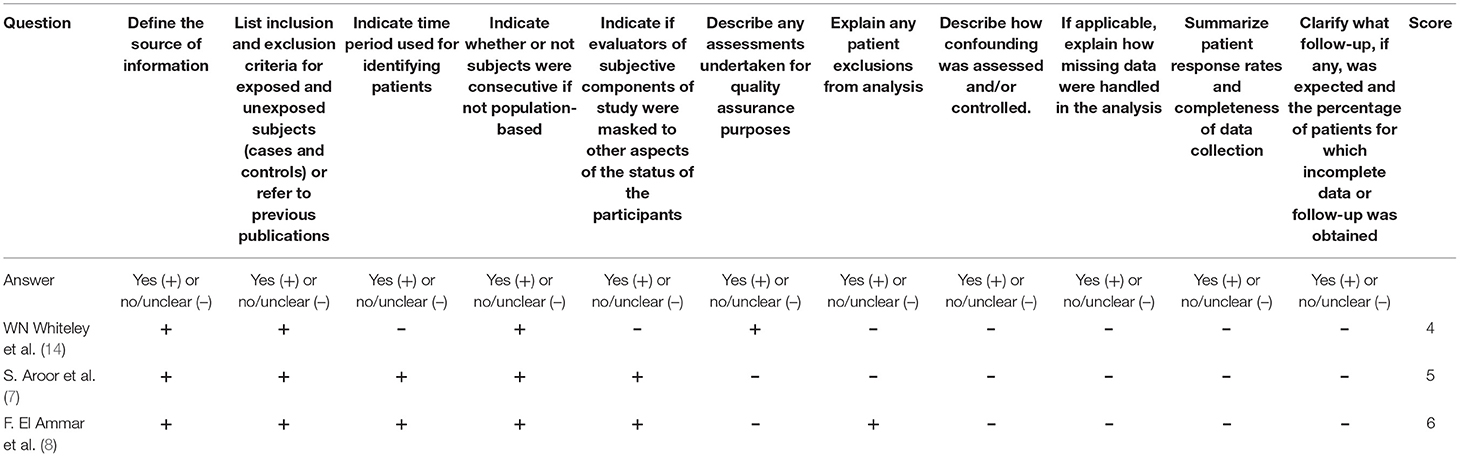
Table 4B. Methodological quality assessments of included cross-sectional studies by the Agency for Healthcare Research and Quality (AHRQ).
Discussion
The phrase “time is brain” highlights that human nervous tissue is rapidly and permanently lost as stroke progress and that therapeutic intervention should be emergently pursued. Nonetheless, <10% of patients with stroke in hospitals undergo emergency treatment within the thrombolytic time window (15). Currently, stroke is a major cause of death and disability. The mean lifetime cost of ischemic stroke per person, which includes inpatient care, rehabilitation, and follow-up care, is expensive and unaffordable (16). Meanwhile, it affects the quality of life of patients and their families. Therefore, early recognition and accurate diagnosis are of essential importance for a positive outcome. In 1998, the FAST included a rapid ambulance protocol to improve the rapid triage of patients suspected of an acute stroke at our acute stroke unit (ASU) (17). Recently, it has been recorded that the ambulance services most commonly use the FAST to assess patients suspected of stroke (12).
Over recent years, the prehospital stroke scales have become increasingly used to assess acute stroke. Among them, FAST has the highest diagnostic value, with 88.9% of identified stroke/TIA patients within our population. However, the FAST failed to detect 38% of posterior cerebral circulation strokes (18, 19). Posterior circulation stroke, which represents 20~25% of patients with IS, is associated with a greater risk of disability and death compared with anterior circulation strokes (4). The FAST showed the ability to identify 69–90% of strokes, but it missed up to 40% of those with posterior circulation events. Missed diagnosis rates improved with the addition of visual symptoms and limb ataxia. Therefore, “B” was added for balance and an “E” for eyes (7). In 2020, Ammar et al. performed a retrospective analysis of inpatients screened with the stroke alert system and a final diagnosis of AIS, who were candidates for reperfusion therapy, revealing the Se of BEFAST to be 83% (20).
There has been an increasing number of Systematic reviews and meta-analyses assessing the diagnostic performance of clinical assessment over recent years. The previous systemic review and meta-analysis have evaluated the diagnostic value of the current common stroke identification scales worldwide. In 2014, a Systematic review showed that prehospital stroke scales varied in their accuracy, missing up to 30% of acute strokes in the field through the evaluation of FAST, CPSS, MASS, LAPSS Ontario Prehospital Stroke Screening Tool (OPSS), and Med PACS for diagnostic value with stroke in urban environment (21). In 2019, the assessment of both cortical and motor function using the Rapid Arterial Occlusion Evaluation Scale (RACE), Field Assessment Stroke Triage for Emergency Destination (FAST-ED) and National Institute of Health stroke scale (NIHSS) showed the best diagnostic accuracy values for selecting subjects with large vessel occlusion (LVO) (22). In 2020, a systematic review and meta-analysis revealed that ROSIER was a valid scale with high clinical applicability (23). Even though numerous scales have emerged for assessing the stroke, only a few studies compared the Se and Sp between FAST and BEFAST.
Our results showed that the FAST had higher Se than BEFAST in detecting AIS. By contrast, BEFAST had a higher Sp than FAST. In general, BEFAST had the highest diagnostic value; however, FAST, as well as BEFAST, may be useful in the diagnosis of AIS. Previous studies found that 14% of patients with AIS would be missed using FAST alone, and this proportion was reduced to 4.4% with the addition of a history of gait and visual symptoms (BEFAST). Our results were consistent with previous reports (7).
Conclusion
Our findings indicated that FAST, as well as BEFAST, might be useful in the diagnosis of AIS; however, AIS could neither be confirmed nor excluded by the sole use of FAST or BEFAST. The diagnostic value of BEFAST in AIS was higher than FAST; thus, it might have an important role in the fast recognition of AIS. Nonetheless, it still remains unclear whether it could be applied for screening of all patients with stroke in the prehospital setting or in hospital, or whether the test characteristics of the FAST and BEFAST scales could be separately assessed for posterior and anterior circulation. Future prospective studies are needed to explore the diagnostic value of FAST and BEFAST in the anterior and posterior circulation, respectively, so as to improve the recognition rate of stroke, promote timely intervention, and reduce the burden on families and society.
Study Limitation
First, there was moderate heterogeneity across studies, meta-regression, and subgroup analysis fail output due to the limited BEFAST data. Second, few included studies did not explicitly exclude participants. Both shortcomings should be further investigated and addressed by future studies.
Data Availability Statement
The original contributions presented in the study are included in the article/supplementary material, further inquiries can be directed to the corresponding authors.
Author Contributions
XC: perform the literature screening, data extraction, data analysis, results representation, and drafting the manuscript for intellectual content. XL: statistical analysis, interpreted the data, and contributed to and revised the manuscript for intellectual content. XW: study initiate and contribute to and revised the manuscript for intellectual content. LZ and YY: revised the manuscript. MG: electronic search and articles election. FX: instruct the detail steps for groups and draft the manuscript. XZ: perform the literature screening, data extraction, data analysis, and results representation. All authors contributed to the article and approved the submitted version.
Funding
This work was supported by the National Natural Science Foundation of China, No. 8216050478 to XL, and 82073833 to XW; the Program from Yunnan Provincial Clinical Research Center for Neurological Diseases, No. 202002AA100204 to LZ and XL; the Basic Research Program of Yunnan Provincial Science and Technology Department, No. 202101AT070151, and 20190FE001(-222) to XL; Chengdu Science and Technology Bureau Focuses on Research and Development Support Plan, No. 2019-YF09-00097-SN to FX; the Popular Scientific Research Project of Sichuan Health Commission, No. 20PJ171; and the Yunnan education program, No. SYSX202036 to XL and FX.
Conflict of Interest
The authors declare that the research was conducted in the absence of any commercial or financial relationships that could be construed as a potential conflict of interest.
Publisher's Note
All claims expressed in this article are solely those of the authors and do not necessarily represent those of their affiliated organizations, or those of the publisher, the editors and the reviewers. Any product that may be evaluated in this article, or claim that may be made by its manufacturer, is not guaranteed or endorsed by the publisher.
Acknowledgments
We would like to give our special thanks to Dr. Liang Chen for providing valuable suggestions on the meta-analysis.
Footnotes
1. ^The following variables used to adjust whether included studied met these criteria.
References
1. Pandian JD, Gall SL, Kate MP, Silva GS, Akinyemi RO, Ovbiagele BI. Prevention of stroke: a global perspective. Lancet. (2018) 392:1269–78. doi: 10.1016/S0140-6736(18)31269-8
2. Waziry R, Heshmatollah A, Bos D, Chibnik LB, Ikram MA, Hofman A. Time trends in survival following first hemorrhagic or ischemic stroke between 1991 and 2015 in the Rotterdam study. Stroke. (2020) 51:Strokeaha119027198. doi: 10.1161/STROKEAHA.119.027198
3. Duvekot MHC, Venema E, Rozeman AD, Moudrous W, Vermeij FH, Biekart M. Comparison of eight prehospital stroke scales to detect intracranial large-vessel occlusion in suspected stroke (PRESTO): a prospective observational study. Lancet Neurol. (2021) 20:213–21. doi: 10.1016/S1474-4422(20)30439-7
4. Pickham D, Valdez A, Demeestere J, Lemmens R, Diaz L, Hopper S. Prognostic value of BEFAST vs. FAST to identify stroke in a prehospital setting. Prehosp Emerg Care. (2019) 23:195–200. doi: 10.1080/10903127.2018.1490837
5. Purrucker JC, Hametner C, Engelbrecht A, Bruckner T, Popp E, Poli S. Comparison of stroke recognition and stroke severity scores for stroke detection in a single cohort. J Neurol Neurosurg Psychiatry. (2015) 86:1021–8. doi: 10.1136/jnnp-2014-309260
6. Huwez F, Casswell EJ. FAST-AV or FAST-AB tool improves the sensitivity of FAST screening for detection of posterior circulation strokes. Int J Stroke. (2013) 8:E3. doi: 10.1111/ijs.12008
7. Aroor S, Singh R, Goldstein LB. BE-FAST (balance, eyes, face, arm, speech, time): reducing the proportion of strokes missed using the FAST mnemonic. Stroke. (2017) 48:479–81. doi: 10.1161/STROKEAHA.116.015169
8. El Ammar F, Ardelt A, Del Brutto VJ, Loggini A, Bulwa Z, Martinez RC. BE-FAST: a sensitive screening tool to identify in-hospital acute ischemic stroke. J Stroke CerebrovascDis. (2020) 29:104821. doi: 10.1016/j.jstrokecerebrovasdis.2020.104821
9. Nunes KP, Labazi H, Webb RC. New insights into hypertension-associated erectile dysfunction. Curr Opin Nephrol Hypertens. (2012) 21:163–70. doi: 10.1097/MNH.0b013e32835021bd
10. Václavík D, Bar M, Klečka L, Holeš D, Cábal M, Mikulík R. Prehospital stroke scale (FAST PLUS Test) predicts patients with intracranial large vessel occlusion. Brain Behav. (2018) 8:e01087. doi: 10.1002/brb3.1087
11. Mao H, Lin P, Mo J, Li Y, Chen X, Rainer TH. Development of a new stroke scale in an emergency setting. BMC Neurol. (2016) 16:168. doi: 10.1186/s12883-016-0695-z
12. Fothergill RT, Williams J, Edwards MJ, Russell IT, Gompertz P. Does use of the recognition of stroke in the emergency room stroke assessment tool enhance stroke recognition by ambulance clinicians? Stroke. (2013) 44:3007–12. doi: 10.1161/STROKEAHA.13.000851
13. Berglund A, Svensson L, Wahlgren N, von Euler M. Face Arm Speech Time Test use in the prehospital setting, better in the ambulance than in the emergency medical communication center. Cerebrovasc Dis. (2014) 37:212–6. doi: 10.1159/000358116
14. Whiteley WN, Wardlaw JM, Dennis MS, Sandercock PA. Clinical scores for the identification of stroke and transient ischaemic attack in the emergency department: a cross-sectional study. J Neurol Neurosurg Psychiatry. (2011) 82:1006–10. doi: 10.1136/jnnp.2010.235010
15. Wu ZX, He MF, Li LD. Value of the use of the ROSIER scale in a Chinese emergency department. Chin J Crit Care Med. (2010) 30:219–22. doi: 10.3969/j.issn.1002-1949.2010.03.008
16. Stuntz M, Busko K, Irshad S, Paige T, Razhkova V, Coan T. Nationwide trends of clinical characteristics and economic burden of emergency department visits due to acute ischemic stroke. Open Access Emerg Med. (2017) 9:89–96. doi: 10.2147/OAEM.S146654
17. Nor AM, McAllister C, Louw SJ, Dyker AG, Davis M, Jenkinson D, et al. Agreement between ambulance paramedic- and physician-recorded neurological signs with Face Arm Speech Test (FAST) in acute stroke patients. Stroke. (2004) 35:1355–9. doi: 10.1161/01.STR.0000128529.63156.c5
18. Harbison J, Hossain O, Jenkinson D, Davis J, Louw SJ, Ford GA. Diagnostic accuracy of stroke referrals from primary care, emergency room physicians, and ambulance staff using the face arm speech test. Stroke. (2003) 34:71–6. doi: 10.1161/01.STR.0000044170.46643.5E
19. Kleindorfer DO, Miller R, Moomaw CJ, Alwell K, Broderick JP, Khoury J. Designing a message for public education regarding stroke: does FAST capture enough stroke? Stroke. (2007) 38:2864–8. doi: 10.1161/STROKEAHA.107.484329
20. Sacks D, Baxter B, Campbell BCV, Carpenter JS, Cognard C, Dippel D. Multisociety consensus quality improvement revised consensus statement for endovascular therapy of acute ischemic stroke. Int J Stroke. (2018) 13:612–32. doi: 10.1016/j.jvir.2017.11.026
21. Brandler ES, Sharma M, Sinert RH, Levine SR. Prehospital stroke scales in urban environments: a systematic review. Neurology. (2014) 82:2241–49. doi: 10.1212/WNL.0000000000000523
22. Antipova D, Eadie L, Macaden A, Wilson P. Diagnostic accuracy of clinical tools for assessment of acute stroke: a systematic review. BMC Emerg Med. (2019) 19:49. doi: 10.1186/s12873-019-0262-1
Keywords: stroke, acute stroke, FAST, BEFAST, meta-analysis, systematic review
Citation: Chen X, Zhao X, Xu F, Guo M, Yang Y, Zhong L, Weng X and Liu X (2022) A Systematic Review and Meta-Analysis Comparing FAST and BEFAST in Acute Stroke Patients. Front. Neurol. 12:765069. doi: 10.3389/fneur.2021.765069
Received: 26 August 2021; Accepted: 06 December 2021;
Published: 28 January 2022.
Edited by:
Peter Sporns, University Hospital of Basel, SwitzerlandReviewed by:
Seana Gall, University of Tasmania, AustraliaLiqiong Yang, Southwest Medical University, China
Copyright © 2022 Chen, Zhao, Xu, Guo, Yang, Zhong, Weng and Liu. This is an open-access article distributed under the terms of the Creative Commons Attribution License (CC BY). The use, distribution or reproduction in other forums is permitted, provided the original author(s) and the copyright owner(s) are credited and that the original publication in this journal is cited, in accordance with accepted academic practice. No use, distribution or reproduction is permitted which does not comply with these terms.
*Correspondence: Xiechuan Weng, d2VuZ3hjMjAwMEBzaW5hLmNvbQ==; Xiaolei Liu, cmluZ0B2aXAuMTYzLmNvbQ==
†These authors have contributed equally to this work