 Freja Fornander1
 Tuva Åsatun Solheim1
 Anne-Sofie Vibæk Eisum1Nanna Scharff Poulsen1Annarita Ghosh Andersen1Julia Rebecka Dahlqvist1
 Morten Dunø2
 John Vissing1*
- 1Department of Neurology, Copenhagen Neuromuscular Center, Rigshospitalet, University of Copenhagen, Copenhagen, Denmark
- 2Department of Clinical Genetics, Department of Neurology, Rigshospitalet, University of Copenhagen, Copenhagen, Denmark
Objective: To explore fat replacement, muscle strength, and clinical features in women heterozygous for a pathogenic DMD variant, we prospectively examined 53 women, assuming that some of these women—despite of the recessive X-linked inheritance—manifested clinical symptoms.
Methods: We performed a cross-sectional observational study using MRI and stationary dynamometry of lower extremities, extracted blood muscle biomarkers, and investigated subjective complaints. Results were compared with 19 healthy women.
Results: DMD variant carriers were weaker and had higher fat fractions than controls in all investigated muscle groups (p < 0.02). Fat fractions were 18% in carriers vs. 11% in controls in thighs (p = 0.008), and 15 vs. 11% in calf muscles (p = 0.032). Seventy-two percent had fat fractions deviating from controls by two standard deviations (SDs) in one or more of the 16 investigated muscle groups. On strength testing, 40% of the carriers had results deviating from control muscle strength by two SDs in one or more dynamometry assessments. Forty-three carriers (81%) had either reduced muscle strength (<2 SDs from control mean) and/or elevated muscle fat fraction (>2 SDs from control mean). Thirty of these had subjective symptoms. Blood creatine kinase and myoglobin were elevated in 57% of the carriers.
Conclusion: Using quantitative methods, this study shows that both clinically symptomatic and asymptomatic women with pathogenic DMD variants show a high prevalence of muscle affection. Longitudinal studies in female carriers of pathogenic DMD variants are needed to follow the evolution of these changes.
Introduction
Duchenne (DMD) and Becker (BMD) muscular dystrophies are two of the most common inherited disorders of muscle, caused by X-linked recessively inherited mutations in the dystrophin gene (DMD) (1, 2). The cytoskeletal protein dystrophin is needed for signaling and stabilizing the muscle cell structure, and if absent or decreased, it eventually leads to cell necrosis and replacement by fat and connective tissue (2).
Males are primarily affected, because of the X-linked inheritance. Approximately one in 5,000 boys are born with pathogenic DMD mutations (3, 4). The point prevalence of DMD is approximately 8.3/100,000 and 7.3/100,000 for BMD (5), making them two of the most common inherited disorders of muscle. Two-thirds of the pathogenic variants in affected boys are inherited from their mother, and one third are caused by de novo variants (2).
It is well-known that female carriers of a pathogenic DMD variant can be affected. In these carriers, the reported prevalence of muscular and/or cardiac symptoms is highly variable with rates of 2.5–84.3% (6–13). A prevalence of 0.43/100,000 manifesting female carriers was reported in Northern England (5).
Patients with dystrophinopathies experience progressive, proximal muscle weakness and atrophy, respiratory insufficiency, and cardiomyopathy. The symptoms are most severe in males with DMD, resulting in loss of ambulation usually before age 12 years. In BMD, the phenotype has a milder and wider spectrum of severity (1). In manifesting women, symptoms have been reported as ranging from mild myopathy and cardiomyopathy to DMD-like phenotypes, but most DMD variant carriers reportedly have no complaints or signs of muscle weakness (8, 11, 14, 15).
Skeletal muscle MRI is increasingly used as a tool to diagnose and characterize neuromuscular disease. In most muscular dystrophies, there is muscle atrophy and replacement of muscle tissue by fat (2). MRI can illustrate and quantify both muscle volume, cross-sectional area, and fat replacement of muscle (16–19).
Our objective with this study was to study potential muscle involvement in women with pathogenic DMD variants using a prospective, cross-sectional design, using quantitative assessments of MRI-based muscle fat fraction and muscle strength measures. By combining MRI and muscle strength results, it allowed us also to investigate muscle contractile properties.
Materials and Methods
Standard Protocol Approvals and Patient Consents
All participants gave their informed oral and written consent. Data handling and protocols were approved by the Danish Data Protection Agency and the National Committee of Health Research (H-16035677).
Subjects and Controls
Subjects were recruited via the Copenhagen Neuromuscular Clinic and Department of Clinical Genetics at the national hospital, Rigshospitalet. Invitations were sent by letter and included information about the study. Inclusion criteria were (i) women who were confirmed carriers of pathogenic variants in the DMD gene, and (ii) minimum 18 years of age for ethical approval reasons and because our department only sees adults. Exclusion criteria were contraindications for MRI (e.g., metal implants, pregnancy, claustrophobia).
Nineteen healthy women were used as controls to compare muscle fat fraction and strength in DMD variant carriers. The controls, who participated in a previous study (20) were recruited via the local community and investigated 2 years prior to the investigations of the female DMD variant carriers. MRIs in DMD variant carriers were performed and analyzed by F.Fo., while MRIs in healthy controls were performed and analyzed by J.R.D.
Genetic Testing
Subjects were identified, previous to the study, by segregation analysis performed in relation to a male relative with a confirmed dystrophinopathy. DNA was isolated from an EDTA blood sample by a standard method. Male probands were initially assessed with multiplex ligation-dependent probe amplification (MLPA) for detection of exonic deletions/duplications. If no quantitative aberration was detected, the entire coding and exon-flanking sequence of DMD was sequenced by a targeted next-generation sequencing approach (NGS) to a minimum depth of 100× in a clinical setting. Subsequent segregation analysis was performed through a mutation-specific analysis.
Assessments
Subjects underwent MRI, manual strength examination, dynamometry testing of lower-extremity muscles, and blood sampling for measurements of creatine kinase and myoglobin and were asked to report about subjective experiences of pain, weakness, and physical function. They also underwent cardiac investigations presented in an accompanying article in Frontiers in Neurology. Our primary outcomes presented here were lower-extremity muscle fat fraction and strength.
MRI Evaluations
We used a 3.0T Siemens (Erlangen, Germany) MAGNETOM Verio Tim System. Participants were positioned supine with a peripheral angio coil over their legs and a matrix coil over the pelvis. From three-dimensional localizers, T1-weighted and Dixon sequence images were taken. The same MRI protocol was used for both controls and carriers. It included axial T1-weighted images (field of view = 400–450 mm, slice thickness = 6.0 mm, distance factor = 20%, echo time = 19 ms, repetition time = 650 ms) and axial two-point Dixon sequences (field of view = 400–450 mm, slice thickness = 3.5 mm, distance factor = 0%, echo time = 2.45 and 3.675 ms, repetition time = 5.59 ms). Slices used for muscle segment outlining were acquired at 50% of the length of femur and 33% of the length of tibia. It has been established that the use of a single, cross-sectional slice is a representative basis for total muscle volume and fat infiltration calculations (21). To ensure that fat replacement was not a focal phenomenon, all T1-weighted scans were visually controlled at multiple slices. Fat fraction (FF) in the carriers was calculated using Osirix Lite (Pixmeo, Switzerland) and Horos (The Horos Project, Annapolis, MD, USA) MRI imaging software by manually segmenting three groups of the thigh (short head of biceps femoris excluded due to technical difficulties to outline the muscle) and five groups of the calves (Figure 1). Controls' FF was calculated in Siemens Syngo MR Workplace using Numaris/4 B17 software (Siemens AG, Munich, Germany). When outlining the muscle groups, visible fat around blood vessels, nerves, bone, and the peripheral muscle borders was excluded and the cross-sectional area and signals from fat and water were determined. Muscle FF was calculated: FF (%) = (signal fat/signal fat + water) × 100. Muscle FF was considered abnormal when it was higher than control mean + 2 standard deviations (SD). We calculated the fat-free, or contractile, cross-sectional area (CCSA, cm2): cross-sectional area × (1—fat fraction). Interrater variability analysis was performed in five healthy controls. Anterior, medial, and posterior muscle groups of the right and left thighs were outlined by F.Fo. and J.R.D, and differences in fat fractions were compared.
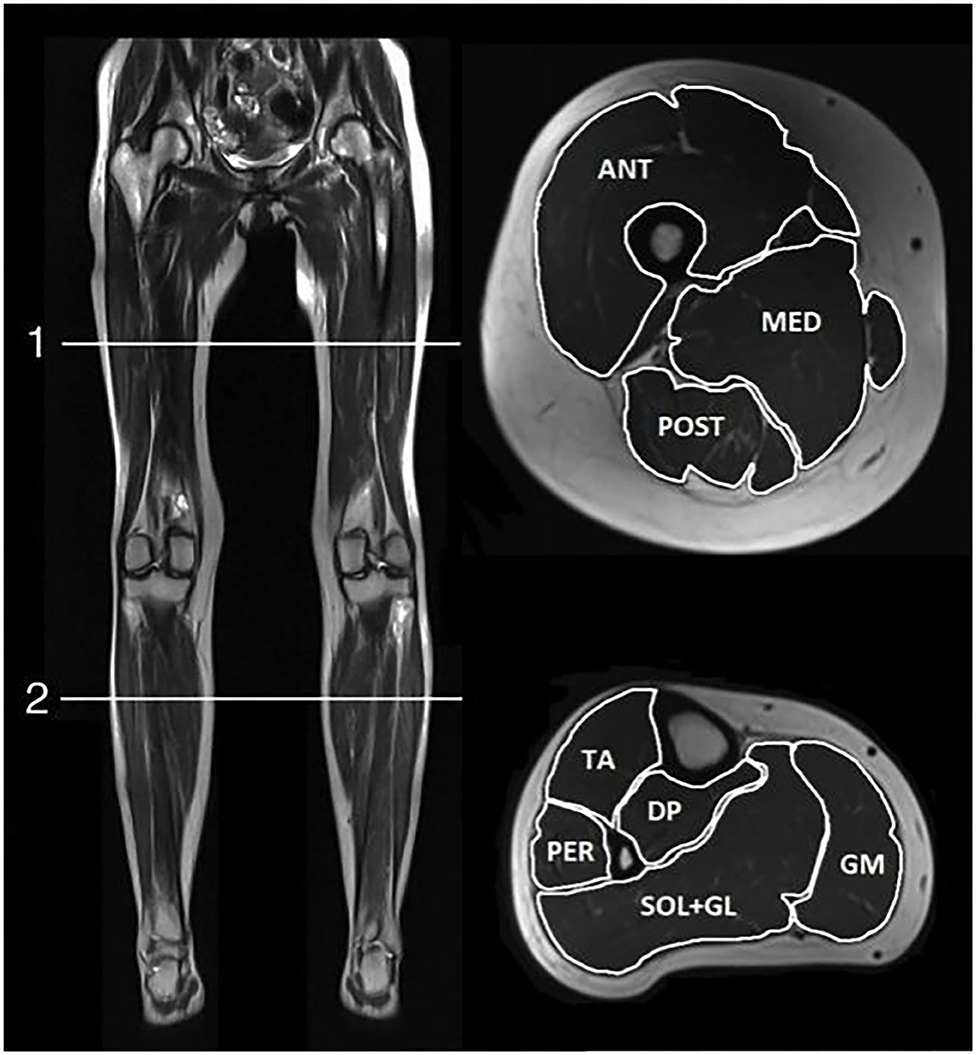
Figure 1. MRI scan positions. T1-weighted MRI images of scan positions (left) and muscle groups outlined in cross sections of thigh (top right) and lower leg (bottom right). ANT, anterior thigh muscle compartment; MED, medial thigh muscle compartment; POST, posterior thigh muscle compartment; AC, anterior calf muscle compartment; PER, peroneal muscles; DP, deep posterior calf muscle compartment; SOL+GL, soleus and lateral gastrocnemius muscles; GM, medial gastrocnemius muscle.
Muscle Strength Testing
A Biodex System 4 Pro (Biodex Medical Systems, Shirley, NY, USA) stationary dynamometer was used to measure lower-extremity maximum strength. Subjects were fixed in the chair in accordance with Biodex Multi-Joint System Pro guidelines (22) (Biodex Medical Systems, Inc., USA.), and the tests included isokinetic knee flexion and extension [80° range of motion (ROM)], and ankle dorsi- and plantar flexion (48° ROM, with knee fixed at a 120 to 130° angle, with shoes off). Four investigators carried out the strength testing for the carriers and 1 for the controls. All investigators were instructed in the correct use of the Biodex according to the guidelines. A standardized prerecorded voice instructor was used during the testing of all participants. The women were instructed to use maximum strength at full extension and flexion every 15 s for eight repetitions per joint. The peak torque values [expressed in Newton meters (Nm)] were used for analysis. Bilateral measurements were performed in order to evaluate any presence of asymmetry. Control strength data were unilateral, and comparison of the specific muscle force between carriers and controls was therefore calculated for the right leg only. Dynamometry measurements were considered abnormal when they were two standard deviations (SD) lower than control mean. After muscle dynamometry, all subjects were tested manually for muscle strength according to the Medical Research Council scale (MRC) (23) in knee and ankle extension and flexion.
Specific Muscle Force
To investigate the contractile properties in DMD variant carriers, the peak torque per fat-free muscle volume (pT/CCSA) was calculated and compared to findings in controls.
Secondary Clinical Assessments
All subjects were asked to report if they had experienced any myalgia/muscle pain or limb weakness, according to their own perception. When questioned about daily physical activity and function, the participants were asked about their ability to run or walk up a flight of stairs. They were categorized as (0) cannot manage stairs, (1) can only climb stairs with either personal assistance or banisters, (2) can walk, but not run up a flight of stairs without the use of banisters/assistance, and (3) no affection—can run/hurry up a flight of stairs without any assistance. Also, all subjects completed the self-administered Fatigue Severity Scale (FSS) (24), which is well-validated for many chronic diseases and in healthy controls (24, 25). Here, the participants answered nine questions about the subjective experience of fatigue, each question scored from one to seven points, and a mean score from all questions was used as the total FSS score.
Statistical Analysis
Statistics were carried out using Microsoft Excel, SPSS, and R. Quantitative values are presented as mean ± standard deviations. To calculate significant differences between variant carriers and controls, between carriers with DMD-associated vs. BMD-associated variants, and between right and left sides, Student's t-tests and repeated-measure ANOVA were used. When there was a significant main effect, post hoc pairwise comparisons were performed. Pearson correlation and linear regression were performed to test correlation. Univariate ANOVA was performed to test the difference between slopes. Chi2 was used when comparing groups of categorical values. The level of statistical significance was set to 0.05. A Bland–Altman plot was used for interrater variability analysis and the ICC (intraclass correlation coefficient) was calculated, using R-packages BlandAltmanLeh, ICC, and irr.
Results
Inclusion and Demographics of DMD Variant Carriers for the Study
A total of 111 known DMD variant carriers were invited to join the study. Fifty-three subjects (mean age 49.6 years; range 26–81), originating from 45 families, accepted to participate and fulfilled the inclusion criteria. All 53 were genetically verified carriers of pathogenic DMD variants, and all had relatives diagnosed with either DMD or BMD, except for three sporadic de novo variant carriers who had DMD variants most likely to cause a Duchenne phenotype in men and were categorized as such in this study. Of the 53 participants, 33 had DMD variants predicted to produce a Duchenne phenotype in men (DMD-associated), and 20 a Becker phenotype in men (BMD-associated). These assumptions were based on male relatives' diagnosis or predicted pathogenicity according to database records in the three participants with no affected male relatives. The DMD- and BMD-associated groups were comparable for age (50.3 vs. 48.6 years) and BMI (25.6 vs. 27.4 kg/m2). One of the participants only completed unilateral testing, due to recent knee surgery. Calf MRI scans of one other participant was excluded due to image processing artifacts. Three participants could not do ankle strength testing on one side due to recent ankle injuries and therefore only contributed with unilateral data. The 19 healthy controls were aged 46.5 years (range: 26–64) and had a BMI of 22.9 (range 19–28.6 kg/m2). Due to technical problems, dynamometry data from one control were excluded.
Fifty-eight women were not included in the study due to either meeting exclusion criteria (n = 1), not wishing to participate (n = 19), or not responding to our letter and phone call (n = 38). To uncover potential selection bias, the excluded women were contacted by telephone after completion of the study for short interviews on their reasons not to participate and presence of muscular symptoms. Thirty-eight women could not be reached. Twenty women responded, and reasons for not participating were reported as distance to research site too far/lack of time (n = 10); too many hospital visits for other reasons (sick child/family member) or own non-DMD-related illness (n = 6); had MRI contraindications (n = 1); and never received the invitation letter (n = 3). One of these did not wish to give information about symptoms, but just reported she never received an invitation. No one reported muscular symptoms as reasons for rejection. There was no significant difference in reported experience of symptoms (muscle weakness, muscle pain, or fatigue): Forty-seven percent of participants vs. 31.5% of the 19 fully interviewed non-participants reported symptoms (p = 0.24).
Muscle Strength
Muscle strength, measured by isokinetic dynamometry, was lower in thigh and calf muscles of DMD variant carriers compared with controls (p = 0.001; Figure 2). Twenty-one women (40%) had peak torque deviating from values in controls by two SDs or more in one or more dynamometry exercises. These 21 women were 54.2 years old (range 29–81) [control mean age 46.5 (range: 26–64)]. Peak torque did not differ between carriers of DMD- and BMD-associated variants (p = 0.36). When comparing strength in the left and right legs in variant carriers, no overall significant strength difference was found (p = 0.75). However, six subjects did show a notable asymmetry of more than 50% weaker performance contralaterally in at least one of the four strength assessments. No participants scored below 4- on the MRC scale. Nine women scored 4-, 4, or 4+ (moderate weakness) in at least one test. The remaining 44 women scored 5 in all tests.
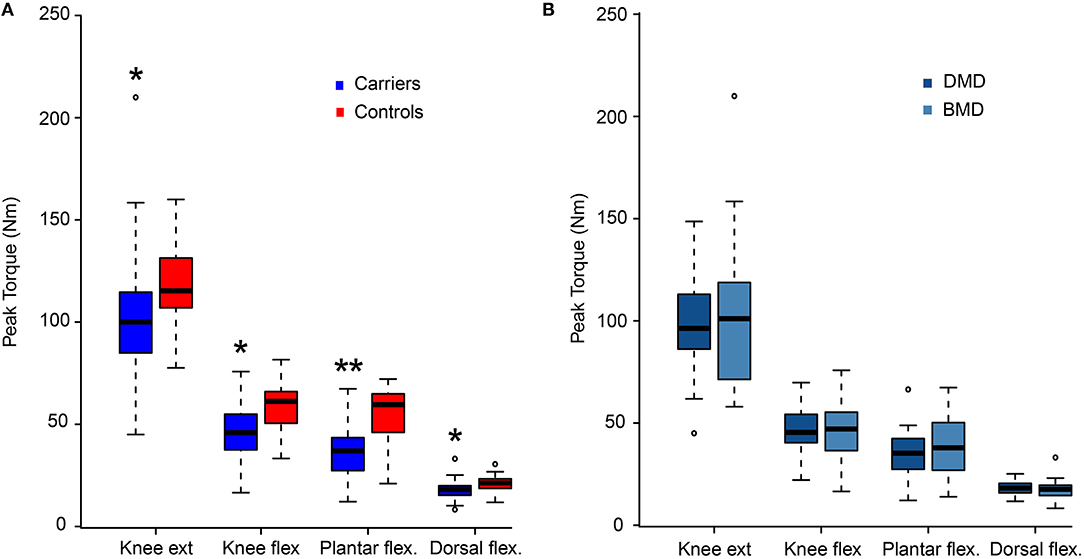
Figure 2. Dynamometry results. Maximum strength presented as peak torque comparing women with pathogenic variants in DMD and healthy women (Controls) (A), and comparison between women with variants predicted to result in Duchenne muscular dystrophy (DMD) and Becker muscular dystrophy (BMD) (B). Presented as median value and four quartiles. ext, extension; flex, flexion; Nm, Newton meter; *p < 0.05 and **p < 0.001 vs. controls.
Specific Muscle Force
The specific muscle force (pT/CCSA) was decreased compared to controls (main effect p = 0.008, Figure 3A). Post-hoc pairwise comparisons showed decreased strength in both knee and plantar flexion (p = 0.012 and p < 0.0001, respectively) but not in knee extension and ankle dorsal flexion. The specific muscle force did not differ between DMD- and BMD-associated carriers (p = 0.57, Figure 3B). With increasing peak torque, a correlating linear increase in CCSA was seen in all four strength analyses (knee extension: r = 0.83, knee flexion: r = 0.53, plantar flexion: r = 0.48, dorsal flexion; r = 0.64; p < 0.001). When we calculated this relation for the 18 controls, the correlation coefficients were not significant.
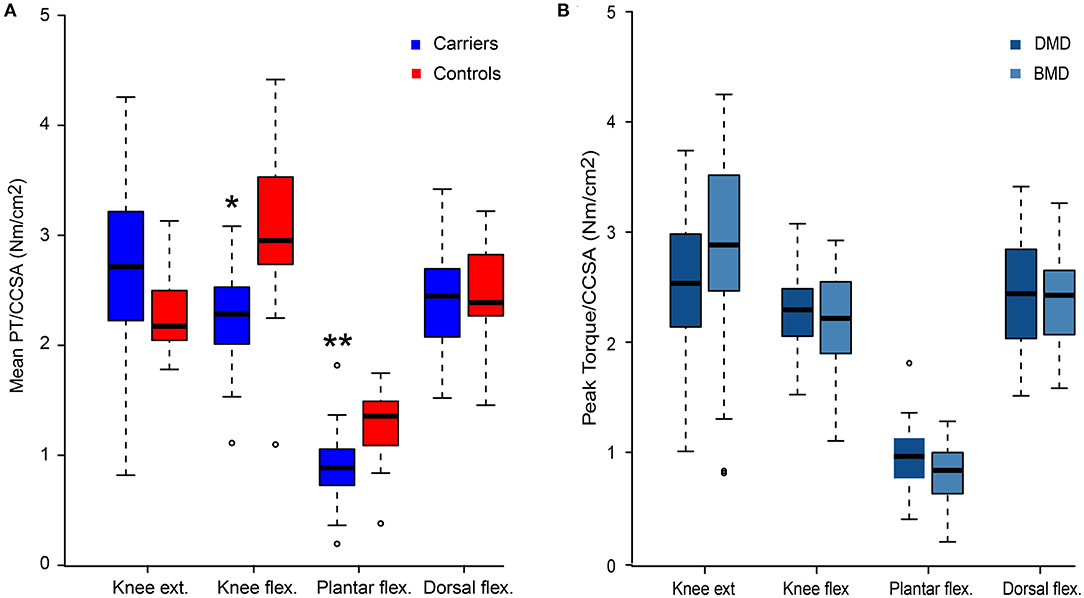
Figure 3. Peak torque/contractile cross-sectional area. Peak torque/CCSA values for women with pathogenic variants in DMD compared to healthy women (Controls) (A), and comparison of peak torque/CCSA values in women with variants predicted to result in Duchenne muscular dystrophy (DMD) and Becker muscular dystrophy (BMD) (B). Presented as median value and four quartiles. CCSA, contractile cross-sectional area; ext, extension; flex, flexion; *p < 0.05 and **p < 0.001 vs. controls.
Muscle Fat Fraction (MRI)
Muscle FF was higher in DMD variant carriers than in controls (p = 0.014; Figure 4). Thirty-eight of the carriers (72%) had abnormally high FFs (>2SDs of control mean) in at least one of the 16 lower-extremity muscles or muscle groups. Ten of these 38 women had abnormal FF in as many as 10 or more muscles/muscle groups. No difference in total FF was found between DMD- and BMD-associated DMD variant carriers (p = 0.39). In DMD variant carriers, there was asymmetry in FF between the two legs (p = 0.016, Figure 5), with no difference in asymmetry between DMD- and BMD-associated variant carriers (p = 0.675). Controls had no FF asymmetry between sides (p = 0.59).
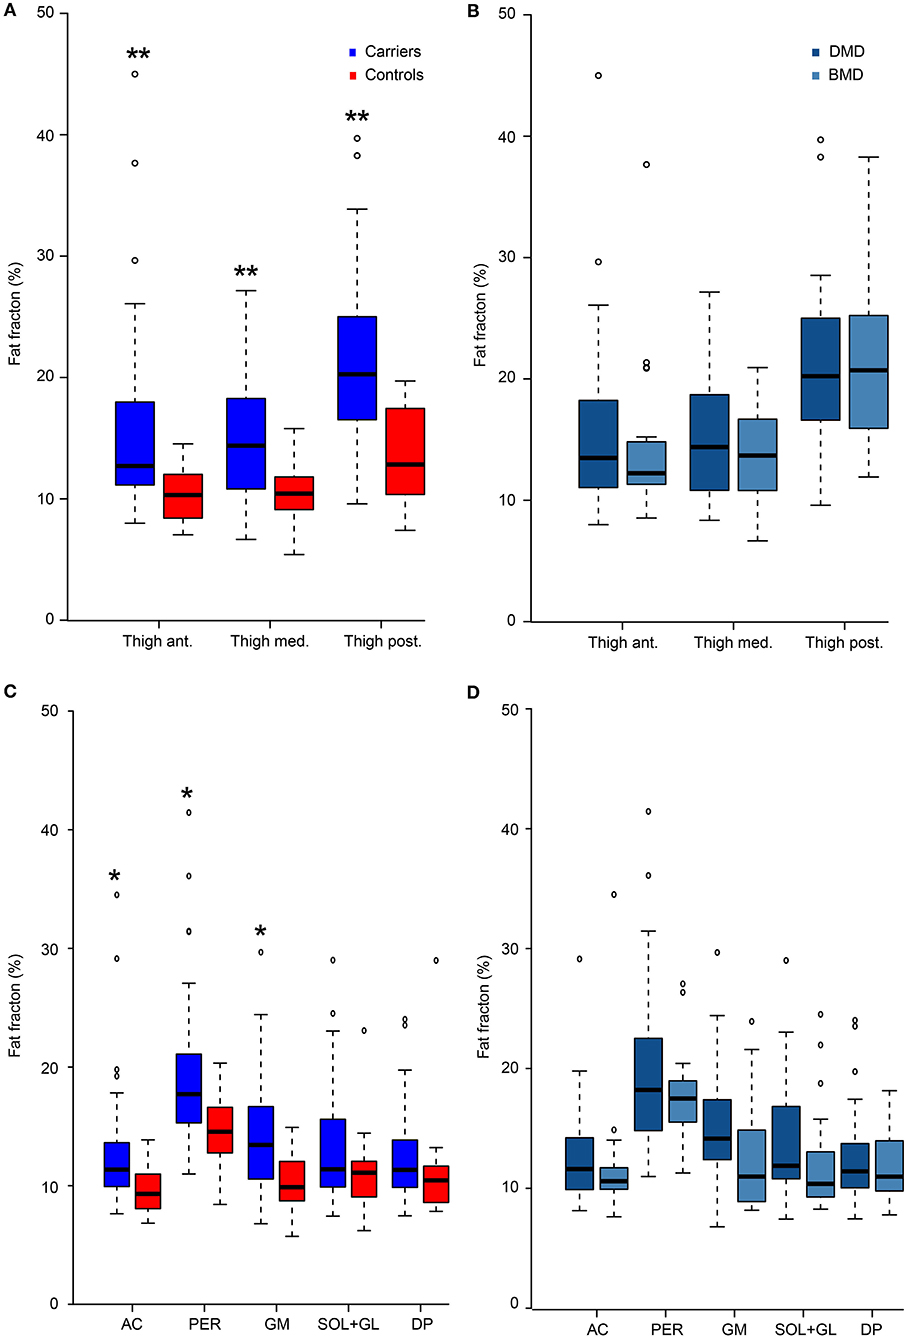
Figure 4. Fat fraction. Fat fractions in women with pathogenic variants in DMD compared to healthy women (controls) in thigh (A) and calf muscles (C), and comparison of fat fractions in women with variants predicted to result in Duchenne muscular dystrophy (DMD) and Becker muscular dystrophy (BMD) in thigh (B) and calf (D) muscles. Presented as median value and four quartiles. Ant, anterior thigh muscles; Med, medial thigh muscles; Post, posterior thigh muscles; AC, anterior calf compartment; PER, peroneal muscle compartment; GM, medial gastrocnemius muscle; SOL+GL, soleus and lateral gastrocnemius muscle; DP, deep posterior calf muscles. *p < 0.05 and **p < 0.001 vs. controls.
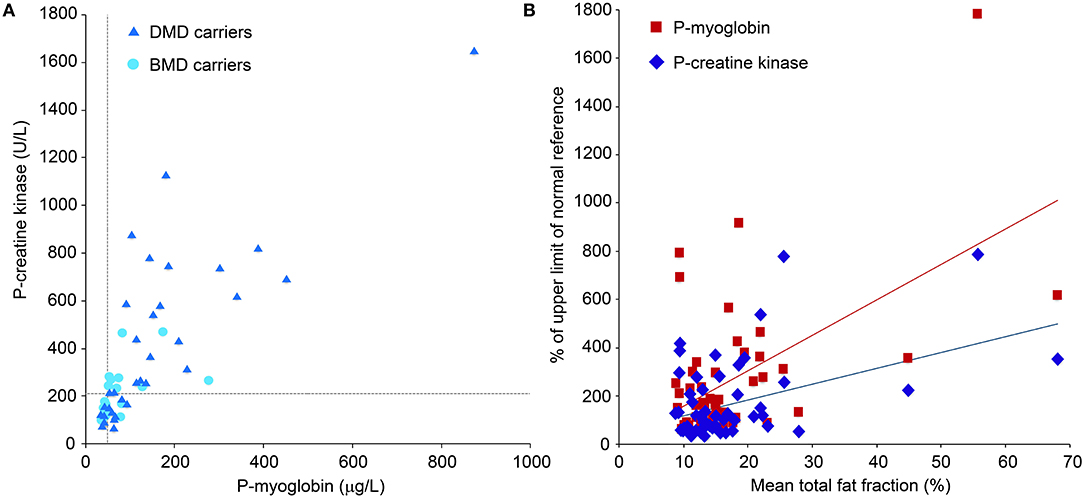
Figure 5. Biomarkers. Plasma creatine kinase (CK) and myoglobin levels from blood samples in women with pathogenic variants in the DMD gene predicted to cause Duchenne muscular dystrophy (DMD) and Becker muscular dystrophy (BMD). Reference cutoffs are marked with light blue lines (A). Normal CK reference level 35–210 U/l, normal myoglobin reference level 19–49 μg/L. (B) shows the correlation between mean lower-extremity fat fractions and the two different plasma biomarkers creatine kinase and myoglobin (R = 0.53 and R = 0.612, respectively; p < 0.001). To be comparable, CK and myoglobin are presented as % of upper limit of normal.
Thighs
The bilateral mean values of the dystrophinopathy carriers' FFs of the anterior, medial, and posterior groups were all higher than in controls (p < 0.001). Furthermore, all these muscle groups had abnormally high mean FF (>2SDs of control mean). Significant asymmetry was found in the posterior muscle group (p < 0.001) of DMD variant carriers. Six women showed asymmetry of more than 10% points in one or more thigh muscle groups. The mean composite FF of all three muscle groups in thighs was 18% (SD 11.8) compared to 11% (SD 2.6) in controls (control mean + 2SD = 16.1%).
Calves
The bilateral mean FF of the five calf muscle groups was higher than control mean FF (main effect, p < 0.03). However, FF was not significantly different from healthy women in the soleus and lateral gastrocnemius muscles (SOL + GL) and deep posterior compartment (DP) in the post-hoc pairwise comparison (p = 0.16 and p = 0.31, respectively). Statistically significant asymmetry was found in the peroneal muscles (PER) (p < 0.001) and the SOL+GL (p = 0.034), but not in the other three calf muscle groups (AC, GM, DP) of DMD variant carriers. Asymmetry of more than 10 percentage point difference in FF between sides was seen in eight women, predominantly in PER. The mean composite FF of all five muscle groups in calves was 15.2% (SD 10) compared to controls at 10.9% (SD 2.8) (control mean + 2SD = 16.5%).
Interrater Variability Analysis
The Bland–Altman plot showed 2 outliers out of 32 observations (6 %). All observations were scattered randomly throughout the plot; hence, no skewed pattern was seen. Differences were normally distributed. Mean differences were−1.09 with the 2SD upper limit being 2.77 and the 2SD lower limit being−4.95. The ICC was 0.896 (CI 0.504;0.984), indicating a good correlation.
Clinical Assessments/Secondary Outcomes
Plasma CK and Myoglobin
CK was above the normal reference level in 30 (57%) DMD variant carriers. Myoglobin was above the normal reference level in 39 (73%) DMD variant carriers (Figure 5). CK and myoglobin correlated positively with the composite total mean FF (R = 0.53 and R = 0.612, respectively; p < 0.001; Figure 6B). DMD-associated carriers had higher mean CK (425 U/l; SD 360) than BMD-associated carriers (209 U/l; SD 110; p = 0.003). Mean myoglobin was 127 μg/l (range 34–873 μg/l), and DMD-associated carriers had higher levels than BMD-associated carriers (159 μg/l; SD 165, vs. 76 μg/l; SD 13, p = 0.012).
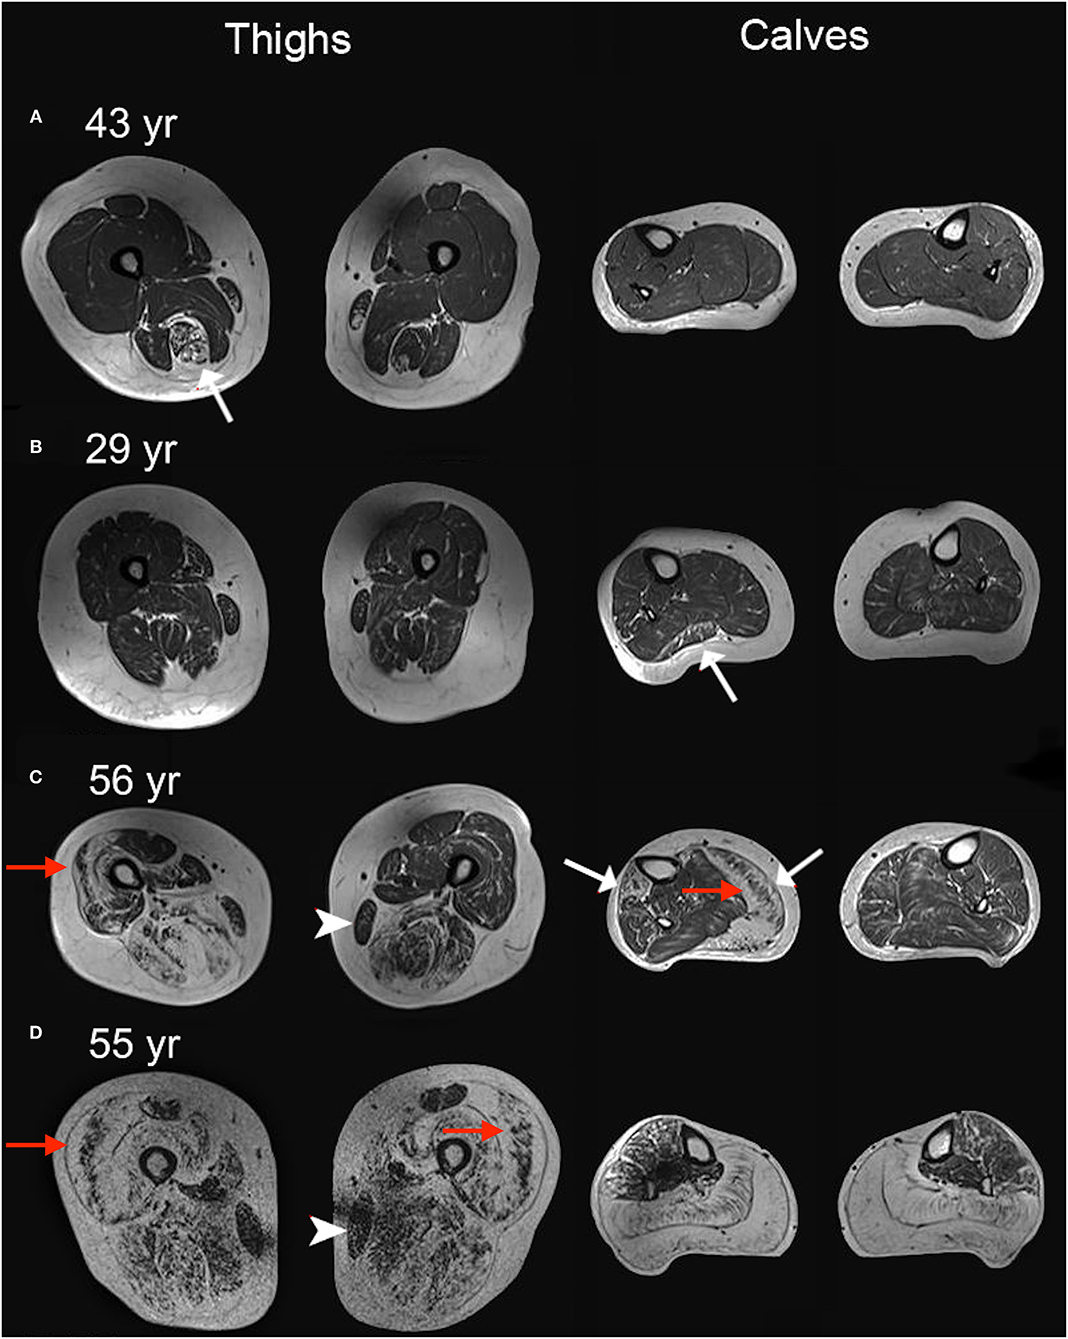
Figure 6. Four T1-weighted examples. T1-weighted MRI images of thighs and calves of four women heterozygote for pathogenic DMD variants. White represents fat tissue. (A–D) shows a range of muscle affection from mild to severe. Cases (C,D) are particularly affected with prominent replacement of muscle by fat. Correspondingly, muscle strength was compromised in these patients. Cases (A–C) have asymmetric fatty replacement (white arrows) in one or more muscles. Note the sparing of the gracilis muscle in cases (C,D) (arrowheads). Sandwich sign (preserved core of muscle surrounded by fat replaced muscle), reminiscent of what is seen in Bethlem myopathy, is observed in several muscles (red arrows). For more details on these four cases, see Table 1: subject no. 3 for (A); subject no. 34 for (B); subject no. 23 for (C); subject no. 32 for (D).
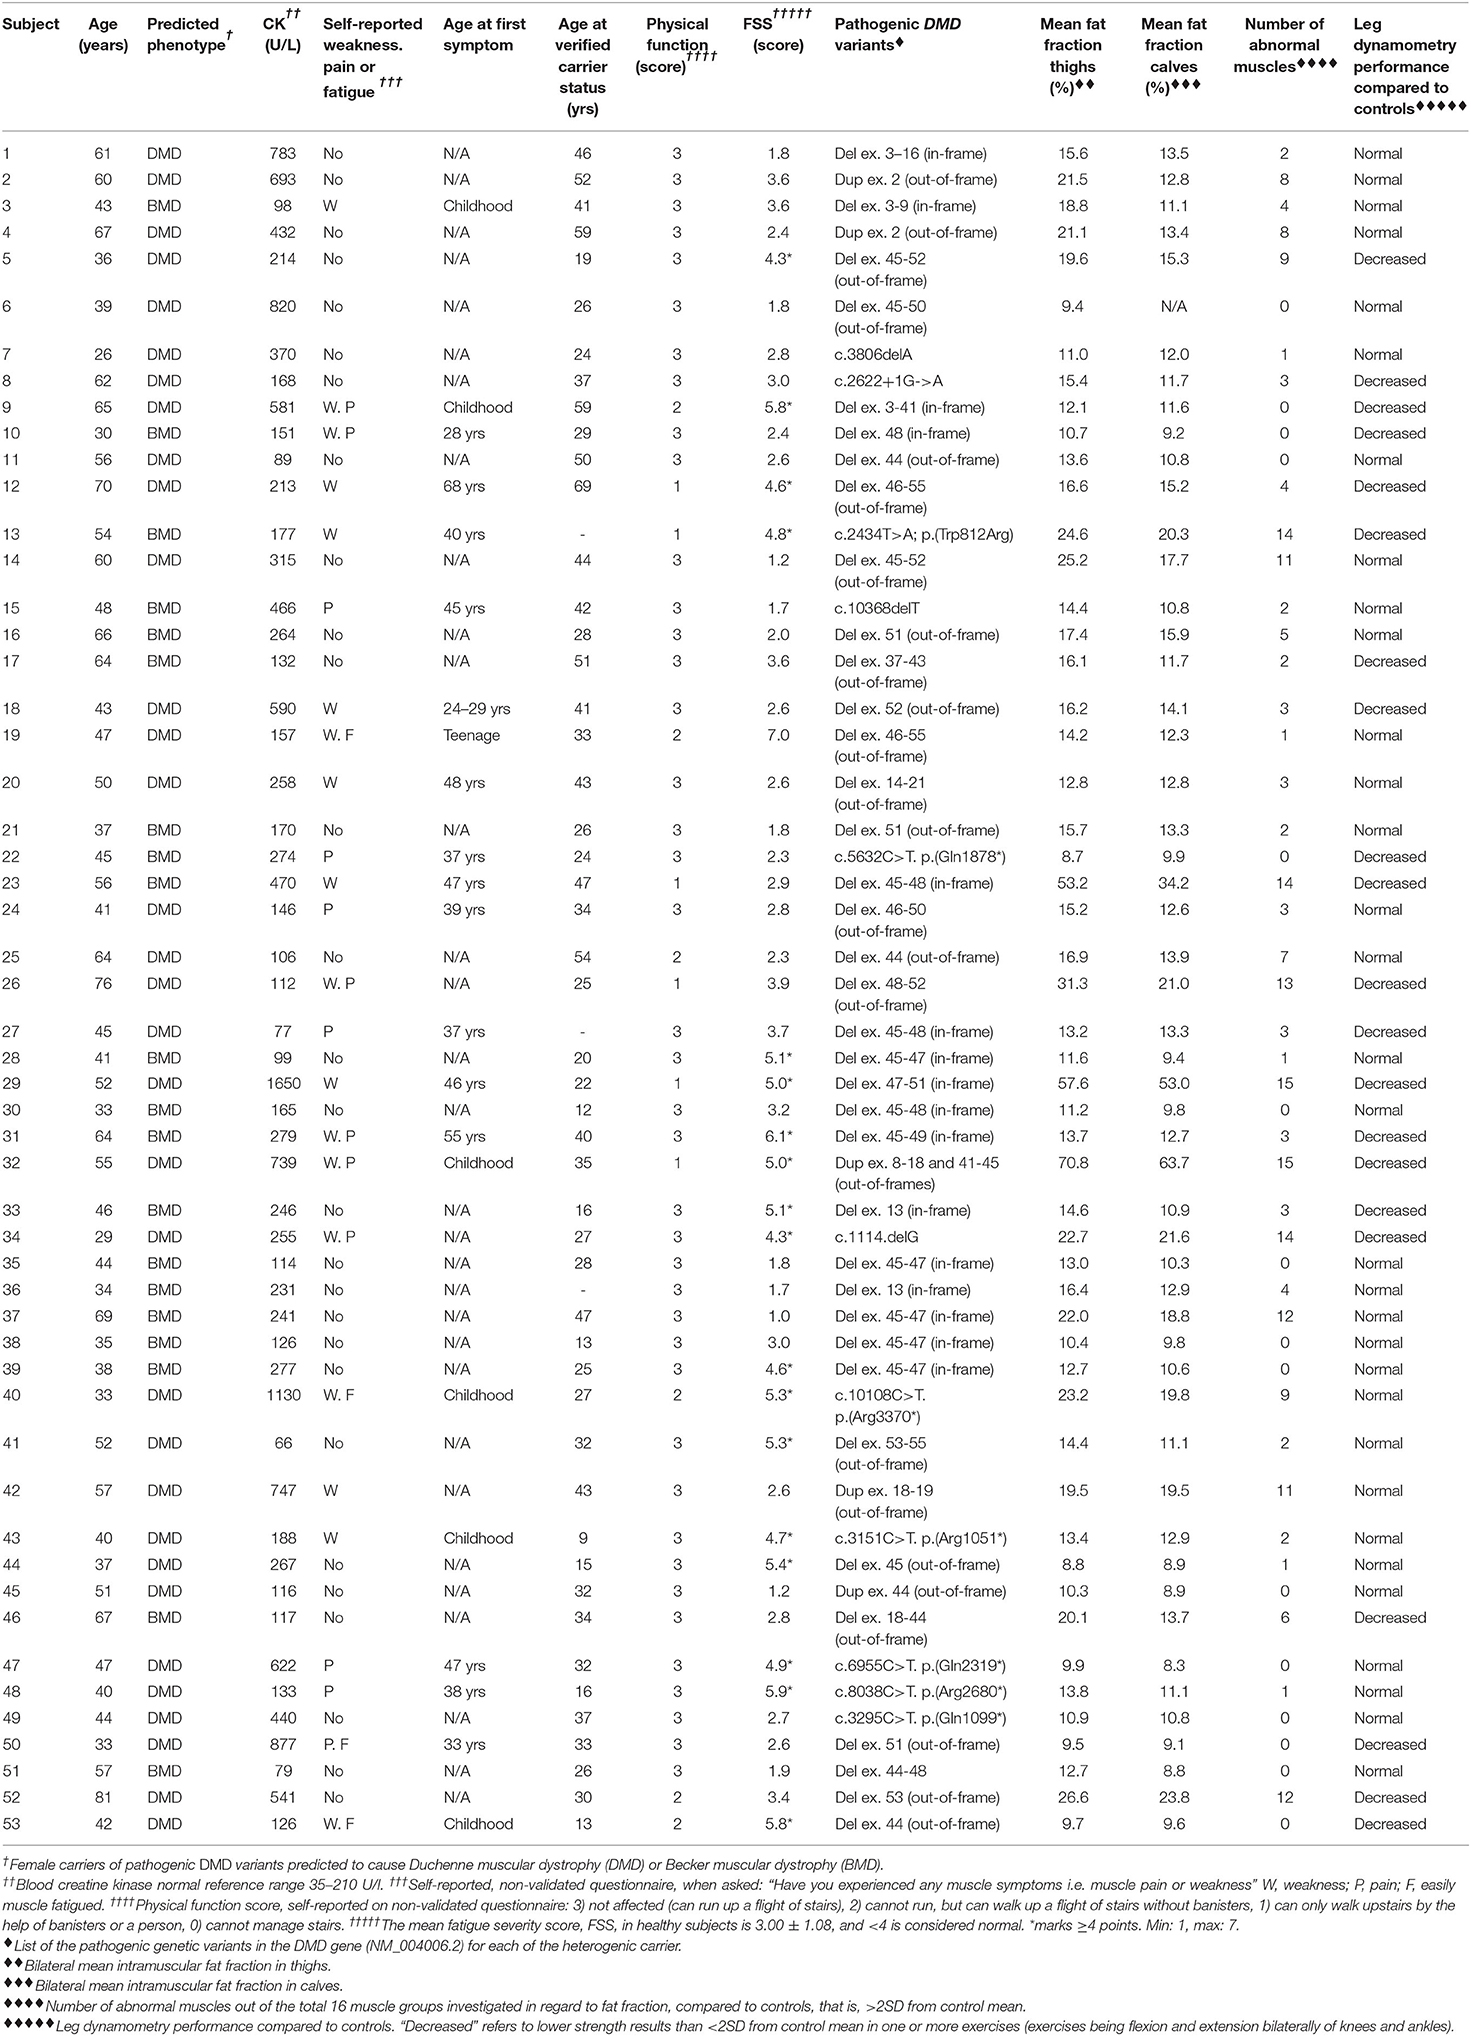
Table 1. Demographics and characteristics of the 53 women with pathogenic variants in the dystrophin gene.
Physical Function
Eighteen women said they experienced weakness (Table 1). All participants were ambulatory. Seven women, all carriers of DMD-associated variants, reported difficulties running upstairs, but they could all climb the stairs without assistance (Table 1). Five women, of whom two carried BMD- and three DMD-associated variants in DMD, reported inability to climb the stairs without banisters or personal assistance. It should be noted that these five women all had BMI above 25 kg/m2, and one had a BMI of 42. Subjectively experiencing weakness tended to relate to higher fat fraction and weaker objective strength performance.
Pain
Thirteen of the 53 participants reported myalgia or cramps to some extent (Table 1). Pain complaints were not related to levels of muscle fat fraction or strength.
Fatigue
The mean fatigue score was 3.4 ± 1.55 (mean ± SD). Valko et al. measured the mean score among 454 healthy controls to be 3.0 ± 1.1 and defined a cutoff score for fatigue at ≥4 points (25). Nineteen women (36%) in our cohort scored ≥4 points with a dominance of carriers of DMD-associated variants (15 of 19) compared to 18% scoring ≥4 points in the 454 healthy controls (Table 1) (25). A higher FSS score did not correlate with higher fat fraction or weaker strength performance (Table 1).
Discussion
In this observational, cross-sectional study of 53 women with pathogenic DMD variants, we used quantitative MRI and stationary dynamometry to describe skeletal muscle affection, which has not to our knowledge been studied before in this condition. Previous studies have, according to a review by Ishizaki et al. from 2018, investigated carriers' muscle strength by manual muscle testing, or handheld dynamometry only (13), and MRI studies of this group are rare and have assessed muscle involvement by using qualitative or semiquantitative methods (26–28). The findings of our study are that DMD variant carriers, who were selected based on their genetic defect and not symptoms, have higher fat fraction and lower muscle strength in the lower extremities compared to controls. Furthermore, specific force (muscle contractility) was also impaired in variant carriers vs. controls. There was no difference in fat fraction and muscle strength between women with pathogenic DMD variants predicted to produce DMD and BMD in men, but plasma CK and myoglobin levels were higher and fatigue and physical dysfunction were more pronounced in carriers of DMD-associated variants.
Asymmetry of replacement of muscle by fat was quite common. In 21% of the carriers, fat fractions differed by 10–38 percentage points, most commonly seen in the peroneal, lateral gastrocnemius, soleus, and hamstring muscles (Figure 6), without a convincing left vs. right dominance pattern, and the same was true for strength measures. We did not investigate handedness and do not know if side differences relate to handedness; however, no pattern indicating a more pronounced one-sided affection was evident. Previous reports on female DMD variant carriers have not reported on asymmetry vs. handedness either. Six women had prominent asymmetry in both fat fraction and strength assessments and were also the most functionally affected and struggled with stairs. Asymmetry in muscle affection has previously been shown by MRI and strength assessments in both mild and moderately to severely affected DMD variant carriers (8, 27, 29).
In boys with DMD, the general proximal pattern of leg involvement predominantly includes the medial and anterior compartments of the thighs, with a relative sparing of the gracilis, sartorius, and semimembranosus muscles (30), and in calves predominantly involving the peroneal, medial gastrocnemius, and soleus muscles (31). In the milder Becker muscular dystrophy, symmetric affection is common, and similar muscles as affected in DMD are observed (17). The pattern of muscle involvement in DMD variant carriers has previously been described in a retrospective study by Tasca et al. (27) in a cohort of 12 women. They investigated the involvement pattern using semiquantitative grading with CT and MRI and found a similar involvement pattern to those described in patients affected by DMD and BMD, including sparing of the sartorius and gracilis muscles, and a variable involvement of the calves. They found equally affected anterior, medial, and posterior compartments of the thigh. In our study, we used Dixon MRI to quantify muscle fat fractions. Dixon MRI is an objective measurement that quantifies the muscle content on a continuous scale, and because of its observer independency we believe it to be more precise than semiquantitative methods. In line with previous findings, we found side asymmetry and sparing of sartorius and gracilis. However, in our cohort, using the quantitative assessment of fat replacement of muscle, we found a more pronounced involvement of the posterior thigh muscles compared to anterior and medial muscles. Since mapping groups of muscles, instead of individual muscles, generates smaller error, we mapped muscles together in groups (32). Sartorius and gracilis were therefore included in the anterior and medial thigh group, respectively, and the abovementioned sparing of these muscles is based solely on visual interpretation.
We found that carriers of DMD variants were weaker than healthy age-matched women in both thigh and calf muscles. Notable weakness (<2SD from control mean) assessed with stationary dynamometry was seen in 21 (40%) women equally distributed between DMD- and BMD-associated variant carriers. When asked about experienced weakness, 18 (34%) of the 53 carriers had complaints of weakness to some extent. In 12 of these women, the subjective experience of muscle weakness agreed with the objective strength measures (<2SD from control mean). Nine women who did not report symptoms of weakness had notable muscle weakness on testing.
Manual muscle testing according to the MRC scale was not useful in this cohort. Although it is a simple and feasible method to evaluate muscle weakness, it is very investigator-dependent and it is not sensitive to detect weakness at the high end of the scale (33). Most women in our study had normal MRC testing, which is in line with neither our dynamometry and MRI findings nor the subjects' complaints. The MRC tests rarely detected an asymmetric weakness pattern, which was picked up by dynamometry assessments in some cases.
Asymmetry in muscle strength was not investigated in our control group but has previously been reported in healthy younger (34) and older (35) women to differ by 8.6–27% between sides in the lower extremities. In our study, asymmetry was not statistically significant for strength, but in some carriers, we did see side differences. Six carriers had strength asymmetry in the dynamometry of more than 50% in one or more assessments. Notable asymmetry in fat fraction and/or strength tended to relate to weakness complaints. Thus, quantitative MRI is more sensitive to disclose asymmetric affection and most likely detects such differences before they become clinically evident on strength testing.
All carriers and controls were examined in the same clinic using the same hardware. However, potential limitations to our study could have been introduced by using different software for MRI analysis and several evaluators for strength testing and MR scans. The MRI evaluations were not blinded; however, the two investigators analyzed images of controls and carriers separately, which would lessen a potential open-label observer bias.
Neither age nor BMI were perfectly matched between DMD variant carriers and controls. Controls were slightly younger and slimmer. However, removing the oldest and heavier carriers from the results gave the same results, which suggest that the subtle differences in age and BMI did not influence study results.
Our specific muscle force calculations showed reduced contractile properties of the lean muscle mass in DMD variant carriers in knee flexion and even more so in plantar flexion. Contractile properties of lean muscle mass has been shown to be disrupted in both men with Becker muscular dystrophy (36) and boys with Duchenne muscular dystrophy (37). In knee extension and ankle dorsal flexion, contractility was similar to that of controls. We found no difference between contractile properties in carriers of DMD- vs. BMD-associated variants. With increasing lean muscle mass, the maximum strength performed increased in our subjects. The correlation between CCSA and peak torque in the 18 healthy female controls was not convincing, which is likely due to small sample size and more importantly a narrow range of strength. However, a linear relationship between cross-sectional area and peak muscle force in healthy muscle is well-known (36, 38).
Myalgia and cramps are repeatedly reported as a symptom in DMD variant carriers (8, 11, 15, 39–41). In our study, reported leg pain was not related to levels of leg muscle fat fraction in the carriers. Supporting this finding, studies on paraspinal fat fraction in healthy men and women (20) and in facioscapulohumeral muscular dystrophy patients (42) found no correlation between lumbar fat fraction and lower back pain.
We found no difference between carriers of DMD- and BMD-associated variants in fat fraction of leg muscles or on strength testing. However, carriers of DMD-associated variants had more complaints of limb weakness, pain, and fatigue and CK and myoglobin levels were higher than in BMD-associated carriers. DMD-associated variant carriers have been reported to be slightly more affected by muscle weakness than BMD-associated variant carriers (8).
X-chromosome inactivation has frequently been hypothesized to explain disease variability in women carrying pathogenic DMD variants (8, 43, 44), but some reports on blood and muscle DNA have not confirmed this (40, 45). X-chromosome activation differs among tissues and therefore must be assessed in muscle. The muscle biopsy procedure was not part of the protocol and was historically only performed in very few of the women in this study. We did however collect a single muscle biopsy from one of the most affected participants (subject no. 32). This biopsy's X-chromosome inactivation pattern was skewed (90% mutant vs. 10% wild type). With only one biopsy, no firm conclusions can be reached but the result does point toward the X-chromosome inactivation theory as a plausible explanation for disease variability and calls for further studies.
Previous retrospective studies on the muscular status of female DMD variant carriers often included subjects based on hospital records, which would favor the bias of including symptomatic individuals. By including subjects prospectively and based on genetic information, we aimed to avoid such bias. Still, there is a possibility for selection bias, because about half of the invited participants did not take part in the study. The possibility of these women predominantly regarding themselves as either asymptomatic or too symptomatic to participate must be considered, which could skew the results in either direction. Non-participants were therefore contacted by phone for a brief questionnaire on muscle symptoms. Overall, non-participants did not differ in clinical symptoms from participants, and we therefore think our cohort is representative of women with pathogenic DMD variants in general.
Despite the prospective inclusion of participants in our study, we still found a high rate of manifestations in the carriers investigated. Symptomatic skeletal muscle manifestations have been reported to range between 2.5 and 22% (6, 8, 11, 13, 14). In our study, 43 of the 53 carriers (81%) were “manifesting” in terms of either abnormal strength or fat fraction, or both. This high rate relates to the sensitive measuring tools used in the study, that is, isokinetic dynamometry and quantitative MRI. Still, 30 of the 43 manifesting carriers were also symptomatic, which gives a more than 50% rate of symptomatic DMD variant carriers. The variety of published prevalence of muscular involvement in this cohort of women depends on several factors, including sensitivity and precision of assessments tools, as well as definitions used for manifesting vs. not manifesting carriers. In a prospective study, the subjective scoring of symptoms could be biased, perhaps resulting in augmented self-reported symptoms, merely due to the participant's knowledge of the study aim and their carriership. Nevertheless, our objective assessment tools disclose that carriership of pathogenic DMD variants results in a high prevalence of measurable manifestations, which for the most part also render the person symptomatic.
We chose the cutoff for abnormal values at two standard deviations from control mean, as this is an accepted and commonly used cutoff level in many scientific studies. A limitation when examining multiple parameters is however the inevitable risk of some values being abnormal by chance. Since we examined 16 muscle groups and 8 strength exercises, this should be considered a possible bias. The abnormal findings (72% had abnormal MRI results and 40% had abnormal strength results), however, were much larger than what can be explained merely by chance.
There are limitations to our study when it comes to number of muscles investigated. We did not investigate upper extremities, or pelvic muscles, mainly due to the need to limit the amount of data collection. An MRI study of lower and upper extremities as well as pelvic muscles in men with Becker muscular dystrophy, whom we phenotypically consider to resemble female DMD variant carriers more than men with DMD, showed a more severe involvement of lower extremities compared to upper extremities and showed an equal or slightly less involvement of pelvic muscles compared to thigh muscles (17). We therefore believe that any muscle involvement in carriers would be detected by the muscles we investigated. Another limitation of our study is that we did not measure strength across the hip, which could have been informative, given that hip strength is important in proximal myopathies. However, not having full MRI data (psoas major muscle was not scanned) to compare strength measurements with would also pose a limitation, and hip strength assessed by Biodex has a poorer reliability than strength measurements across knees and ankles.
In conclusion, most women with pathogenic DMD variants are symptomatic or show signs of degenerative changes in lower-extremity muscles, sometimes with an asymmetric pattern of fat replacement of muscle, but severe symptoms, as found in men affected by BMD, are rare. Longitudinal studies in female carriers of pathogenic DMD variants are needed to follow the evolution of these changes. A more affected phenotype for carriers of the DMD-associated mutations—compared to carriers of the BMD-associated mutations—was suggested by higher CK elevations and more complaints of weakness, pain, and fatigue, while muscle strength and fat fractions were similar between the two carrier groups. This is possibly explained by variable X-chromosome inactivation patterns. The findings suggest a need for an increased awareness of potential skeletal muscle involvement in women with pathogenic DMD variants.
Data Availability Statement
The raw data supporting the conclusions of this article will be made available by the authors, without undue reservation.
Ethics Statement
The studies involving human participants were reviewed and approved by Danish Data Protection Agency and the National Committee of Health Research. The patients/participants provided their written informed consent to participate in this study.
Author Contributions
JV contributed to conception and design of the study. FF drafted the original manuscript and contributed to interpretation of data. FF, TS, A-SE, NP, AA, and MD contributed with data acquisition and subject recruitment. Statistical analysis and data interpretation were performed by JD. All authors contributed to revising the manuscript critically for intellectual content.
Funding
This study was supported by the Augustinus Foundation and Lundbeck Foundation. The foundations had no influence on the collection, analysis of the data, or decision to submit the paper for publication.
Conflict of Interest
The authors declare that the research was conducted in the absence of any commercial or financial relationships that could be construed as a potential conflict of interest.
Publisher's Note
All claims expressed in this article are solely those of the authors and do not necessarily represent those of their affiliated organizations, or those of the publisher, the editors and the reviewers. Any product that may be evaluated in this article, or claim that may be made by its manufacturer, is not guaranteed or endorsed by the publisher.
Acknowledgments
The authors thank Poul Henrik Frandsen, radiographer, Department of Diagnostic Radiology, Rigshospitalet, for his help with the MRI protocol setup.
Abbreviations
AC, anterior calf compartment (tibialis anterior muscle and m.extensor digitorum longus); BMD, Becker muscular dystrophy; CCSA, contractile cross-sectional area; CK, creatine kinase; DP, deep posterior calf compartment (mm. tibialis posterior, flexor digitorum longus, flexor hallucis longus); DMD, Duchenne muscular dystrophy; FF, fat fraction; F.Fo, Freja Fornander, MD; GM, medial gastrocnemius muscle; J.R.D., Julia Rebecka Dahlqvist, MD; MRC, medical research council scale; MRI, magnetic resonance imaging; PER, lateral calf compartment (mm. peroneus longus et brevis); pT, peak torque; SOL + GL, soleus muscle and the lateral gastrocnemius muscle.
References
1. Flanigan KM. Duchenne and Becker muscular dystrophies. Neurol Clin. (2014) 32:671–88, viii. doi: 10.1016/j.ncl.2014.05.002
2. Venugopal V, Pavlakis S. Duchenne Muscular Dystrophy. Treasure Island, FL: StatPearls Publishing (2018).
3. Ellis JA, Vroom E, Muntoni F. 195th ENMC International Workshop: Newborn screening for Duchenne muscular dystrophy 14–16th December, 2012. Naarden, The Netherlands. Neuromuscul Disord. (2013) 23:682–9. doi: 10.1016/j.nmd.2013.05.008
4. Crisafulli S, Sultana J, Fontana A, Salvo F, Messina S, Trifirò G. Global epidemiology of Duchenne muscular dystrophy: An updated systematic review and meta-analysis. Orphanet J Rare Dis. (2020) 15:141. doi: 10.1186/s13023-020-01430-8
5. Norwood FLM, Harling C, Chinnery PF, Eagle M, Bushby K, Straub V. Prevalence of genetic muscle disease in Northern England: in-depth analysis of a muscle clinic population. Brain J Neurol. (2009) 132:3175–86. doi: 10.1093/brain/awp236
6. Norman A, Harper P. A survey of manifesting carriers of Duchenne and Becker muscular dystrophy in Wales. Clin Genet. (1989) 36:31–7. doi: 10.1111/j.1399-0004.1989.tb03363.x
7. Politano L, Nigro V, Nigro G, Petretta VR, Passamano L, Papparella S, et al. Development of cardiomyopathy in female carriers of duchenne and becker muscular dystrophies. JAMA. (1996) 275:1335–8. doi: 10.1001/jama.1996.03530410049032
8. Hoogerwaard E m., Bakker E, Ippel P f., Oosterwijk J c., Majoor-Krakauer D f., Leschot N j., et al. Signs and symptoms of Duchenne muscular dystrophy and Becker muscular dystrophy among carriers in the Netherlands: a cohort study. Lancet. (1999) 353:2116–9. doi: 10.1016/S0140-6736(98)10028-4
9. Hoogerwaard EM, van der Wouw PA, Wilde AAM, Bakker E, Ippel PF, Oosterwijk JC, et al. Cardiac involvement in carriers of Duchenne and Becker muscular dystrophy. Neuromuscul Disord. (1999) 9:347–51. doi: 10.1016/S0960-8966(99)00018-8
10. Grain L, Cortina-Borja M, Forfar C, Hilton-Jones D, Hopkin J, Burch M. Cardiac abnormalities and skeletal muscle weakness in carriers of Duchenne and Becker muscular dystrophies and controls. Neuromuscul Disord. (2001) 11:186–91. doi: 10.1016/S0960-8966(00)00185-1
11. Lee SH, Lee JH, Lee K-A, Choi Y-C. Clinical and genetic characterization of female dystrophinopathy. J Clin Neurol Seoul Korea. (2015) 11:248–51. doi: 10.3988/jcn.2015.11.3.248
12. Mccaffrey T, Guglieri M, Murphy AP, Bushby K, Johnson A, Bourke JP. Cardiac involvement in female carriers of duchenne or becker muscular dystrophy. Muscle Nerve. (2017) 55:810–8. doi: 10.1002/mus.25445
13. Ishizaki M, Kobayashi M, Adachi K, Matsumura T, Kimura E. Female dystrophinopathy: Review of current literature. Neuromuscul Disord NMD. (2018) 28:572–81. doi: 10.1016/j.nmd.2018.04.005
14. Sewry CA, Sansome A, Clerk A, Sherratt TG, Hasson N, Rodillo E, et al. Manifesting carriers of Xp21 muscular dystrophy; Lack of correlation between dystrophin expression and clinical weakness. Neuromuscul Disord. (1993) 3:141–8. doi: 10.1016/0960-8966(93)90006-6
15. Ceulemans BP, Storm K, Reyniers E, Callewaert L, Martin JJ. Muscle pain as the only presenting symptom in a girl with dystrophinopathy. Pediatr Neurol. (2008) 38:64–6. doi: 10.1016/j.pediatrneurol.2007.09.006
16. Dahlqvist JR, Widholm P, Leinhard OD, Vissing J. MRI in neuromuscular diseases: an emerging diagnostic tool and biomarker for prognosis and efficacy. Ann Neurol. (2020) 88:669–81. doi: 10.1002/ana.25804
17. Faridian-Aragh N, Wagner KR, Leung DG, Carrino JA. Magnetic resonance imaging phenotyping of Becker muscular dystrophy. Muscle Nerve. (2014) 50:962–7. doi: 10.1002/mus.24246
18. Li W, Zheng Y, Zhang W, Wang Z, Xiao J, Yuan Y. Progression and variation of fatty infiltration of the thigh muscles in Duchenne muscular dystrophy, a muscle magnetic resonance imaging study. Neuromuscul Disord. (2015) 25:375–80. doi: 10.1016/j.nmd.2015.01.003
19. Polavarapu K, Manjunath M, Preethish-Kumar V, Sekar D, Vengalil S, Thomas P, et al. Muscle MRI in Duchenne muscular dystrophy: Evidence of a distinctive pattern. Neuromuscul Disord. (2016) 26:768–74. doi: 10.1016/j.nmd.2016.09.002
20. Dahlqvist JR, Vissing CR, Hedermann G, Thomsen C, Vissing J. Fat replacement of paraspinal muscles with aging in healthy adults. Med Sci Sports Exerc. (2017) 49:595–601. doi: 10.1249/MSS.0000000000001119
21. Hogrel J-Y, Barnouin Y, Azzabou N, Butler-Browne G, Voit T, Moraux A, et al. NMR imaging estimates of muscle volume and intramuscular fat infiltration in the thigh: variations with muscle, gender, and age. Age. (2015) 37:9798. doi: 10.1007/s11357-015-9798-5
22. Biodex Medical Systems. Biodex Multi-Joint System Pro 4. Available online at: https://www.biodex.com/sites/default/files/850000man_08262revc.pdf (accessed March 25, 2018)
23. Compston A. Aids to the investigation of peripheral nerve injuries. Medical Research Council: Nerve Injuries Research Committee. His Majesty's Stationery Office: (1942) pp. 48 (iii) and 74 figures and 7 diagrams; with aids to the examination of the peripheral nervous system. By Michael O'Brien for the Guarantors of Brain. Saunders Elsevier: (2010). pp. [8] 64 and 94 Figures. Brain J Neurol. (2010) 133:2838–44. doi: 10.1093/brain/awq270
24. Krupp LB, LaRocca NG, Muir-Nash J, Steinberg AD. The fatigue severity scale: application to patients with multiple sclerosis and systemic lupus erythematosus. Arch Neurol. (1989) 46:1121–3. doi: 10.1001/archneur.1989.00520460115022
25. Valko PO, Bassetti CL, Bloch KE, Held U, Baumann CR. Validation of the fatigue severity scale in a Swiss cohort. Sleep. (2008) 31:1601–7. doi: 10.1093/sleep/31.11.1601
26. Rajakulendran S, Kuntzer T, Dunand M, Yau SC, Ashton EJ, Storey H, et al. Marked hemiatrophy in carriers of duchenne muscular dystrophy. Arch Neurol. (2010) 67:497–500. doi: 10.1001/archneurol.2010.58
27. Tasca G, Monforte M, Iannaccone E, Laschena F, Ottaviani P, Silvestri G, et al. Muscle MRI in female carriers of dystrophinopathy. Eur J Neurol. (2012) 19:1256–60. doi: 10.1111/j.1468-1331.2012.03753.x
28. Bing Q, Hu K, Tian Q, Zhao Z, Shen H, Li N, et al. Semi-quantitative assessment of lower limb MRI in dystrophinopathy. Int J Clin Exp Med. (2016) 9:13723–32.
29. Song T-J, Lee K-A, Kang S-W, Cho H, Choi Y-C. Three cases of manifesting female carriers in patients with duchenne muscular dystrophy. Yonsei Med J. (2011) 52:192–5. doi: 10.3349/ymj.2011.52.1.192
30. Kim HK, Merrow AC, Shiraj S, Wong BL, Horn PS, Laor T. Analysis of fatty infiltration and inflammation of the pelvic and thigh muscles in boys with Duchenne muscular dystrophy (DMD): grading of disease involvement on MR imaging and correlation with clinical assessments. Pediatr Radiol Heidelb. (2013) 43:1327–35. doi: 10.1007/s00247-013-2696-z
31. Torriani M, Townsend E, Bredella MA, Thomas BJ, Ghomi RH, Tseng BS. Lower leg muscle involvement in Duchenne muscular dystrophy: an MR imaging and spectroscopy study. Skeletal Radiol. (2012) 41:437–45. doi: 10.1007/s00256-011-1240-1
32. Baum T, Inhuber S, Dieckmeyer M, Cordes C, Ruschke S, Klupp E, et al. Association of quadriceps muscle fat with isometric strength measurements in healthy males using chemical shift encoding-based water-fat magnetic resonance imaging. J Comput Assist Tomogr. (2016) 40:447–51. doi: 10.1097/RCT.0000000000000374
33. Harbo T, Brincks J, Andersen H. Maximal isokinetic and isometric muscle strength of major muscle groups related to age, body mass, height, and sex in 178 healthy subjects. Eur J Appl Physiol. (2012) 112:267–75. doi: 10.1007/s00421-011-1975-3
34. Lanshammar K. Differences in muscle strength in dominant and non-dominant leg in females aged 20-39 years–a population-based study. Phys Ther Sport. (2011) 12:76–9. doi: 10.1016/j.ptsp.2010.10.004
35. Skelton DA, Kennedy J, Rutherford OM. Explosive power and asymmetry in leg muscle function in frequent fallers and non-fallers aged over 65. Age Ageing. (2002) 31:119–25. doi: 10.1093/ageing/31.2.119
36. Løkken N, Hedermann G, Thomsen C, Vissing J. Contractile properties are disrupted in Becker muscular dystrophy, but not in limb girdle type 2I. Ann Neurol. (2016) 80:466–71. doi: 10.1002/ana.24743
37. Lacourpaille L, Hug F, Guével A, Péréon Y, Magot A, Hogrel J-Y, et al. New insights on contraction efficiency in patients with Duchenne muscular dystrophy. J Appl Physiol. (2014) 117:658–62. doi: 10.1152/japplphysiol.00544.2014
38. Maughan RJ, Watson JS, Weir J. Strength and cross-sectional area of human skeletal muscle. J Physiol. (1983) 338:37–49. doi: 10.1113/jphysiol.1983.sp014658
39. Hoogerwaard EM, Ginjaar IB, Bakker E, de Visser M. Dystrophin analysis in carriers of Duchenne and Becker muscular dystrophy. Neurology. (2005) 65:1984–6. doi: 10.1212/01.wnl.0000188909.89849.59
40. Soltanzadeh P, Friez MJ, Dunn D, von Niederhausern A, Gurvich OL, Swoboda KJ, et al. Clinical and genetic characterization of manifesting carriers of DMD mutations. Neuromuscul Disord NMD. (2010) 20:499–504. doi: 10.1016/j.nmd.2010.05.010
41. Seemann N, Selby K, McAdam L, Biggar D, Kolski H, Goobie S, et al. Symptomatic dystrophinopathies in female children. Neuromuscul Disord. (2011) 21:172–7. doi: 10.1016/j.nmd.2010.11.001
42. Dahlqvist JR, Vissing CR, Thomsen C, Vissing J. Severe paraspinal muscle involvement in facioscapulohumeral muscular dystrophy. Neurology. (2014) 83:1178–83. doi: 10.1212/WNL.0000000000000828
43. Juan-Mateu J, Rodríguez MJ, Nascimento A, Jiménez-Mallebrera C, González-Quereda L, Rivas E, et al. Prognostic value of X-chromosome inactivation in symptomatic female carriers of dystrophinopathy. Orphanet J Rare Dis. (2012) 7:82. doi: 10.1186/1750-1172-7-82
44. Viggiano E, Picillo E, Ergoli M, Cirillo A, Gaudio SD, Politano L. Skewed X-chromosome inactivation plays a crucial role in the onset of symptoms in carriers of Becker muscular dystrophy. J Gene Med. (2017) 19:e2952. doi: 10.1002/jgm.2952
45. Brioschi S, Gualandi F, Scotton C, Armaroli A, Bovolenta M, Falzarano MS, et al. Genetic characterization in symptomatic female DMD carriers: lack of relationship between X-inactivation, transcriptional DMD allele balancing and phenotype. BMC Med Genet. (2012) 13:73. doi: 10.1186/1471-2350-13-73
Keywords: dystrophinopathy, female carriers, Dixon MRI, muscle fat infiltration, dynamometry, muscle strength
Citation: Fornander F, Solheim TÅ, Eisum AV, Poulsen NS, Andersen AG, Dahlqvist JR, Dunø M and Vissing J (2021) Quantitative Muscle MRI and Clinical Findings in Women With Pathogenic Dystrophin Gene Variants. Front. Neurol. 12:707837. doi: 10.3389/fneur.2021.707837
Received: 10 May 2021; Accepted: 27 July 2021;
Published: 03 September 2021.
Edited by:
Giuseppe Piscosquito, Ospedali Riuniti San Giovanni di Dio e Ruggi d'Aragona, ItalyReviewed by:
Wei Zhang, Peking University First Hospital, ChinaJasper Morrow, University College London, United Kingdom
Copyright © 2021 Fornander, Solheim, Eisum, Poulsen, Andersen, Dahlqvist, Dunø and Vissing. This is an open-access article distributed under the terms of the Creative Commons Attribution License (CC BY). The use, distribution or reproduction in other forums is permitted, provided the original author(s) and the copyright owner(s) are credited and that the original publication in this journal is cited, in accordance with accepted academic practice. No use, distribution or reproduction is permitted which does not comply with these terms.
*Correspondence: John Vissing, am9obi52aXNzaW5nQHJlZ2lvbmguZGs=