
95% of researchers rate our articles as excellent or good
Learn more about the work of our research integrity team to safeguard the quality of each article we publish.
Find out more
ORIGINAL RESEARCH article
Front. Neurol. , 18 August 2021
Sec. Applied Neuroimaging
Volume 12 - 2021 | https://doi.org/10.3389/fneur.2021.698675
This article is part of the Research Topic Ultrahigh Field Metabolic MRI: Current Status, Clinical Applications and Future Perspectives. View all 8 articles
 Young Woo Park1*
 Dinesh K. Deelchand1
 James M. Joers1
 Anjali Kumar2Alison Bunio Alvear2Amir Moheet2
 Elizabeth R. Seaquist2
 Gülin Öz1*
The primary excitatory and inhibitory neurotransmitters glutamate (Glu) and gamma-aminobutyric acid (GABA) are thought to be involved in the response of the brain to changes in glycemia. Therefore, their reliable measurement is critical for understanding the dynamics of these responses. The concentrations of Glu and GABA, as well as glucose (Glc) in brain tissue, can be measured in vivo using proton (1H) magnetic resonance spectroscopy (MRS). Advanced MRS methodology at ultrahigh field allows reliable monitoring of these metabolites under changing metabolic states. However, the long acquisition times needed for these experiments while maintaining blood Glc levels at predetermined targets present many challenges. We present an advanced MRS acquisition protocol that combines commercial 7T hardware (Siemens Scanner and Nova Medical head coil), BaTiO3 dielectric padding, optical motion tracking, and dynamic frequency and B0 shim updates to ensure the acquisition of reproducibly high-quality data. Data were acquired with a semi-LASER sequence [repetition time/echo time (TR/TE) = 5,000/26 ms] from volumes of interest (VOIs) in the prefrontal cortex (PFC) and hypothalamus (HTL). Five healthy volunteers were scanned to evaluate the effect of the BaTiO3 pads on distribution. Use of BaTiO3 padding resulted in a 60% gain in signal-to-noise ratio in the PFC VOI over the acquisition without the pad. The protocol was tested in six patients with type 1 diabetes during a clamp study where euglycemic (~100 mg/dL) and hypoglycemic (~50 mg/dL) blood Glc levels were maintained in the scanner. The new protocol allowed retention of all HTL data compared with our prior experience of having to exclude approximately half of the HTL data in similar clamp experiments in the 7T scanner due to subject motion. The advanced MRS protocol showed excellent data quality (reliable quantification of 11–12 metabolites) and stability (p > 0.05 for both signal-to-noise ratio and water linewidths) between euglycemia and hypoglycemia. Decreased brain Glc levels under hypoglycemia were reliably detected in both VOIs. In addition, mean Glu level trended lower at hypoglycemia than euglycemia for both VOIs, consistent with prior observations in the occipital cortex. This protocol will allow robust mechanistic investigations of the primary neurotransmitters, Glu and GABA, under changing glycemic conditions.
Glutamate (Glu) and gamma-aminobutyric acid (GABA) are primary excitatory and inhibitory neurotransmitters, respectively, in the central nervous system. Alterations to Glu and GABA concentrations have been linked to various neurological and psychiatric disorders (1–4). The metabolism of Glu and GABA is also closely linked to oxidative glucose (Glc) utilization (5), as both Glu (6) and GABA (7) are involved in the metabolic pathways of the brain. Studies with animal (8, 9) and human subjects (10, 11) have indicated that the Glu and GABA levels decrease as the brain is exposed to hypoglycemia. In addition, clinical studies on impaired awareness of hypoglycemia (IAH) in patients with type 1 diabetes (T1D) have shown differences in the Glu response to hypoglycemia in patients with vs. without IAH, suggesting underlying changes in the cognitive mechanisms of hypoglycemia awareness (10, 12, 13).
Hence, understanding how the concentrations of Glu and GABA change in response to changing glycemia can provide important insights into cerebral adaptations in diabetes and recurrent hypoglycemia (14). While the metabolic pathways that couple glycemia to neurotransmitter levels are active across brain regions, the hypothalamus (HTL) and the prefrontal cortex (PFC) are notable regions of interest (ROIs) to understand these adaptations (15). Namely, the HTL contains the Glc-sensing neurons and controls the release of counter-regulatory hormones such as glucagon, epinephrine, growth hormone, and cortisol to maintain peripheral Glc homeostasis (16, 17). The PFC is the primary brain region controlling executive function, and differences in Glc kinetics in this region have been associated with impaired hypoglycemia awareness (18, 19).
Magnetic resonance spectroscopy (MRS) is an MR modality that provides access to brain metabolism and allows direct in vivo quantification of endogenous, high-concentration metabolites. Therefore, 1H MRS allows simultaneous measurement of a neurochemical profile, including Glu and GABA, and Glc. Use of ultrahigh-field (UHF) MRI allows reliable detection of metabolites with complex spectral pattern such as Glu, GABA, glutathione (GSH), and lactate (Lac), as the higher field yields enhanced signal-to-noise ratio (SNR) and allows greater separation of spectral peaks. Earlier metabolic MRI and MRS studies at UHF have primarily investigated the brain's metabolic responses to glycemic changes in the occipital cortex (OCC), using surface coils that were needed to achieve the required radio frequency (RF) transmit energy () levels but lacked whole-brain coverage (10, 20). Access to other parts of the brain requires the use of volume coils and ideally commercially available equipment to enable investigations by a community of researchers. While MRS using X-nuclei, such as 2H and 13C, provides direct access to real-time measurements of metabolism, the need for administering labeled precursors and non-standard hardware provides motivation to develop and utilize 1H MRS methods to gain insights into metabolism.
Many prior studies have acquired MRS data in conjunction with the Glc clamp technique to observe how the body reacts to changing glycemic conditions (10–13, 21, 22). Glc clamp is a technique to maintain the plasma Glc at targeted levels by carefully controlling the amount of dextrose and insulin given to the subject. Measuring the brain's response to changing glycemic conditions with MRS requires a carefully choreographed coordination in and around the subject with frequent blood draws during the scan. These studies often require long acquisition times, typically around 2–3 h for 2 volumes of interest (VOIs), to enable adequate monitoring of physiological changes, which make the experiments prone to subject motion and decreases reliability of the MRS signal. In addition, streamlining the setup and calibration processes for MR data acquisition is critical for maximizing comfort of study participants and minimizing disruptions for clinical staff.
Therefore, our goal in this study was to develop a robust MRS protocol to minimize data loss and provide high sensitivity to neurotransmitter changes. We developed a UHF MRS data acquisition protocol with prospective motion and shim corrections to enable reliable measurements of neurotransmitter levels during glycemic clamps in the scanner. The proposed advanced MRS acquisition protocol combines commercial 7T hardware (7T Siemens scanner and Nova Medical head coil) and BaTiO3 dielectric padding to streamline the scanner setup while achieving necessary levels for short-echo 1H MRS with an optimized semi-LASER (sLASER) protocol. In addition, the sLASER sequence incorporates optical motion tracking, and dynamic frequency and B0 shim updates to ensure the acquisition of reproducibly high-quality data during the long Glc clamp sessions. The optimized protocol was evaluated in the PFC and HTL, regions associated with IAH, in patients with T1D during consecutive euglycemic and hypoglycemic clamps.
MR experiments were performed using a 7 tesla (T) Actively Shielded MAGNETOM scanner (Syngo VB17A, Siemens Healthineers, Erlangen, Germany) with proton (1H) single channel RF transmit (Tx) and 32-channel RF receive (Rx) head coil (Nova Medical, Wilmington, MA, USA). The Nova coil shares the same design as the Nova 1Tx/32Rx head coil for Siemens 7T Terra scanner, which is the one of two Food and Drug Administration (FDA)-approved commercial UHF system as of date. Due to well-known RF inhomogeneities at 7T, acquiring high-quality MRS data from the outer cortical regions of the brain is challenging. The transmit RF power is focused at the center of the coil and leads to insufficient power delivery to the cortical regions within the specific absorption rate (SAR) limits set for the human brain.
In order to overcome these challenges, we utilized dielectric pads to redistribute RF energy from the center of the brain toward our ROI, the PFC, by placing the pad on the forehead. Dielectric pads were prepared from a class of titanium oxide-based compounds (ceramic powders) that possess favorable dielectric properties. Specifically, water mixtures of barium titanate (BaTiO3, CAS#12047-27-7) were used as described previously (23, 24). BaTiO3 is harmful if swallowed, owing to the toxicity of the free Ba2+ that is liberated in acidic conditions, such as one's stomach (25). To mitigate formation of Ba2+ within the pads and preserve stability of BaTiO3, a mixture of deionized heavy water (D2O, 99.8% D atom) and Darvan (deflocculant) was titrated to pH = 9 with the addition of sodium hydroxide (NaOH) prior to the addition of the powdered BaTiO3. During the creation of the pads, a double heat seal was created along the pad edge, and the pad was double bagged to further prevent the direct skin exposure to BaTiO3.
The semi-LASER pulse sequence [sLASER, repetition time/echo time (TR/TE) = 5,000/26 ms] (26) was used to minimize chemical-shift displacement errors. GOIA-WURST adiabatic pulse was used, as it offered optimal pulse profile for refocusing (27). VAPOR water suppression (28) combined with outer volume suppression was used prior to sLASER localization.
In order to ensure consistent data quality throughout the long study, prospective motion correction was implemented, which performed real-time VOI position updates and corresponding corrections to first-order B0 shim values and incorporated a frequency navigator for efficient water suppression (29). An optical motion tracking system (MPT high field; Metria Innovation, Inc., Milwaukee, WI, USA) was used to compensate for head movements (Figure 1). The MR-compatible single optical camera (Metria Innovation, Inc.) installed at the isocenter in the bore of MRI scanner reads the position and orientation of the Moiré Phase Tracking (MPT) marker attached to the participant's head. The MPT marker was attached to a plastic extender that was taped to the nose bridge as the transmit component of the Nova coil obstructs the MPT marker if directly placed on the nose. The camera system records the position of MPT in the camera coordinates that are translated to scanner coordinates using the XPACE library (KinetiCor, Inc., Calgary, AB, Canada). The head position is recorded at the beginning of the session, and XPACE library automatically computes and adjusts the position during the scan for prospective motion corrections.
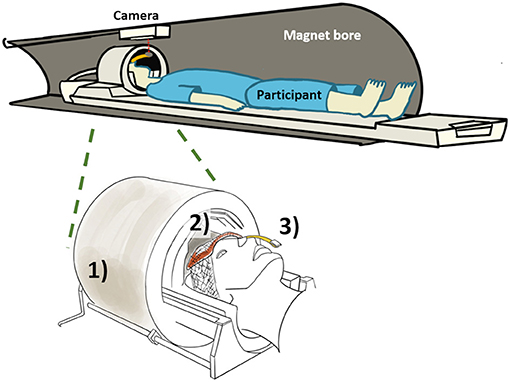
Figure 1. Overview of proposed method with (1) commercial head coil, (2) BaTiO3 padding on forehead, and (3) holographic optical marker attached to a plastic extension bar and taped to the participant's nose bridge.
First- and second-order B0 shimming was achieved with FASTMAP shimming prior to the start of MRS data acquisition (30). During the MRS acquisition, the first-order shim value was dynamically updated for each TR. A 2D RF pulse (duration of 6.51 ms) with small flip angle (20°) was transmitted just prior to the sLASER pulse sequence, and the information collected (three echoes with TE = 2.6 ms and an echo delay of 5.5 ms) was used to compute the first-order linear shim values (total duration of B0 shimming module at 85.53 ms) (29). In addition, two frequency navigator pulses (slice navigator pulse with 5° flip angle and STEAM navigator pulse with 10° flip angle) were transmitted before and after the dynamic shim module to compensate for shift in resonance frequency. The advantage of using low fractional anisotropy (FA) 2D RF pulse compared with the conventional FASTMAP (with five adiabatic pulses) is the significantly lower power deposition, which is beneficial at high fields. In addition, the delay between the acquisitions of B0 projections can be minimal without any SAR issues (0.02% contribution to total energy deposited).
The study protocol was approved by the Institutional Review Board (IRB) at the University of Minnesota. For the evaluation of dielectric padding, healthy participants were screened and consented on the day of the scan. The inclusion criterion were adult (18 years or older) healthy volunteers, and the exclusion criterion was inability to undergo MRI scanning (presence of paramagnetic substances or pacemakers in body, weight over 300 lb, pregnancy, and claustrophobia). For the evaluation with Glc clamps, patients with T1D were initially screened and consented 1 week prior to the scan. The inclusion criteria were ages 18–65 years with disease duration of 2–30 years and A1C <8.5%. The exclusion criteria were impaired awareness to hypoglycemia as determined by Cox (31) and Gold (32) questionnaire, uncontrolled hypertension with blood pressure >145/95 mmHg, evidence of autonomic neuropathy, proliferative retinopathy, impaired kidney function with glomerular filtration rate <45, history of cardiac diseases, current substance abuse, and inability to undergo MRI scanning. Clinical information (disease duration and A1C) was collected at the screening visit. On the date of the study, the subjects underwent the consent and MR safety screening again.
Effect of the BaTiO3 padding on and SNR was evaluated in five healthy volunteers (two females, mean ± SD age 43 ± 21 years). Each participant underwent imaging and MRS with and without the BaTiO3 pad. The pad was placed on the subject's forehead using Surgilast (Derma Sciences, Plainsboro, NJ, USA) tubular elastic dressing retainer. MRS data were acquired from the PFC (24× 12 × 30 mm3, 16–64 transients) and HTL (13× 12 × 10 mm3, 32 transients). efficiency was measured with actual flip-angle imaging (AFI) pulse sequence (33) at Tx 190–220 V.
The MRS protocol was evaluated in six patients (four females) with T1D. The age of the participants was 29 ± 9 years with the duration of the disease at 19 ± 5 years and well-maintained A1C level of 7.7 ± 0.6. Nova 32Ch head coil with BaTiO3 padding was used for the data acquisition. Semi-LASER pulse sequence (TR/TE = 5,000/26 ms) with motion tracking was used for the acquisition of MRS data.
VOIs for the MRS data were the PFC (24 × 12 × 30 mm3, 64 transients) and HTL (13 × 12 × 10 mm3, 256 transients) (Figure 2). The order of MRS measurements in the PFC and HTL was randomized between participants but stayed the same between euglycemia and hypoglycemia (Figure 3). Total time of acquisition was about 6 min for the PFC and 22 min for the HTL with 3–5 min of voxel-based B0 and calibrations preceding each acquisition. Two additional sets of water unsuppressed sLASER spectra (two transients each) were collected for eddy-current correction and metabolite quantification (34).

Figure 2. (A) Prefrontal cortex (PFC) and (B) hypothalamus (HTL) volumes of interests (VOIs) shown on T1-weighted magnetization-prepared rapid acquisition gradient echo (MPRAGE) images.
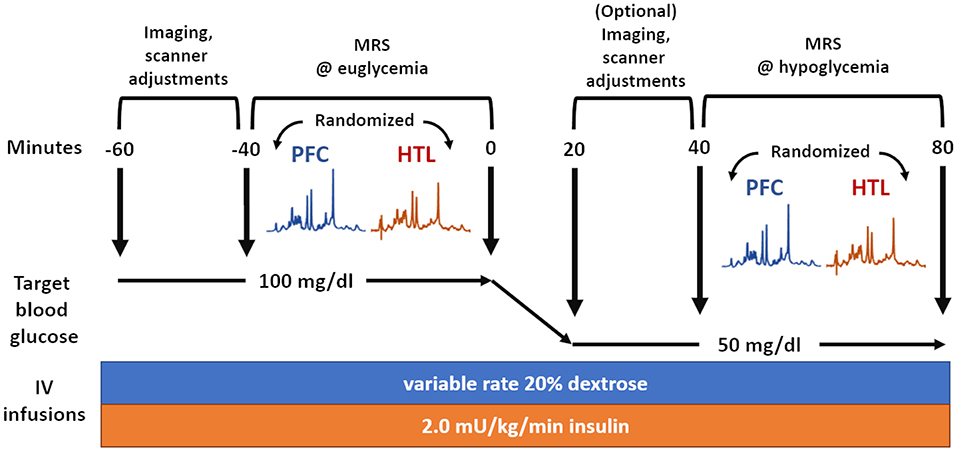
Figure 3. Overview of magnetic resonance spectroscopy (MRS) data acquisition during glucose clamps where the same set of data is acquired during euglycemia and hypoglycemia.
Additional imaging data were acquired prior to MRS acquisitions. Structural images for MRS VOI localization and tissue segmentations were first collected with T1-weighted MPRAGE sequence at 1 × 1 × 1 mm3 resolution and FA 5° with TR/inversion time (TI)/TE = 2,890/1,500/2.42 ms. Additional proton-density (PD)-weighted FLASH images at 1 × 1 × 1 mm3 resolution and FA 5° with TR/TE = 1,410/2.42 ms were collected to normalize intensity for tissue segmentation. map with AFI was acquired between T1 and PD images (3 × 3 × 4 mm3 resolution, TR/TE = 60/2.33 ms, 60° flip angle @ Tx = 220 V), in order to compute the Tx power for MRS VOI.
An intravenous (IV) catheter was placed antegrade in a forearm of the subject for a two-step hyperinsulinemic clamp, in which insulin at a rate of 2.0 mU/kg/min and potassium phosphate at a rate of 4 mEq/h were infused. In addition, separate IV catheters were placed retrograde in one or both lower feet (as tolerated) for blood sampling. We set up IV lines in both feet when tolerated, as the lines sometimes failed to draw blood after a prolonged study session. Blood was sampled primarily on one line and only moved to another line if the initial line failed. The foot used for blood sampling was wrapped in heated towels to arterialize the venous blood (35). Blood sampling occurred every 5 min from the moment the IV lines became active before the MR scan. This was uninterrupted during the MR operation unless the subject's IV lines failed or the subject had to take a restroom break. Subjects were scanned while undergoing euglycemic and hypoglycemic Glc clamps. Blood Glc was initially maintained at euglycemia (100 mg/dL) by IV infusion of 20% dextrose. After collection of MR data during euglycemia, the dextrose infusion was temporarily halted, and blood Glc was allowed to drop to hypoglycemia (50 mg/dL). Once the plasma Glc had reached the target concentration, dextrose infusion was adjusted to maintain targeted hypoglycemia, while the same set of MR data was acquired (Figure 3). Heart rate was monitored using a pulse oximeter.
The MRI and MRS data acquisition during Glc clamp required coordination between three clinical staff and the MR operator (Figure 4). Blood Glc was sampled every 5 min to monitor Glc concentration, resulting in one to two samples for each 6-min-long MRS acquisition for the PFC, and four to five samples for each 22-min-long MRS acquisitions for the HTL. With continuous IV fluid injections, five out of six subjects needed to take a bathroom break after the euglycemic clamp. In those cases, T1-weighted structural images and AFI images for calibrations were repeated for VOI repositioning and sLASER RF power calibrations prior to data acquisition during hypoglycemia. The total MR session took about 2.5–3 h to complete.
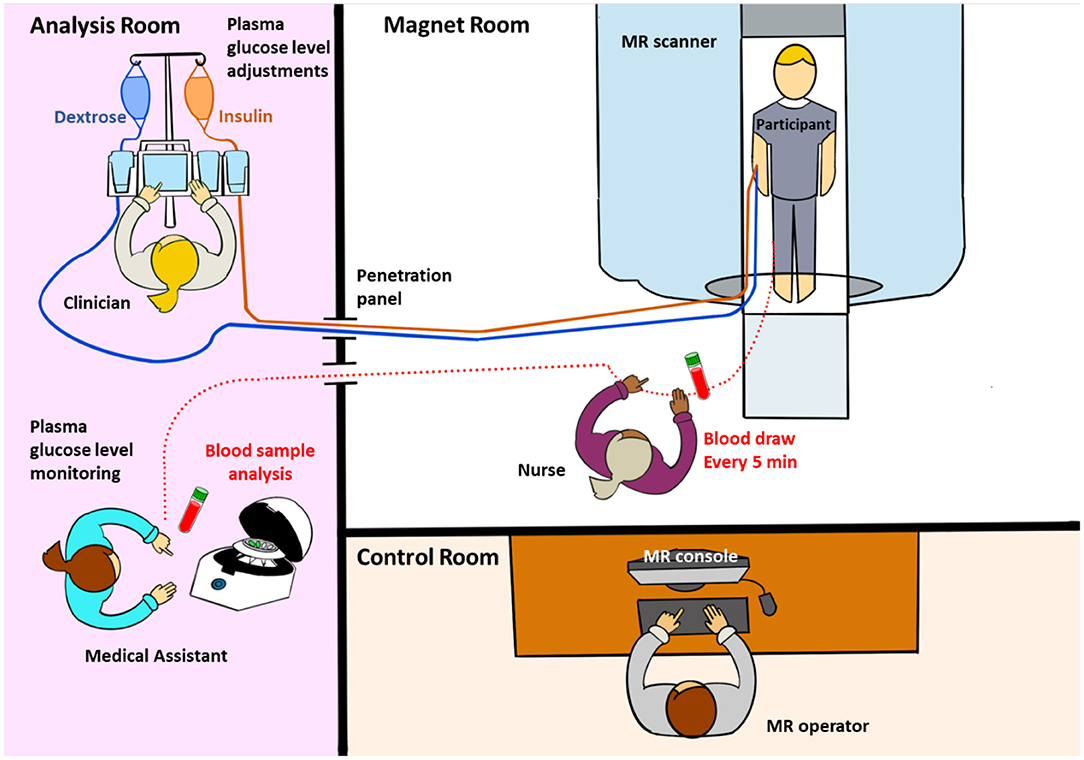
Figure 4. MRI/magnetic resonance spectroscopy (MRS) data acquisition during glucose clamp.
Channel-combined single-shot MRS spectra were saved to a DICOM file on the scanner. MATLAB-based MRspa software (36) was used to perform eddy-current, frequency, and phase corrections of single-shot spectra before averaging. Averaged MR spectra were quantified using LCModel (6.3-0G) with a density-matrix simulated basis dataset, as described previously (37). The simulated basis set includes aspartate (Asp), glutamine (Gln), myo-inositol (Ins), phosphoethanolamine (PE), phosphocholine (PCho), glycerylphosphorylcholine (GPC), creatine (Cr), phosphocreatine (PCr), N-acetylaspartate (NAA), N-acetylaspartylglutamate (NAAG), and taurine (Tau), in addition to GABA, Glu, GSH, Glc, and Lac.
Metabolite concentrations were corrected for T2 relaxation of tissue water and cerebrospinal fluid (CSF) content. CSF fraction within each VOI was estimated using image segmentation. A Matlab (v2019b, MathWorks, Natick, MA, USA) script was used to generate voxel masks over T1 and PD structural images. Tissue segmentation was performed in SPM12 using T1 and PD structural images. Tissue water fraction values were set to 84% for the PFC and 75.8% for the HTL (38). As the apparent T2 relaxation rate is slower due to the Carr–Purcell (CP) conditions of semi-LASER, we used corrected T2 relaxation times of water to estimate metabolite concentrations under CP conditions. We assumed that the T2 of water under CP conditions is 1.5× longer than the measured free precession T2 based on a previous study that compared water T2 values measured with LASER and CP-LASER sequences (34, 39). Hence, T2 of tissue water was set to 87 ms for the PFC (37) and 66 ms for the HTL after the measured free precession T2 values for primarily gray- and white-matter VOI from prior work (40) were multiplied by 1.5. Metabolites with between-subject mean Cramér–Rao lower bounds (CRLB) equal to or <20% were reported. Sum of metabolites were reported if two metabolites showed strong negative correlation (r < −0.7), or if one of the individual concentrations in Glu+Gln or Glc+Tau did not meet the mean CRLB ≤20% criterion.
SNR and linewidth of the water reference spectra were used as quantitative measures for spectral quality. SNR was measured by dividing the amplitude (in the frequency domain) of the NAA peak by the root mean squared error (RMSE) of the spectral baseline between −5 and 0 ppm in averaged, non-weighted spectra. As the euglycemia and hypoglycemia datasets were collected from the same subject, we performed two-tailed, paired t-tests on the mean blood Glc, SNR, linewidth, and LCModel quantification results to evaluate differences between euglycemia and hypoglycemia for each VOI. Multiple comparison correction was not performed. p-Values of 0.05 or lower were considered significant.
Dielectric pads produced with BaTiO3 water mixtures allowed production of pads with high dielectric constants while having a thin profile of 5.5 mm. Scans with and without the BaTiO3 pad showed that in the frontal cortex was substantially improved by use of the pad (Figure 5). Simulation of the sLASER pulse sequence showed that the RF power necessary for 90° excitation is 26.1 μT and that the GOIA-WURST refocusing pulses in sLASER would lose adiabaticity if the RF power is below 18.8 μT. Actual RF power delivered to the PFC was 16.5–17.8 μT without dielectric pad and 21.3–28.2 μT with the pad. For the HTL, the values were 23.5–29.1 μT without pad and 23.9–35.6 μT with the pad. Consistently, the improvement in signal quality was more profound in the PFC (54–82% gain in SNR) than in the HTL (8–18% gain in SNR) when using the pad (Figures 5B,D).

Figure 5. map comparisons (A,C) show improvement of in the frontal cortex (PFC) with BaTiO3 pad placed on the subject's forehead. (B) About 60% gain in signal-to-noise ratio (SNR) was achieved in sLASER MR spectra (TE/TR = 5,000/26 ms) in PFC (64 transients) with the pad. (D) Smaller SNR gain was seen in hypothalamus (HTL) (32 transients), because the distribution of the coil (without padding) is the highest in the center of the brain, close to the HTL location.
MR data were acquired during Glc clamps using a BaTiO3 pad with dimensions of 180 × 100 × 5.5 mm3. While few acquisitions reached the SAR limit, most stayed under the limit. We have limited the Tx voltage to 235 V as a safety precaution, which in some subjects was well-below the SAR limit imposed by the system. Mean to the PFC was 23.7 ± 1.1 μT and to the HTL was 24.6 ± 1.9 μT (N = 6).
Real-time motion, frequency, and first-order B0 shim correction allowed preservation of spectral quality during euglycemic and hypoglycemic Glc clamps. The spectra acquired from both regions had good quality with flat baseline, excellent SNR, and no unwanted coherences. Spectral quality was consistent between euglycemia and hypoglycemia (Figure 6).

Figure 6. Semi-LASER MR spectra (7T, TR/TE = 5,000/26 ms, 64 transients for frontal cortex (PFC) (A) and 256 transients for hypothalamus (HTL) (B)) acquired from six subjects during glucose clamps.
Across-subject means of plasma Glc showed that glycemia was well-maintained in the target range during data acquisition from each VOI (Table 1). Spectral quality metrics of PFC and HTL spectra obtained during euglycemia and hypoglycemia did not show any significant differences (Table 2). All water reference linewidths were well-below the recommended 19-Hz threshold for excluding spectra (41); therefore, no spectra were excluded from analysis. In addition, no single shots were excluded due to poor quality for PFC datasets (64 transients). For the HTL, all but one subject (N = 5) had complete data (256 transients) for the analysis. In the one subject with incomplete HTL data, two single shots were removed from the euglycemia dataset, and one shot was removed from the hypoglycemia dataset.
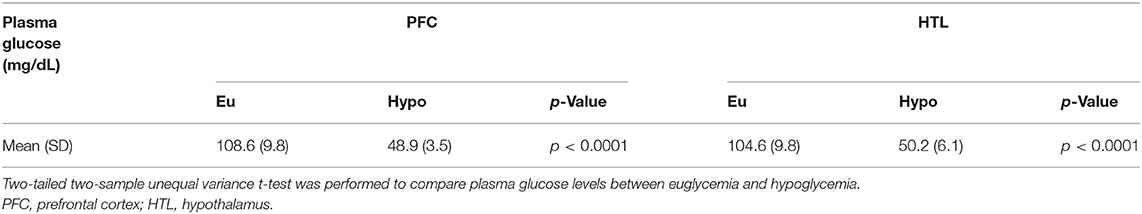
Table 1. Mean plasma glucose values for both volumes of interests (VOIs) during euglycemic and hypoglycemic glucose clamps in patients with type 1 diabetes (N = 6).
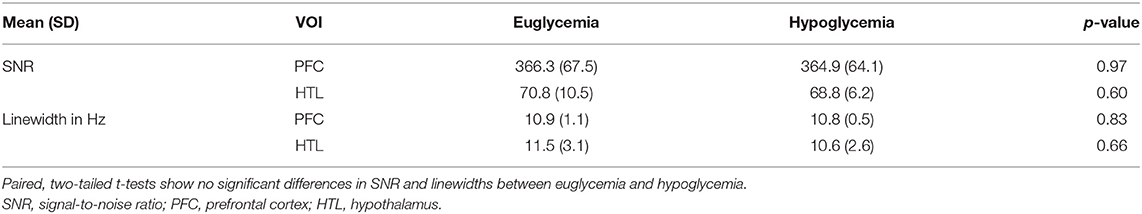
Table 2. Signal-to-noise ratio (SNR) and linewidth (full-width at half-maximum) of water reference spectra for both volumes of interests (VOIs) during euglycemic and hypoglycemic glucose clamps in patients with type 1 diabetes (N = 6).
The spectral quality allowed reliable (mean CRLB ≤ 20%) estimation of the concentrations of 11 metabolites (GABA, Gln, Glu, GSH, Ins, Lac, PE, PCho+GPC, Cr+PCr, NAA+NAAG, and Glc+Tau) for the HTL and 12 metabolites (all HTL metabolites and Asp) for the PFC (Supplementary Table). Changes in Glc+Tau in response to glycemic changes were seen in both the PFC and HTL, which is attributable to changes in brain Glc (21). Visual inspection of between-subject averaged euglycemia and hypoglycemia spectra and their difference showed a lower Glc contribution in the hypoglycemia vs. euglycemia spectra (Figure 7).
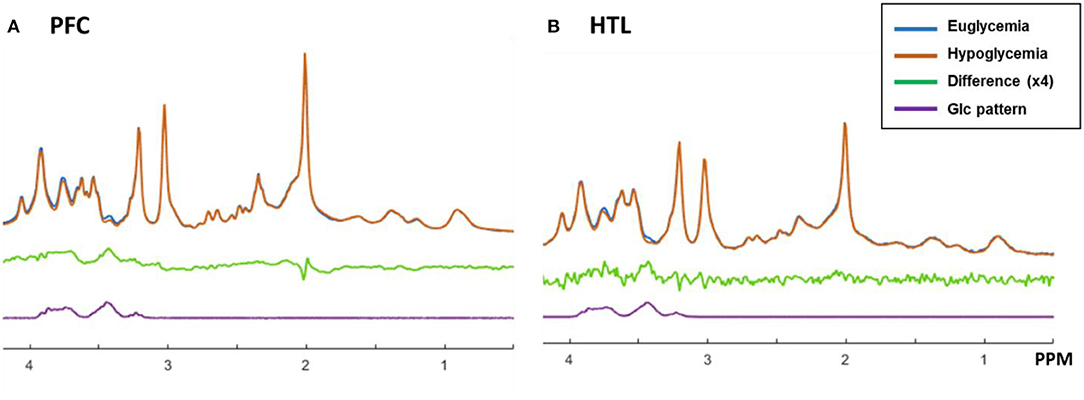
Figure 7. Proton MR spectra of prefrontal cortex (PFC, A) and hypothalamus (HTL, B) acquired during euglycemia (blue) and hypoglycemia (orange) and averaged across subjects (N = 6). The difference between spectra acquired during euglycemia and hypoglycemia is shown in green together with the spectral pattern of glucose in purple.
Metabolite level estimations confirmed lower level of Glc+Tau in hypoglycemia than euglycemia spectra for both the PFC (p = 0.02) and HTL (p = 0.02) (Supplementary Table). In addition, a trend for lower mean Glu values was observed during hypoglycemia vs. euglycemia in both the PFC and HTL (p = 0.1) (Figure 8).
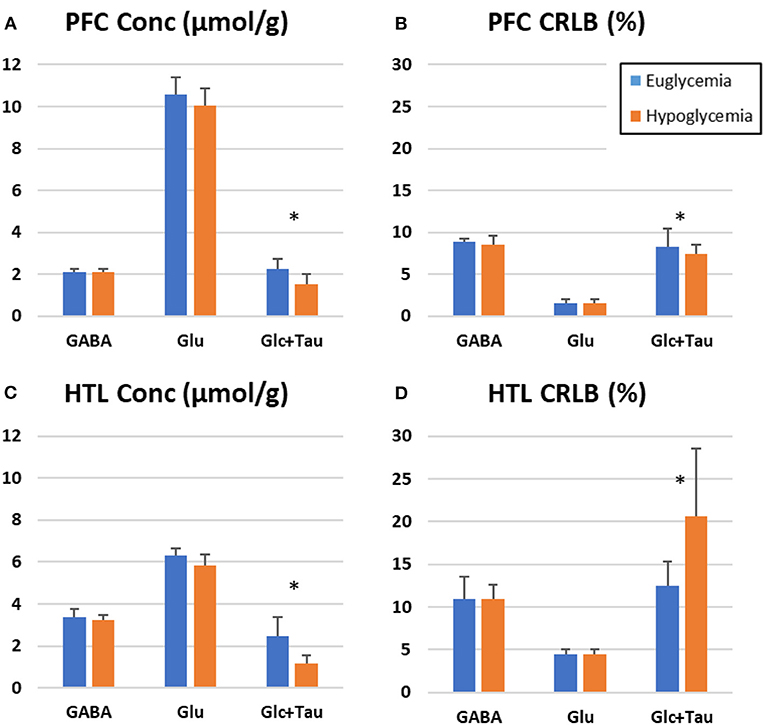
Figure 8. LC Model estimation of metabolites-of-interest for prefrontal cortex (PFC, A,B) and hypothalamus (HTL, C,D) during euglycemic and hypoglycemic glucose clamps-bar graph represents the mean value across participants (N = 6) with error bars representing the standard deviation. (Stars indicate p < 0.05, paired 2-tailed t-tests).
In this study, we developed and evaluated a highly optimized protocol for reliable acquisition of MRS data at UHF using commercial 7T hardware during lengthy clamp studies in the scanner where blood Glc is maintained at targeted ranges. The proposed protocol and in particular optical motion tracking offer highly improved data stability over our previous protocol for the HTL (11). Use of BaTiO3 dielectric padding enables data acquisition in the cortical regions of the brain using the widely available Nova coil.
We found that BaTiO3 padding of 5.5-mm thickness allowed sufficient RF power delivery to the PFC region (Figure 5). A thicker pad with 7-mm thickness did not fit inside the coil. Using simulations, we also found that 90° excitation required 26.1 μT and that 18.8 μT was the minimum threshold for adiabatic refocusing. RF power delivery below 18.8 μT is expected to yield sub-adiabatic refocusing in addition to insufficient excitation with the sLASER pulse sequence. The BaTiO3 pads with 5.5-mm thickness yielded sufficient RF power delivery for excitation (close to 26.1 μT) and adiabatic refocusing (>18.8 μT) to both the PFC and HTL with the 7T commercial single-transmit head coil. Comparison of the MRS data with vs. without padding showed SNR gains when using the BaTiO3 padding on the forehead, with PFC VOI showing large improvement (54–82%) in SNR over the dataset acquired without the pad.
The gain in SNR was relatively small for the HTL, and the padding on the forehead had minimal impact on the RF power transmitted to the HTL region. RF transmission to the HTL VOI is already sufficient with the single-channel Tx Nova coil without BaTiO3 padding because of the location of the VOI in the center of the brain with peak RF delivery. Note that in some participants, peak did not perfectly overlap our PFC or HTL VOI, as we had to avoid placing the BaTiO3 pad over the participant's eyes. Nonetheless, we were still able to observe a drastic improvement in the SNR over datasets collected without BaTiO3 pads.
Testing the protocol during long hypoglycemic Glc clamps on six patients showed excellent data quality with our proposed methodology. Motion tracking with dynamic shim updates allowed consistent data quality throughout the 22-min HTL acquisition, as well as between the euglycemia and hypoglycemia. This is critical especially for challenging VOI such as the HTL where almost half the datasets had to be excluded due to subject motion in a similar MRS study during a hypoglycemic clamp (11). The camera-based motion tracking allows high sensitivity to minor motion by detecting sub-millimeter displacements. For small VOIs such as the HTL (13 × 12 × 10 mm3), a displacement of few millimeters substantially displaces the VOI to unintented brain regions. The technical improvement alleviates the issue of subject motion and offers increased flexibility when the scan is accompanied with the complex Glc clamp procedures.
LCModel fitting of the processed spectra allowed the reliable quantification of an extended neurochemical profile in both the PFC and HTL regions. With the techniques to track and correct for motion, the proposed protocol allowed almost all of the transients collected on the HTL to be used for the analysis, which yielded an increase in SNR in the summed spectra and number of identifiable metabolites by LCModel. Thereby, we were able to reliably quantify 11 metabolites from this challenging brain region, a higher number than prior reports in human subjects (11, 42, 43). The newly quantifiable metabolites include GSH, Lac, and PE, which could provide additional information on neurochemical dynamics in response to changing glycemia. Importantly, the number of reliably quantified metabolites was similar between the two regions (12 vs. 11) despite PFC having much larger volume (8.64 mL) over the HTL (1.56 mL). Estimated concentrations (mM) and corresponding CRLB (%) showed a good reproducibility between datasets acquired at euglycemia and hypoglycemia.
With similar spectral quality between euglycemia and hypoglycemia, we were able to observe the effects of hypoglycemia on neurochemical concentrations. The expected Glc decline in the brain upon hypoglycemia is reliably detected by changes in the levels of Glc+Tau concentrations (Figure 8). We also observed a trend for lower mean Glu level with hypoglycemia in both VOI, consistent with prior observations in the OCC (10, 44). Other metabolites largely remained unchanged in response to hypoglycemia in this small sample, which reflects the brain's ability to maintain metabolic homeostasis despite drastic changes in Glc availability.
The hypoglycemic Glc clamp was designed to reproduce the real-life condition where the plasma Glc levels dropped from euglycemia to hypoglycemia. In theory, we could start the experiment with euglycemia outside the scanner, then drop blood Glc level, scan the participant, and finally increase the blood Glc back to euglycemia in the scanner for temporal randomization. However, this would be an even more challenging study design with increased scan time and resources to the current design, while adding little clinical value to our overall goal of studying the brain's response to acute hypoglycemia. Hence, such a design was not considered.
The sample size (N = 6) for the data acquired in patients with diabetes was small since these data were acquired to technically evaluate the protocol and not intended to statistically test hypotheses about cerebral responses to hypoglycemia. Hence, data with larger sample sizes will be needed to confirm whether the Glu trend observed in both VOI is significant.
In addition, even though our proposed protocol incorporated as much commercial solutions as possible, several of our components such as the BaTiO3 pad and nose attachment for the motion tracking marker had to be built in-house. A tooth attachment is now commercially available from KinetiCor for use in volume coils and will be incorporated in future studies. In addition, dielectric padding for neuroimaging is becoming commercially available with wider access to 7T scanners, including two FDA-approved 7T platforms.
Finally, while these experiments are challenging to implement, it is not possible to reduce the time and the complexity of these studies because of the large variation in insulin sensitivity seen among different people and the risks associated with hypoglycemia. The insulin infusion rate we administered was selected to cause hypoglycemia in humans with average insulin sensitivity, which may vary if the subject is either highly sensitive or resistant to insulin. Subjects who are very sensitive to insulin drop their blood sugar quite quickly in response to this infusion. As hypoglycemia is associated with a risk of unconsciousness, seizure, arrhythmia, and death, constant plasma Glc level monitoring along with adjustment of insulin infusion must be performed at all times. In addition, it takes about 20 min before the brain and plasma Glc levels come into equilibrium after a new target glycemia has been reached in the blood (45), meaning that sufficient time needs to pass before acquiring data in the brain at the target glycemia. Therefore, these challenging experimental procedures are intended for mechanistic studies at specialized research centers. Access to an UHF platform is necessary for optimal reproducibility of weakly represented metabolites and small VOI (37). On the other hand, the 3T would be the preferred platform if the primary metabolite of interest is Glc because Glc is quantified more reliably at 3T than 7T due to a simpler spectral pattern at the lower field (21, 37).
Here, we demonstrate a highly optimized 7T MRS protocol that combined a commercial RF coil, BaTiO3 dielectric padding, optical motion tracking and frequency, and B0 shim corrections to ensure optimal stability of data quality during a challenging infusion protocol to maintain euglycemic and hypoglycemic blood Glc levels in clinical cohorts. The use of BaTiO3 padding boosted RF energy delivery to the PFC, allowing adiabaticity in sLASER at short TE and thereby optimal SNR and localization. Real-time motion, frequency, and B0 shim correction enabled acquisition of high-quality spectra throughout the prolonged MR sessions. The proposed protocol will allow robust mechanistic investigations of the primary neurotransmitters, Glu and GABA, under changing glycemic conditions.
The raw data supporting the conclusions of this article will be made available by the authors, without undue reservation.
The studies involving human participants were reviewed and approved by University of Minnesota Institutional Review Board. The patients/participants provided their written informed consent to participate in this study.
GÖ and ES conceived and planned the experiments. DD and JJ performed technical implementation of the proposed pipeline. YP, DD, AK, AA, and ES carried out the data acquisition. YP and DD performed data analysis. YP, DD, AM, ES, and GÖ contributed to the interpretation of the results. YP wrote the manuscript. All authors provided critical feedback and helped shape the research, analysis, and manuscript.
This work was supported by the National Institute of Neurological Disorders and Stroke (NINDS) Grant R01 NS035192. The Center for Magnetic Resonance Research (CMRR) was supported by the National Institute of Biomedical Imaging and Bioengineering (NIBIB) Grant P41 EB027061 and NINDS Grant P30 NS076408. The content is solely the responsibility of the authors and does not necessarily represent the official views of the funding agencies.
The authors declare that the research was conducted in the absence of any commercial or financial relationships that could be construed as a potential conflict of interest.
All claims expressed in this article are solely those of the authors and do not necessarily represent those of their affiliated organizations, or those of the publisher, the editors and the reviewers. Any product that may be evaluated in this article, or claim that may be made by its manufacturer, is not guaranteed or endorsed by the publisher.
The Supplementary Material for this article can be found online at: https://www.frontiersin.org/articles/10.3389/fneur.2021.698675/full#supplementary-material
1. Li CT, Yang KC, Lin WC. Glutamatergic dysfunction and glutamatergic compounds for major psychiatric disorders: evidence from clinical neuroimaging studies. Front Psychiatry. (2018) 9:767. doi: 10.3389/fpsyt.2018.00767
2. Schur RR, Draisma LW, Wijnen JP, Boks MP, Koevoets MG, Joels M, et al. Brain GABA levels across psychiatric disorders: a systematic literature review and meta-analysis of (1) H-MRS studies. Hum Brain Mapp. (2016) 37:3337–52. doi: 10.1002/hbm.23244
3. Reddy-Thootkur M, Kraguljac NV, Lahti AC. The role of glutamate and GABA in cognitive dysfunction in schizophrenia and mood disorders - a systematic review of magnetic resonance spectroscopy studies. Schizophr Res. (2020). doi: 10.1016/j.schres.2020.02.001. [Epub ahead of print].
4. Camandola S, Mattson MP. Brain metabolism in health, aging, and neurodegeneration. EMBO J. (2017) 36:1474–92. doi: 10.15252/embj.201695810
5. Hertz L. The Glutamate-Glutamine (GABA) Cycle: importance of late postnatal development and potential reciprocal interactions between biosynthesis and degradation. Front Endocrinol (Lausanne). (2013) 4:59. doi: 10.3389/fendo.2013.00059
6. Oz G, Okar DA, Henry PG. Glutamate-glutamine cycle and anaplerosis. In: Gruetter RC IY, editor. Neural Metabolism In vivo, Volume 4. New York, NY: Springer (2012). doi: 10.1007/978-1-4614-1788-0_32
7. Choi IY, Shen J. In vivo GABA metabolism. In: Gruetter RC IY, editor. Neural Metabolism In vivo, Volume 4. New York, NY: Springer (2012). p. 1095–116. doi: 10.1007/978-1-4614-1788-0_39
8. Rao R, Ennis K, Long JD, Ugurbil K, Gruetter R, Tkac I. Neurochemical changes in the developing rat hippocampus during prolonged hypoglycemia. J Neurochem. (2010) 114:728–38. doi: 10.1111/j.1471-4159.2010.06797.x
9. Chan O, Cheng H, Herzog R, Czyzyk D, Zhu W, Wang A, et al. Increased GABAergic tone in the ventromedial hypothalamus contributes to suppression of counterregulatory responses after antecedent hypoglycemia. Diabetes. (2008) 57:1363–70. doi: 10.2337/db07-1559
10. Terpstra M, Moheet A, Kumar A, Eberly LE, Seaquist E, Oz G. Changes in human brain glutamate concentration during hypoglycemia: insights into cerebral adaptations in hypoglycemia-associated autonomic failure in type 1 diabetes. J Cerebr Blood F Met. (2014) 34:876–82. doi: 10.1038/jcbfm.2014.32
11. Moheet A, Emir UE, Terpstra M, Kumar A, Eberly LE, Seaquist ER, et al. Initial experience with seven tesla magnetic resonance spectroscopy of hypothalamic GABA during hyperinsulinemic euglycemia and hypoglycemia in healthy humans. Magn Reson Med. (2014) 71:12–8. doi: 10.1002/mrm.24663
12. Wiegers EC, Rooijackers HM, Tack CJ, Heerschap A, de Galan BE, van der Graaf M. Brain lactate concentration falls in response to hypoglycemia in patients with type 1 diabetes and impaired awareness of hypoglycemia. Diabetes. (2016) 65:1601–5. doi: 10.2337/db16-0068
13. Gulanski BI, De Feyter HM, Page KA, Belfort-DeAguiar R, Mason GF, Rothman DL, et al. Increased brain transport and metabolism of acetate in hypoglycemia unawareness. J Clin Endocrinol Metab. (2013) 98:3811–20. doi: 10.1210/jc.2013-1701
14. McCrimmon RJ, Oz G. Cerebral adaptation to recurrent hypoglycemia. In: Robertson PR, Seaquist ER, editors. Translational Endocrinology & Metabolism, Volume 3. Chevy Chase, MD: Endocrine Society (2012). p. 89–114. doi: 10.1210/TEAM.9781936704200.ch3
15. Cryer PE. Mechanisms of hypoglycemia-associated autonomic failure in diabetes. N Engl J Med. (2013) 369:362–72. doi: 10.1056/NEJMra1215228
16. Routh VH. Glucose sensing neurons in the ventromedial hypothalamus. Sensors (Basel). (2010) 10:9002–25. doi: 10.3390/s101009002
17. Thorens B. Brain glucose sensing and neural regulation of insulin and glucagon secretion. Diabetes Obes Metab. (2011) 13(Suppl. 1):82–8. doi: 10.1111/j.1463-1326.2011.01453.x
18. Dunn JT, Cranston I, Marsden PK, Amiel SA, Reed LJ. Attenuation of amydgala and frontal cortical responses to low blood glucose concentration in asymptomatic hypoglycemia in type 1 diabetes: a new player in hypoglycemia unawareness? Diabetes. (2007) 56:2766–73. doi: 10.2337/db07-0666
19. Bingham EM, Dunn JT, Smith D, Sutcliffe-Goulden J, Reed LJ, Marsden PK, et al. Differential changes in brain glucose metabolism during hypoglycaemia accompany loss of hypoglycaemia awareness in men with type 1 diabetes mellitus. An [11C]-3-O-methyl-D-glucose PET study. Diabetologia. (2005) 48:2080–9. doi: 10.1007/s00125-005-1900-6
20. Mangia S, Tkac I, Gruetter R, Van De Moortele PF, Giove F, Maraviglia B, et al. Sensitivity of single-voxel 1H-MRS in investigating the metabolism of the activated human visual cortex at 7 T. Magn Reson Imaging. (2006) 24:343–8. doi: 10.1016/j.mri.2005.12.023
21. Joers JM, Deelchand DK, Kumar A, Moheet A, Seaquist E, Henry PG, et al. Measurement of hypothalamic glucose under euglycemia and hyperglycemia by MRI at 3T. J Magn Reson Imaging. (2017) 45:681–91. doi: 10.1002/jmri.25383
22. De Feyter HM, Mason GF, Shulman GI, Rothman DL, Petersen KF. Increased brain lactate concentrations without increased lactate oxidation during hypoglycemia in type 1 diabetic individuals. Diabetes. (2013) 62:3075–80. doi: 10.2337/db13-0313
23. Ip IB, Berrington A, Hess AT, Parker AJ, Emir UE, Bridge H. Combined fMRI-MRS acquires simultaneous glutamate and BOLD-fMRI signals in the human brain. Neuroimage. (2017) 155:113–9. doi: 10.1016/j.neuroimage.2017.04.030
24. Teeuwisse WM, Brink WM, Haines KN, Webb AG. Simulations of high permittivity materials for 7 T neuroimaging and evaluation of a new barium titanate-based dielectric. Magn Reson Med. (2012) 67:912–8. doi: 10.1002/mrm.24176
25. Neubrand A, Lindner R, Hoffmann P. Room-temperature solubility behavior of barium titanate in aqueous media. J Am Ceram Soc. (2000) 83:860–4. doi: 10.1111/j.1151-2916.2000.tb01286.x
26. Oz G, Tkac I. Short-echo, single-shot, full-intensity proton magnetic resonance spectroscopy for neurochemical profiling at 4 T: validation in the cerebellum and brainstem. Magnet Reson Med. (2011) 65:901–10. doi: 10.1002/mrm.22708
27. Deelchand DK, Berrington A, Noeske R, Joers JM, Arani A, Gillen J, et al. Across-vendor standardization of semi-LASER for single-voxel MRS at 3T. NMR Biomed. (2019) 34:e4218. doi: 10.1002/nbm.4218
28. Tkac I, Starcuk Z, Choi IY, Gruetter R. In vivo 1H NMR spectroscopy of rat brain at 1 ms echo time. Magn Reson Med. (1999) 41:649–56. doi: 10.1002/(sici)1522-2594(199904)41:4<649::aid-mrm2>3.0.co;2-g
29. Deelchand DK, Joers JM, Auerbach EJ, Henry PG. Prospective motion and B0 shim correction for MR spectroscopy in human brain at 7T. Magn Reson Med. (2019) 82:1984–92. doi: 10.1002/mrm.27886
30. Gruetter R, Tkac I. Field mapping without reference scan using asymmetric echo-planar techniques. Magnet Reson Med. (2000) 43:319–23. doi: 10.1002/(sici)1522-2594(200002)43:2<319::aid-mrm22>3.0.co;2-1
31. Clarke WL, Cox DJ, Gonder-Frederick LA, Julian D, Schlundt D, Polonsky W. Reduced awareness of hypoglycemia in adults with IDDM. A prospective study of hypoglycemic frequency and associated symptoms. Diabetes Care. (1995) 18:517–22. doi: 10.2337/diacare.18.4.517
32. Gold AE, MacLeod KM, Frier BM. Frequency of severe hypoglycemia in patients with type I diabetes with impaired awareness of hypoglycemia. Diabetes Care. (1994) 17:697–703. doi: 10.2337/diacare.17.7.697
33. Yarnykh VL. Actual flip-angle imaging in the pulsed steady state: a method for rapid three-dimensional mapping of the transmitted radiofrequency field. Magn Reson Med. (2007) 57:192–200. doi: 10.1002/mrm.21120
34. Deelchand DK, Adanyeguh IM, Emir UE, Nguyen TM, Valabregue R, Henry PG, et al. Two-site reproducibility of cerebellar and brainstem neurochemical profiles with short-echo, single-voxel MRS at 3T. Magn Reson Med. (2015) 73:1718–25. doi: 10.1002/mrm.25295
35. Seaquist ER, Damberg GS, Tkac I, Gruetter R. The effect of insulin on in vivo cerebral glucose concentrations and rates of glucose transport/metabolism in humans. Diabetes. (2001) 50:2203–9. doi: 10.2337/diabetes.50.10.2203
36. Deelchand DK. MRspa: Magnetic Resonance Signal Processing and Analysis. Minneapolis, Minnesota, U.S.A. (2016). Available online at: https://www.cmrr.umn.edu/downloads/mrspa/ (accessed July, 2021).
37. Terpstra M, Cheong I, Lyu T, Deelchand DK, Emir UE, Bednarik P, et al. Test-retest reproducibility of neurochemical profiles with short-echo, single-voxel MR spectroscopy at 3T and 7T. Magn Reson Med. (2016) 76:1083–91. doi: 10.1002/mrm.26022
38. Randall LO. Chemical topography of the brain. J Biol Chem. (1938) 124:0481–8. doi: 10.1016/S0021-9258(18)74053-2
39. Bartha R, Michaeli S, Merkle H, Adriany G, Andersen P, Chen W, et al. In vivo 1H2O T2+ measurement in the human occipital lobe at 4T and 7T by Carr-Purcell MRI: detection of microscopic susceptibility contrast. Magn Reson Med. (2002) 47:742–50. doi: 10.1002/mrm.10112
40. Joers JM, Deelchand DK, Lyu T, Emir UE, Hutter D, Gomez CM, et al. Neurochemical abnormalities in premanifest and early spinocerebellar ataxias. Ann Neurol. (2018) 83:816–29. doi: 10.1002/ana.25212
41. Oz G, Deelchand DK, Wijnen JP, Mlynarik V, Xin L, Mekle R, et al. Advanced single voxel (1) H magnetic resonance spectroscopy techniques in humans: experts' consensus recommendations. NMR Biomed. (2020). doi: 10.1002/nbm.4236. [Epub ahead of print].
42. Jacobs GE, der Grond J, Teeuwisse WM, Langeveld TJ, van Pelt J, Verhagen JC, et al. Hypothalamic glutamate levels following serotonergic stimulation: a pilot study using 7-Tesla magnetic resonance spectroscopy in healthy volunteers. Prog Neuropsychopharmacol Biol Psychiatry. (2010) 34:486–91. doi: 10.1016/j.pnpbp.2010.01.019
43. Kantorova E, Polacek H, Bittsansky M, Baranovicova E, Hnilicova P, Cierny D, et al. Hypothalamic damage in multiple sclerosis correlates with disease activity, disability, depression, and fatigue. Neurol Res. (2017) 39:323–30. doi: 10.1080/01616412.2016.1275460
44. Bischof MG, Brehm A, Bernroider E, Krssak M, Mlynarik V, Krebs M, et al. Cerebral glutamate metabolism during hypoglycaemia in healthy and type 1 diabetic humans. Eur J Clin Invest. (2006) 36:164–9. doi: 10.1111/j.1365-2362.2006.01615.x
Keywords: magnetic resonance spectography, ultrahighfield MRI, dielectric pad, prospective motion correction, brain metabolism
Citation: Park YW, Deelchand DK, Joers JM, Kumar A, Alvear AB, Moheet A, Seaquist ER and Öz G (2021) Monitoring the Neurotransmitter Response to Glycemic Changes Using an Advanced Magnetic Resonance Spectroscopy Protocol at 7T. Front. Neurol. 12:698675. doi: 10.3389/fneur.2021.698675
Received: 21 April 2021; Accepted: 02 July 2021;
Published: 18 August 2021.
Edited by:
Georg Oeltzschner, Johns Hopkins University, United StatesReviewed by:
Kelley M. Swanberg, Columbia University, United StatesCopyright © 2021 Park, Deelchand, Joers, Kumar, Alvear, Moheet, Seaquist and Öz. This is an open-access article distributed under the terms of the Creative Commons Attribution License (CC BY). The use, distribution or reproduction in other forums is permitted, provided the original author(s) and the copyright owner(s) are credited and that the original publication in this journal is cited, in accordance with accepted academic practice. No use, distribution or reproduction is permitted which does not comply with these terms.
*Correspondence: Young Woo Park, cGFyazE1NTZAdW1uLmVkdQ==; Gülin Öz, Z3VsaW5AY21yci51bW4uZWR1
Disclaimer: All claims expressed in this article are solely those of the authors and do not necessarily represent those of their affiliated organizations, or those of the publisher, the editors and the reviewers. Any product that may be evaluated in this article or claim that may be made by its manufacturer is not guaranteed or endorsed by the publisher.
Research integrity at Frontiers
Learn more about the work of our research integrity team to safeguard the quality of each article we publish.