- 1Department of Biostatistics, Virginia Commonwealth University, Richmond, VA, United States
- 2Department of Internal Medicine, School of Medicine, Virginia Commonwealth University, Richmond, VA, United States
- 3Department of Neurology, School of Medicine, Virginia Commonwealth University, Richmond, VA, United States
Background: The six-minute walk (6MW) test is a validated assessment method in Multiple Sclerosis (MS) research. While the total distance covered during six minutes (6MWTD) is often used as the standard measurement of gait capacity (i.e., the maximum distance one can achieve), we hypothesize that endurance (i.e., ability to maintain speed over a prolonged time) can be inferred by the gait speed trajectory (GST) during the 6MW test (6MWGST).
Objective: To characterize group differences in 6MWGST between MS patients and healthy controls (HCs), and to assess information added by 6MWGST for discerning between MS patients and HCs.
Methods: We performed a secondary data analysis on a cross-sectional cohort of 40 MS and 20 HC subjects with three repeated 6MW tests. We modeled 6MWGST using a linear mixed-effects model with time in minutes and replicated walks nested within individuals. We compared the discernibility of 6MWGST with that of conventional metrics using likelihood ratio tests and receiver operating characteristic (ROC) analysis on logistic regression models.
Results: MS subjects showed a concave, quadratic GST during 6MW tests, slowing down more than the HC subjects, especially at the beginning of 6MW tests. Despite accelerating at the end of the 6MW, MS subjects were unable to attain or surpass their initial 6MW gait speeds. 6MWGST added useful information (p = 0.002) to the conventional metrics (e.g., 6MWTD) for discerning between MS and HC subjects, and increased the area under the ROC curve from 0.83 to 0.93 (p = 0.037).
Conclusions: The distinctive 6MWGST pattern of MS patients provided increased discernibility compared with currently used gait metrics. Both gait capacity measured by the 6MWTD, and gait endurance measured by parameters of 6MWGST, are significant functional indicators for the MS population.
Introduction
Gait impairment is a central and ultimately inevitable aspect of multiple sclerosis (MS) that can be expressed as a decrease in gait speed, endurance, and balance. Thus, gait assessment is commonly employed in the evaluation of MS disability. Several timed-walk tests have been used in MS assessment that vary in the distance and duration of walking (e.g., timed 25-foot walk, two- and six-minute walk tests) (1–4). The six-minute walk (6MW) test has been used within MS studies and throughout health science. The 6MW total distance (6MWTD) is a validated, standard outcome that has demonstrated added value over shorter distance walk tests in that it measures gait capacity (i.e., the ability to achieve maximal distance) (5), offers improved precision (1), correlates with habitual gait performance (6), and correlates with other physiological measures (7). Some researchers have also explored minute-by-minute 6MW data, by computing the percentage change in gait speed in the 6th minute relative to the 1st minute, sometimes referred to as the Δ6MW (2, 3). In the largest study of Δ6MW in MS participants to date, Leone et al. (3) devised the distance walk index (DWI), which is the percentage change in gait speed in the nth minute relative to the 1st minute. Specifically, they used DWI at the 6th minute (i.e., Δ6MW as in other literature) to subgroup MS patients, demonstrating that more than 50% of their MS patients decelerated during 6MW tests. Van Geel et al. assessed the day-to-day reliability of Δ6MW, confirming consistent deceleration patterns in MS patients on two separate days (8). Ramari et al. demonstrated that in females with mild MS, knee flexor strength and balance are linked to the deceleration pattern in the 6MW test (9). Using temporally more continuous data collected by wearable sensors, Shema-Shiratzky et al. also demonstrated significant deterioration in cadence, stride regularity, and gait complexity among MS patients during 6MW tests (10).
Collectively, most literature on the 6MW test has been cross-sectional and based on a single 6MW. Moreover, the existing metric for measuring within-walk performance, Δ6MW, relies on the assumption that change in gait speed is linear, and can thus be captured by the gait speed in the first and last minutes alone. However, it is more likely that changes in gait speed vary across all six minutes, and the gait speed trajectories in the 6MW (6MWGST) may carry additional information which would more precisely measure endurance. We hypothesize that 6MWGST will provide additional information that goes beyond total distance (or equivalently, average gait speed), to give a true representation of endurance. In this manuscript, we analyze data from a previously published cohort (1), who performed three repeated 6MWs in a single day, using linear mixed-effects (LME) models. An LME model allows us to incorporate the full information from the minute-by-minute 6MWGST and assess the effect of MS status on gait endurance (measured by changes in 6MWGST), whilst accounting for idiosyncratic differences in the baseline gait speed.
Methods
Participants
A previously published cross-sectional study with a cohort of 60 subjects was analyzed (1). This cohort included 40 MS patients and 20 HC subjects who completed three repeated 6MW tests in a single day (1). Ethical approval for this study was obtained from the Cleveland Clinic Foundation Institutional Review Board (IRB). All participants provided written informed consent prior to any study procedures. The University of Virginia IRB provided approval for secondary analyses of the de-identified data presented herein.
The MS subjects had a diagnosis of clinically definite MS according to the McDonald Criteria (11) and were recruited from outpatients at the Cleveland Clinic neurology department. HC subjects were recruited through MS subjects (e.g., a spouse or a friend). All subjects were aged 18–64 years old, reported being able to walk for six minutes, and had an EDSS (Expanded Disability Status Scale) score no higher than 6.5. Exclusion criteria for all subjects included neurological impairment from other diagnoses, orthopedic limitations, morbid obesity (BMI > 40), or known cardiac or respiratory disease. All fatigue-related medications (e.g., dalfampridine or modafinil) were withheld 48 hours before the study visit to avoid underlying changes in gait function being obscured. Additional details regarding the study population can be found in the primary publication (1).
Clinical Assessment and Disability Measures
Baseline demographics, medical history, and medications were documented. MS-related disability was assessed using the EDSS (12). EDSS severity was further classified by a certified Neuro-status examiner [MDG]. The MS Functional Composite was also collected for further disability assessment. The MSFC is a composite measure of disability that includes a quantitative test of ambulation (timed 25-foot walk, T25FW) (13).
Six-Minute Walk (6MW) Tests
All 6MW tests took place in a 175-foot hallway using the protocol developed and validated by Goldman et al. (1). Subjects were asked to walk as far and as fast as possible and used their usual assistive devices. Subjects arrived at 9:00 a.m. for 6MW tests to eliminate any time-of-day variability and completed three 6MW tests (i.e., three replicates) during a single visit. To eliminate residual fatigue from the previous walk, subjects rested at least 30 minutes between tests. The minute-by-minute distance was recorded for each walk using floor markers at 8.5-foot intervals. Thus, each subject's 6MW test had one repeated-measure outcome at six time points for gait speed (i.e., distance walked per minute), and three explanatory variables—Time (indexed as 0, 1, 2, 3, 4, 5), Replicate (indexed as 0, 1, 2) as a categorical variable, and the MS status of the subject as a binary indicator (MS =1, HC = 0).
Statistical Analysis
We performed data analysis in Matlab 2019b (Mathworks Inc., Natick, Massachusetts) and R Studio (R version 3.6.3, RStudio Inc., Boston, Massachusetts). To accommodate the temporal variation in speed, and replicated walks nested within subjects, we fit LME models with the minute-by-minute gait speed data (or distance walked per minute) as the outcome variable. As preliminary analysis of the collected data revealed quadratic trajectories, we fit and tested the subject-specific linear and quadratic effects of time for MS and HC subjects. We also tested these temporal effects moderated by MS status.
LME models allow us to estimate the random variation of the 6MWGST over time, controlling for the effects of MS and other covariates. To demonstrate this advantage, we fit an LME model after dropping all MS status related terms, and estimated parameters of subject-specific 6MWGST (i.e., subject-specific intercepts and linear and quadratic slopes). These subject-specific metrics were then used as the predictors of a logistic regression model with MS status as the outcome variable. We compared the discernibility of the predicted subject-specific 6MWGST with other conventional metrics such as 6MWTD, Δ6MW, and T25FW. The Δ6MW (3, 14) is calculated as:
D6 is the gait speed (or distance covered) in the 6th minute and D1 is the gait speed in the 1st minute. For comparison, we used the MS status as a binary outcome, and developed five nested logistic regression models: (1) Model A contains parameters of subject-specific 6MWGST (i.e., subject-specific intercepts and linear and quadratic slopes estimated from an LME model) and the 6MWTD; (2) Model B uses Δ6MW and 6MWTD (3) Model C uses 6MWTD; (4) Model D uses the T25FW test (short-distance timed walk test); (5) Model E uses two covariates, age and sex, and is the baseline model in our study. Models A, B, C, and D were all adjusted for age and sex. For each model, we obtained the area under the receiver operating characteristic curve (AUROC) and the likelihood ratio χ2 statistic (tested against an intercept-only null model). We tested added information by comparing AUROC using DeLong's tests and likelihood ratio tests across pairs of models (15).
Results
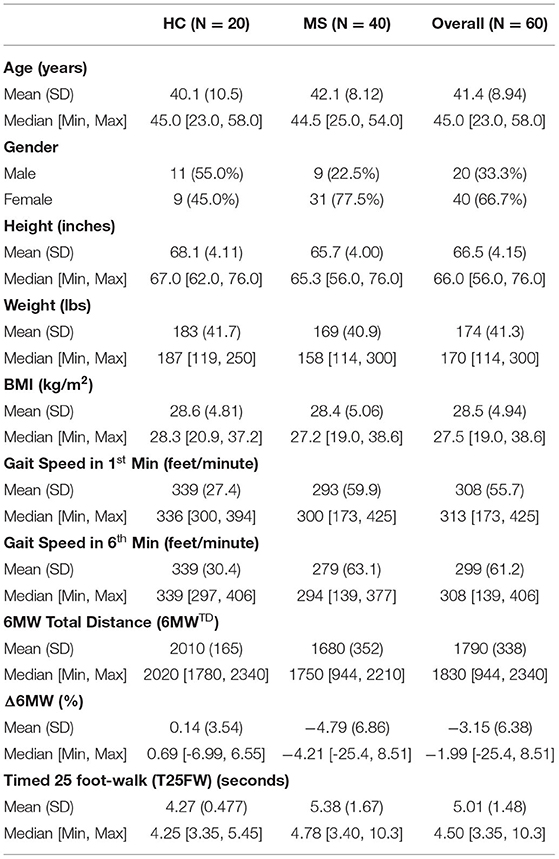
60 subjects (40 MS and 20 HC) participated in the study. Baseline characteristics for both study populations are presented in Table 1. In our MS sample, there were 3.4 times as many females as males. This is consistent with the prevalence of MS, i.e., females are three times more likely to develop MS than males. HC subjects were predominantly male, since we actively recruited spouses of MS patients as HC subjects. For the MS sample, the median EDSS was 3 with a range of 0–6.5. Apart from sex and height, there were no significant differences in baseline demographic characteristics between MS and HC participants [age (p = 0.461), height (p = 0.038), weight (p = 0.225) and BMI (p = 0.882)]. There were, however, significant differences in gait function. MS subjects covered less distance in the first minute, the last minute, and across the 6 minutes, than HC subjects [Gait speed in 1st min (p < 0.001), Gait speed in 6th min (p < 0.001), Total distance (p < 0.001)].
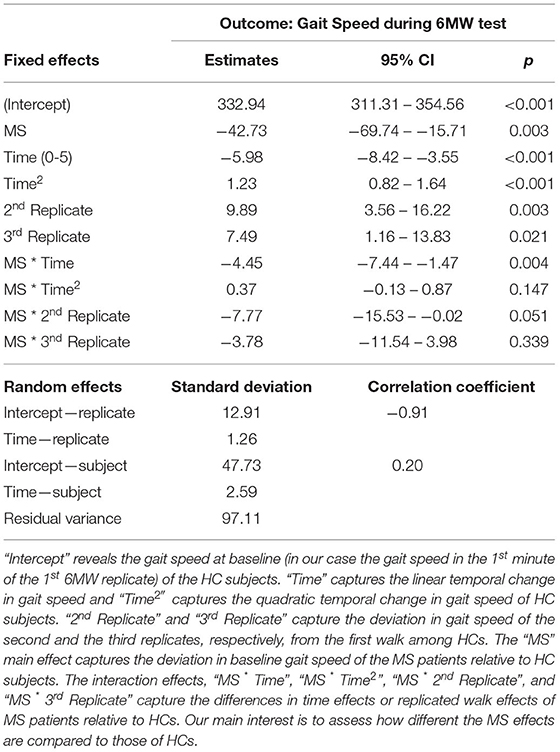
Results from the LME model are listed in Table 2. To obtain the nadir times (here 2.7 for the HC, and 4.13 for the MS patients) of the estimated quadratic curves, we rearranged the quadratic time effects by completing the squares:
We first adjusted for age, sex, height, and weight, and then removed these variables from the final model as their effects are insignificant. On average, MS subjects walked 42.73 feet/minute slower than the HCs at the baseline (p = 0.003). After the baseline, using the trajectory −42.73−4.45 × Time+.37 × Time2, MS patients continued to walk 46.81, 50.15, 52.75, 54.61, 55.73 feet/minute slower than the HCs in the subsequent minutes. Both MS and HC subjects decelerated during the first half of the 6MW, but the MS patients decelerated by 4.5, 3.5, 3.0 feet/minute2 more severely in the 2nd to the 4th minutes. In the second half of the 6MW, the HC subjects began to accelerate following a nadir in the 3rd minute. In contrast, MS participants were unable to accelerate as early as HCs. As a result, at the end of the 6MW, HC subjects were able to walk as fast as at the baseline, whereas MS subjects ended up far below their baseline speed. Over the repeated walks, the HC group increased gait speed during the second walk (by 9.9 feet/minute, p = 0.003) and the third walk (by 7.5 feet/minute, p = 0.021), whereas the MS group only slightly increased gait speed over the repeated walks.
Figure 1 shows the predicted trajectories of MS patients and HCs over replicated 6MW tests, as an illustration of our findings detailed in Table 2. First, there is a large difference in gait speed between the groups. HC subjects, despite decelerating in the first half of the 6MW test, exhibit acceleration over the second half of the 6MW test. In contrast, MS participants decelerate more rapidly in the first half of the 6MW and are unable to return to their baseline speed in the final minute. Moreover, while the HCs are able to improve their speeds over the replicated walks, the MS patients show no significant change in their gait speed over repeated walks. These findings suggest such differences are more likely to reflect the inherent pathology among MS subjects.
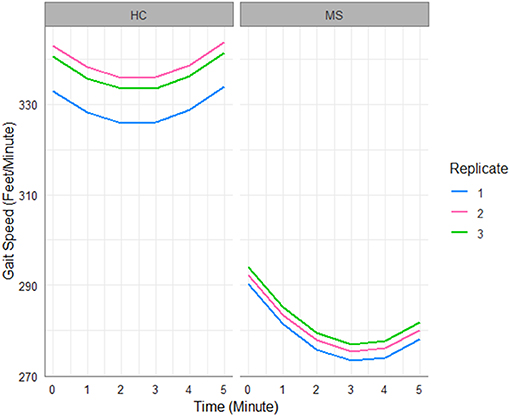
Figure 1. Gait speed trajectories predicted by the fitted LME model in Table 2.
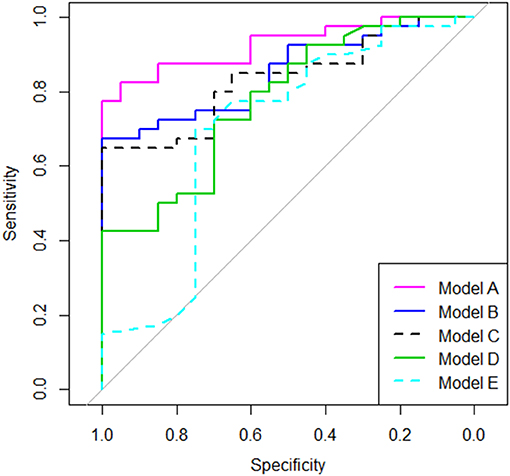
Using nested logistic regression models, we compared the conventional metrics such as 6MWTD, Δ6MW, and T25FW with the 6MWGST parameters estimated by the LME model as explained in the Statistical Analysis section. Table 3 shows model comparison results. Our Model A (6MWGST + 6MWTD) added significantly more information (p = 0.002) to Model C (6MWTD) and improved predictability (p = 0.037), whereas Model B (Δ6MW + 6MWTD) did not. While Model D (Timed 25-foot walk test) added more information to the baseline model (Model E), it had the lowest AUROC among Models A-D. Overall, Model A with the proposed parameters of the 6MWGST provided the most information about MS disease status among the models compared, whereas Δ6MW was no better than 6MWTD. The ROC curves are shown in Figure 2.
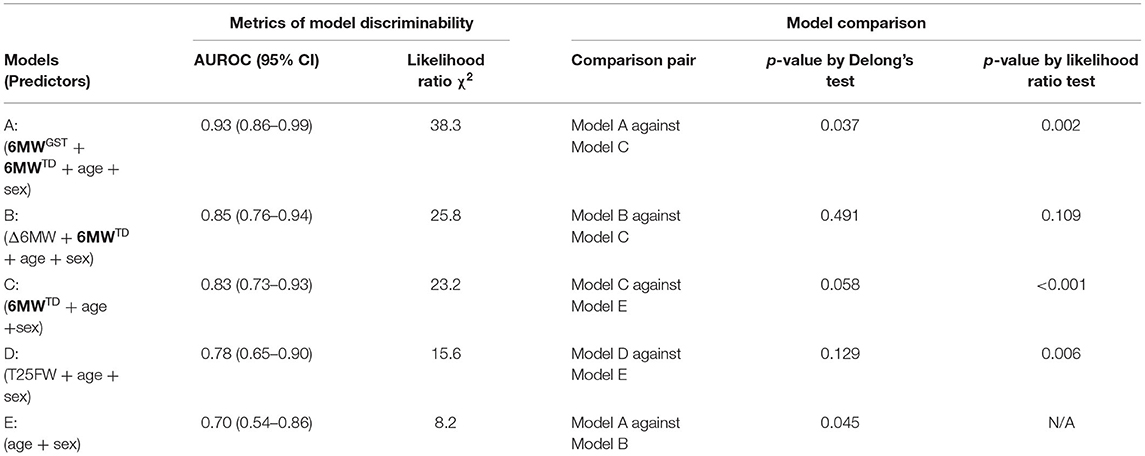
Table 3. Discriminative information comparison using logistic regression models with MS status as the outcome.
Discussion
In this study, we demonstrate consistent and significant deceleration patterns, an indicator of diminished endurance, among MS patients during repeated 6MW tests. Our finding underscores that the less-investigated aspect of the 6MW tests—the temporal change in minute-by-minute gait speed—offers a unique characterization of gait beyond 6MWTD. By testing the group differences in gait speed trajectories between MS and HC subjects, our LME model confirms a deterioration in both gait capacity and endurance among MS subjects. The LME model takes into consideration sources of variation in the gait speed outcome such as the subject-specific baseline gait speed and repeated walks, thus better elicits gait degradation due to MS-disability status. Using this model, we identified no significant change in 6MWGST over repeated 6MW tests among MS patients, indicating that a single 6MW test may be adequate to assess gait endurance for MS patients. With the MS status as a binary outcome, we also compared logistic regression models using parameters of 6MWGST estimated by an LME model against models using other conventional metrics (i.e., Δ6MW, 6MWTD, and the T25FW metric). Ultimately, our analysis showed that the subject-specific parameters of 6MWGST capture additional information about gait endurance in the MS population, beyond the gait capacity measured by total distance.
MS patients are recognized to have denuded axons due to demyelination. The consequence of this is impaired nerve conduction. Fampridine, a potassium channel blocker, has been demonstrated to improve gait speed with a presumed mechanism of action of sustained conduction across demyelinated axons secondary to increased potassium availability (16). We posit that the differences in the subject-specific temporal variation in gait speed may be an indicator of this recognized conduction failure in MS individuals. Specifically, a deceleration pattern in the 6MWGST may be due to conduction failure among those MS patients with denuded axons. Were this to be the case, 6MWGST could serve as a potential biomarker when screening subjects for future remyelination trials, enrolling only decelerators as a recruitment enrichment strategy. The underlying pathophysiology driving 6MW deceleration in MS warrants further investigation which is not explored in this manuscript.
Although other studies found a strong correlation between gait speeds measured in 6MW and 2MW tests, the latter can only capture gait capacity (17, 18), and are unable to assess gait endurance. Similarly, the 500-meter walk of the EDSS, and the T25FW test provide only a single endpoint for gait capacity evaluation, omitting the rich within-subject temporal patterns during walking. Given that the time needed to complete the 6MW (i.e., six minutes) is not substantially greater than the time needed for the 500-meter walk of the EDSS, and that the 6MW test can provide critical information about endurance and gait capacity at the same time, the 6MW test could be integrated into the EDSS as a substitute for the 500-meter walk.
One limitation of this work is the recruitment of patients' spouses as HC subjects. As MS is three times more prevalent in females (19), our control subjects tended to be male. Although we did not find any gender or height effect on the outcome, a potential gender confounding effect may exist in our data (e.g., females tend to walk slower than males). It is worth noting that while this confounding factor may impact 6MWTD, by focusing on the within-subject pattern, our proposed 6MWGST is robust to height or baseline gait speed differences. Also, although our sample size is sufficient to carry out the LME modeling, it is too small for developing diagnostic prediction models that could validate 6MWGST metrics. Lastly, we cannot track whether these 6MWGST metrics worsen longitudinally as these data were collected on a single day. Additional studies with larger sample sizes will be required to further characterize the longitudinal changes in 6MWGST among MS patients.
In conclusion, 6MWGST is a promising measure for assessing impaired gait function that merits further investigation. Our results demonstrate that the 6MWGST quantified by LME models is more informative than other gait outcome measures. Further studies will be necessary to confirm and expand our understanding of the potential underlying pathobiological relationship between the deceleration slope and associated measures of axonal integrity and myelination.
Data Availability Statement
The original contributions presented in the study are included in the article/supplementary material, further inquiries can be directed to the corresponding author.
Ethics Statement
The studies involving human participants were reviewed and approved by Cleveland Clinic Foundation IRB Committee. The patients/participants provided their written informed consent to participate in this study.
Author Contributions
MG: data acquisition. SC and MG: study concept, analysis, and design. YS: analysis and results interpretation. All authors drafting the manuscript and figures.
Funding
This work was supported by the National Institutes of Health, National Institute of Neurological Disorders and Stroke (K23NS062898) and the ziMS Foundation. This work was partially supported by NIH UL1TR002649.
Conflict of Interest
The authors declare that the research was conducted in the absence of any commercial or financial relationships that could be construed as a potential conflict of interest.
Publisher's Note
All claims expressed in this article are solely those of the authors and do not necessarily represent those of their affiliated organizations, or those of the publisher, the editors and the reviewers. Any product that may be evaluated in this article, or claim that may be made by its manufacturer, is not guaranteed or endorsed by the publisher.
References
1. Goldman MD, Marrie RA, Cohen JA. Evaluation of the six-minute walk in multiple sclerosis subjects and healthy controls. Mult Scler. (2008) 14:383–90. doi: 10.1177/1352458507082607
2. Burschka JM, Keune PM, Menge U, Hofstadt-van Oy U, Oschmann P, Hoos O. An exploration of impaired walking dynamics and fatigue in Multiple Sclerosis. BMC Neurol. (2012) 12:161. doi: 10.1186/1471-2377-12-161
3. Leone C, Severijns D, Dolezalova V, Baert I, Dalgas U, Romberg A, et al. Prevalence of walking-related motor fatigue in persons with multiple sclerosis: decline in walking distance induced by the 6-minute walk test. Neurorehabil Neural Repair. (2016) 30:373–83. doi: 10.1177/1545968315597070
4. Motl RW, Dlugonski D, Suh Y, Weikert M, Agiovlasitis S, Fernhall B, et al. Multiple sclerosis walking scale-12 and oxygen cost of walking. Gait Posture. (2010) 31:506–10. doi: 10.1016/j.gaitpost.2010.02.011
5. Kieseier BC, Pozzilli C. Assessing walking disability in multiple sclerosis. Mult Scler. (2012) 18:914–24. doi: 10.1177/1352458512444498
6. Gijbels D, Alders G, Van Hoof E, Charlier C, Roelants M, Broekmans T, et al. Predicting habitual walking performance in multiple sclerosis: relevance of capacity and self-report measures. Mult Scler. (2010) 16:618–26. doi: 10.1177/1352458510361357
7. Motl RW, Suh Y, Balantrapu S, Sandroff BM, Sosnoff JJ, Pula J, et al. Evidence for the different physiological significance of the 6- and 2-minute walk tests in multiple sclerosis. BMC Neurol. (2012) 12:6. doi: 10.1186/1471-2377-12-6
8. Van Geel F, Veldkamp R, Severijns D, Dalgas U, Feys P. Day-to-day reliability, agreement and discriminative validity of measuring walking-related performance fatigability in persons with multiple sclerosis. Mult Scler. (2020) 26:1785–9. doi: 10.1177/1352458519872465
9. Ramari C, Moraes A, Tauil C, von Glehn F, Motly R, de David A. Knee flexor strength and balance control impairment may explain declines during prolonged walking in women with mild multiple sclerosis. Multiple Sclerosis Related Disord. (2018) 20:181–5. doi: 10.1016/j.msard.2018.01.024
10. Shema-Shiratzky S, Gazit E, Sun R, Regev K, Karni A, Sosnoff J, et al. Deterioration of specific aspects of gait during the instrumented 6-min walk test among people with multiple sclerosis. J Neurol. (2019) 266:3022–30. doi: 10.1007/s00415-019-09500-z
11. Polman CH, Reingold SC, Banwell B, Clanet M, Cohen JA, Filippi M, et al. Diagnostic criteria for multiple sclerosis: 2010 revisions to the McDonald criteria. Ann Neurol. (2011) 69:292–302. doi: 10.1002/ana.22366
12. Kurtzke JF. Rating neurologic impairment in multiple sclerosis: an expanded disability status scale (EDSS). Neurology. (1983) 33:1444–52. doi: 10.1212/WNL.33.11.1444
13. Rudick R, Antel J, Confavreux C, Cutter G, Ellison G, Fischer J, et al. Recommendations from the national multiple sclerosis society clinical outcomes assessment task force. Ann Neurol. (1997) 42:379–82. doi: 10.1002/ana.410420318
14. Proessl F, Ketelhut NB, Rudroff T. No association of leg strength asymmetry with walking ability, fatigability, and fatigue in multiple sclerosis. Int J Rehabil Res. (2018) 41:267–9. doi: 10.1097/MRR.0000000000000278
15. Chen S, Kang L, Lu Y, Wang N, Lu Y, Lo B, et al. Discriminative information added by wearable sensors for early screening-a case study on diabetic peripheral neuropathy. In: 2019 IEEE 16th International Conference on Wearable and Implantable Body Sensor Networks (BSN). IEEE (2019). p. 1–4.
16. Lecat M, Decavel P, Magnin E, Lucas B, Gremeaux V, Sagawa Y. Multiple sclerosis and clinical gait analysis before and after fampridine: a systematic review. Eur Neurol. (2017) 78:272–86. doi: 10.1159/000480729
17. Gijbels D, Eijnde BO, Feys P. Comparison of the 2- and 6-minute walk test in multiple sclerosis. Mult Scler. (2011) 17:1269–72. doi: 10.1177/1352458511408475
18. Gijbels D, Dalgas U, Romberg A, de Groot V, Bethoux F, Vaney C, et al. Which walking capacity tests to use in multiple sclerosis? A multicentre study providing the basis for a core set. Mult Scler. (2012) 18:364–71. doi: 10.1177/1352458511420598
Keywords: six-minute walk test, multiple sclerosis, gait speed trajectory, walking endurance, linear mixed-effects model
Citation: Chen S, Sierra S, Shin Y and Goldman MD (2021) Gait Speed Trajectory During the Six-Minute Walk Test in Multiple Sclerosis: A Measure of Walking Endurance. Front. Neurol. 12:698599. doi: 10.3389/fneur.2021.698599
Received: 21 April 2021; Accepted: 07 June 2021;
Published: 26 July 2021.
Edited by:
Brian M. Sandroff, Kessler Foundation, United StatesReviewed by:
Cintia Ramari Ferreira, University of Hasselt, BelgiumAlexander Tallner, University of Erlangen Nuremberg, Germany
Copyright © 2021 Chen, Sierra, Shin and Goldman. This is an open-access article distributed under the terms of the Creative Commons Attribution License (CC BY). The use, distribution or reproduction in other forums is permitted, provided the original author(s) and the copyright owner(s) are credited and that the original publication in this journal is cited, in accordance with accepted academic practice. No use, distribution or reproduction is permitted which does not comply with these terms.
*Correspondence: Myla D. Goldman, bXlsYS5nb2xkbWFuQHZjdWhlYWx0aC5vcmc=
 Shanshan Chen
 Salvador Sierra3
 Myla D. Goldman