- 1Department of Anesthesiology, Xuanwu Hospital, Capital Medical University, Beijing, China
- 2Department of Anesthesiology, Affiliated Hospital of Inner Mongolia Medical University, Hohhot, China
- 3Department of Anesthesiology, Sanbo Brain Hospital, Capital Medical University, Beijing, China
Background: The oscillations and interactions between different brain areas during recovery of consciousness (ROC) from anesthesia in humans are poorly understood. Reliable stereoelectroencephalography (SEEG) signatures for transitions between unconsciousness and consciousness under anesthesia have not yet been fully identified.
Objective: This study was designed to observe the change of electrophysiological activity during ROC and construct a ROC network based on SEEG data to describe the network property of cortical and deep areas during ROC from propofol-induced anesthetic epileptic patients.
Methods: We analyzed SEEG data recorded from sixteen right-handed epileptic patients during ROC from propofol anesthesia from March 1, 2019, to December 31, 2019. Power spectrum density (PSD), correlation, and coherence were used to describe different brain areas' electrophysiological activity. The clustering coefficient, characteristic path length, modularity, network efficiency, degrees, and betweenness centrality were used to describe the network changes during ROC from propofol anesthesia. Statistical analysis was performed using MATLAB 2016b. The power spectral data from different contacts were analyzed using a one-way analysis of variance (ANOVA) test with Tukey's post-hoc correction. One sample t-test was used for the analysis of network property. Kolmogorov-Smirnov test was used to judge data distribution. Non-normal distribution was analyzed using the signed rank-sum test.
Result: From the data of these 16 patients, 10 cortical, and 22 deep positions were observed. In this network, we observed that bilateral occipital areas are essential parts that have strong links with many regions. The recovery process is different in the bilateral cerebral cortex. Stage B (propofol 3.0-2.5 μg/ml) and E (propofol 1.5 μg/ml-ROC) play important roles during ROC exhibiting significant changes. The clustering coefficient gradually decreases with the recovery from anesthesia, and the changes mainly come from the cortical region. The characteristic path length and network efficiency do not change significantly during the recovery from anesthesia, and the changes of network modularity and clustering coefficient are similar. Deep areas tend to form functional modules. The left occipital lobe, the left temporal lobe, bilateral amygdala are essential nodes in the network. Some specific cortical regions (i.e., left angular gyrus, right angular gyrus, right temporal lobe, left temporal lobe, and right angular gyrus) and deep regions (i.e., right amygdala, left cingulate gyrus, right insular lobe, right amygdala) have more significant constraints on other regions.
Conclusion: We verified that the bilateral cortex's recovery process is the opposite, which is not found in the deep regions. Significant PSD changes were observed in many areas at the beginning of stop infusion and near recovery. Our study found that during the ROC process, the modularity and clustering coefficient of the deep area network is significantly improved. However, the changes of the bilateral cerebral cortex were different. Power spectrum analysis shows that low-frequency EEG in anesthesia recovery accounts for a large proportion. The changes of the bilateral brain in the process of anesthesia recovery are different. The clustering coefficient gradually decreased with the recovery from anesthesia, and the changes mainly came from the cortical region. The characteristic path length and network efficiency do not change significantly during the recovery from anesthesia, and the changes of network modularity and clustering coefficient were similar. During ROC, the left occipital lobe, the left temporal lobe, bilateral amygdala were essential nodes in the network. The findings of the current study suggest SEEG as an effective tool for providing direct evidence of the anesthesia recovery mechanism.
Introduction
Transitions between conscious and unconscious states are essential aspects of clinical anesthesiology. The study of state transitions during loss and recovery of consciousness (ROC) has always been the focus of anesthesia research. The human brain is a complex organ, and many of its functions are still unknown. State transition in anesthesia also involves many brain regions with unpredictable changes. Therefore, it is difficult to study the underlying mechanisms accurately. However, it is essential to understand the links and dynamic interactions among different brain parts during anesthesia (1).
Network science is a relatively new academic field that can enhance scientific understanding of the interfaces between neuroscience and anesthesiology. It can also contribute to new approaches for predicting and controlling neurologic function in the perioperative period (2).
Many studies have tried to explore the mechanism of anesthesia from the science of network point of view. Some of the critical conclusions from these studies indicate that general anesthesia can disrupt higher-order information processing, with relatively preserved primary sensory networks and information processing (3). It has also been reported that effective and functional connectivity is inhibited from the frontal to parietal regions during general anesthesia (4, 5). In addition, general anesthesia tends to selectively inhibit long-latency evoked potentials and preserve short-latency evoked responses (6). Moreover, spatiotemporal complexity is decreased (7) and the repertoire of connectivity configurations is constrained during general anesthesia (8). The network experiments in anesthesia research involve many species such as mice, rats, rabbits, monkeys, and humans (9–11). Diverse anesthetics, including propofol, isoflurane, sevoflurane, midazolam, ketamine, and halothane, have been used to study anesthesia's network science (12–14). These studies may reflect the reduced capacity of information integration in terms of reducing both differentiated information and overall network integration, which is proposed to result in unconsciousness.
It is evident from the above studies that a network can be constructed by an array of clinical data such as functional magnetic resonance imaging (fMRI), electroencephalography (EEG), and electrocorticography (ECoG). However, few studies have used stereoelectroencephalogram (SEEG) to construct this network in humans to investigate the mechanism of anesthesia. With SEEG, it is feasible to detect cortical and subcortical electrophysiological activities simultaneously (11) and can also be used to detect drug-resistant epilepsy (15). As the electrodes need to be implanted under general anesthesia (16), anesthesiologists can obtain necessary SEEG data to observe the brain's changes after surgery. This surgery provides an excellent opportunity to explore the effect of various anesthetic agents.
Network science is a helpful tool and a necessary theoretical framework and method to uncover common principles of changes of consciousness induced by anesthetics. The majority of research studies to date have been conducted on the loss of consciousness. However, in this study, we aimed to observe the change of electrophysiological activity employing power spectrum density (PSD), correlation, and coherence of different frequency bands during ROC. Additionally, we constructed ROC's network based on SEEG data to describe the network property of cortical and deep areas.
Methods
Basic Information and Participants
This study was approved by the Ethics committee of Sanbo Brain Hospital, Capital Medical University, Beijing, China, with approval number: SBNK-YJYS-2019-009-01. The study was also registered in the Chinese Clinical Trial Registry (registration number: ChiCTR2000029067). All participants provided their written informed consent and consent to publish the individual and identifiable patient details before enrolling in this study. All experiments in this study were conducted following good clinical practices and the tenets of the Helsinki Declaration.
We collect data from 16 patients undergoing intracranial monitoring for surgical treatment of epilepsy at Sanbo Brain Hospital from March 1, 2019, to December 31, 2019. The inclusion of patients was made based on (i) patients who presented with intractable epilepsy and who required SEEG electrode implantation; (ii) age between 18 and 40 years (both male and female patients were included); (iii) ASA classification of grade I or II, without severe systemic diseases of the heart, lung, liver, or kidney; (iv) Patients with clear and conscious minds with ordinary intelligence and willing to provide consent for participation.
The exclusion criteria were set as: (i) Patients with a history of receiving anesthesia within 6 months; (ii) pregnant or breastfeeding patients; (iii) Patients who participated in other clinical trials in the last 4 weeks; (iv) Patients who used long-term sleeping pills and analgesics or alcoholic patients; (vi) Patients with extreme anxiety and/or panic attacks and having difficulty communicating.
Data Recording and Preprocessing
Four electrodes were used for one patients' data collection per the implant plan. Sixty-four–channel SEEG data were recorded during the transition from unconscious states to awake states during propofol general anesthesia after all planned electrodes were implanted. The SEEG data were recorded using a video-electroencephalogram monitor. The monitoring system had a sampling rate of 1,024 Hz, and the SEEG data were prefiltered through a 0.1-Hz high-pass filter and an 80-Hz low-pass filter. The reference electrode and ground electrode were fixed uniformly (nasion point and central zero point). The ROC time point was determined by response to verbal commands (17).
Recordings were obtained in the post-anesthesia care unit room. Total intravenous anesthesia was used. Dosages of anesthetics were determined according to standard dosing requirements: remifentanil (induction: 1.5 μg/kg; maintain: 0.2 μg/min/kg); rocuronium (induction: 0.7 mg/kg; maintain: none). Propofol was administered as a target-controlled infusion (TCI) (induction: 4.5 μg/ml of plasma; maintain: 3.5 μg/ml of plasma) based on the pharmacokinetic model by Marsh et al. (18).
The following stages were accurately marked on SEEG data: (A) propofol 3.5–3.0 μg/ml, (B) propofol 3.0–2.5 μg/ml, (C) propofol 2.5–2.0 μg/ml, (D) propofol 2.0–1.5 μg/ml, and (E) 1.5 μg/ml-ROC. The experimental procedure is presented in Figure 1.
The SEEG data were analyzed with MATLAB (version 2016b, MathWorks Inc., USA). Large-amplitude SEEG artifacts were removed, and bad channels were rejected by visual inspection. A band-pass filter based on the EEGLAB was used to extract SEEG data from 1 to 60 Hz for calculation. The SEEG recordings were resampled to 256 Hz.
Surgical Procedure and Contact Location
Before surgery, the electrophysiologist drew the plan for implantation according to the patient's symptoms and MRI data, following which the data was input into the navigation machine. During surgery, the neurosurgeon implanted electrodes under the guidance of the navigation machine and after implantation of all electrodes, the patient underwent a CT scan. Then, imaging experts fused the CT and MRI data to verify the position of the electrodes. In this study, we chose electrode contact with the help of imaging experts.
EEG Analysis
We analyzed SEEG data for power spectrum density (PSD), correlation, and coherence. The analysis was performed with the Brainstorm toolbox (19), which is documented and freely available for download online under the GNU general public license (http://neuroimage.usc.edu/brainstorm). We considered contact position based on anatomical location. In all, 32 contacts were included.
Power Spectrum Density
Welch's method was used to evaluates the power of the SEEG signals at different frequencies. This method heavily reduces noise, whereby a smooth spectrum and less spectral leakage can be obtained (20). We split the signals in overlapping windows of a given length to calculate the fast Fourier transform (FFT) of each of these short segments and average the FFT coefficients' power for all the overlapping windows. In this study, we set the options as follows:
(i) Time window: All file;
(ii) Window length: 10 s;
(iii) Overlap ratio: 50%;
(iv) The results were grouped in the frequency bands, i.e., delta 2–4 Hz, theta 5–7 Hz, alpha 8–12 Hz, beta 15–29 Hz.
EEG Correlation and Coherence Analysis
The dependence or association among two EEG signals was assessed using the primary and classical correlation approach. This approach provides valuable information if clinicians have to deal with a few narrow-banded signals. Coherence was used to compute the relation between two signals in the frequency domain using the FFT to compute the spectral densities. The coherence of all data in this study was analyzed in different frequency bands (i.e., delta 2–4 Hz, theta 5–7 Hz, alpha 8–12 Hz, beta 15–29 Hz). Because there were many regions involved, we analyzed the results of correlation and coherence from graphs to avoid tedious calculations and to avoid redundant data. The analysis results of different stages and frequency bands were saved as images of the same size. Then, in MATLAB, the RGB graphs were converted into gray graphs (function: rgb2gray) and converted to histogram (function: imhist). We compare the results from the perspective of graphs.
Graph Theory Analysis
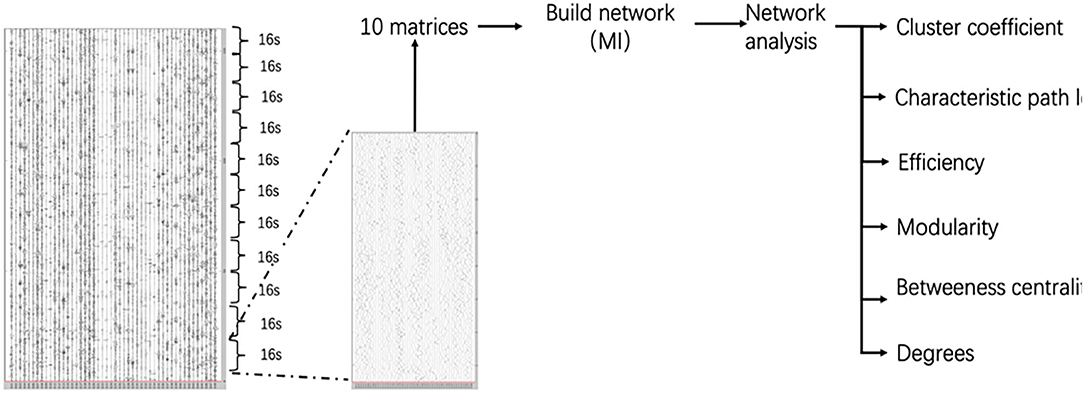
Evaluation of interconnections between all possible pairs of SEEG contacts in a particular frequency band could produce a large number of matrices of correlation data that are hard to interpret and handle statistically. To overcome these problems, a graph theory-based approach (21), was used to provide useful measures to characterize the topological properties and the functional organization of the brain network. Each node in the graph corresponded to a contact, and the mutual information between electrodes time series acted as edge weights. The relative threshold method (ranging from 0.1 to 0.5) was used and the step was 0.01. We defined the network consisting of all nodes and the corresponding edge weights were mapped from the mutual information matrix. Only undirected functional connections were considered. A 160 s period for each stage we extracted consisting of 10 series (10 × 16 s). We get 10 matrices by calculating the mutual information of 10 series. 10 matrices calculate the network of each stage. Finally, we get five networks of the successive stage. We analyzed brain regions' changes during anesthesia recovery by observing the change of network in each stage. The Graphvar toolbox (22, 23) was used to describe the network properties including Characteristic path length, Clustering coefficient, Network efficiency, Modularity, Degrees, and Betweenness centrality (Figure 2).
Statistical Analysis
Statistical analysis was performed using MATLAB 2016b. The power spectral data from different contacts were analyzed using a one-way analysis of variance (ANOVA) test with Tukey's post-hoc correction. One sample t-test was used for the analysis of network property. Kolmogorov–Smirnov test was used to judge data distribution. Non-normal distribution was analyzed using the signed rank-sum test. A p-value of <0.05 was considered statistically significant.
Results
General Information
After excluding one patient because of postoperative intracranial hemorrhage, a total of 16 right-handed patients were included in the final analysis. There were no significant differences concerning any demographic details among the patients. The order from long to short of the average time of different stages was observed as D > E > C > B > A (shown in Table 1). In total, 32 positions were observed (i.e., 10 cortical and 22 deep positions) (Supplementary Figure 1 and Table 2).
PSD of Different Regions of the Different Frequency Bands
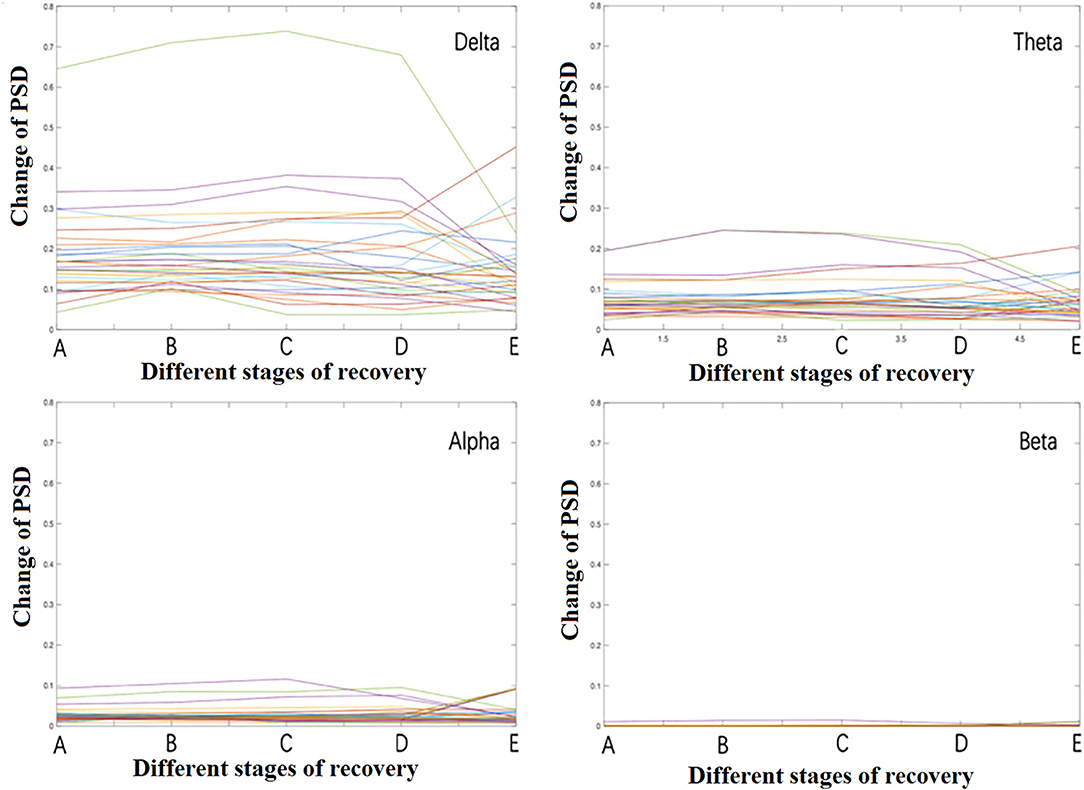
When different frequency bands were displayed separately during recovery from propofol anesthesia, it was found that the delta band's energy was the highest, followed by theta, alpha, and beta bands (Figure 3). The beta band's energy was very low, thus, the higher frequency gamma band was not analyzed and nor described. Significant changes mainly occurred in stage B and stage E. There were many contacts involved and were described all contacts in different frequency bands separately in Figure 4.
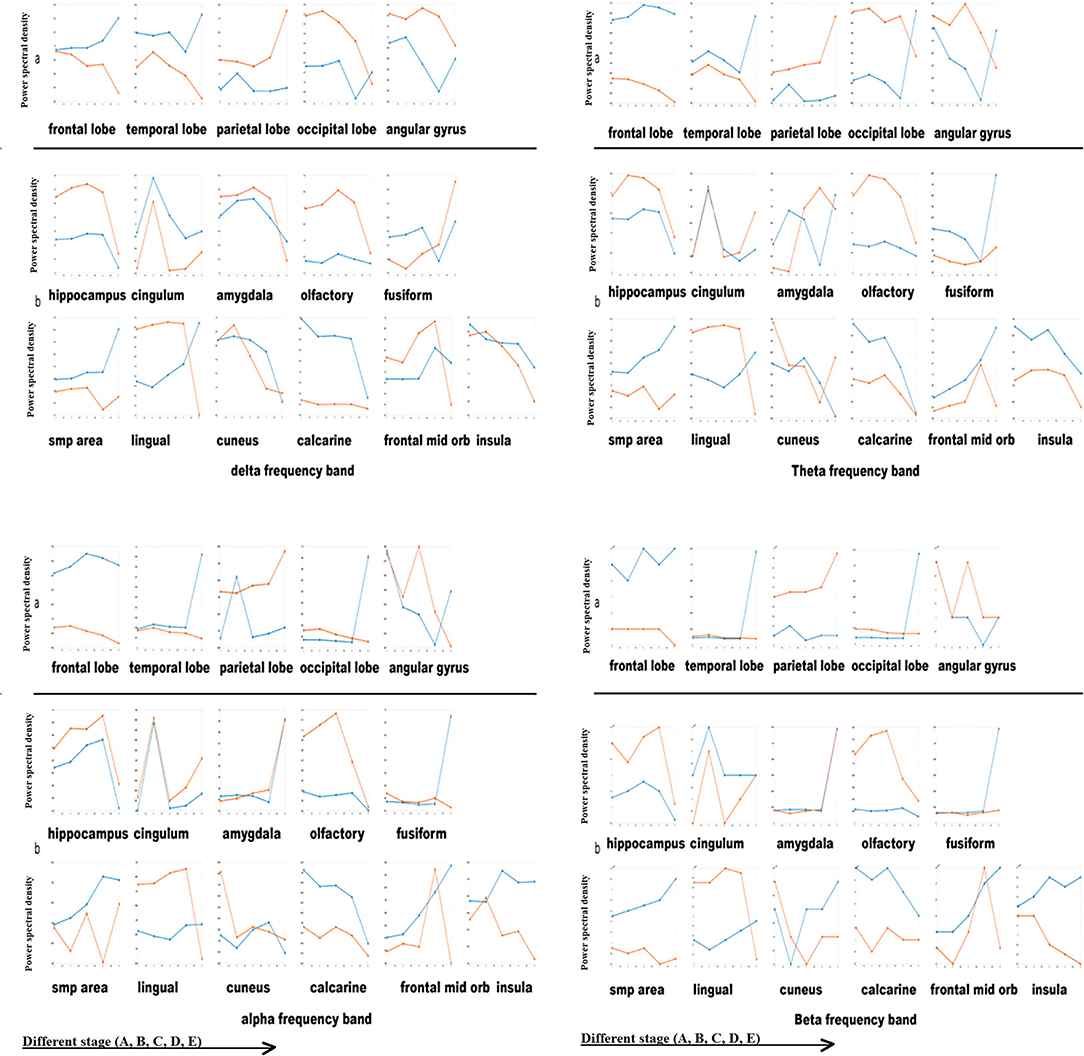
Figure 4. Power spectral density of cortical and deep areas. *Blue line: left hemisphere; red line: right hemisphere. X-axis: different stage (A, B, C, D, E); Y-axis: Power spectral density [Magnitude (signal units/sqrt(Hz))*10−4].
Delta frequency band: (a) cortical areas: The changes in bilateral cortical areas of the brain were opposite as a whole. The energy of the left frontal lobe, left temporal lobe, and left occipital lobe increased gradually while in the right frontal lobe, right temporal lobe and right occipital lobe decreased with the recovery from anesthesia. The right parietal lobe energy was increased. As the angular gyrus's anatomical position is similar to that of the occipital lobe, we found that the change in energy was similar. (b) Deep areas: Except for the tongue gyrus, both sides' change of deep brain area was consistent. The hippocampus, amygdala, olfactory cortex, cuneus, calcarine fissure, interior frontal lobe, and insular energy gradually decreased with the recovery from anesthesia. The energy in the cingulate gyrus raised in stage B, and then gradually decreased. The energy in the fusiform gyrus and SMP gradually increased.
Theta band: (a) cortical areas: bilateral frontal lobe had no apparent difference; the changes of theta band of the temporal lobe, parietal lobe, occipital lobe, angular gyrus were consistent with that of delta band. (b) Deep areas: left amygdala, left interior frontal lobe, and right cuneus energy increased significantly in stage E. Other regions' changes were consistent with that of the delta band.
Alpha band: (a) cortical areas: Compared with the low-frequency band changes (delta and theta), the changes of the alpha band in cortical areas were more significant. There was no apparent change in the frontal lobe. The left temporal lobe and left occipital lobe energy increased significantly in stage E. The left parietal lobe energy increased significantly in stage B. (b) Deep areas: The amygdala energy increased significantly in stage E. The changes in other regions were consistent with that of the delta band.
Beta band: (a) cortical areas: The difference in the beta band was also significant. There was no apparent change in the frontal lobe. The left temporal lobe and the left occipital lobe energy increased significantly in stage E. Different from the alpha band, the transient increase of the left parietal lobe energy in stage B was not significant. Deep region: the changing trend of the deep region energy was similar to the alpha and beta band.
Correlation and Coherence Analysis
Correlation
Correlation analysis was used to observe the time domain information. We discovered that the changes in correlation were not significant. In this study, on the whole, we observed that the correlation decreased in stage D and increased in stage E (p > 0.05). Because of EEG data characteristics, we observed that the changes were mainly concentrated in some fixed areas. Besides, because the correlation analysis mainly focuses on the time-domain information, it was impossible to detect frequency-domain sources.
Coherence Analysis
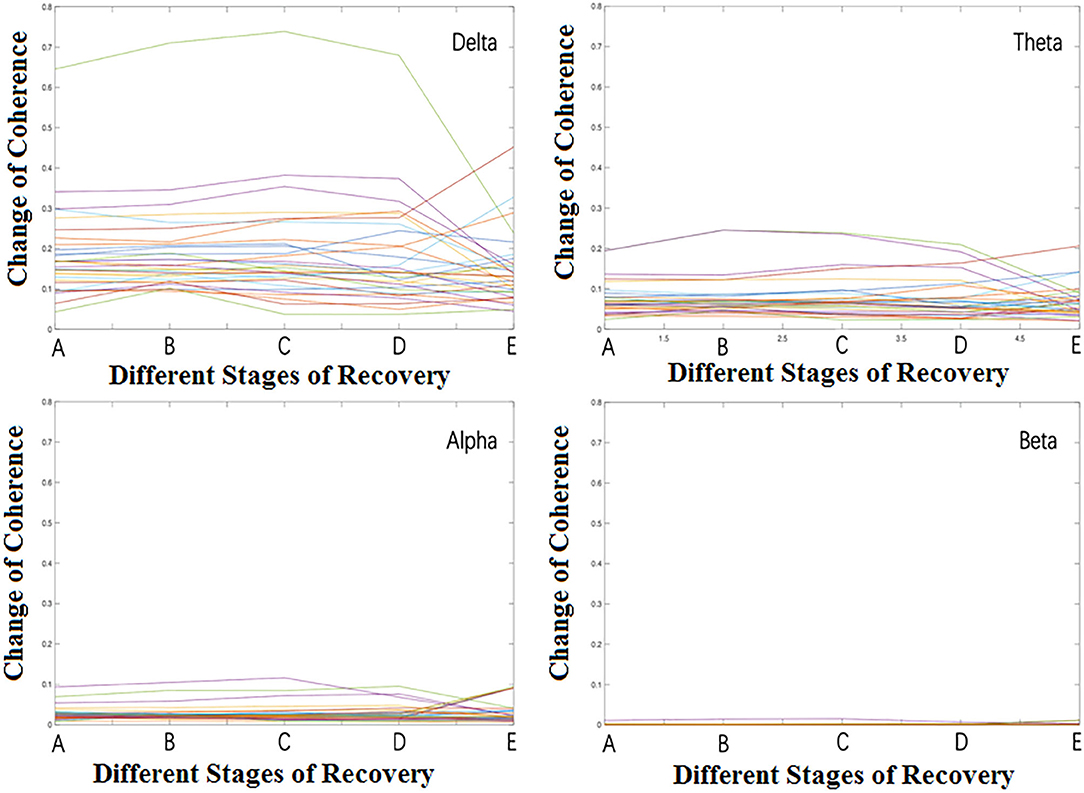
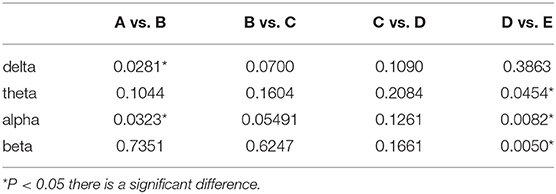
We observed the relationship among brain regions during anesthesia recovery from the frequency domain perspective by coherence analysis. The results are shown in Figure 5. In the delta band, the coherence of each region in stage B increased significantly and then decreased. In theta band, the coherence of each region in stage B increased and then decreased, but increased again in stage E; in the alpha band, the coherence of each region in stage B increased, and then decreased, but increased significantly in stage E. In the beta band, the coherence was weak in stage A, B, C, D, and increased significantly in stage E (Table 3).
Network Property
General Information
Graph theory is the most frequently used method to describe the property of a network. The selection and definition of neural network nodes mainly depend on the purpose of researchers. Usually, in research, we hope that nodes can cover as many areas as possible, that is, the whole brain (24). When the nodes cannot be covered entirely, selective nodes are taken to represent this part of the brain region ideally. When using EEG data to build a network, the electrode sites of time series are generally selected as the network nodes (25). In this study, the network was built using 32 nodes, i.e., 10 cortical points, and 22 sub-cortical points. In this network, we observed that bilateral occipital areas were essential parts that have strong links with many regions.
Cluster Coefficient, Characteristic Path Length, Efficiency, Modularity
(1) Cluster coefficient:
Our study shows that, as shown in Figure 6, the whole neural network's clustering coefficient increased in stage B, and then gradually decreased with the anesthesia recovery, which may be caused by the inconsistency of bilateral brains' recovery process. The changes of the cortical region and the whole network were consistent. However, the clustering coefficient of deep areas gradually increases with the recovery of anesthesia, which indicates that the decrease of the clustering coefficient of the whole network mainly comes from the changes in the cortical region. The nodes of the deep areas show a trend of aggregation with the anesthesia recovery.
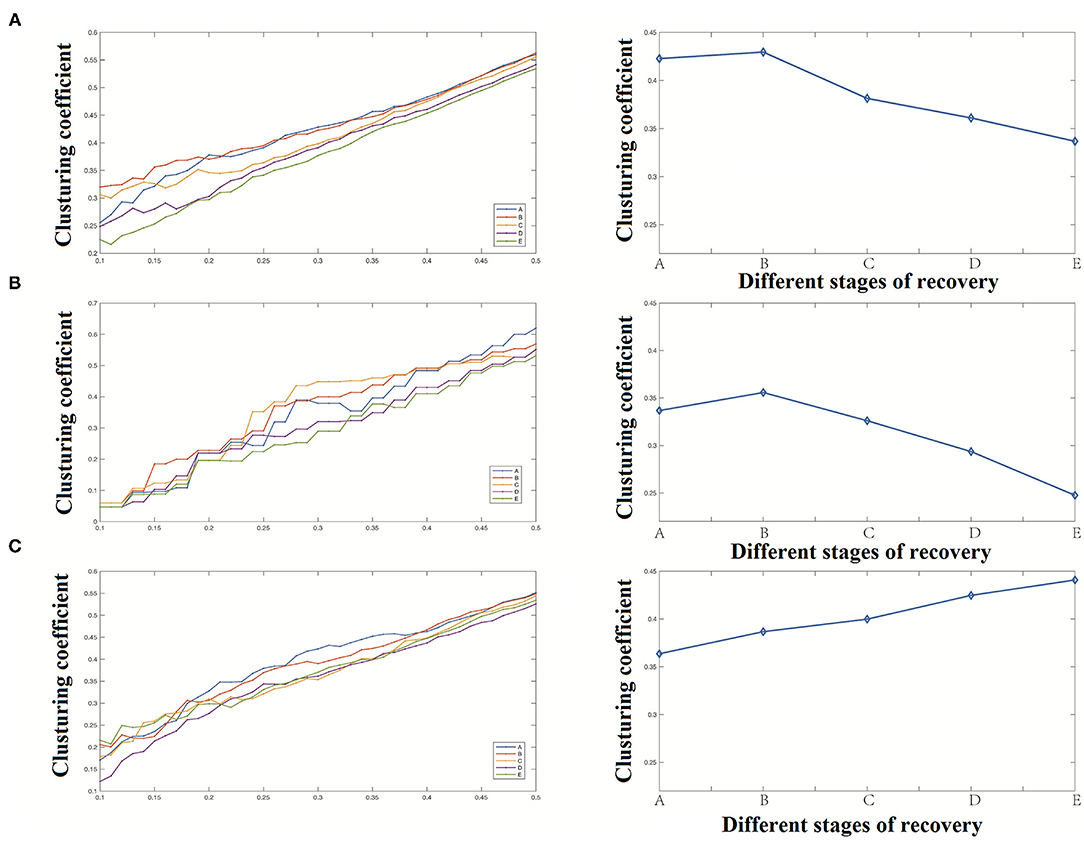
Figure 6. Clustering coefficient analysis results [(A) clustering coefficient of the whole network, (B) clustering coefficient of the cortical region, (C) clustering coefficient of the deep region].
(2) Characteristic path length
Our study shows that the network's characteristic path length raised briefly in stage B and then gradually declined as shown in Figure 7. Compared with the significant decrease of the clustering coefficient, the change of characteristic path length was not significant.
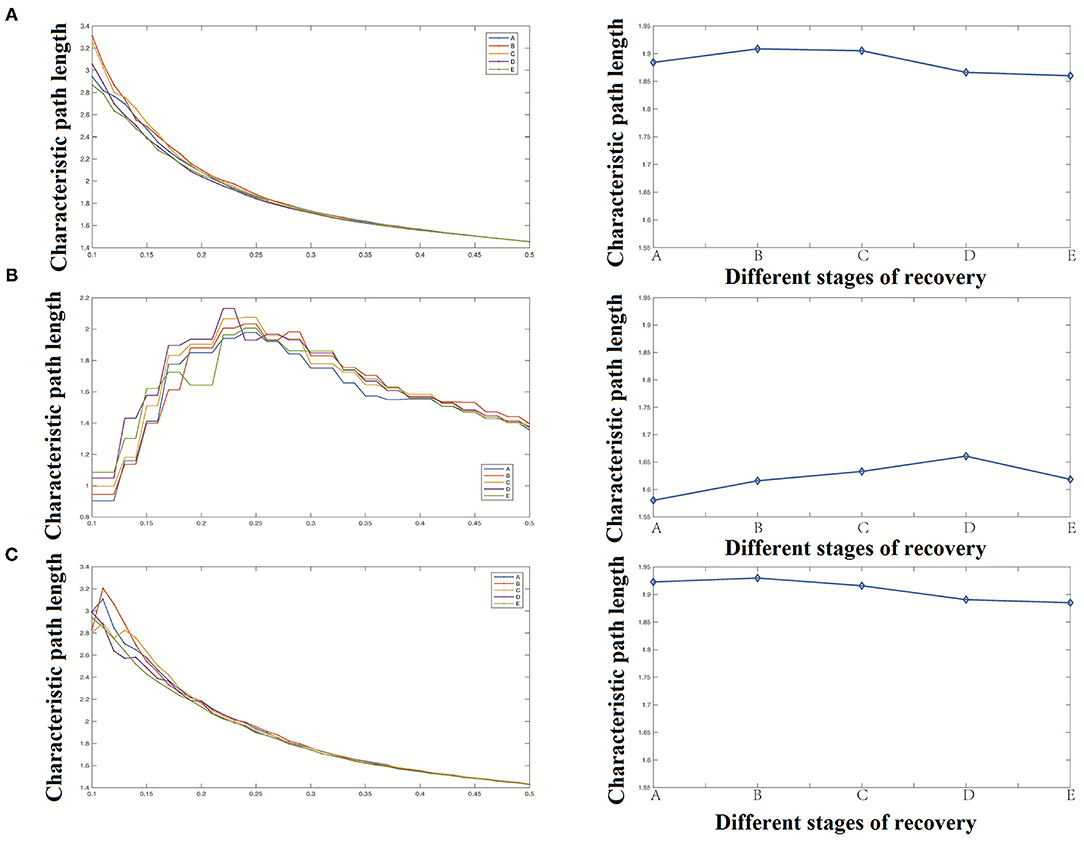
Figure 7. Characteristic path length analysis results [(A) Characteristic path length of the whole network, (B) Characteristic path length of the cortical region, (C) Characteristic path length of the deep region].
(3) Efficiency
Our study shows that the network's overall efficiency decreases briefly in stage B, then gradually increases with the recovery of anesthesia, and finally returns to the level at the time of anesthesia, as shown in Figure 8. The changes of network efficiency in cortical and deep areas were the same, and the change of network efficiency was not apparent with anesthesia recovery.
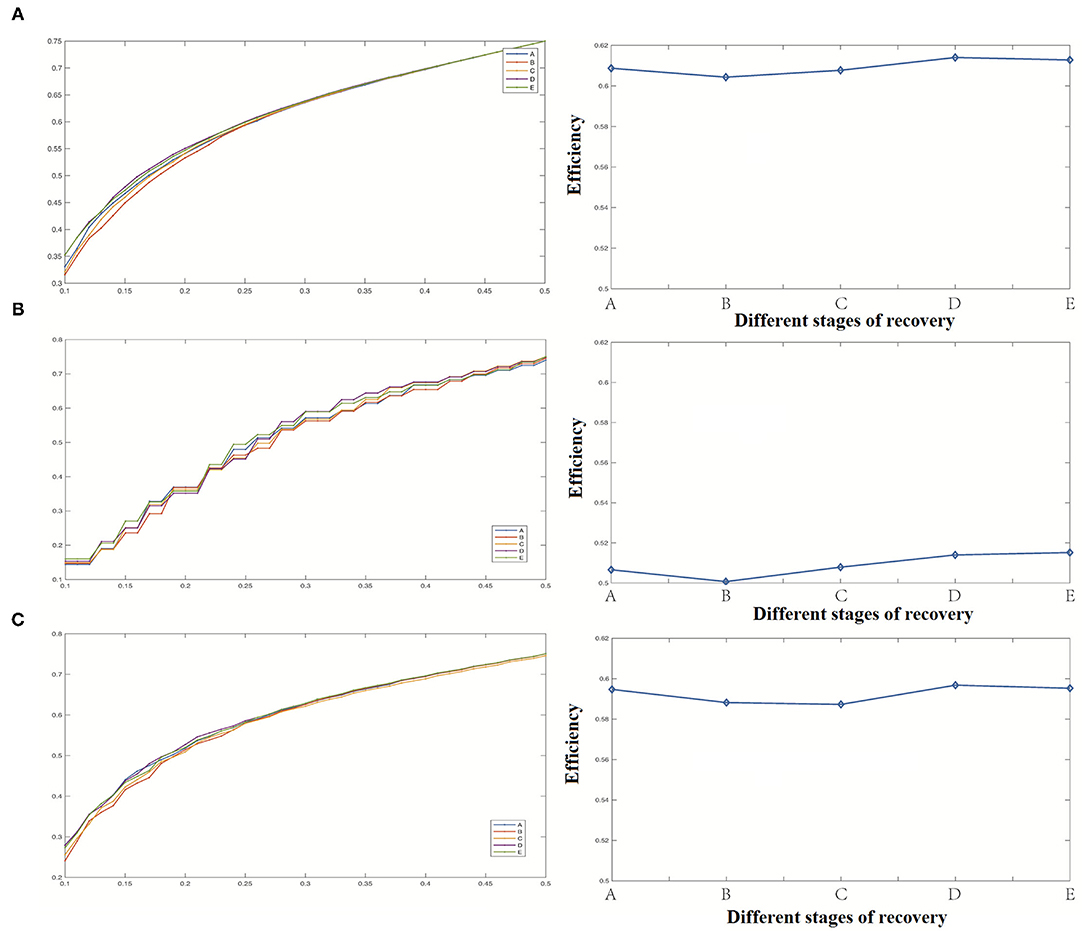
Figure 8. Efficiency analysis results [(A) Efficiency of the whole network, (B) Efficiency coefficient of the cortical region, (C) Efficiency of the deep region].
(4) Modularity
The change of modularity was similar to that of the clustering coefficient as shown in Figure 9. The whole neural network's modularity was first raised briefly and then decreased with a gradual decrease of anesthesia depth. The reason for this result was the same as for the change of clustering coefficient. Because these two indicators are used to describe the aggregation degree of nodes in the network, with the change of the whole network's aggregation degree, the possibility of forming different groups among nodes also changes. In anesthesia recovery, the network modularity of the cortical area decreased significantly, while the network modularity of the deep area increased gradually.
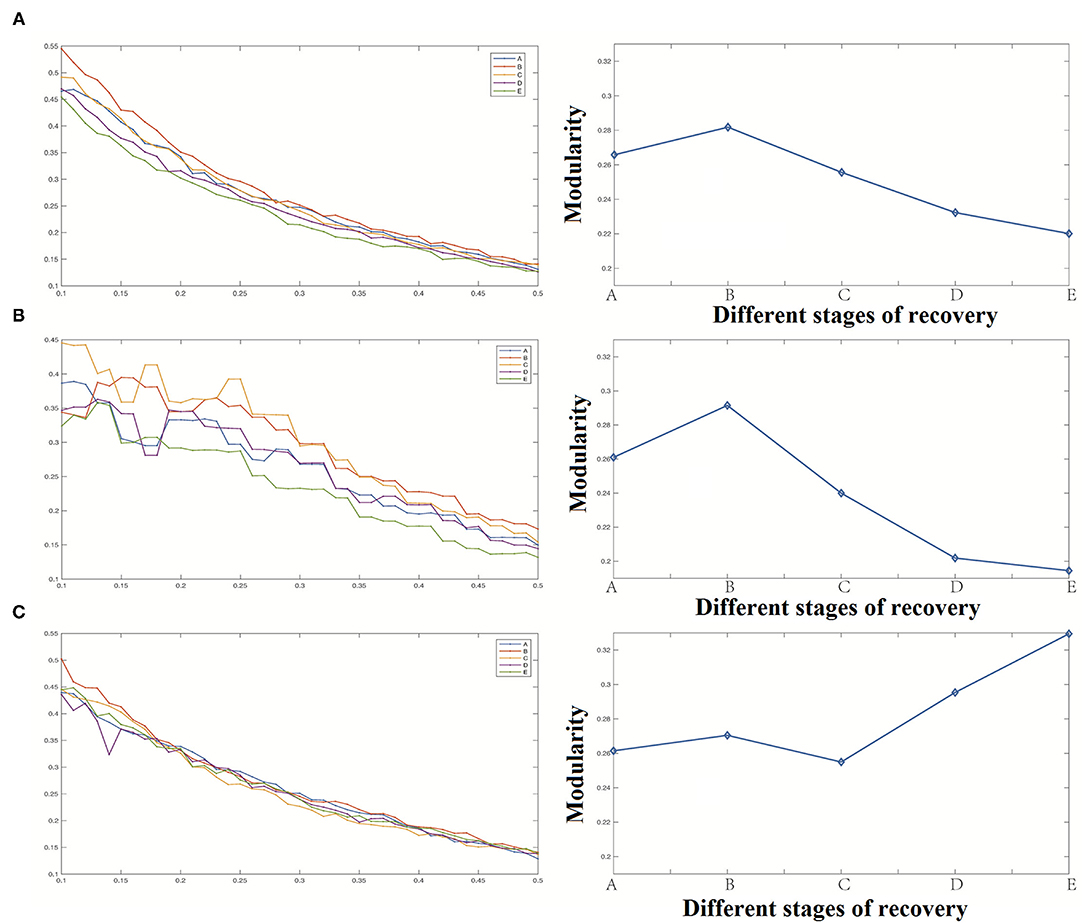
Figure 9. Modularity analysis results [(A) Modularity of the whole network, (B) Modularity of cortical region, (C) Modularity of deep region].
Betweenness Centrality and Degree
When the threshold value was high, the overall degree value of each region was relatively high as shown in Figure 10B. On the other hand, overall, the changing trend of degree value and the difference between each period was not apparent as shown in Figure 10A. We divided all the data into cortical and deep areas and arranged them on average to observe the importance of nodes in anesthesia recovery. When the threshold value was low, each region's overall betweenness was relatively high as shown in Figure 11B. Overall, the changing trend of betweenness and the difference between each period was more apparent than the degree as shown in Figure 11A. We still divided all data into cortical and deep areas and arranged them on average to observe the more restrictive node's effect during anesthesia recovery.
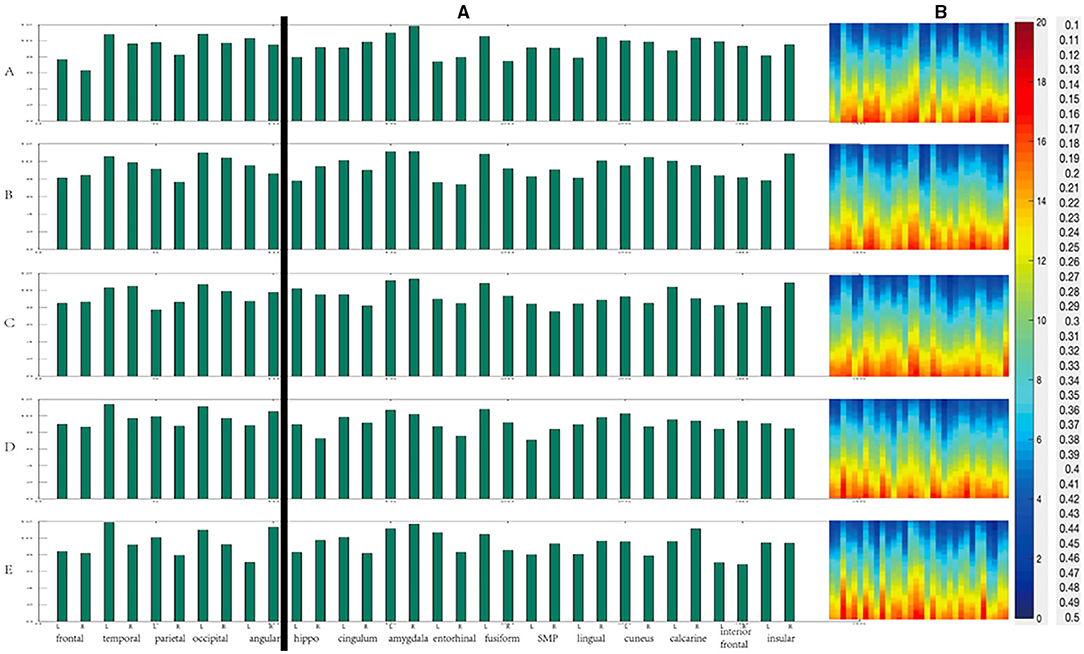
Figure 10. The change of degree during anesthesia recovery [(A) the histogram of average degree values of each region; (B) The degree values of different thresholds].
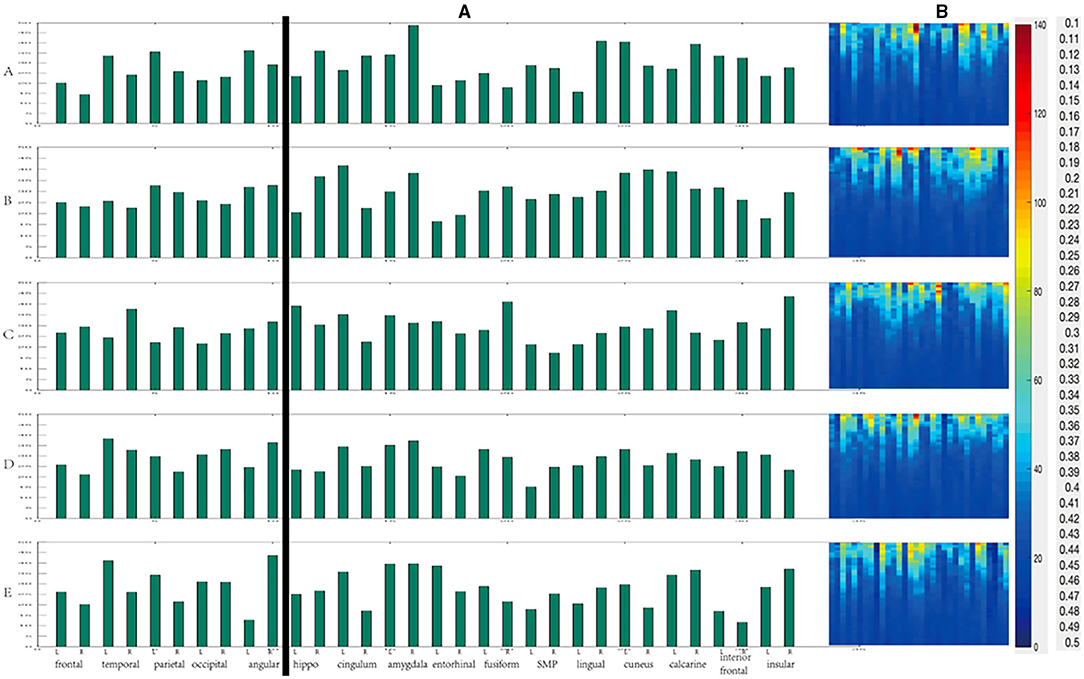
Figure 11. The change of Betweenness centrality during anesthesia recovery [(A) the histogram of average Betweenness centrality of each region; (B) The Betweenness centrality of different thresholds].
According to the above results, in the cortical area from anesthesia to recovery, the node with the highest degree value was the occipital lobe (A, B, C), and then gradually transferred to the left temporal lobe (D, E) as shown in Figure 12A. In the deep areas, the node with the highest degree value was the bilateral amygdala (A, B, C); in the D period close to recovery, the left fusiform gyrus was the highest, and then gradually recovered and returned to the bilateral amygdala (E). In the cortical areas, the nodes with the highest betweenness centrality were the left angular gyrus (A), the right angular gyrus (B), the right temporal lobe (C), the left temporal lobe (D), and the right angular gyrus (E) as shown in Figure 12B. In the deep areas, the nodes with the highest intermediate centrality were the right amygdala (A), the left cingulate gyrus (B), Right insular lobe (C), right amygdala (D), right amygdala (E).
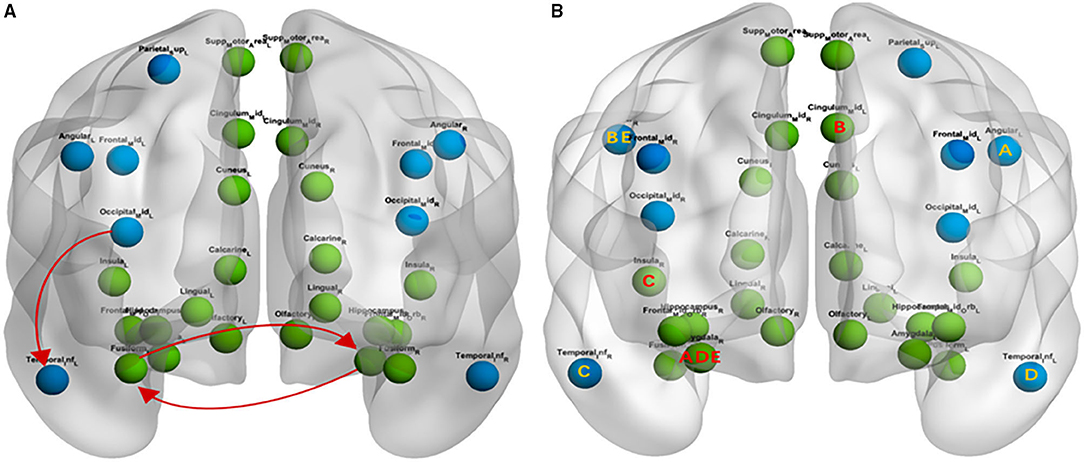
Figure 12. The Change of Degree and Betweenness centrality during anesthesia recovery [blue represent the cortical area, green represent deep area; (A) Degree; (B) Betweenness centrality].
Discussion
Most previous studies have focused on the relation of EEG spectrum progression to loss of responsiveness during induction of anesthesia (26–28). In this research, SEEG was used to collect the data of epileptic patients. The changes of various brain regions during the natural process of propofol anesthesia recovery and the overall variation of the relationship between them were observed. Simultaneously, the network was constructed by SEEG data, and the brain network was analyzed by the graph theory method. We verified that the bilateral cortex's recovery process is the opposite, which is not found in the deep regions. Previous studies on anesthesia research have speculated that the frontal and parietal lobes are the critical areas associated with anesthesia anesthetic induction (29). Our study showed that the occipital lobe plays an essential role in ROC from anesthesia, which further indicates that the induction of and ROC from anesthesia may be associated with different brain regions. However, it remains to be studied whether the results will be different with different anesthetic drugs.
Some studies have shown that brain recovery from general anesthesia is not random but ordered. A study about local field potential data in rats found that when the anesthetic isoflurane is discontinued, brain activities recover through an ordered series of state transitions (30). Some transition paths were found to be more probable than other paths. One study observed two distinct emergence patterns after general anesthesia. One pattern showed progressive spectral changes in the electroencephalogram before the response, whereas the other showed no explicit change of spectral properties before an abrupt return of responsiveness (31). A recent study was conducted on recording the electrophysiological activity of the amygdala and other cortical areas from anesthesia to the recovery of consciousness was in propofol-anesthetized five epileptic patients using stereo-EEG (SEEG). They observed that when propofol concentration decreased, PSD in the delta band of the amygdala decreased significantly. When it was close to awakening, the correlation between the amygdala and ipsilateral temporal lobe significantly decreased followed by a considerable increase when awake (11). In the study of Gugino et al., they found decreased posterior alpha and increased frontal/central beta power in the light sedation phase in healthy adult volunteers anesthetized with propofol or sevoflurane (32). When the sedation progressed to deep, the frontal power predominance increased with greater involvement of alpha and, to a lesser extent, delta and theta power. As the consciousness was lost, delta and theta power increased further in anterior regions and also spread to posterior regions. These changes reversed with a return to consciousness (32). A similar study also classified the emergence patterns of 100 surgical patients as progressive (~70% of the cohort) or abrupt (~30% of the cohort) based on the power spectra of σ (0.5–4 Hz) and α/spindle (8–14 Hz) of the frontal electroencephalogram. The emergence patterns can be qualitatively described as “progressive and earlier state transition” and “abrupt but delayed state transition” (33). Another study applied a graph-theoretic network analysis that classified emergence patterns as progressive and abrupt, with accompanying network features (34). For example, anesthetics such as ketamine induce various subjective experiences even though connected consciousness appears lost during ketamine anesthesia, as evidenced by loss of responsiveness (35). We also observed significant PSD changes in many areas at the beginning of stop infusion and near recovery.
A system, such as a brain network, can generate information capable of being used in many differentiated states. A system is said to be highly integrated if it cannot be reduced to independent parts. Any system that possesses both of these properties is deemed to be conscious (36). Integrated information theory predicts that, during sleep and anesthesia, possible brain states' repertoire is diminished (reduced information), and cortical communication is impaired (reduced integration). The combined loss of information and integration in the brain may result in unconsciousness (37). In a study, EEGs from 32 normal subjects were recorded and functional networks of three different sizes were extracted and concluded that the estimates of network metrics significantly differ depending on the network size (38). Our study found that during the ROC process, the modularity and clustering coefficient of the deep area network is significantly improved. However, the changes of the bilateral cerebral cortex were different. The SEEG used in this study, in essence, is also an EEG signal, so we selected a specific electrode contact in the target area as the node of the network.
In this study, we build a network from EEG data of multiple patients, which is a new attempt, so when we define the edge, we try the above methods, compare the results, and finally choose mutual information. This method can highlight the characteristics of the network, and it is also a comprehensive algorithm. Another critical part of network research is the choice of threshold (39). At present, there is no unified conclusion on the choice of threshold, which is also a topic worthy of study. The standard methods to define threshold include relative threshold, absolute threshold, consistent threshold, and continuous threshold. In the study of McColgan et al., they compared the above threshold strategies' effects by using a cohort of patients with chorea Huntington and a healthy control group. Their study pointed out that the impact of various thresholds on the network degree value was not significant. Besides, in terms of the correlation of clinical studies, the study pointed out that the threshold range of relative threshold and consistency threshold was relatively stable (40). There are some differences between continuous thresholds. The absolute threshold is very unstable, and the results are highly variable (41). Zhang et al. found that the relative threshold method may be one of the most widely used threshold methods, which is either performed on a predefined threshold level or a series of thresholds (42). To sum up, the relative threshold results are reliable in clinical research, and it is also the most commonly used one. Therefore, in our study, we also used the relative threshold method to describe each stage's network properties, ranging from 0.1 to 0.5, with a step size of 0.01.
Graph theory analysis indicators are mainly used to describe the changes of network properties in a state change. Specific observations are determined by researchers which include characteristic path length, global efficiency, clustering coefficient, modularity, degree, and betweenness centrality. The higher betweenness centrality of a point indicates that many or even all of the shortest paths between other points must pass through it (43). If this point disappears, the communication between other points will become difficult or even disconnected. Therefore, betweenness centrality and degree are similar, which are essential indicators of nodes. In this study, when the threshold value is low, each region's overall betweenness is relatively high. Overall, the changing trend of betweenness and the difference between each period is more apparent than the degree.
Some pure mathematical algorithms are complicated for clinical researchers to understand. In this study, we chose the toolbox (Graphvar) to analyze the network's graph property. Using a toolbox is easier for clinical researchers than using other traditional methods, and it enables us to focus on experimental-related content rather than complex mathematical calculations. Another critical frontier of network science is network dynamics, leading to a greater understanding of state transitions due to diverse anesthetic perturbations. Network-based theories and analyses of big data in neuroscience might also enable greater predictive power in the clinical realm. For example, it is conceivable that LOC, ROC, and specific altered cognitive functions could be predicted based on structural or functional network architectures and their dynamic response to anesthetic or sedative interventions. Such a framework could create new opportunities for clinical anesthesiologists to perturb consciousness and cognition or manipulate state transitions. In the future, we will try to observe the differences among different anesthetics and compare left and right-handed patients. Moreover, the electrophysiological activity of the brain is closely related to that of the perioperative neurocognitive disorders (PND). We also intend to explore the fundamental mechanism through animal experiments.
Conclusion
Electrophysiological activity of the cortical and some deep brain areas from anesthesia to the recovery of consciousness was investigated in propofol-anesthetized 16 epileptic patients using stereo-EEG (SEEG). We observed significant PSD changes in many areas at the beginning of stop infusion and near recovery. Our study found that during the ROC process, the modularity and clustering coefficient of the deep area network is significantly improved. However, the changes of the bilateral cerebral cortex were different. Power spectrum analysis shows that low-frequency EEG in anesthesia recovery accounts for a large proportion. The changes of the bilateral brain in the process of anesthesia recovery are different. Except for the frontal lobe, the left and right sides of the cortex showed an opposite trend with the decrease of anesthesia. The left and right sides of the deepest areas showed the same trend with the decrease of anesthesia. Significant increases and decreases are mainly observed in stage B and stage E. Comparing with the low-frequency band (delta and theta), the change of the high-frequency band (alpha and beta) was more obvious. Coherence changes among brain regions mainly occurred at stage B and stage E. The increase in stage B was mainly from low-frequency EEG, and the increase in stage E was mainly from high-frequency EEG. The EEG changes of the B and E stages may be caused by brain network remodeling.
The clustering coefficient gradually decreased with the recovery from anesthesia, and the changes mainly came from the cortical region. The characteristic path length and network efficiency do not change significantly during the recovery from anesthesia, and the changes of network modularity and clustering coefficient were similar. During ROC, the left occipital lobe, the left temporal lobe, bilateral amygdala were essential nodes in the network. Some specific cortical regions [left angular gyrus (A), right angular gyrus (B), right temporal lobe (C), left temporal lobe (D) and right angular gyrus (E)] and deep regions [right amygdala (A), left cingulate gyrus (B), right insular lobe (C), right amygdala (D), right amygdala (E)] had more significant constraints on other regions. Our study showed that the occipital lobe plays an essential role in ROC from anesthesia, which further indicates that the induction of and ROC from anesthesia may be associated with different brain regions. However, it remains to be studied whether the results will be different with different anesthetic drugs.
Our study has some limitations. First, SEEG signals were recorded from epileptic patients, and the electrode coverage was determined by clinical criteria. Therefore, the present study's findings can only be interpreted in the context of the covered areas. Second, the SEEG may differ between epileptic patients and healthy populations because of the effect of seizure foci and antiepileptic drug therapy. Whether the findings of this study can be generalized to the healthy brain requires additional investigation. Finally, this study describes exploratory research, and the sample size is relatively small. Therefore, further research and analysis are required to validate our results. Another limitation of this study is the application of non-directed functional connectivity methods. Future studies will be performed using the connectivity methods based on the Granger causality principle, or the Transfer Entropy.
Data Availability Statement
The original contributions presented in the study are included in the article/Supplementary Material, further inquiries can be directed to the corresponding author/s.
Ethics Statement
The studies involving human participants were reviewed and approved by the Ethics Committee of Sanbo Brain Hospital, Capital Medical University. The patients/participants provided their written informed consent to participate in this study.
Author Contributions
TL and BW: design and conception. TL and YS: acquisition, analysis, and interpretation. TL and FW: major contributors in writing the manuscript. All authors read and approved the final manuscript and contributed to the study design and review before submission according to their interests and scientific expertise.
Funding
This work was supported by National Basic Research Program of the Ministry of Science and Technology of China (2013CB531905).
Conflict of Interest
The authors declare that the research was conducted in the absence of any commercial or financial relationships that could be construed as a potential conflict of interest.
Publisher's Note
All claims expressed in this article are solely those of the authors and do not necessarily represent those of their affiliated organizations, or those of the publisher, the editors and the reviewers. Any product that may be evaluated in this article, or claim that may be made by its manufacturer, is not guaranteed or endorsed by the publisher.
Acknowledgments
We thank the Electrophysiology Department of Sanbo Brain Hospital for their suggestions on this study.
Supplementary Material
The Supplementary Material for this article can be found online at: https://www.frontiersin.org/articles/10.3389/fneur.2021.694964/full#supplementary-material
Abbreviations
SEEG, stereoelectroencephalogram; fMRI, functional magnetic resonance imaging; PSD, power spectrum density; MEG, magnetoencephalography; ROC, recovery of consciousness.
References
1. Lee U, Mashour GA. Role of network science in the study of anesthetic state transitions. Anesthesiology. (2018) 129:1029-44. doi: 10.1097/ALN.0000000000002228
2. Bullmore E, Sporns O. Complex brain networks: graph theoretical analysis of structural and functional systems. Nat Rev Neurosci. (2009) 10:186-98. doi: 10.1038/nrn2575
3. Schröter MS, Spoormaker VI, Schorer A, Wohlschläger A, Czisch M, Kochs EF, et al. Spatiotemporal reconfiguration of large-scale brain functional networks during propofol-induced loss of consciousness. J Neurosci. (2012) 32:12832-40. doi: 10.1523/JNEUROSCI.6046-11.2012
4. Boly M, Garrido MI, Gosseries O, Bruno M-A, Boveroux P, Schnakers C, et al. Preserved feedforward but impaired top-down processes in the vegetative state. Science. (2011) 332:858-62. doi: 10.1126/science.1202043
5. Imas OA, Ropella KM, Wood JD, Hudetz AG. Isoflurane disrupts anterio-posterior phase synchronization of flash-induced field potentials in the rat. Neurosci Lett. (2006) 402:216-21. doi: 10.1016/j.neulet.2006.04.003
6. Hudetz AG, Vizuete JA, Imas OA. Desflurane selectively suppresses long-latency cortical neuronal response to flash in the rat. J Am Soc Anesthesiol. (2009) 111:231-9. doi: 10.1097/ALN.0b013e3181ab671e
7. Hudetz AG, Liu X, Pillay S, Boly M, Tononi G. Propofol anesthesia reduces Lempel-Ziv complexity of spontaneous brain activity in rats. Neurosci Lett. (2016) 628:132-5. doi: 10.1016/j.neulet.2016.06.017
8. Hudetz AG, Vizuete JA, Pillay S, Mashour GA. Repertoire of mesoscopic cortical activity is not reduced during anesthesia. Neuroscience. (2016) 339:402-17. doi: 10.1016/j.neuroscience.2016.10.023
9. Kron M, Howell CJ, Adams IT, Ransbottom M, Christian D, Ogier M, et al. Brain activity mapping in Mecp2 mutant mice reveals functional deficits in forebrain circuits, including key nodes in the default mode network, that are reversed with ketamine treatment. J Neurosci. (2012) 32:13860-72. doi: 10.1523/JNEUROSCI.2159-12.2012
10. Michelson NJ, Kozai TD. Isoflurane and ketamine differentially influence spontaneous and evoked laminar electrophysiology in mouse V1. J Neurophysiol. (2018) 120:2232-45. doi: 10.1152/jn.00299.2018
11. Liang T, Wu F, Sun Y, Wang B. Detection of electrophysiological activity of amygdala during anesthesia using stereo-EEG: a preliminary research in anesthetized epileptic patients. Biomed Res Int. (2020) 2020:6932035. doi: 10.1155/2020/6932035
12. Ishizawa Y, Ahmed OJ, Patel SR, Gale JT, Sierra-Mercado D, Brown EN, et al. Dynamics of propofol-induced loss of consciousness across primate neocortex. J Neurosci. (2016) 36:7718-26. doi: 10.1523/JNEUROSCI.4577-15.2016
13. Pal D, Silverstein BH, Sharba L, Li D, Hambrecht-Wiedbusch VS, Hudetz AG, et al. Propofol, sevoflurane, and ketamine induce a reversible increase in delta-gamma and theta-gamma phase-amplitude coupling in frontal cortex of rat. Front Syst Neurosci. (2017) 11:41. doi: 10.3389/fnsys.2017.00041
14. Pal D, Silverstein BH, Lee H, Mashour GA. Neural correlates of wakefulness, sleep, and general anesthesia: an experimental study in rat. Anesthesiology. (2016) 125:929-42. doi: 10.1097/ALN.0000000000001342
15. Martini ML, Valliani AA, Sun C, Costa AB, Zhao S, Panov F, et al. Deep anomaly detection of seizures with paired stereoelectroencephalography and video recordings. Sci Rep. (2021) 11:1-11. doi: 10.1038/s41598-021-86891-y
16. Bola M, Barrett AB, Pigorini A, Nobili L, Seth AK, Marchewka A. Loss of consciousness is related to hyper-correlated gamma-band activity in anesthetized macaques and sleeping humans. Neuroimage. (2018) 167:130-42. doi: 10.1016/j.neuroimage.2017.11.030
17. Epstein RH, Maga JM, Mahla ME, Schwenk ES, Bloom MJ. Prevalence of discordant elevations of state entropy and bispectral index in patients at amnestic sevoflurane concentrations: a historical cohort study. Can J Anesth/Journal canadien d'anesthésie. (2018) 65:512-21. doi: 10.1007/s12630-018-1085-3
18. Marsh B, White M, Morton N, Kenny G. Pharmacokinetic model driven infusion of propofol in children. BJA. (1991) 67:41-8. doi: 10.1093/bja/67.1.41
19. Tadel F, Baillet S, Mosher JC, Pantazis D, Leahy RM. Brainstorm: a user-friendly application for MEG/EEG analysis. Comput Intell Neurosci. (2011) 2011:879716. doi: 10.1155/2011/879716
20. Ji H, Petro NM, Chen B, Yuan Z, Wang J, Zheng N, et al. Cross multivariate correlation coefficients as screening tool for analysis of concurrent EEG-fMRI recordings. J Neurosci Res. (2018) 96:1159-75. doi: 10.1002/jnr.24217
21. Boccaletti S, Latora V, Moreno Y, Chavez M, Hwang D-U. Complex networks: structure and dynamics. Phys Rep. (2006) 424:175-308. doi: 10.1016/j.physrep.2005.10.009
22. Waller L, Brovkin A, Dorfschmidt L, Bzdok D, Walter H, Kruschwitz JD. GraphVar 2.0: a user-friendly toolbox for machine learning on functional connectivity measures. J Neurosci Meth. (2018) 308:21-33. doi: 10.1016/j.jneumeth.2018.07.001
23. Kruschwitz J, List D, Waller L, Rubinov M, Walter H. GraphVar: a user-friendly toolbox for comprehensive graph analyses of functional brain connectivity. J Neurosci Meth. (2015) 245:107-15. doi: 10.1016/j.jneumeth.2015.02.021
24. Liang Z, Cheng L, Shao S, Jin X, Yu T, Sleigh JW, et al. Information integration and mesoscopic cortical connectivity during propofol anesthesia. Anesthesiology. (2020) 132:504-24. doi: 10.1097/ALN.0000000000003015
25. Bartolomei F, Lagarde S, Wendling F, McGonigal A, Jirsa V, Guye M, et al. Defining epileptogenic networks: contribution of SEEG and signal analysis. Epilepsia. (2017) 58:1131-47. doi: 10.1111/epi.13791
26. Koskinen M, Mustola S, Seppänen T. Relation of EEG spectrum progression to loss of responsiveness during induction of anesthesia with propofol. Clin Neurophysiol. (2005) 116:2069-76. doi: 10.1016/j.clinph.2005.06.004
27. Kortelainen J, Koskinen M, Mustola S, Seppanen T, editors. EEG frequency progression during induction of anesthesia: from start of infusion to onset of burst suppression pattern. In: 2007 29th Annual International Conference of the IEEE Engineering in Medicine and Biology Society. Lyon: IEEE (2007).
28. Kortelainen J, Koskinen M, Mustola S, Seppanen T editors. EEG spectral changes and onset of burst suppression pattern in propofol/remifentanil anesthesia. In: 2008 30th Annual International Conference of the IEEE Engineering in Medicine and Biology Society. Vancouver, BC: IEEE (2008).
29. Ku S-W, Lee U, Noh G-J, Jun I-G, Mashour GA. Preferential inhibition of frontal-to-parietal feedback connectivity is a neurophysiologic correlate of general anesthesia in surgical patients. PLoS ONE. (2011) 6:e25155. doi: 10.1371/journal.pone.0025155
30. Hudson AE, Calderon DP, Pfaff DW, Proekt A. Recovery of consciousness is mediated by a network of discrete metastable activity states. Proc Natl Acad Sci. (2014) 111:9283-8. doi: 10.1073/pnas.1408296111
31. Hight DF, Dadok VM, Szeri AJ, García PS, Voss L, Sleigh JW. Emergence from general anesthesia and the sleep-manifold. Front Syst Neurosci. (2014) 8:146. doi: 10.3389/fnsys.2014.00146
32. Gugino L, Chabot R, Prichep L, John E, Formanek V, Aglio L. Quantitative EEG changes associated with loss and return of consciousness in healthy adult volunteers anaesthetized with propofol or sevoflurane. Br J Anaesth. (2001) 87:421-8. doi: 10.1093/bja/87.3.421
33. Chander D, García PS, MacColl JN, Illing S, Sleigh JW. Electroencephalographic variation during end maintenance and emergence from surgical anesthesia. PLoS ONE. (2014) 9:e106291. doi: 10.1371/journal.pone.0106291
34. Lee U, Müller M, Noh G-J, Choi B, Mashour GA. Dissociable network properties of anesthetic state transitions. J Am Soc Anesthesiol. (2011) 114:872-81. doi: 10.1097/ALN.0b013e31821102c9
35. Bonhomme V, Vanhaudenhuyse A, Demertzi A, Bruno M-A, Jaquet O, Bahri MA, et al. Resting-state network-specific breakdown of functional connectivity during ketamine alteration of consciousness in volunteers. Anesthesiology. (2016) 125:873-88. doi: 10.1097/ALN.0000000000001275
36. Tononi G, Boly M, Massimini M, Koch C. Integrated information theory: from consciousness to its physical substrate. Nat Rev Neurosci. (2016) 17:450-61. doi: 10.1038/nrn.2016.44
37. Alkire MT, Hudetz AG, Tononi G. Consciousness and anesthesia. Science. (2008) 322:876-80. doi: 10.1126/science.1149213
38. Joudaki A, Salehi N, Jalili M, Knyazeva MG. EEG-based functional brain networks: does the network size matter? PLoS ONE. (2012) 7:e35673. doi: 10.1371/journal.pone.0035673
39. Hevey D. Network analysis: a brief overview and tutorial. Health Psychol Behav Med. (2018) 6:301-28. doi: 10.1080/21642850.2018.1521283
40. McColgan P, Blom T, Rees G, Seunarine KK, Gregory S, Johnson E, et al. Stability and sensitivity of structural connectomes: effect of thresholding and filtering and demonstration in neurodegeneration. Biorxiv. (2018) 2018:416826. doi: 10.1101/416826
41. Harrington DL, Rubinov M, Durgerian S, Mourany L, Reece C, Koenig K, et al. Network topology and functional connectivity disturbances precede the onset of Huntington's disease. Brain. (2015) 138:2332-46. doi: 10.1093/brain/awv145
42. Zhang Z, Liao W, Chen H, Mantini D, Ding J-R, Xu Q, et al. Altered functional–structural coupling of large-scale brain networks in idiopathic generalized epilepsy. Brain. (2011) 134:2912-28. doi: 10.1093/brain/awr223
Keywords: stereoelectroencephalogram, electrophysiological activity, network, propofol, epilepsy, recovery of consciousness
Citation: Liang T, Wu F, Sun Y and Wang B (2021) Electrophysiological Activity and Brain Network During Recovery of Propofol Anesthesia: A Stereoelectroencephalography-Based Analysis in Patients With Intractable Epilepsy—An Exploratory Research. Front. Neurol. 12:694964. doi: 10.3389/fneur.2021.694964
Received: 15 April 2021; Accepted: 12 November 2021;
Published: 03 December 2021.
Edited by:
Peter Herman, Yale University, United StatesReviewed by:
Rei Enatsu, Sapporo Medical University, JapanElzbieta Olejarczyk, Institute of Biocybernetics and Biomedical Engineering (PAN), Poland
Copyright © 2021 Liang, Wu, Sun and Wang. This is an open-access article distributed under the terms of the Creative Commons Attribution License (CC BY). The use, distribution or reproduction in other forums is permitted, provided the original author(s) and the copyright owner(s) are credited and that the original publication in this journal is cited, in accordance with accepted academic practice. No use, distribution or reproduction is permitted which does not comply with these terms.
*Correspondence: Baoguo Wang, d2Jnc2Jua0AxNjMuY29t
 Tao Liang
 Fan Wu2
 Baoguo Wang
