
95% of researchers rate our articles as excellent or good
Learn more about the work of our research integrity team to safeguard the quality of each article we publish.
Find out more
ORIGINAL RESEARCH article
Front. Neurol. , 29 April 2021
Sec. Neuro-Otology
Volume 12 - 2021 | https://doi.org/10.3389/fneur.2021.670944
This article is part of the Research Topic Epidemiology and Genetics of Vestibular Disorders View all 18 articles
 Ralf Strobl1,2*
 Michael Grözinger1
 Andreas Zwergal2,3
 Doreen Huppert2,3
 Filipp Filippopulos2,3
 Eva Grill1,2,4
Precise history taking is the key to develop a first assumption on the diagnosis of vestibular disorders. Particularly in the primary care setting, algorithms are needed, which are based on a small number of questions and variables only to guide appropriate diagnostic decisions. The aim of this study is to identify a set of such key variables that can be used for preliminary classification of the most common vestibular disorders. A four-step approach was implemented to achieve this aim: (1) we conducted an online expert survey to collect variables that are meaningful for medical history taking, (2) we used qualitative content analysis to structure these variables, (3) we identified matching variables of the patient registry of the German Center for Vertigo and Balance Disorders, and (4) we used classification trees to build a classification model based on these identified variables and to analyze if and how these variables contribute to the classification of common vestibular disorders. We included a total of 1,066 patients with seven common vestibular disorders (mean age of 51.1 years, SD = 15.3, 56% female). Functional dizziness was the most frequent diagnosis (32.5%), followed by vestibular migraine (20.2%) and Menière's disease (13.3%). Using classification trees, we identified eight key variables which can differentiate the seven vestibular disorders with an accuracy of almost 50%. The key questions comprised attack duration, rotational vertigo, hearing problems, turning in bed as a trigger, doing sport or heavy household chores as a trigger, age, having problems with walking in the dark, and vomiting. The presented algorithm showed a high-face validity and can be helpful for taking initial medical history in patients with vertigo and dizziness. Further research is required to evaluate if the identified algorithm can be applied in the primary care setting and to evaluate its external validity.
With a lifetime prevalence between 20 and 30% (1), vertigo and dizziness (VaD) belong to the most common complaints in primary care and emergency departments (2, 3). VaD have an annual prevalence of 9% in medical claim databases (4) and a high impact on daily life (5, 6).
In most cases, the diagnosis and treatment of VaD is straightforward (1, 7, 8). Inappropriate or delayed management of VaD, however, may contribute to chronic symptoms, increase disability, and cause secondary psychosomatic disorders (9–11).
While patients with VaD are mostly processed in primary care, a recent systematic review found considerable inconsistencies in the management of dizzy patients in this setting (12). Experts claim that taking a structured medical history is the key to make basic triage, namely, to decide if the patient can be managed in primary care, needs referral to a specialist, or, in the rare case of a life-threatening etiology of VaD (e.g., stroke), even needs emergency care. Concepts for a structured history taking such as the “Five Keys” (13) proposed that a limited number of symptom characteristics allows to successfully differentiate a majority of all VaD cases. Commonly recommended questions for rational history taking are whether VaD the complaints are paroxysmal or permanent, short or long lasting, spontaneous or triggered, of stereotypical presentation, direction-specific, or accompanied by neurological or otological symptoms (13, 14).
However, it has been argued that successful medical reasoning is often based on implicit experience and “gut feeling” that supplements explicit structured knowledge (15). Intuitive elements in the diagnostic process seem to play an important role in diagnostic reasoning (16). For example, the physician's feeling that “there was something wrong” turned out to predict serious infections in children (17). Personal preferences play an important role not only in taking medical history but also for assessing diagnostic thresholds and how to interpret them (18), probably as a function of experience and specialization. In this case, history taking in VaD may be less evidence-based than proposed.
In the current study, we validated a set of questions proposed by neurootological experts by a data-driven approach and hypothesized that a limited number of key characteristics will facilitate the differentiation of the most prevalent vestibular disorders with sufficient validity. To identify these key characteristics, several different statistical approaches are possible. In a previous study, we could show that machine learning methods may display good prediction accuracy but do not yield information about the causal pathways leading to good prediction (19). However, there are methods such as classification and regression trees (20) and their more recently developed methodological refinements (21) to rank characteristics according to their importance.
The aim of this study is to identify a set of key variables that are based on both expert experience and empirical knowledge, can be easily collected in clinical practice, and can be used as indicators for correct diagnosis of the most common vestibular disorders.
To assemble an a priori collection of variables that are meaningful according to expert opinion, we first conducted a worldwide online survey among experts in the field about relevant themes and aspects of history taking in vestibular disease. We then used qualitative content analysis to clarify and structure these aspects. Thirdly, resulting contents were linked to variables from a specialized clinical patient registry that contained verified diagnoses according to current diagnostic guidelines as a gold standard. Fourthly, we used classification trees to analyze if these variables with apparent face validity also had statistical predictive validity.
This survey was conducted as an anonymous online survey in 2018. The participants were recruited from members of the Bárány Society, an international society for experts committed to vestibular disorders, and members of the DizzyNet, a European network initiative for vertigo and balance research (22). The online questionnaire was created with SoSci Survey (23) and made available to the participants on “www.soscisurvey.com.” All experts were contacted by e-mail and provided with detailed information about the study.
The experts were asked to specify a limited number of questions that would be most salient and relevant during history taking to establish a preliminary diagnosis, e.g., to differentiate vestibular from non-vestibular or peripheral from central etiologies of VaD, along with any response options that would be indicative of a specific diagnosis. In addition to this, the respondents provided information on their institution, country, clinical specialization, and personal experience in the field.
Structured content analysis (24–26) was used to develop categories from the text passages provided by the experts. Two researchers (EG and RS) read the text and, independently from each other, identified “meaning units,” i.e., distinct meaningful and manageable units. We then organized these units into a taxonomy consisting of main categories and subcategories hierarchically nested within main categories. To give an example, “associated symptoms” was defined as a main category, with “visual symptoms, oscillopsia” and “headache” being subcategories, respectively. The results of the two independent analyses were then synthesized. In case of differences, the final structure was decided on by discussion and consensus. MaxQDA® 2020 was used to support the content analysis and to assign weights to frequently used codes and priorities for interpretation (27).
DizzyReg is an ongoing prospective clinical patient registry that collects information currently stored in electronic health records and medical discharge letters to create a comprehensive clinical database of patient characteristics, symptoms, diagnostic procedures, diagnosis, therapy, and outcomes in patients with VaD (28). Routinely, the patients also report quality of life and functioning in a few standardized questionnaires (2, 29–32). Adult patients are included if they presented at the German Center for Vertigo and Balance Disorders (DSGZ), a tertiary reference unit for outpatients at the Hospital of Ludwig-Maximilians-Universität, Munich, and provided written informed consent. Recruitment into the registry commenced in December 2015. Data protection clearance and institutional review board approval has been obtained (no. 414-15).
We chose those variables from DizzyReg that would correspond most closely to the categories from our content analysis described above, e.g., the subcategory “duration of attacks” would fit to the corresponding variable “If you had vertigo, how long did it last? Less than 20 min; up to 20 min; 20 min to 1 h; several hours; more than 12 h; several days.” If more than one variable could be linked, we chose the variable which was most accurately measurable and which had the smallest number of missing values.
Diagnoses in the DizzyReg are based on a complete neurootological workup carried out by experienced neurootologists of the DSGZ and which conform to current guidelines (33–42). The neurootological examination includes a comprehensive battery of bedside tests, audiologic and vestibular function tests, and, if necessary, further imaging (e.g., cranial MRI) or consultation with other medical specialties, e.g., otorhinolaryngology, neurology, psychiatry, or ophthalmology. For this study, we included the seven most frequent diagnoses at the DSGZ (28, 43): benign paroxysmal positional vertigo (BPPV), functional dizziness (FD), Menière's disease (MD), vestibular paroxysmia (VP), unilateral vestibulopathy (UVP), bilateral vestibulopathy (BVP), and vestibular migraine (VM). There were no patients with both definite MD and VM in our data set.
For data description, we used mean values and standard deviation for continuous variables and absolute and relative frequencies for categorical variables. In DizzyReg, missing values are routinely replaced by a neutral value, reflecting the practice that tests will not be applied if they are not needed or that symptom status are not reported if not indicated, i.e., the result is expected to be neutral.
Classification and regression trees (CART) have the main advantage to yield a visually attractive tree structure that mimics human decision making and is easy to interpret (20). In brief, the CART procedure starts by splitting the entire data set with all individuals into smaller subsets that are more homogenous regarding a defined outcome in the current study “diagnosis.” This splitting process is visualized by an upside-down tree structure, with each node in the tree representing a variable and each branch representing a split of the data.
For example, a first split assigns all individuals reporting headache to the left subnode and all individuals not reporting headache to the right subnode. The left subnode would then contain a higher percentage of persons with VM than the right subnode. However, the left subnode would also contain persons who reported headache but were not diagnosed with VM. Each of these subnodes is subsequently split again until each branch terminates in an end node, which is maximally homogeneous regarding diagnosis. Each end node will be assigned with the class, which occurs most often in it. A patient is allocated according to his/her individual characteristics to a certain end node and subsequently classified with the diagnosis assigned to the class of this end node.
Without any restrictions, the final tree would grow until it perfectly classifies each individual in the data set but would perform poorly to classify new individuals, i.e., it overfits. Thus, the final tree needs to be shrunk (“pruned”) (20) to gain this external validity. We applied cost-complexity pruning that yields a trade-off between the complexity of the tree and its fit to the data. To get an unbiased estimate of this fit, we applied k-fold cross-validation (CV). CV assesses how a classification method will generalize to an independent data set by using out-of-sample estimates. The k-fold CV partitions the data set into k distinct subsets, trains the model on k-1 of the subsets, and estimates the test error on the remaining one. This will be repeated k times, with each subset acting once to assess the performance. The final fit is calculated as the average over the k estimates. Following common recommendations, k was set to 10 (44).
Some diagnoses were more frequent than others, resulting in imbalanced data. Imbalanced data may bias the tree toward the majority class, i.e., the final tree assigns individuals predominantly to the most frequent diagnosis. To avoid this, cases were weighted with the inverse of their class frequency (45), and class assignment of the end nodes was based on these weighted cases. Thus, cases with less frequent diagnoses were weighted higher than cases with more frequent diagnoses, for example, patients diagnosed with functional dizziness were weighted by 0.44 (1,066 divided by 7 × 346) and patients with unilateral vestibulopathy by 1.34 (1,066 divided by 7 × 114).
In contrast to standard regression methods, a classification tree does not indicate which of the variables contributed most to the result, i.e., which questions will be most relevant for the diagnostic decision. To estimate variable relevance, we applied random forest classification (46), which yields estimates of variable importance values (47–49).
To assess variable importance, we applied an importance measure based on permutation (46). Here the mean decreases in accuracy, i.e., the proportion of correctly classified patients, for each variable is assessed by randomly permuting the values of this variable and measuring the decrease in accuracy due to this permutation. This permutation importance does not measure the full effect on prediction of a variable because other variables could act as surrogates. Recent developments also suggest other concrete importance parameters, among others the number of time a variable formed the root of a tree (50). In the current study, we report both the prediction accuracy based on permutation and the number of times a variable was used to split the root node.
Statistical significance was set at a two-tailed 5% level. R 3.6.1 was used for descriptive analyses (51) and the machine learning library scikit-learn (52) for learning and pruning the tree. Variable importance was assessed with the “RandomForestExplainer” package in R (50). Visualization of the trained tree was obtained using the open-source python library dtreeviz (53).
Overall accuracy was estimated as the number of correctly classified patients divided by the total number of included patients. Thus, a patient was correctly classified if the assigned class of the end node that the patient belongs to matches the final diagnosis made at the DSGZ and incorrectly if otherwise. To judge the quality of the classification for each VaD syndrome, we reported sensitivity (SEN), specificity (SPEC), positive predictive value (PPV), and negative predictive value (NPV). As these measures are only defined for binary classification and not for multi-class classification, we reduced the classification problem by the “one vs. all” approach exclusively for this calculation.
In total, 21 experts from 16 different countries took part in the online survey. The experts worked in a total of 19 centers treating an average of 1,000 patients per year (median: 700, range: 40–4,000). The participants reported an average of 23 years of clinical experience (median: 25, range: 4–42). A total of 152 different statements were reported.
Content analysis yielded nine main categories and 39 subcategories, which are shown in Table 1.
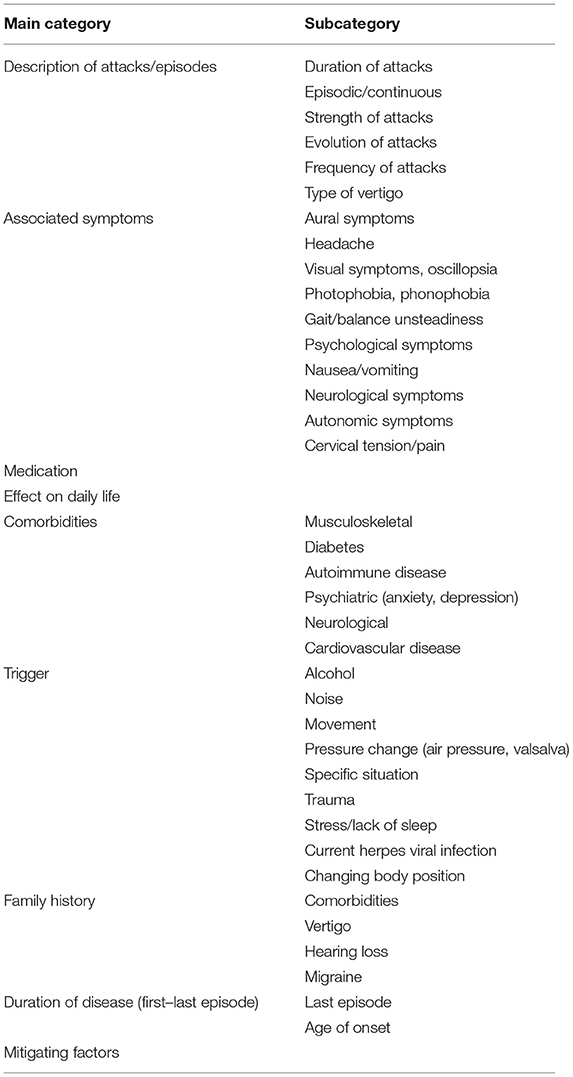
Table 1. Main and subcategories identified from the expert survey.
A total of 98 variables contained in the DizzyReg could be linked to one of the categories. Ten categories were not represented in the registry, e.g., alcohol or pressure changes as a trigger. A complete description of the linking results can be found in the electronic appendix (Supplementary Table 1).
We included a total of 1,066 patients with a mean age of 51.1 years (standard deviation, SD = 15.3), 56% of whom were female. Functional dizziness was the most frequent diagnosis (32.5%), followed by vestibular migraine (20.2%) and Menière's disease (13.3%). A total of 47% of patients had vertigo or dizziness for <2 years (for more details, see Table 2).
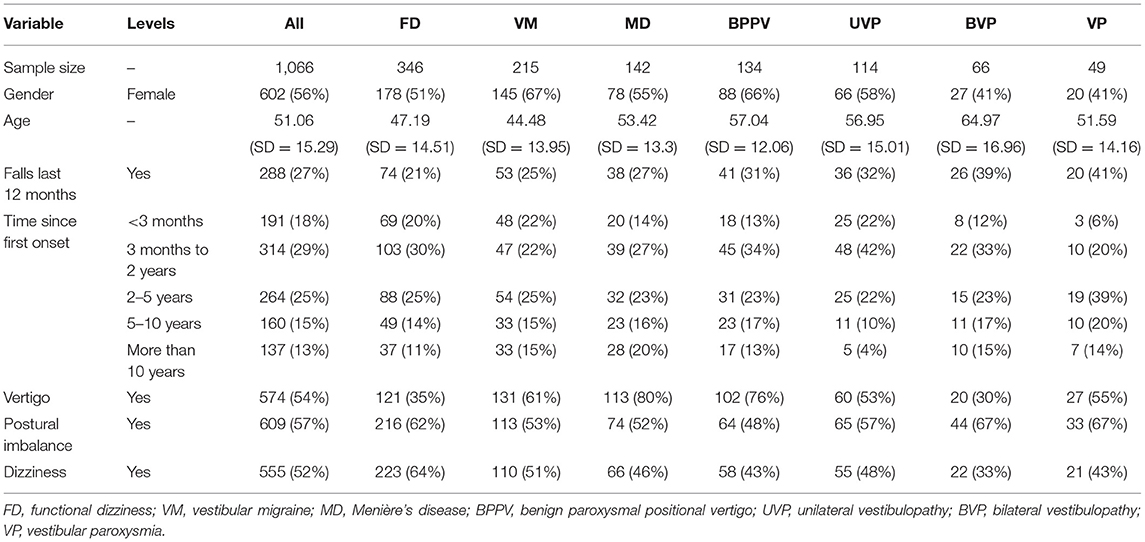
Table 2. Description of the study sample for the seven different diagnoses.
Eight variables were found to be indicative for vertigo and dizziness diagnoses: attack duration, rotational vertigo, hearing problems, turning in bed as a trigger, doing sport or heavy household chores as a trigger, age, having problems with walking in the dark, and vomiting. The resulting tree is shown in Figure 1.
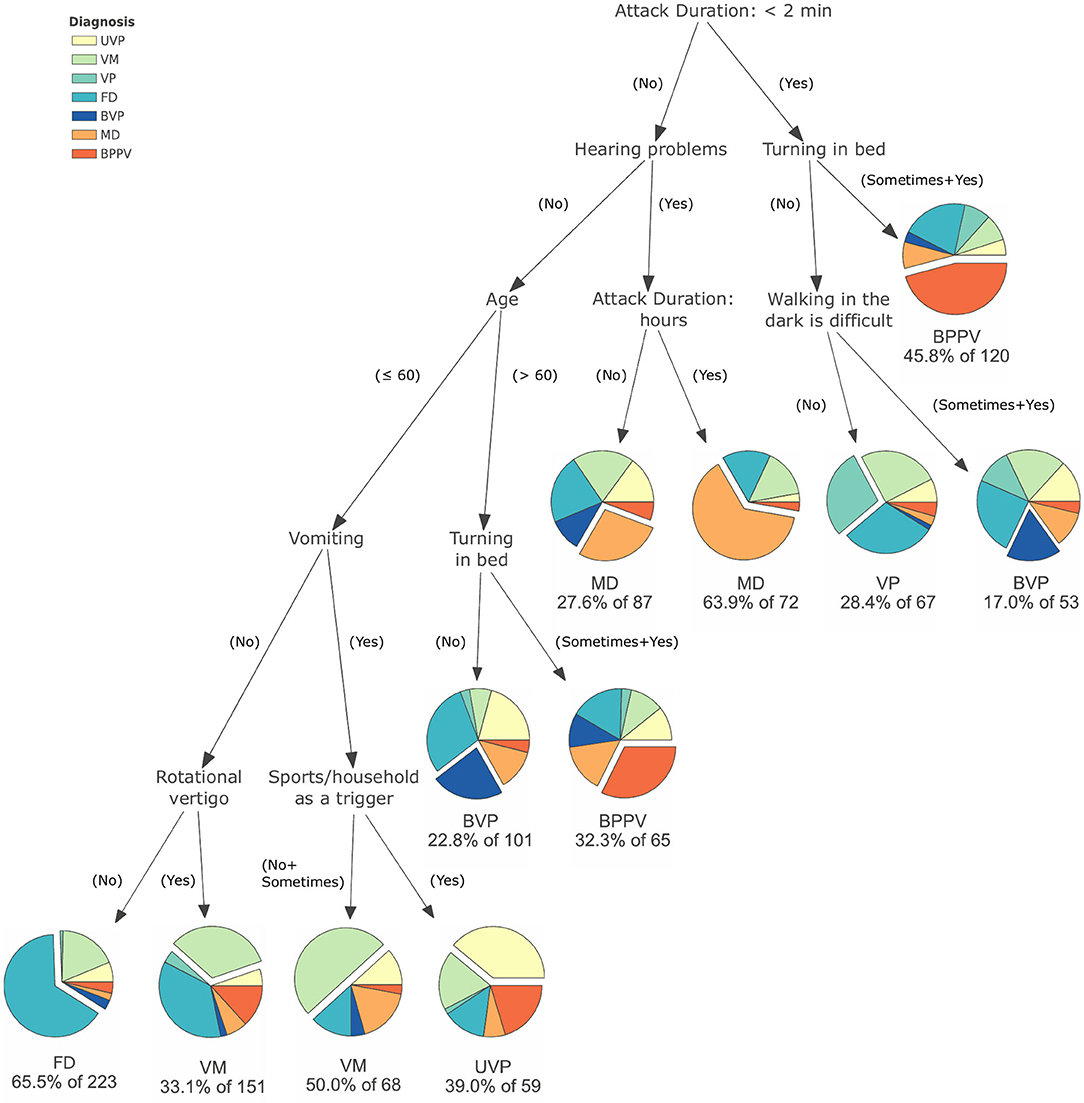
Figure 1. Result of the classification and regression trees to distinguish between functional dizziness, vestibular migraine, Menière's disease, benign paroxysmal positional vertigo, unilateral vestibulopathy, bilateral vestibulopathy, and vestibular paroxysmia.
To give an example for interpretation: two paths in the tree could identify 56.7% of patients with BPPV correctly. In the first path, a short attack duration (<2 min) and turning in bed as a trigger lead to a correct classification of 55 patients with BPPV. In the second path, a longer attack duration, no hearing problems, age >60, and turning in bed as a trigger lead to 21 patients being correctly classified. In summary, of the 134 patients with BPPV, 76 (56.7%) were assigned to the correct classification of BPPV. The overall accuracy of the algorithm for all diagnoses as a multi-class problem was 42.2%. Further details of the diagnostic properties can be found in Table 3.
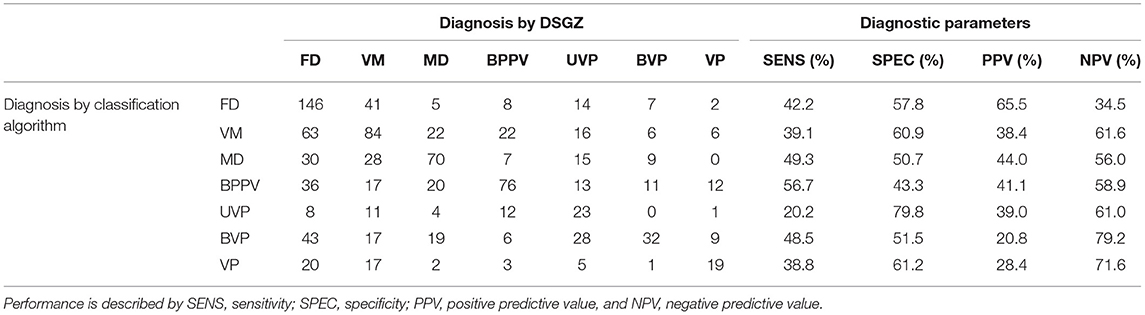
Table 3. Comparison of the classification of the classification and regression trees algorithm with the diagnosis made at the German Center for Vertigo and Balance Disorders (DSGZ) for functional dizziness (FD), vestibular migraine (VM), Menière's disease (MD), benign paroxysmal positional vertigo (BPPV), unilateral vestibulopathy (UVP), bilateral vestibulopathy (BVP), and vestibular paroxysmia (VP).
The variable importance of the 20 variables that contributed most to the classification was determined by random forest analysis and is shown in Table 4. The variable with the most influence on the performance of the algorithm was vomiting, followed by age and hearing problems.
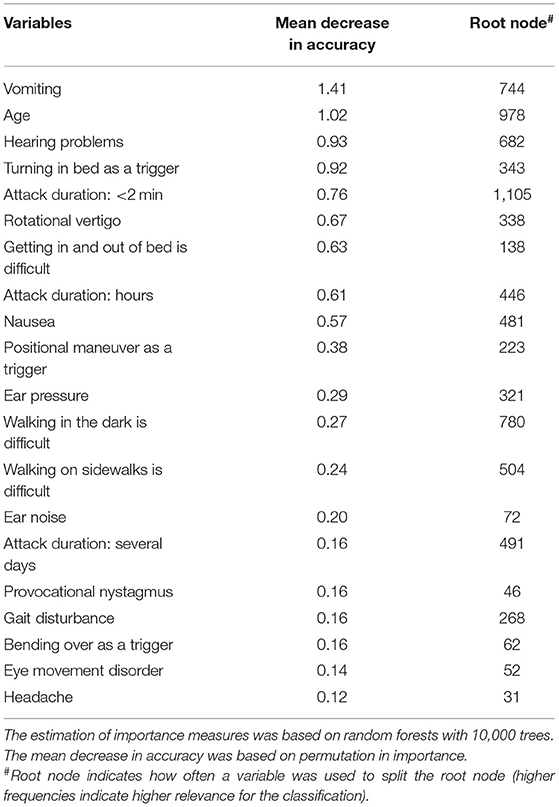
Table 4. Variable importance of the 20 most relevant variables to differentiate between the seven different vestibular diagnoses (functional dizziness, vestibular migraine, Menière's disease, benign paroxysmal positional vertigo, unilateral vestibulopathy, bilateral vestibulopathy, and vestibular paroxysmia).
This study was able to identify a set of eight key questions that can help to differentiate seven common vestibular diagnoses. The key questions comprised attack duration, rotational vertigo, hearing problems, turning in bed as a trigger, doing sport or heavy household chores as a trigger, age, having problems with walking in the dark, and vomiting.
The negative predictive values were higher than the positive predictive values, indicating that it was mostly easier to exclude a diagnosis than to confirm it.
Using expert opinion and a statistical classification approach, we arrived at combinations of symptoms with high face validity. Positive predictive value in our study was highest for functional dizziness. This is not surprising because FD is characterized by the combination of typical symptoms and the absence of others (38). Thus, the sequence of longer attack duration, no hearing problems, younger age, no vegetative symptoms, and a presentation as dizziness rather than rotational vertigo indicated FD, which is in line with the approach presented by Dieterich et al. (54, 55). On the other hand, FD was also frequently present in other nodes (between 13 and 29%). This finding may be explained by the relatively high prevalence of FD in this sample. Furthermore, patients with FD report a multitude of uncharacteristic symptoms fluctuating in time and intensity, triggered by various situations (55). Furthermore, FD often manifests as a comorbidity to or consequence of different organic vestibular disorders, most commonly VM, BPPV, and MD (56).
BPPV was likewise characterized in our study by a short duration of attacks and the movement of body and head in the horizontal plane, which is in line with the typical clinical presentation (43, 57). These two questions identified more than half of BPPV patients. Head movement while turning in bed was also indicative for an older group of patients with BPPV who had longer attacks. This finding also aligns with literature (58).
In addition, the characterization of MD, BVP, and UVP in our study is in accordance with the clinical key features described previously (39, 59, 60). In our study, MD patients had a longer attack duration and hearing loss. BVP was characterized by symptoms aggravating in darkness, permanent dizziness, and higher age. Increase of symptoms in darkness and older age are highly characteristic for BVP (61). UVP characteristics were a longer duration of symptoms, lack of hearing loss, younger age (<60 years), vomiting, and aggravation by sports or heavy household chores. Although UVP can occur in all age groups and is thus not considered to be typical for younger adults, a peak between the ages of 30 and 50 was suggested (62).
Vestibular migraine was difficult to classify in our study. The clearest differentiation was age, which is confirmed by the finding that VM typically manifests in younger adults (63) without typical triggers (34). Interestingly, we were not able to confirm headache as a typical feature of VM. It has been shown that about 30% of patients with VM do not report headache associated to vertigo attacks (64), and <50% of patients report the simultaneous presence of headache and vertigo during attacks (65).
A specific objective of the present study was to train a machine learning model for classification that is transparent, easy to use in daily clinical practice, and easy to understand. In the past, several different approaches have been used to help classify the underlying pathologies of vertigo and dizziness. A complex method like deep neural networks (DNN), which was applied to vestibular disorders with promising results (19, 66), is difficult to directly transfer to a real-world clinical setting since DNN does not provide transparency on how the classification decision was made. Similarly, applying support vector machine (SVM) is accompanied by a lack of procedural transparency but comes with a high power regarding accuracy. A study on classifying unilateral vestibulopathy using SVM yielded an accuracy of 76% (67). Another study was able to differentiate the peripheral and central causes of acute vestibular disorders with a high accuracy using modern machine learning methods (68). Recent research aimed to alleviate the drawback of procedural opacity and develop explainable artificial intelligence (69), but their work was based on pattern recognition and has not been applied to data sets with numeric, ordinal, or categorical data yet. Thus, further research is required to identify if such an approach might be appropriate for a clinical decision-making system in specialized areas like vestibular disorders.
Studies using transparent learning methods, like CART, are scarce. A study from 2000 also applied classification trees for differentiation of vestibular disorders (70). They identified hearing loss, duration of the disease, frequency of attacks, severity of rotational vertigo, onset and type of hearing loss, and occurrence of head injury at onset of vertigo as important variables for diagnostic classification. These variables are similar to the ones presented here, although some variables were not surveyed in the present study (e.g., association to trauma). Another study used boosted decision trees to identify two different feature sets, one for general practitioners and one for experts (71). All these studies reported a higher accuracy than our study, as they used a one-vs.-all classification approach, which results in better accuracy but is less precise than our approach. To put this into context, a one-vs.-all approach has an implicit minimal accuracy of 50% as the classification problem is reduced to a dichotomous choice. In contrast to this, our algorithm aims at distinguishing between seven different vertigo syndromes simultaneously, yielding a minimal accuracy of 1/7 = 14%. Thus, the overall accuracy of 42.2% is a notable improvement.
In our study, we used data from a patient registry of a tertiary referral center for balance disorders, which is not representative for patients presenting with vertigo and dizziness in primary or secondary care. Patients visiting specialized units are usually a selection of severe or chronic patients with a long history of disease or unsuccessful therapy. This may explain the low accuracy of our findings. However, this registry is one of the largest data collections of information on vestibular disorders, including rare forms, and belongs to one of the most comprehensive and valid sources for clinical phenotyping. In addition, there are patients with overlapping syndromes (e.g., VM and MD). This overlap may pose a challenge for the current diagnostic approach as these patients may present with a set of symptoms not characteristic for the assigned diagnosis. Furthermore, certain syndromes occurring in the emergency setting, like vestibular TIA or stroke, or other rare syndromes, like vestibular schwannoma, are not sufficiently represented in the patient registry. To be applied in a real-world setting, these vestibular syndromes should be incorporated in the algorithm, for example, by including expert knowledge or data sets from emergency departments. To further improve the diagnostic algorithm for the classification of common vestibular disorders, results from basic clinical vestibular testing (such as the clinical head impulse test or positioning maneuvers) and a modification of symptomatic categories need to be incorporated into the model.
There are several shortcomings of CART as opposed to other methods. Firstly, trees are not very robust to small changes in the data, i.e., a small change can result into a different tree. Furthermore, CART cannot handle non-random missing values in an adequate way. A common approach to handle missing values is based on surrogate splits, which cannot be applied here, as the best surrogate candidates have the same cause of missingness, e.g., the decision of the physician that a certain measurement is not necessary for diagnosis (72). Secondly, trees cannot compete with complex ensemble methods in terms of prediction accuracy alone. A study using real and simulated data sets showed that the accuracy of the best single-tree algorithm is on average about 10% less than that of a tree ensemble (21).
However, we are confident that, for the purpose of the current study, CART represents the most transparent method to develop an algorithm for diagnosing vestibular disorders. The main advantage of tree-based models is that they mirror human decision-making. Thus, the identified tree can act as a blueprint for taking and structuring patient records.
The presented algorithm used a transparent and easily applicable approach for categorizing different common vestibular syndromes based on eight key questions. It may be helpful for the initial triage of patients but needs to be followed by a basic clinical exam of vestibular and ocular motor functions to improve the accuracy of the diagnostic classification. To evaluate if the identified algorithm might be a basis for a simple-to-use algorithm in a primary care setting, further studies are required.
The data analyzed in this study is subject to the following licenses/restrictions: an application form has to be sent to the Scientific Committee of the German Center for Vertigo and Balance Disorders. Requests to access these datasets should be directed to cmFsZi5zdHJvYmxAbWVkLnVuaS1tdWVuY2hlbi5kZQ==.
The studies involving human participants were reviewed and approved by Ethic committee of the medical faculty, LMU Munich, Munich, Germany. The patients/participants provided their written informed consent to participate in this study.
RS contributed to the drafting/revising of the manuscript for content, including writing, study concept/design, interpretation of data, and acquisition of data. MG contributed to statistical analysis and revision of the manuscript for content, including writing, and study concept. AZ contributed to the interpretation of data and revision of the manuscript for content. DH contributed to the development of the concept and revision of the manuscript for content. FF contributed to the interpretation of data, revision of the manuscript for content, and medical writing. EG contributed to the drafting/revision the manuscript for content, including medical writing and study concept/design. All authors contributed to the article and approved the submitted version.
This work was supported by funds from the German Federal Ministry of Education and Research under Grant Code 01 EO 1401 and Grant Number 01 EO 0901.
The authors declare that the research was conducted in the absence of any commercial or financial relationships that could be construed as a potential conflict of interest.
We would like to thank the patients participating in the registry and the experts, who participated in the online survey.
The Supplementary Material for this article can be found online at: https://www.frontiersin.org/articles/10.3389/fneur.2021.670944/full#supplementary-material
2. Yardley L, Owen N, Nazareth I, Luxon L. Prevalence and presentation of dizziness in a general practice community sample of working age people. Br J Gen Pract. (1998) 48:1131–5.
3. Neuhauser HK, von Brevern M, Radtke A, Lezius F, Feldmann M, Ziese T, et al. Epidemiology of vestibular vertigo: a neurotologic survey of the general population. Neurology. (2005) 65:898–904. doi: 10.1212/01.wnl.0000175987.59991.3d
4. Rieger A, Mansmann U, Maier W, Seitz L, Brandt T, Strupp M, et al. Management of patients with the cardinal symptom dizziness or vertigo. Gesundheitswesen. (2014) 76:e32–38. doi: 10.1055/s-0033-1357145
5. Neuhauser HK, Radtke A, von Brevern M, Lezius F, Feldmann M, Lempert T. Burden of dizziness and vertigo in the community. Arch Intern Med. (2008) 168:2118–24. doi: 10.1001/archinte.168.19.2118
6. Mueller M, Strobl R, Jahn K, Linkohr B, Peters A, Grill E. Burden of disability attributable to vertigo and dizziness in the aged: results from the KORA-Age study. Eur J Public Health. (2013) 5:802–7. doi: 10.1093/eurpub/ckt171
8. Strupp M, Brandt T. Diagnosis and treatment of vertigo and dizziness. Dtsch Arztebl Int. (2008) 105:173–80. doi: 10.3238/arztebl.2008.0173
9. Strupp M, Glaser M, Karch C, Rettinger N, Dieterich M, Brandt T. The most common form of dizziness in middle age: phobic postural vertigo. Nervenarzt. (2003) 74:911–4. doi: 10.1007/s00115-003-1567-5
10. Geser R, Straumann D. Referral and final diagnoses of patients assessed in an academic vertigo center. Front Neurol. (2012) 3:169. doi: 10.3389/fneur.2012.00169
11. Grill E, Strupp M, Muller M, Jahn K. Health services utilization of patients with vertigo in primary care: a retrospective cohort study. J Neurol. (2014) 261:1492–8. doi: 10.1007/s00415-014-7367-y
12. Grill E, Penger M, Kentala E. Health care utilization, prognosis and outcomes of vestibular disease in primary care settings: systematic review. J Neurol. (2016) 263(Suppl. 1):36–44. doi: 10.1007/s00415-015-7913-2
13. Brandt T, Strupp M, Dieterich M. Five keys for diagnosing most vertigo, dizziness, and imbalance syndromes: an expert opinion. J Neurol. (2014) 261:229–31. doi: 10.1007/s00415-013-7190-x
14. Newman-Toker DE, Edlow JA. TiTrATE: a novel, evidence-based approach to diagnosing acute dizziness and vertigo. Neurol Clin. (2015) 33:577–99, viii. doi: 10.1016/j.ncl.2015.04.011
15. Stolper E, van Bokhoven M, Houben P, Van Royen P, van de Wiel M, van der Weijden T, et al. The diagnostic role of gut feelings in general practice. A focus group study of the concept and its determinants. BMC Fam Pract. (2009) 10:17. doi: 10.1186/1471-2296-10-17
16. Van den Brink N, Holbrechts B, Brand PLP, Stolper ECF, Van Royen P. Role of intuitive knowledge in the diagnostic reasoning of hospital specialists: a focus group study. BMJ Open. (2019) 9:e022724. doi: 10.1136/bmjopen-2018-022724
17. Van den Bruel A, Aertgeerts B, Bruyninckx R, Aerts M, Buntinx F. Signs and symptoms for diagnosis of serious infections in children: a prospective study in primary care. Br J Gen Pract. (2007) 57:538–46.
18. Strupp M, Grimberg J, Teufel J, Laurell G, Kingma H, Grill E. Worldwide survey on laboratory testing of vestibular function. Neurol Clin Pract. (2020) 10:379–87. doi: 10.1212/CPJ.0000000000000744
19. Grill E, Groezinger M, Feil K, Strupp M. Developing and implementing diagnostic prediction models for vestibular diseases in primary care. Stud Health Technol Inform. (2016) 228:735–9. doi: 10.3233/978-1-61499-678-1-735
20. Breiman L. Classification and Regression Trees. Belmont, Calif: Wadsworth International Group (1984).
21. Loh W-Y. Fifty years of classification and regression trees. Int Stat Rev. (2014) 82:329–48. doi: 10.1111/insr.12016
22. Zwergal A, Grill E, Lopez C, Dieterich M. DIZZYNET 2019: approaching the future of vestibular research. J Neurol. (2019) 266 (Suppl. 1):1–2. doi: 10.1007/s00415-019-09514-7
23. Leiner DJ. SoSci Survey (Version 3.1.06). (2019). Available online at https://www.soscisurvey.de
24. Mayring P. Qualitative content analysis. In: Kardorff E, Steinke I, Flick U, editors. A Companion to Qualitative Research. London: SAGE Publications (2004). p. 266–9.
25. Schmidt C. The analysis of semi-structured interviews. In: Kardorff E, Steinke I, Flick U, editors. A Companion to Qualitative Research. London: SAGE Publications (2004). p. 253–8.
27. VERBI Software. MAXQDA 2020. Berlin (2019). Available online at: maxqda.com
28. Grill E, Muller T, Becker-Bense S, Gurkov R, Heinen F, Huppert D, et al. DizzyReg: the prospective patient registry of the German center for vertigo and balance disorders. J Neurol. (2017) 264 (Suppl. 1):34–6. doi: 10.1007/s00415-017-8438-7
29. Herdman M, Gudex C, Lloyd A, Janssen M, Kind P, Parkin D, et al. Development and preliminary testing of the new five-level version of EQ-5D (EQ-5D-5L). Qual Life Res. (2011) 20:1727–36. doi: 10.1007/s11136-011-9903-x
30. Alghwiri AA, Whitney SL, Baker CE, Sparto PJ, Marchetti GF, Rogers JC, et al. The development and validation of the vestibular activities and participation measure. Arch Phys Med Rehabil. (2012) 93:1822–31. doi: 10.1016/j.apmr.2012.03.017
31. Grill E, Furman JM, Alghwiri AA, Mueller M, Whitney SL. Using core sets of the international classification of functioning, disability and health (ICF) to measure disability in vestibular disorders: study protocol. J Vestib Res. (2013) 23:297–303. doi: 10.3233/VES-130487
32. Mueller M, Whitney SL, Alghwiri A, Alshebber K, Strobl R, Alghadir A, et al. Subscales of the vestibular activities and participation questionnaire could be applied across cultures. J Clin Epidemiol. (2015) 68:211–9. doi: 10.1016/j.jclinepi.2014.10.004
33. Bisdorff A, Von Brevern M, Lempert T, Newman-Toker DE. Classification of vestibular symptoms: towards an international classification of vestibular disorders. J Vestib Res. (2009) 19:1–13. doi: 10.3233/VES-2009-0343
34. Lempert T, Olesen J, Furman J, Waterston J, Seemungal B, Carey J, et al. Vestibular migraine: diagnostic criteria. J Vestib Res. (2012) 22:167–72. doi: 10.3233/VES-2012-0453
35. Lopez-Escamez JA, Carey J, Chung WH, Goebel JA, Magnusson M, Mandala M, et al. Diagnostic criteria for Meniere's disease. J Vestib Res. (2015) 25:1–7. doi: 10.3233/VES-150549
36. von Brevern M, Bertholon P, Brandt T, Fife T, Imai T, Nuti D, et al. Benign paroxysmal positional vertigo: diagnostic criteria. J Vestib Res. (2015) 25:105–17. doi: 10.3233/VES-150553
37. Strupp M, Lopez-Escamez JA, Kim JS, Straumann D, Jen JC, Carey J, et al. Vestibular paroxysmia: diagnostic criteria. J Vestib Res. (2016) 26:409–15. doi: 10.3233/VES-160589
38. Staab JP, Eckhardt-Henn A, Horii A, Jacob R, Strupp M, Brandt T, et al. Diagnostic criteria for persistent postural-perceptual dizziness (PPPD): consensus document of the committee for the classification of vestibular disorders of the barany society. J Vestib Res. (2017) 27:191–208. doi: 10.3233/VES-170622
39. Strupp M, Kim JS, Murofushi T, Straumann D, Jen JC, Rosengren SM, et al. Bilateral vestibulopathy: diagnostic criteria consensus document of the classification committee of the barany society. J Vestib Res. (2017) 27:177–89. doi: 10.3233/VES-170619
40. Agrawal Y, Van de Berg R, Wuyts F, Walther L, Magnusson M, Oh E, et al. Presbyvestibulopathy: diagnostic criteria consensus document of the classification committee of the barany society. J Vestib Res. (2019) 29:161–70. doi: 10.3233/VES-190672
41. Eggers SDZ, Bisdorff A, von Brevern M, Zee DS, Kim JS, Perez-Fernandez N, et al. Classification of vestibular signs and examination techniques: nystagmus and nystagmus-like movements. J Vestib Res. (2019) 29:57–87. doi: 10.3233/VES-190658
42. Kim HA, Bisdorff A, Bronstein AM, Lempert T, Rossi-Izquierdo M, Staab JP, et al. Hemodynamic orthostatic dizziness/vertigo: diagnostic criteria. J Vestib Res. (2019) 29:45–56. doi: 10.3233/VES-190655
43. Strupp M, Dieterich M, Brandt T. The treatment and natural course of peripheral and central vertigo. Deutsches Arzteblatt Int. (2013) 110:505–37. doi: 10.3238/arztebl.2013.0505
44. Molinaro AM, Simon R, Pfeiffer RM. Prediction error estimation: a comparison of resampling methods. Bioinformatics. (2005) 21:3301–7. doi: 10.1093/bioinformatics/bti499
45. He H, Garcia EA. Learning from imbalanced data. IEEE Trans Knowl Data Eng. (2009) 21:1263–84. doi: 10.1109/TKDE.2008.239
47. Hastie T, Tibshirani R, Friedman JH. The Elements of Statistical Learning: Data Mining, Inference, and Prediction. New York, NY: Springer (2009).
48. Flach PA. Machine Learning: The Art and Science of Algorithms that Make Sense of Data. Cambridge; New York: Cambridge University Press (2012).
49. Ziegler A, König I. Mining data with random forests: current options for real-world applications. Wiley Interdiscip Rev Data Mining Knowl Discov. (2014) 4:1114. doi: 10.1002/widm.1114
50. Jiang APPB. randomForestExplainer: Explaining and Visualizing Random Forests in Terms of Variable Importance. R Package Version 0.10.1 (2020). Available online at: https://CRAN.R-project.org/package=randomForestExplainer
51. R Core Team. A Language and Environment for Statistical Computing. Vienna: R Foundation for Statistical Computing (2019).
52. Pedregosa F, Varoquaux G, Gramfort A, Michel V, Thirion B, Grisel O, et al. Scikit-learn: machine learning in Python. J Mach Learn Res. (2011) 12:2825–30.
54. Dieterich M, Staab JP, Brandt T. Functional (psychogenic) dizziness. Handb Clin Neurol. (2016) 139:447–68. doi: 10.1016/B978-0-12-801772-2.00037-0
55. Dieterich M, Staab JP. Functional dizziness: from phobic postural vertigo and chronic subjective dizziness to persistent postural-perceptual dizziness. Curr Opin Neurol. (2017) 30:107–13. doi: 10.1097/WCO.0000000000000417
56. Lahmann C, Henningsen P, Brandt T, Strupp M, Jahn K, Dieterich M, et al. Psychiatric comorbidity and psychosocial impairment among patients with vertigo and dizziness. J Neurol Neurosurg Psychiatry. (2015) 86:302–8. doi: 10.1136/jnnp-2014-307601
57. Parnes LS, Agrawal SK, Atlas J. Diagnosis and management of benign paroxysmal positional vertigo (BPPV). CMAJ. (2003) 169:681–93.
58. Balatsouras DG, Koukoutsis G, Fassolis A, Moukos A, Apris A. Benign paroxysmal positional vertigo in the elderly: current insights. Clin Interv Aging. (2018) 13:2251–66. doi: 10.2147/CIA.S144134
59. Sajjadi H, Paparella MM. Meniere's disease. Lancet. (2008) 372:406–14. doi: 10.1016/S0140-6736(08)61161-7
60. Strupp M, Brandt T. Vestibular neuritis. Semin Neurol. (2009) 29:509–19. doi: 10.1055/s-0029-1241040
61. Brandt T, Grill E, Strupp M, Huppert D. Susceptibility to fear of heights in bilateral vestibulopathy and other disorders of vertigo and balance. Front Neurol. (2018) 9:406. doi: 10.3389/fneur.2018.00406
62. Sekitani T, Imate Y, Noguchi T, Inokuma T. Vestibular neuronitis: epidemiological survey by questionnaire in Japan. Acta Otolaryngol Suppl. (1993) 503:9–12. doi: 10.3109/00016489309128061
63. Formeister EJ, Rizk HG, Kohn MA, Sharon JD. The epidemiology of vestibular migraine: a population-based survey study. Otol Neurotol. (2018) 39:1037–44. doi: 10.1097/MAO.0000000000001900
64. Stolte B, Holle D, Naegel S, Diener HC, Obermann M. Vestibular migraine. Cephalalgia. (2015) 35:262–70. doi: 10.1177/0333102414535113
65. Dieterich M, Obermann M, Celebisoy N. Vestibular migraine: the most frequent entity of episodic vertigo. J Neurol. (2016) 263(Suppl. 1):S82–9. doi: 10.1007/s00415-015-7905-2
66. Groezinger M, Hubbert D, Strobl R, Grill E. Development and validation of a classification algorithm to diagnose and differentiate spontaneous episodic vertigo syndromes: results from the DizzyReg patient registry. J Neurol. (2020) 267(Suppl. 1):160–7. doi: 10.1007/s00415-020-10061-9
67. Priesol AJ, Cao M, Brodley CE, Lewis RF. Clinical vestibular testing assessed with machine-learning algorithms. JAMA Otolaryngol Head Neck Surg. (2015) 141:364–72. doi: 10.1001/jamaoto.2014.3519
68. Ahmadi SA, Vivar G, Navab N, Mohwald K, Maier A, Hadzhikolev H, et al. Modern machine-learning can support diagnostic differentiation of central and peripheral acute vestibular disorders. J Neurol. (2020) 267(Suppl. 1):143–52. doi: 10.1007/s00415-020-09931-z
69. Samek W, Montavon G, Vedaldi A, Hansen LK, Müller K-R. Explainable AI: interpreting, explaining and visualizing deep learning. In: Samek W, Vedaldi A, Müller K-R, Montavon G, Hansen LK, editors. Lecture Notes in Artificial Intelligence. Cham: Springer (2019).
70. Kentala E, Viikki K, Pyykko I, Juhola M. Production of diagnostic rules from a neurotologic database with decision trees. Ann Otol Rhinol Laryngol. (2000) 109:170–6. doi: 10.1177/000348940010900211
71. Exarchos TP, Rigas G, Bibas A, Kikidis D, Nikitas C, Wuyts FL, et al. Mining balance disorders' data for the development of diagnostic decision support systems. Comput Biol Med. (2016) 77:240–8. doi: 10.1016/j.compbiomed.2016.08.016
Keywords: vertigo, diagnosis, machine learning, surveys and questionnaires, clinical decision-making
Citation: Strobl R, Grözinger M, Zwergal A, Huppert D, Filippopulos F and Grill E (2021) A Set of Eight Key Questions Helps to Classify Common Vestibular Disorders—Results From the DizzyReg Patient Registry. Front. Neurol. 12:670944. doi: 10.3389/fneur.2021.670944
Received: 22 February 2021; Accepted: 17 March 2021;
Published: 29 April 2021.
Edited by:
Sun-Young Oh, Jeonbuk National University, South KoreaReviewed by:
Sun-Uk Lee, Seoul National University Bundang Hospital, South KoreaCopyright © 2021 Strobl, Grözinger, Zwergal, Huppert, Filippopulos and Grill. This is an open-access article distributed under the terms of the Creative Commons Attribution License (CC BY). The use, distribution or reproduction in other forums is permitted, provided the original author(s) and the copyright owner(s) are credited and that the original publication in this journal is cited, in accordance with accepted academic practice. No use, distribution or reproduction is permitted which does not comply with these terms.
*Correspondence: Ralf Strobl, cmFsZi5zdHJvYmxAbWVkLnVuaS1tdWVuY2hlbi5kZQ==
Disclaimer: All claims expressed in this article are solely those of the authors and do not necessarily represent those of their affiliated organizations, or those of the publisher, the editors and the reviewers. Any product that may be evaluated in this article or claim that may be made by its manufacturer is not guaranteed or endorsed by the publisher.
Research integrity at Frontiers
Learn more about the work of our research integrity team to safeguard the quality of each article we publish.