 Wen-Song Yang1,2†Yi-Qing Shen1,2†Xiao Wei3
 Li-Bo Zhao4,5Qing-Jun Liu4,5Xiong-Fei Xie6Zhi-Wei Zhang6Lan Deng1
 Xin-Ni Lv1Shu-Qiang Zhang1Xin-Hui Li1,2
 Qi Li1,2,5*Peng Xie1,2,5*
- 1Department of Neurology, The First Affiliated Hospital of Chongqing Medical University, Chongqing, China
- 2National Health Commission Key Laboratory of Diagnosis and Treatment on Brain Functional Diseases, The First Affiliated Hospital of Chongqing Medical University, Chongqing, China
- 3Department of Traditional Chinese Medicine, Chongqing Medical and Pharmaceutical College, Chongqing, China
- 4Department of Neurology, Yongchuan Hospital of Chongqing Medical University, Chongqing, China
- 5Chongqing Key Laboratory of Cerebrovascular Disease Research, Yongchuan Hospital of Chongqing Medical University, Chongqing, China
- 6Department of Radiology, The First Affiliated Hospital of Chongqing Medical University, Chongqing, China
Objectives: The original intracerebral hemorrhage (oICH) score is the severity score most commonly used in clinical intracerebral hemorrhage (ICH) research but may be influenced by hematoma expansion or intraventricular hemorrhage (IVH) growth in acute ICH. Here, we aimed to develop new clinical scores to improve the prediction of functional outcomes in patients with ICH.
Methods: Patients admitted to the First Affiliated Hospital of Chongqing Medical University with primary ICH were prospectively enrolled in this study. Hematoma volume was measured using a semiautomated, computer-assisted technique. The dynamic ICH (dICH) score was developed by incorporating hematoma expansion and IVH growth into the oICH score. The ultra-early ICH (uICH) score was developed by adding the independent non-contrast CT markers to the oICH score. Receiver operating characteristic curve analysis was used to compare performance among the oICH score, dICH score, and uICH score.
Results: There were 310 patients in this study which included 72 patients (23.2%) with hematoma expansion and 58 patients (18.7%) with IVH growth. Of 31 patients with two or more non-contrast computed tomography markers, 61.3% died, and 96.8% had poor outcomes at 90 days. After adjustment for potential confounding variables, we found that age, baseline Glasgow Coma Scale score, presence of IVH on initial CT, baseline ICH volume, infratentorial hemorrhage, hematoma expansion, IVH growth, blend sign, black hole sign, and island sign could independently predict poor outcomes in multivariate analysis. In comparison with the oICH score, the dICH score and uICH score exhibited better performance in the prediction of poor functional outcomes.
Conclusions: The dICH score and uICH score were useful clinical assessment tools that could be used for risk stratification concerning functional outcomes and provide guidance in clinical decision-making in acute ICH.
Introduction
Intracerebral hemorrhage (ICH) is the second most common stroke subtype, high in mortality and morbidity (1). The case-fatality rate of patients with ICH ranges from 35 to 59%, and more than 60% of survivors have a poor prognosis (2). In previous studies, independent predictors of poor functional outcomes included age, hematoma volume, intraventricular hemorrhage (IVH), Glasgow Coma Scale (GCS) score, and infratentorial hemorrhage (3, 4). Hemphill et al. (5, 6) integrated these variables to establish the original ICH (oICH) score, which has been a severity score most commonly used in clinical ICH research.
However, acute ICH is a dynamic process, such that ~30% of patients will experience early hematoma expansion (7, 8). IVH growth has been reported in ~20% of patients with ICH (9). Recent studies suggested that both early hematoma expansion and IVH growth were independently associated with poor outcomes (7–10). The predictive accuracy of the oICH score may be influenced by hematoma expansion or IVH growth in acute ICH. To ensure optimal patient care, clinicians require accurate information to perform effective risk stratification concerning patient outcomes.
Schneider et al. (11) provided a prognostic score by adding the computed tomography angiography (CTA) spot sign to the oICH score to predict poor outcomes in ICH patients. However, identifying the spot sign requires a CTA examination, which is not readily available in most hospitals during the acute phase of ICH. Non-contrast computed tomography (NCCT) is the most widely used examination for the evaluation of ICH in ultra-early ICH (uICH). Several NCCT markers have emerged as promising indicators of hematoma expansion and poor outcomes (12). Notably, NCCT markers could serve as alternatives to the CTA spot sign for predicting hematoma expansion if CTA examination is unavailable (13–16). Thus, the NCCT markers might improve the ability of the oICH score to predict clinical, functional outcomes in patients with acute ICH.
This study was performed to investigate the prognostic value of the oICH score with respect to functional outcomes in patients with acute ICH. Moreover, it aimed to determine whether the inclusion of the NCCT markers into the oICH score could accurately stratify acute ICH patients in terms of 90-day functional outcomes.
Materials and Methods
Study Design and Patient Selection
Patients admitted to the First Affiliated Hospital of Chongqing Medical University with primary ICH between January 2012 and July 2017 were retrospectively analyzed in this research. In total, 310 patients with primary ICH were included in the analysis (Supplementary Figure 1). Patients with ICH were included if they had an initial NCCT scan performed within 6 h after ICH onset and a follow-up NCCT scan within 36 h after the initial NCCT scan. All research procedures and protocols were performed following the ethical standards of the Declaration of Helsinki.
Clinical Data Collection and Image Analysis
Baseline demographics, medical comorbidities, clinical admission status, laboratory data, and imaging data were recorded. We evaluated the modified Rankin Scale (mRS) score at 3 months by trained staff. All images were retrospectively assessed by two experienced reviewers who were blinded to clinical characteristics and patient outcomes. The discrepancy between the two reviewers was settled through joint discussion until a consensus was reached. All NCCT markers were judged according to the previous definition.
Primary ICH was classified according to hematoma location as deep, lobar, or infratentorial hemorrhage. The parenchymal hematoma volumes and IVH volumes were measured using semiautomated, computer-assisted volumetric software (Mimics Software, version 20.0; Materialise NV, Leuven, Belgium). Briefly, a mask with predefined values of 44–99 Hounsfield units was constructed for the region of interest. The hematoma segmentation accuracy was confirmed by region growing with manual inspection. The connected hematoma in both parenchymal and ventricular aspects was manually segmented (Supplementary Figure 2). Hematoma volumes were calculated by the software and verified by trained staff.
Blend sign, black hole sign, CT hypodensities, and island sign were defined as previously described (17–20). Significant hematoma expansion was defined as an increase exceeding 33% or 6 ml from the baseline parenchymal hematoma volume (8). IVH growth was defined as either a delayed IVH on follow-up CT or an absolute growth of IVH volume >1 ml from baseline CT to follow-up CT (9, 10). Poor outcomes were defined as an mRS score of 4–6 at 90 days, as described previously (21, 22). We developed the dynamic ICH (dICH) score by incorporating hematoma expansion and IVH growth into the oICH score and further established the uICH score by adding the independent NCCT markers to the oICH score.
Statistical Analyses
We performed all statistical analyses using SPSS 21.0 (SPSS, Chicago, IL, USA) and MedCalc version 11.4.2. The receiver operating characteristic curves were drawn to calculate the area under the curve (AUC), sensitivity, and specificity. We further compared the performance of the oICH score, the dICH score, and the uICH score for predicting 30-day mortality, 90-day mortality, and poor outcome using the approach described by DeLong et al. (23). The chi-squared test, Fisher's exact test, Student's t-test, or Mann–Whitney U-test were performed as appropriate. Multivariate logistic regression analysis was used to select independent factors associated with poor outcomes by including all variables with P ≤ 0.1 in the univariate analysis. The dICH score and the uICH score were developed using the results of the multivariate logistic regression analysis. The level of significance was set at a P-value of < 0.05.
Results
Study Population and Clinical Characteristics
In the study, the mean patient age was 59.3 ± 12.3 years. The median time from symptom onset to baseline CT scan was 2 h (interquartile range, 1–4 h). There were 47 patients (15.2%) with blend sign, 44 patients (14.2%) with black hole sign, 100 patients (32.3%) with CT hypodensities, and 46 patients (14.8%) with island sign. Interobserver agreement were excellent for evaluation of blend sign [κ = 0.80 (95% confidence interval; 0.70–0.89)], black hole sign [κ = 0.87 (95% confidence interval; 0.78–0.95)], CT hypodensities [κ = 0.85 (95% confidence interval; 0.78–0.91)], and island sign [κ = 0.89 (95% confidence interval; 0.80–0.96)].
Of the 310 patients, 72 (23.2%) had hematoma expansion, and 58 (18.7%) had IVH growth. Patients with poor outcomes had older age (P = 0.002), lower admission GCS score (P < 0.001), higher baseline IVH volume (P < 0.001), larger baseline hematoma volume (P < 0.001), more frequent IVH on initial CT (P < 0.001), more frequent hematoma expansion (P < 0.001), and more frequent IVH growth (P < 0.001; Table 1). Furthermore, patients with poor outcomes were more likely to have the presence of blend sign, black hole sign, CT hypodensities, and island sign (all P < 0.001; Table 1). The oICH score, dICH score, and uICH score were significantly higher in patients with poor outcomes than those without, respectively (all P < 0.001; Table 1).
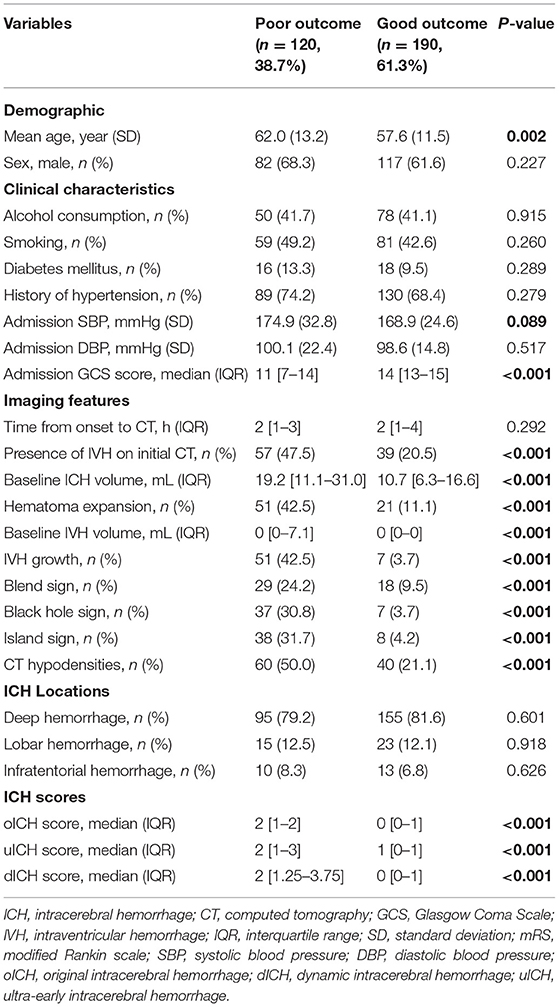
Table 1. Comparison of demographic, clinical, and imaging characteristics and outcome between patients with and without poor outcome.
Multivariate Logistic Analysis and Establishment of New Scores
After adjustment for the potential confounders, the following factors could independently predict poor outcomes in the multivariate logistic regression analysis: age, baseline GCS score, presence of IVH on initial CT, baseline ICH volume, hematoma expansion, IVH growth, blend sign, black hole sign, and island sign (Table 2). The dICH score and uICH score were developed from Model 1 and Model 2, respectively. Each independent factor was assigned points based on its strength of association with the functional outcomes, as shown in Table 3.
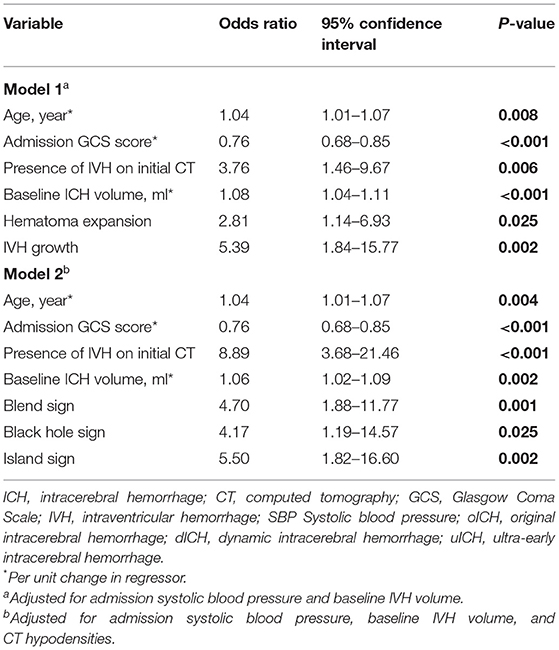
Table 2. Multivariate analysis of predictors for poor outcome.
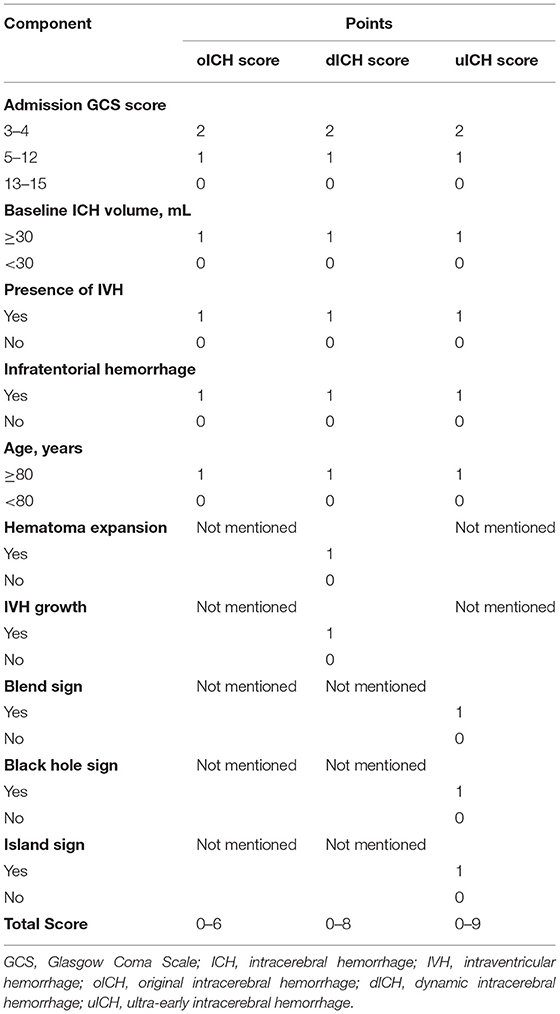
Table 3. Determinants of the oICH score, dICH score, and uICH score.
Comparison of the Intracerebral Hemorrhage Scores
The accuracies of the oICH score, dICH score, and uICH score for predicting 30-day mortality, 90-day mortality, and poor outcomes were illustrated in Supplementary Table 1. In comparison with the oICH score, the dICH score exhibited better performance in predicting 30-day mortality, 90-day mortality, and poor outcome, respectively (all P < 0.05; Figure 1). The uICH score has a higher performance in predicting 90-day mortality and poor outcome compared with the oICH score, respectively (both P < 0.05; Figure 1). There were no significant differences between the dICH score and uICH score in predicting 30-day mortality, 90-day mortality, and poor outcome, respectively (Figure 1). Notably, there were 31 patients with two or more NCCT markers. Of these 31 patients, 61.3% died within 90 days of follow-up, and 96.8% had poor outcomes of mRS 4–6 (Figure 2).
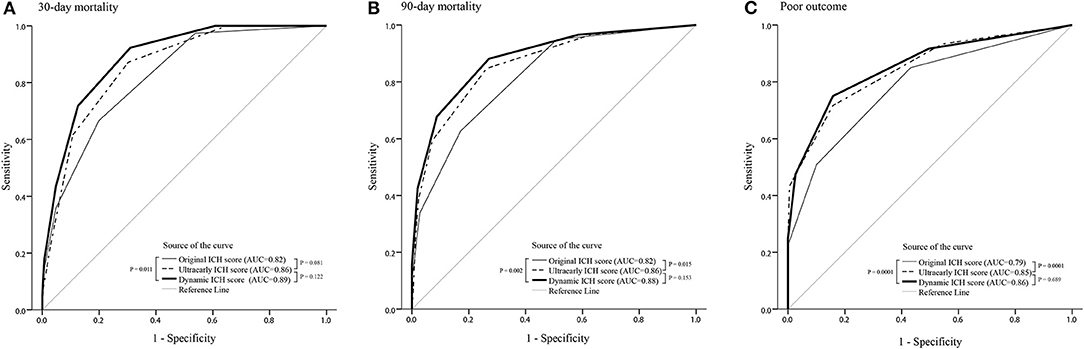
Figure 1. ROC curves of the oICH score, dICH score, and uICH score for prediction of 30-day mortality (A), 90-day mortality (B), and poor outcome (C), respectively. ICH, intracerebral hemorrhage; ROC, receiver operating characteristic; oICH, original intracerebral hemorrhage; dICH, dynamic intracerebral hemorrhage; uICH, ultra-early intracerebral hemorrhage.
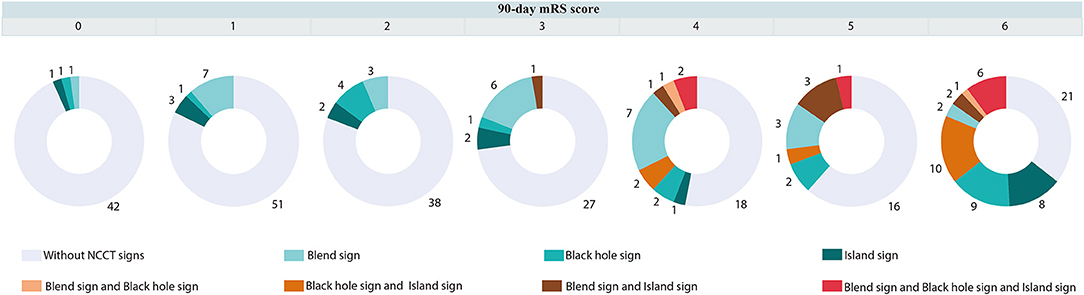
Figure 2. Distribution of mRS in patients with or without blend sign, and (or) black hole sign, and (or) island sign. mRS indicates a modified Rankin Scale.
Discussion
This study evaluated the clinical utility of the dICH score and uICH score in the context of acute ICH. Our findings suggested that the performances of the dICH score and uICH score were better than the oICH score in predicting 90-day mortality and poor outcomes in patients with acute ICH.
The prediction of functional outcomes is important for aiding clinicians in clinical decision-making concerning patients with ICH. The oICH score has good predictive ability in terms of risk stratification to predict poor outcomes and is now the standardized score for assessment of patients with spontaneous ICH (5, 6). Although many ICH severity scores have been derived thus far, there is no emerging standard superior to the oICH score (24). This is presumably because the oICH score comprises several core prognostic variables (i.e., age, hematoma volume, IVH, and ICH location) and a severity scale (GCS score).
Hematoma growth is relatively common in patients presented within 24 h after ICH onset; it is especially common in those who present within 6 h. Notably, 50–82% of hematoma growth has been reported to occur within 6 h after ICH onset; this decreases to 17–19% between 6 and 24 h (25, 26). Furthermore, hematoma expansion is the main cause of early neurologic deterioration with a reduction in GCS score (14, 27). Dynamic changes in IVH volume have also been shown to independently predict poor outcomes in ICH patients (10, 11). Importantly, the subtypes of IVH growth (including delayed IVH and IVH volume expansion) are considered independent predictors of poor outcomes (28–30). Thus, the elements of the oICH score, such as hematoma volume and GCS score, may change in the presence of active bleeding, and the ability of the oICH score to predict outcomes may be reduced. Following the incorporation of hematoma expansion into the oICH score, the dICH score showed significantly better performance in the prediction of clinical, functional outcomes compared with the oICH score.
Recently, Sembill et al. (31) established the max-ICH score, which included National Institutes of Health Stroke Scale (NIHSS) score, age, intraventricular hemorrhage, oral anticoagulation, lobar ICH volume ≥ 30 ml, and non-lobar ICH volume ≥ 10 ml, and made a more detailed classification of the variable of age and NIHSS score. The max-ICH score had higher accuracy in the assessment of functional outcomes when compared with the oICH score. However, in subsequent external validation of the max-ICH score, Schmidt et al. (24) found that the prognostic values did not significantly differ between the max-ICH score and oICH score significant difference. Our findings imply that the differences between the prior two studies were related to differences in the course of ICH among patients (e.g., from symptom onset to ICH score assessment). Measurements of the GCS score, the NIHSS score, hematoma volume, and IVH status were performed at an early stage (<24 h) in the study by Sembill et al. (31), whereas they were performed on day 5 in the study by Schmidt et al. (24). Furthermore, Lun et al. (32) found that the oICH score using 24-h imaging had better prognostic accuracy in predicting 3 months mortality compared with an examination at the time of initial presentation. Taken together, these findings indicate the admission data in the acute phase may limit the predictive performance of the oICH score. The dICH score could aid in more accurate risk stratification. Thus, the frequent clinical evaluation and follow-up imaging examination in patients with acute ICH are important for assisting in clinical decision-making.
Notably, many ICH patients arrive at the emergency department within several hours due to the rapid symptom onset. In addition, a recent secondary analysis of the ATACH2 trial results suggested that ultra-early blood pressure reduction was associated with a reduced rate of hematoma growth and improved functional outcomes in ICH patients (33). Therefore, outcome prediction within a few hours after ICH onset is important for clinicians to delineate the potential benefits of aggressive care. In the PREDICT cohort, a prognostic score was defined by incorporating the spot sign into the oICH score, but the spot sign ICH score did not alter the accuracy for predicting poor outcomes compared with the oICH score (11). Although numbers of spot signs have been associated with risk stratification concerning hematoma expansion (34, 35), the relationship between numbers of spot signs and poor outcomes remains unclear. Therefore, the accuracy of the oICH score in predicting poor outcomes of ICH may not be improved by increasing the number of spot signs.
Previous studies suggested that blend sign, black hole sign, hypodensities, and island sign were independently associated with poor outcome in patients with ICH (20, 36–39). Conversely, patients with benign ICH who did not have those imaging markers were less likely to experience hematoma growth and were reported to have good functional outcomes. The model of expansion-prone hematoma composed of blend sign, black hole sign, and island sign has higher performance for predicting poor outcomes than any single NCCT sign (40). Furthermore, it is interesting to note that when two or more NCCT markers are present in a hematoma, the probability of a poor prognosis is greatly increased. Of 31 patients with two or more NCCT markers, 61.3% died, and 96.8% had poor outcomes at 90 days. Thus, after the addition of the blend sign, black hole sign, and island sign to the oICH score, the uICH score showed meaningful improvement with respect to the accuracy of outcome prediction in the uICH when compared with the oICH score. Importantly, we found that the diagnostic performances of the dICH score and the uICH score were similar for predicting 30-day mortality, 90-day mortality, and poor outcomes, respectively. In the present study, the dICH score showed a larger AUC than the oICH score. However, a notable strength of the uICH score is that it can be calculated during the initial evaluation of ICH patients. We note that the AUC of the dICH score was greater than that of the uICH score, but it is reasonable because the dICH score included information concerning hematoma expansion and IVH growth to the uICH score. Moreover, the uICH score used information from the initial evaluation and had a predictive capacity similar to that of the dICH score. The uICH score might be considered superior to the dICH score because the uICH score can be calculated on admission and has prognostic information similar to that of the dICH score. The uICH score may help prognostic risk stratification in acute ICH patients with initial clinical information. Furthermore, the uICH score may help clinicians to triage patients in resource-limited settings.
Our study had several strengths: Firstly, we have established two new ICH scores, which both exhibited better performance in terms of predicting poor functional outcomes, compared with the oICH score. Our findings imply that the oICH score may not be an optimal method for risk stratification in uICH patients. Secondly, we found that a hematoma comprising two or more NCCT signs may increase the probability of predicting an unfavorable prognosis of ICH. Thus, incorporating blend sign, black hole sign, and island sign into the oICH score could significantly improve the accuracy for predicting poor functional outcomes and may provide additional prognostic information for clinical decision-making in patients with uICH.
Our study had several limitations that should be considered when interpreting its results. First, we did not evaluate the follow-up GCS score in this observational study. Thus, we could not determine follow-up oICH scores to calculate the risk of stabilized hematoma volume. Although we developed the dICH score to simulate a stable hematoma for the prediction of poor outcomes, follow-up oICH scores are important considerations in future research. Second, this was a single-center study with a relatively small sample, which may require large-scale multicenter studies to replicate our results in the future.
Conclusions
The dICH score and the uICH score were useful clinical assessment tools that could be used to discriminate poor outcomes and provide guidance in clinical decision-making concerning patients with acute ICH.
Data Availability Statement
The original contributions presented in the study are included in the article/Supplementary Material, further inquiries can be directed to the corresponding author/s.
Ethics Statement
The studies involving human participants were reviewed and approved by the Ethics Committee of the First Affiliated Hospital of Chongqing Medical University. The patients/participants provided their written informed consent to participate in this study.
Author Contributions
W-SY, QL, and PX were responsible for the study concept and design and had full access to all of the data in the study. W-SY, Y-QS, XW, L-BZ, Q-JL, X-FX, Z-WZ, LD, X-NL, S-QZ, X-HL, QL, and PX did the acquisition, analysis, or interpretation of data. W-SY drafted the manuscript. QL and PX did the critical revision of the manuscript and were responsible for the administrative, technical, or material support. W-SY, Y-QS, and XW did the statistical analysis. QL obtained fundings. All authors contributed to the article and approved the submitted version.
Funding
This study was supported by grants from the National Key R&D Program of China (no. 2018YFC1312200 and no. 2018YFC1312203), the China Association of Science and Technology Young Talent Project (no. 2017QNRC001), and Chongqing High-end Young Investigator Project (no. 2019GDRC005).
Conflict of Interest
The authors declare that the research was conducted in the absence of any commercial or financial relationships that could be construed as a potential conflict of interest.
Supplementary Material
The Supplementary Material for this article can be found online at: https://www.frontiersin.org/articles/10.3389/fneur.2021.655800/full#supplementary-material
References
1. Feigin VL, Lawes CMM, Bennett DA, Barker-Collo SL, Parag V. Worldwide stroke incidence and early case fatality reported in 56 population-based studies: a systematic review. Lancet Neurol. (2009) 8:355–69. doi: 10.1016/S1474-4422(09)70025-0
2. De Oliveira Manoel AL, Goffi A, Zampieri FG, Turkel-Parrella D, Duggal A, Marotta TR, et al. The critical care management of spontaneous intracranial hemorrhage: a contemporary review. Crit Care. (2016) 20:272. doi: 10.1186/s13054-016-1432-0
3. Graeb DA, Robertson WD, Lapointe JS, Nugent RA, Harrison PB. Computed tomographic diagnosis of intraventricular hemorrhage. Etiol Prognosis Radiol. (1982) 143:91–6. doi: 10.1148/radiology.143.1.6977795
4. Broderick JP, Brott TG, Duldner JE, Tomsick T, Huster G. Volume of intracerebral hemorrhage. A powerful and easy-to-use predictor of 30-day mortality. Stroke. (1993) 24:987–93. doi: 10.1161/01.STR.24.7.987
5. Hemphill JC 3rd, Bonovich DC, Besmertis L, Manley GT, Johnston SC. The ICH score: a simple, reliable grading scale for intracerebral hemorrhage. Stroke. (2001) 32:891–7. doi: 10.1161/01.STR.32.4.891
6. Hemphill JC, Farrant M, Neill TA. Prospective validation of the ICH Score for 12-month functional outcome. Neurology. (2009) 73:1088–94. doi: 10.1212/WNL.0b013e3181b8b332
7. Davis SM, Broderick J, Hennerici M, Brun NC, Diringer MN, Mayer SA, et al. Hematoma growth is a determinant of mortality and poor outcome after intracerebral hemorrhage. Neurology. (2006) 66:1175–81. doi: 10.1212/01.wnl.0000208408.98482.99
8. Dowlatshahi D, Demchuk AM, Flaherty ML, Ali M, Lyden PL, Smith EE, et al. Defining hematoma expansion in intracerebral hemorrhage: relationship with patient outcomes. Neurology. (2011) 76:1238–44. doi: 10.1212/WNL.0b013e3182143317
9. Li Q, Li R, Zhao LB, Yang XM, Yang WS, Deng L, et al. Intraventricular hemorrhage growth: definition, prevalence and association with hematoma expansion and prognosis. Neurocrit Care. (2020) 33:732–9. doi: 10.1007/s12028-020-00958-8
10. Yogendrakumar V, Ramsay T, Fergusson D, Demchuk AM, Aviv RI, Rodriguez-Luna D, et al. New and expanding ventricular hemorrhage predicts poor outcome in acute intracerebral hemorrhage. Neurology. (2019) 93:e879–88. doi: 10.1212/WNL.0000000000008007
11. Schneider H, Huynh TJ, Demchuk AM, Dowlatshahi D, Rodriguez-Luna D, Silva Y, et al. Combining spot sign and intracerebral hemorrhage score to estimate functional outcome: analysis from the PREDICT cohort. Stroke. (2018) 49:1511–4. doi: 10.1161/STROKEAHA.118.020679
12. Morotti A, Boulouis G, Dowlatshahi D, Li Q, Barras CD, Delcourt C, et al. Standards for detecting, interpreting, and reporting noncontrast computed tomographic markers of intracerebral hemorrhage expansion. Ann Neurol. (2019) 86:480–92. doi: 10.1002/ana.25563
13. Sporns PB, Schwake M, Kemmling A, Minnerup J, Schwindt W, Niederstadt T, et al. Comparison of spot sign, blend sign and black hole sign for outcome prediction in patients with intracerebral hemorrhage. J Stroke. (2017) 19:333–9. doi: 10.5853/jos.2016.02061
14. Sporns PB, Schwake M, Schmidt R, Kemmling A, Minnerup J, Schwindt W, et al. Computed tomographic blend sign is associated with computed tomographic angiography spot sign and predicts secondary neurological deterioration after intracerebral hemorrhage. Stroke. (2017) 48:131–5. doi: 10.1161/STROKEAHA.116.014068
15. Yu Z, Zheng J, Ma L, Guo R, Li M, Wang X, et al. The predictive accuracy of the black hole sign and the spot sign for hematoma expansion in patients with spontaneous intracerebral hemorrhage. Neurol Sci. (2017) 38:1591–7. doi: 10.1007/s10072-017-3006-6
16. Zimmer S, Meier J, Minnerup J, Wildgruber M, Broocks G, Nawabi J, et al. Prognostic value of non-contrast CT markers and spot sign for outcome prediction in patients with intracerebral hemorrhage under oral anticoagulation. J Clin Med. (2020) 9:41077. doi: 10.3390/jcm9041077
17. Li Q, Zhang G, Huang Y-J, Dong M-X, Lv F-J, Wei X, et al. Blend sign on computed tomography: novel and reliable predictor for early hematoma growth in patients with intracerebral hemorrhage. Stroke. (2015) 46:2119–23. doi: 10.1161/STROKEAHA.115.009185
18. Boulouis G, Morotti A, Brouwers HB, Charidimou A, Jessel MJ, Auriel E, et al. Association between hypodensities detected by computed tomography and hematoma expansion in patients with intracerebral hemorrhage. JAMA Neurol. (2016) 73:961–8. doi: 10.1001/jamaneurol.2016.1218
19. Li Q, Zhang G, Xiong X, Wang X-C, Yang W-S, Li K-W, et al. Black hole sign: novel imaging marker that predicts hematoma growth in patients with intracerebral hemorrhage. Stroke. (2016) 47:1777–81. doi: 10.1161/STROKEAHA.116.013186
20. Li Q, Liu Q-J, Yang W-S, Wang X-C, Zhao L-B, Xiong X, et al. Island sign: an imaging predictor for early hematoma expansion and poor outcome in patients with intracerebral hemorrhage. Stroke. (2017) 48:3019–25. doi: 10.1161/STROKEAHA.117.017985
21. Boulouis G, Morotti A, Brouwers HB, Charidimou A, Jessel MJ, Auriel E, et al. Noncontrast computed tomography hypodensities predict poor outcome in intracerebral hemorrhage patients. Stroke. (2016) 47:2511–6. doi: 10.1161/STROKEAHA.116.014425
22. Qureshi AI, Palesch YY, Barsan WG, Hanley DF, Hsu CY, Martin RL, et al. Intensive blood-pressure lowering in patients with acute cerebral hemorrhage. N Engl J Med. (2016) 375:1033–43. doi: 10.1056/NEJMoa1603460
23. Delong ER, Delong DM, Clarke-Pearson DL. Comparing the areas under two or more correlated receiver operating characteristic curves: a non-parametric approach. Biometrics. (1988) 44:837–45. doi: 10.2307/2531595
24. Schmidt FA, Liotta EM, Prabhakaran S, Naidech AM, Maas MB. Assessment and comparison of the max-ICH score and ICH score by external validation. Neurology. (2018) 91:e939–46. doi: 10.1212/WNL.0000000000006117
25. Kazui S, Naritomi H, Yamamoto H, Sawada T, Yamaguchi T. Enlargement of spontaneous intracerebral hemorrhage. Incidence and time course. Stroke. (1996) 27:1783–7. doi: 10.1161/01.STR.27.10.1783
26. Brouwers HB, Falcone GJ, Mcnamara KA, Ayres AM, Oleinik A, Schwab K, et al. CTA spot sign predicts hematoma expansion in patients with delayed presentation after intracerebral hemorrhage. Neurocrit Care. (2012) 17:421–8. doi: 10.1007/s12028-012-9765-2
27. Fan JS, Huang HH, Chen YC, Yen DH, Kao WF, Huang MS, et al. Emergency department neurologic deterioration in patients with spontaneous intracerebral hemorrhage: incidence, predictors, and prognostic significance. Acad Emerg Med. (2012) 19:133–8. doi: 10.1111/j.1553-2712.2011.01285.x
28. Maas MB, Nemeth AJ, Rosenberg NF, Kosteva AR, Prabhakaran S, Naidech AM. Delayed intraventricular hemorrhage is common and worsens outcomes in intracerebral hemorrhage. Neurology. (2013) 80:1295–9. doi: 10.1212/WNL.0b013e31828ab2a7
29. Moullaali TJ, Sato S, Wang X, Rabinstein AA, Arima H, Carcel C, et al. Prognostic significance of delayed intraventricular haemorrhage in the INTERACT studies. J Neurol Neurosurg Psychiatry. (2017) 88:19–24. doi: 10.1136/jnnp-2015-311562
30. Dowlatshahi D, Deshpande A, Aviv RI, Rodriguez-Luna D, Molina CA, Blas YS, et al. Do intracerebral hemorrhage nonexpanders actually expand into the ventricular space? Stroke. (2018) 49:201–3. doi: 10.1161/STROKEAHA.117.018716
31. Sembill JA, Gerner ST, Volbers B, Bobinger T, Lucking H, Kloska SP, et al. Severity assessment in maximally treated ICH patients: the max-ICH score. Neurology. (2017) 89:423–31. doi: 10.1212/WNL.0000000000004174
32. Lun R, Yogendrakumar V, Demchuk AM, Aviv RI, Rodriguez-Luna D, Molina CA, et al. Calculation of prognostic scores, using delayed imaging, outperforms baseline assessments in acute intracerebral hemorrhage. Stroke. (2020) 51:1107–10. doi: 10.1161/STROKEAHA.119.027119
33. Li Q, Warren AD, Qureshi AI, Morotti A, Falcone GJ, Sheth KN, et al. Ultra-early blood pressure reduction attenuates hematoma growth and improves outcome in intracerebral hemorrhage. Ann Neurol. (2020) 88:388–95. doi: 10.1002/ana.25793
34. Huynh TJ, Demchuk AM, Dowlatshahi D, Gladstone DJ, Krischek O, Kiss A, et al. Spot sign number is the most important spot sign characteristic for predicting hematoma expansion using first-pass computed tomography angiography: analysis from the PREDICT study. Stroke. (2013) 44:972–7. doi: 10.1161/STROKEAHA.111.000410
35. Huynh TJ, Aviv RI, Dowlatshahi D, Gladstone DJ, Laupacis A, Kiss A, et al. Validation of the 9-point and 24-point hematoma expansion prediction scores and derivation of the PREDICT A/B scores. Stroke. (2015) 46:3105–10. doi: 10.1161/STROKEAHA.115.009893
36. Li Q, Yang WS, Wang XC, Cao D, Zhu D, Lv FJ, et al. Blend sign predicts poor outcome in patients with intracerebral hemorrhage. PLoS ONE. (2017) 12:e0183082. doi: 10.1371/journal.pone.0183082
37. Morotti A, Boulouis G, Romero JM, Brouwers HB, Jessel MJ, Vashkevich A, et al. Blood pressure reduction and non-contrast CT markers of intracerebral hemorrhage expansion. Neurology. (2017) 89:548–54. doi: 10.1212/WNL.0000000000004210
38. Li Q, Yang WS, Chen SL, Lv FR, Lv FJ, Hu X, et al. Black hole sign predicts poor outcome in patients with intracerebral hemorrhage. Cerebrovasc Dis. (2018) 45:48–53. doi: 10.1159/000486163
39. Law ZK, Ali A, Krishnan K, Bischoff A, Appleton JP, Scutt P, et al. Non-contrast computed tomography signs as predictors of hematoma expansion, clinical outcome, and response to tranexamic acid in acute intracerebral hemorrhage. Stroke. (2020) 51:121–8. doi: 10.1161/STROKEAHA.119.026128
Keywords: intracerebral hemorrhage, ICH score, hematoma expansion, outcome, NCCT marker, computed tomography
Citation: Yang W-S, Shen Y-Q, Wei X, Zhao L-B, Liu Q-J, Xie X-F, Zhang Z-W, Deng L, Lv X-N, Zhang S-Q, Li X-H, Li Q and Xie P (2021) New Prediction Models of Functional Outcome in Acute Intracerebral Hemorrhage: The dICH Score and uICH Score. Front. Neurol. 12:655800. doi: 10.3389/fneur.2021.655800
Received: 23 January 2021; Accepted: 19 March 2021;
Published: 05 May 2021.
Edited by:
David J. Seiffge, University Hospital Bern, SwitzerlandReviewed by:
Wendy Ziai, The Johns Hopkins Hospital, United StatesCandice Delcourt, University of New South Wales, Australia
Copyright © 2021 Yang, Shen, Wei, Zhao, Liu, Xie, Zhang, Deng, Lv, Zhang, Li, Li and Xie. This is an open-access article distributed under the terms of the Creative Commons Attribution License (CC BY). The use, distribution or reproduction in other forums is permitted, provided the original author(s) and the copyright owner(s) are credited and that the original publication in this journal is cited, in accordance with accepted academic practice. No use, distribution or reproduction is permitted which does not comply with these terms.
*Correspondence: Qi Li, cWlsaV9tZEAxMjYuY29t; Peng Xie, cGVuZ194aWVAeWFob28uY29t
†These authors have contributed equally to this work