 René Labounek
- 1Division of Clinical Behavioral Neuroscience, Department of Pediatrics, University of Minnesota, Minneapolis, MN, United States
- 2Department of Biomedical Engineering, University of Minnesota, Minneapolis, MN, United States
- 3Mind Research Network, Albuquerque, NM, United States
- 4Central European Institute of Technology, Masaryk University, Brno, Czechia
- 5Department of Biomedical Engineering, Brno University of Technology, Brno, Czechia
- 6Center for Magnetic Resonance Research, Department of Radiology, University of Minnesota, Minneapolis, MN, United States
Various disease conditions can alter EEG event-related responses and fMRI-BOLD signals. We hypothesized that event-related responses and their clinical alterations are imprinted in the EEG spectral domain as event-related (spatio)spectral patterns (ERSPat). We tested four EEG-fMRI fusion models utilizing EEG power spectra fluctuations (i.e., absolute spectral model - ASM; relative spectral model - RSM; absolute spatiospectral model - ASSM; and relative spatiospectral model - RSSM) for fully automated and blind visualization of task-related neural networks. Two (spatio)spectral patterns (high δ4 band and low β1 band) demonstrated significant negative linear relationship (pFWE < 0.05) to the frequent stimulus and three patterns (two low δ2 and δ3 bands, and narrow θ1 band) demonstrated significant positive relationship (p < 0.05) to the target stimulus. These patterns were identified as ERSPats. EEG-fMRI F-map of each δ4 model showed strong engagement of insula, cuneus, precuneus, basal ganglia, sensory-motor, motor and dorsal part of fronto-parietal control (FPCN) networks with fast HRF peak and noticeable trough. ASM and RSSM emphasized spatial statistics, and the relative power amplified the relationship to the frequent stimulus. For the δ4 model, we detected a reduced HRF peak amplitude and a magnified HRF trough amplitude in the frontal part of the FPCN, default mode network (DMN) and in the frontal white matter. The frequent-related β1 patterns visualized less significant and distinct suprathreshold spatial associations. Each θ1 model showed strong involvement of lateralized left-sided sensory-motor and motor networks with simultaneous basal ganglia co-activations and reduced HRF peak and amplified HRF trough in the frontal part of the FPCN and DMN. The ASM θ1 model preserved target-related EEG-fMRI associations in the dorsal part of the FPCN. For δ4, β1, and θ1 bands, all models provided high local F-statistics in expected regions. The most robust EEG-fMRI associations were observed for ASM and RSSM.
Introduction
Ives et al. and Huang-Hellinger et al. optimized initial simultaneous EEG-fMRI data acquisition (1, 2) and Allen et al. and Goldman et al. implemented first algorithms suppressing gradient MR artifacts induced in the simultaneous EEG recordings (3, 4). The development of various multimodal data fusion strategies has taken off driven by the motivation to gain the most information from EEG high temporal resolution and fMRI high spatial resolution. The first published data fusion approach cross-correlated EEG α band power fluctuations with the fMRI-BOLD signals of the resting-state paradigm (5, 6), followed by the general linear model (GLM) implementation (7, 8). The GLM became a prominent method frequently applied in the field and not only for the EEG spectra integration with resting-state (9–14) or task induced (15–20) datasets. GLMs inducing event-related potential (ERP) amplitudes or timings (21, 22), and spike-informed GLMs (23–25) have been proposed and optimized.
The voxelwise GLM results self-organize into large scale brain network (LSBN) structures (19). Concurrent fusion strategy often rotates fMRI data into space of linearly mixtured spatially independent components, i.e., the LSBNs, with their representative clusterwise induced BOLD fluctuations, which are compared to various EEG dynamics (26–31). In parallel, regression or correlation approaches inferring EEG and fMRI dynamics, joint independent component analysis (32), graph build approach (33), dynamic functional connectivity (34), or multimodal dynamic causal modeling (35) have been proposed to fuse EEG-fMRI data with various result interpretations. Many regression or deconvolution approaches reported that EEG-fMRI hemodynamic response function (HRF) demonstrates varying timings and shapes (10, 19, 20, 36–42). In physiologic situations, the BOLD signal is delayed to EEG events but an extreme example is the epileptic spike EEG-fMRI where BOLD signal peaks can precede the EEG spikes (41, 42). Thus, it is a preferable approach to model variable HRF than to use fixed canonical HRF, which has still been dominating in the common practice (5–9, 11–18, 21–26, 28–33, 43).
Over various existing EEG-fMRI data fusion techniques, the ability to blindly and automatically visualize and quantify robust task-related functional networks and their EEG-fMRI associations (e.g., via variable HRF) is lacking. We have focused on the simple GLM fusion approach with variable HRF aggregating automatically induced EEG spectra (19, 20) and tested whether we can identify fusion settings that blindly visualizes task-related networks. This automated method may offer high reproducibility with tremendous potential in the clinical research or even clinical practice applications to quantitatively measure cognitive dysfunction.
Cognitive dysfunction may occur in various neurologic and psychiatric conditions including epilepsy and can be estimated from EEG, e.g., by measuring cognitive event-related responses such as P300 potential. The P300 response is time-locked to an event and is elicited by a task/event when a tested individual is requested to respond to a single stimulus or a set of stimuli as in the oddball paradigm. The P300 has been increasingly investigated as a marker of cognitive processing. Specifically, the P300 response represents a neural signature of the processing of stimulus context depending on the attention and state of arousal leading to an appropriate response (44). Although the P300 has been almost exclusively assessed in the temporal domain via ERPs (45, 46), the characterization in the frequency/spectral domain, since time and frequency are fully complementary domains, may provide additional insight into the data. Spectral (Equation 1) (16, 17, 43, 47) and spatiospectral (Equation 2) (19, 43) models have already been proposed for the blind visualization of task-related networks from simultaneous EEG-fMRI data. The 1st model (Equation 1) assumes that local fMRI BOLD signal fluctuations (b) are proportional to fluctuations of the frequency-specific (ω) weighted EEG absolute/relative power spectra (p) with modeled between-signal delay via HRF convolution kernel (h). The weighting function g(ω) can be considered a frequency specific filter modulating the power spectra and final power fluctuations are often estimated as an average over channels (16, 17, 43, 47). The 2nd model (Equation 2) is similar but considers the filtering property to be channel (c) specific. The identification of a robust task-related weighting function g(ω) or g(c,ω), i.e., event-related (spatio)spectral patterns (ERSPat) in EEG spectra, remains a not fully optimized challenge in the fusion process.
The EEG absolute/relative power spectra consist of a linear mixture of stable spatiospectral patterns [i.e., different stable g(c,ω) functions in Equation (2)] with temporal fluctuations that were more task-related for the relative power rather than the absolute power (48, 49). Absolute EEG power identified 14 stable patterns with highly significant EEG-fMRI associations at visual oddball dataset (19, 48). Relative EEG power identified 10 stable patterns similar to the absolute power patterns and two other relative power specific stable patterns, for which the EEG-fMRI relationships have not been investigated yet (49).
Several studies utilized the spectral model for the visualization of task-related neuronal networks from EEG-fMRI data (15–18) or the spatiospectral model (19, 43) with few mutual discrepancies: (i) the response function was fixed or variable; (ii) different tasks were used. Therefore, a direct and fair comparison between models still needs to be investigated.
Within the current study, we are presenting the full comparison between absolute/relative power based spectral (Equation 1) and spatiospectral (Equation 2) models for fully automatic EEG-fMRI fusion. The goal is to optimize the automatic visualization and quantification of task-related neuronal networks. The robustness over models was objectively assessed.
Materials and Methods
Experimental Design
The identical simultaneous EEG-fMRI dataset of visual oddball paradigm was used as previously described (18, 19, 48, 49). The event-related designed visual oddball task was performed by 21 healthy subjects (13 right-handed men, one left-handed man, seven right-handed women; age 23 ± 2 years). Three stimulus types were presented randomly to each subject. Each stimulus consisted of a single yellow uppercase letter shown for 500 ms on a black background. Inter-stimulus intervals were either 4, 5, or 6 s (drawn uniformly and randomly). A total of 336 stimuli (divided into four consequential sessions) were presented, consisting of targets (letter X, 15%), frequents (letter O, 70%), and distractors (letters other than X and O, 15%). Subjects were instructed to press a button on the box held in their right hand whenever the target stimulus appeared and not to respond to distractor or frequent stimuli.
This study was approved by and carried out in accordance with the recommendations of the Masaryk University Ethics committee guidelines and all subjects signed the approved written informed consent in accordance with the Declaration of Helsinki.
Simultaneous EEG-fMRI Data Acquisition
The scalp EEG data, with reference between Cz and Fz electrodes, were acquired with an MR compatible 32-channel 10/20 EEG system (BrainProducts, Germany) and a sampling frequency of 5 kHz. Two channels were used for ECG and EOG. Via the BrainVision Recorder system (BrainProducts, Germany), the EEG data were synchronized and acquired simultaneously with fMRI data during gradient echo imaging sequences [1.5 T Siemens Symphony scanner equipped with Numaris 4 System (Mrease)]. Gradient echo, echo-planar functional imaging sequence was acquired with following parameter setting: TR = 1,660 ms; TE = 45 ms; FOV = 250 × 250 mm; FA = 80°; matrix size = 64 × 64 (3.9 × 3.9 mm); slice thickness = 6 mm; 15 transverse slices covering the whole brain except the inferior part of the cerebellum. The task was divided into four equal runs of 256 scans and 84 stimuli.
Following simultaneous EEG-fMRI acquisition, high-resolution anatomical T1-weighted images were acquired using an MPRAGE sequence with 160 sagittal slices, matrix size 256 × 256 resampled to 512 × 512; TR = 1,700 ms; TE = 3.96 ms; FOV = 246 mm; FA = 15°; and slice thickness = 1.17 mm.
EEG Data Preprocessing
The EEG data were preprocessed as described in (19, 48) using BrainVision Analyzer 2.02 (BrainProducts, Germany) with the implemented manufacturer's pipeline. Gradient artifacts were removed using average artifact subtraction (used sliding window with window length=21*TR) at the acquisition sampling rate 5 kHz (3) and filtered with a Butterworth zero phase 1–40 Hz band-pass filter. Then, EEG signals were resampled to 250 Hz (antialiasing filter included). Ballistocardiogram (BCG) artifacts were removed by average artifact subtraction (used sliding window with window length = 21*BCG epochs) waveform from each channel (50) and signals were re-referenced to the average. Eye-blinking artifacts were removed by conducting a temporal ICA decomposition and removing eye-blink artifacts from the back-reconstructed time course.
EEG Spatiospectral Decomposition
The decomposition was the same as implemented and previously described (48, 49). The preprocessed EEG signal from each lead and session was normalized to 0 mean and variance 1, and divided into 1.66 s (repetition time of fMRI scanning TR) epochs without overlap. Each epoch was transformed to a spectral domain with the fast Fourier transform (FFT), generating a vector (length = 67) of complex valued spectral coefficients between 0 and 40 Hz. Complex values were converted to absolute power by taking the absolute value and squaring, or converted to relative power value by dividing the squared value by the power of the whole epoch. The output vector of 67 real absolute/relative power values comprised a 3D matrix E with dimensions nt, nc, and nω. The dimension nt represents the number of spatiospectral epochs (nt = 256), the dimension nc is the total number of leads (nc = 30), the dimension nω is the total number of spectral coefficients (nω = 67). The EEG spatiospectral decomposition (Equation 3) decomposes the matrix of spatiospectral maps E into a source matrix S of dimensions S(m,n*cnω) containing independent spatiospectral patterns and a mixing matrix W of dimensions W(nt,m) containing the patterns' dynamics. Dimension m is the number of decomposed independent spatiospectral components (m = 20).
Using the GIFT toolbox (http://mialab.mrn.org/software/gift/) (51), the matrix E was dimensionally reduced using PCA (single-subject reduction to 50 principle components and group-based reduction to 20 components), followed by INFOMAX group-ICA (52) with 10 ICASSO runs (53).
Only spatiospectral patterns, which were reported to be stable and observed in both absolute/relative power spectra (48, 49), i.e., 10 patterns, have been selected from output source matrices S of separate group-ICA runs for absolute/relative powers.
Individual subject's time courses were generated by PCA based back-reconstruction (i.e., the individual partition of the PCA reducing matrix is matrix multiplied by the individual partition of the aggregate reducing matrix) (51) of the group spatiospectral patterns on the individual subject spatiospectral maps and time-courses.
Selection of Stable EEG Spatiospectral Patterns With Relationship to the Task
For each subject and session, we have one matrix W with dimensions W (nt, 20) containing the back-reconstructed time course of each spatiospectral component. Let a matrix U of dimensions U (4*nt,10) to be a single-subject matrix of fluctuations of stable spatiospectral patterns over all four sessions. Relationships between these dynamics and stimulus vector timings (in matrix X) were assessed with a single-subject general linear model (Equation 4, GLM) (54) solved with the least mean square algorithm (Equation 5) and a continuous group one-sample t-test for the k-th stimulus vector (Equation 6) (48). Variable c is the vector of binary positive contrast at the stimulus vector of interest, the brackets < > characterize the expectation over subjects, variable σ is the standard deviation and variable s is the total number of subjects. Model matrix X contained frequent, target and distractor timings in 12 separate binary vectors for each stimulus and session and four vectors for the DC component in each session.
These spatiospectral patterns, where any |t|-value was higher than 3.25 (critical value at pFWE < 0.05 for 10 multiple comparisons, i.e., 10 selected stable patterns, and 16 degrees of freedom, i.e., 16 variables in model matrix X) for any stimulus type in absolute or relative power, were considered as a pattern with task-related EEG power fluctuations. Second selection criteria was to demonstrate mean |t|-value averaged over all spatiospectral/spectral models with p < 0.05 (~|t| > 2.0) with relatively small standard deviation in the averaged |t|-value over models, i.e., STD|t| < 0.5.
Task-Related EEG Spectral Patterns
All 10 stable spatiospectral patterns observed in both power types were averaged over leads and provided 10 spectral filters g(ω) (Equation 1). The filters were used for filtering of power spectra of matrix E reshaped at dimensions E(nt, nc, nω). Separate for each filter, time point and channel, the absolute/relative power value p(t,c) was filtered as Equation 7. Time-course p(t) of each channel c was normalized to mean 0 and variance 1, and final absolute/relative power fluctuation ̄p(t) was estimated as an average over channels for each specific spectral pattern.
Task-related spectral patterns were evaluated and identified with the same methodology as described in sub-chapter Selection of Stable EEG Spatiospectral Patterns With Relationship to the Task, but matrix U (Equations 4, 5) consisted of 10 pattern-specific averaged ̄p(t) fluctuations.
fMRI Data Preprocessing
The fMRI data were preprocessed with SPM8 (Wellcome Trust Center for Neuroimaging, London, UK) software library. Motion artifacts were minimized by alignment of all functional scans, followed by co-registration with the subject's anatomical image and normalization into standardized MNI space (Montreal Neurological Institute template) (55). Functional scans were spatially smoothed with an isotropic 3D Gaussian filter (FWHM = 8 mm) to increase the signal to noise ratio (SNR) and to make the random errors more normally distributed. Periods longer than 128 s were linearly detrended to remove slow drifts and physiological noise.
EEG-fMRI General Linear Modeling With Variable HRFs
Relationships between fMRI voxel time-courses (Y) and EEG task-related spectral/spatiospectral pattern time-courses were examined using the individual GLMs (Equation 8) (54) with the EEG time course convolved with the canonical HRF (x1), convolved with the 1st temporal derivative of the HRF (x2) or convolved with the 2nd temporal derivative of the HRF (x3) (19, 20). In addition to the three EEG regressors x1-x3, the model matrix X contained a DC component. Regression matrices β were estimated over all GLMs with the ReML algorithm (Restricted Maximum Likelihood) implemented in SPM12 software (Wellcome Trust Center for Neuroimaging, London, UK) in the MATLAB programing environment (MathWorks, Natick, USA).
Group-averaged EEG-fMRI results were estimated with a one-way ANOVA test (implemented in SPM12) of three EEG-derived single-subject spatial β-maps for each of three EEG regressors. The β weights served as dependent variables in separate ANOVA tests conducted for each spectral/spatiospectral pattern, generating group-averaged spatial EEG-fMRI F-maps. The final F-maps were thresholded for objective evaluations at p < 0.001 uncorrected for multiple statistical tests (i.e., with a critical absolute F-value of 5.7), and the criteria that clusters contain 100 voxels or more. For visualizations, the F-maps were thresholded at p < 0.0001 (i.e., F > 8.1) due to high result robustness.
Group-averaged EEG-fMRI HRFs (hi) in each voxel i were estimated from group-averaged regression coefficients β (estimated within Equation 8) with Equation 9 where r is the canonical HRF and numbers 1–3 are indexes of regressors x1-x3 (19, 56).
Assessment of EEG-fMRI Results
Group-averaged EEG-fMRI F-maps and HRFs were visually inspected for a subjective similarity/dissimilarity evaluation over the similar spectral/spatiospectral patterns. For the objective assessment, volume, mean F-value, median F-value, and maximal F-value were automatically extracted from the suprathreshold voxels (p < 0.001) of the final group-averaged EEG-fMRI F-maps of every stable task-related spectral/spatiospectral pattern. The spectral/spatiospectral model with the highest objective metrics was considered as the most successful one in blind visualization of a task-related neural network.
Results
Task-Related EEG Spectral/Spatiospectral Patterns
Significant negative linear relationship between EEG fluctuations and frequent stimulus was observed in two spectral/spatiospectral patterns (i.e., δ4 with inter-model t-value −3.64 ± 1.00, β1 with t-value −3.35 ± 0.17, Table 1, Figure 1A, pFWE < 0.05). The negative linear relationship can be interpreted as the EEG pattern power decrease during the frequent stimulus onset. Other three patterns (i.e., δ2 with t-value 2.46 ± 0.43, δ3 with t-value 2.34 ± 0.11, θ1 with t-value 2.05 ± 0.33) demonstrated a significant positive linear relationship between the EEG power fluctuations and target stimulus (Table 1, Figure 1B, p < 0.05 and STD|t| < 0.5). The positive linear relationship can be interpreted as the EEG pattern power increase during the target stimulus onset. The δ4 pattern fluctuations with t-value −2.39 ± 0.62 may also be sensitive to distractor stimulus with similar negative linear relationship (Table 1, Figure 1A, p < 0.05) as observed for the frequent stimulus. Lower robustness of relationships between EEG patterns and target or distractor stimuli might be caused by lower stimulus amounts. Five of 10 analyzed stable EEG patterns demonstrated potentially significant relationship to stimuli vectors of the visual oddball task (Table 1, Figure 1).

Table 1. Group t-values of linear relationship between stable EEG pattern fluctuations and stimuli vectors.
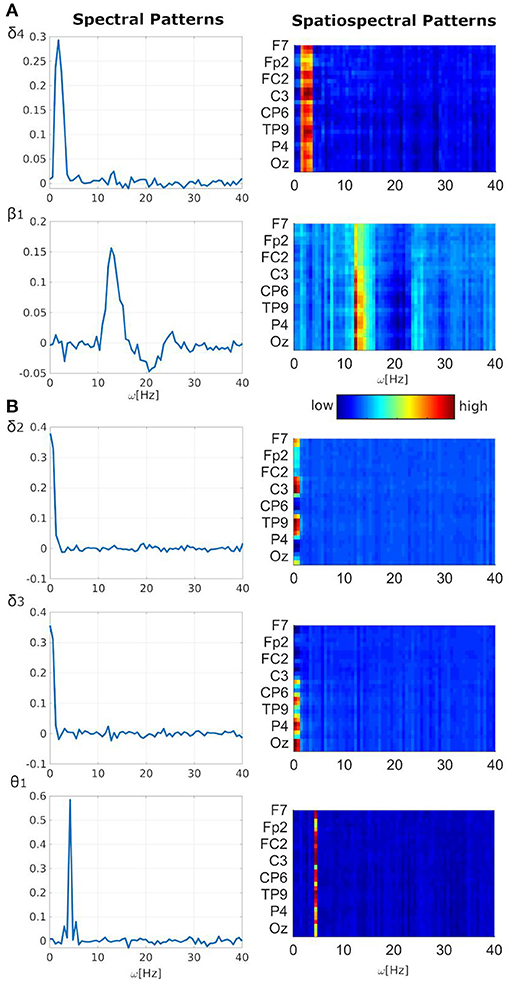
Figure 1. Task-related EEG spectral or spatiospectral patterns. (A) Frequent related; (B) target related. Pattern shortcuts and indexes (e.g., δ4) are the same as used in (19) for consistency purposes. All spectral patterns are averages over electrodes of both absolute or relative spatiospectral patterns. Patterns' amplitudes (i.e., y-axis for spectral patterns and color-coding for spatiospectral patterns) are in arbitrary units. For spatiospectral patterns, the dark blue color is an approximate minimum value in the y-axis of the corresponding spectral pattern. The dark red color is an approximate maximum value in the y-axis of the corresponding spectral pattern.
Frequent-Related EEG-fMRI Networks
As the δ4 pattern demonstrated the highest level of relationship between pattern fluctuations and frequent stimulus, the EEG-fMRI F-maps also visualized the highest F-values and largest amounts of supra-threshold voxels over all four investigated EEG patterns (Table 2, Figure 2). The absolute spectral model (ASM) provided the largest and the most significant EEG-fMRI associations in comparison to other models (Table 2). Still, statistical measures are very high and robust in all investigated models for the δ4 pattern (Table 2).
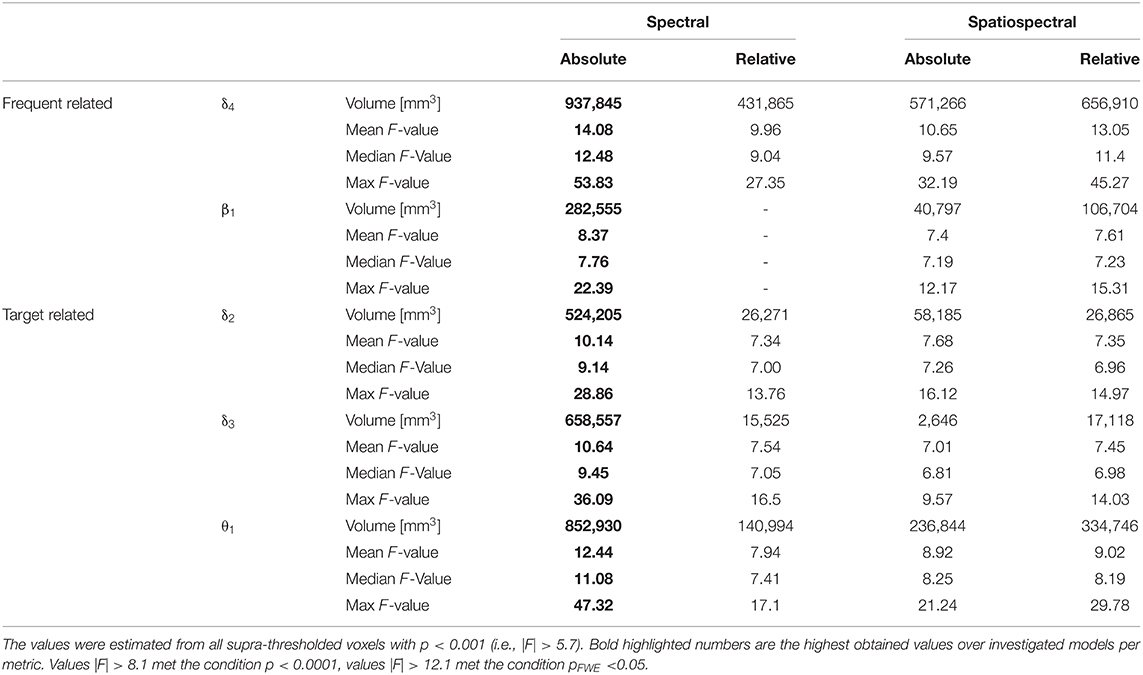
Table 2. Spatial statistics of task-related EEG-fMRI F-maps.
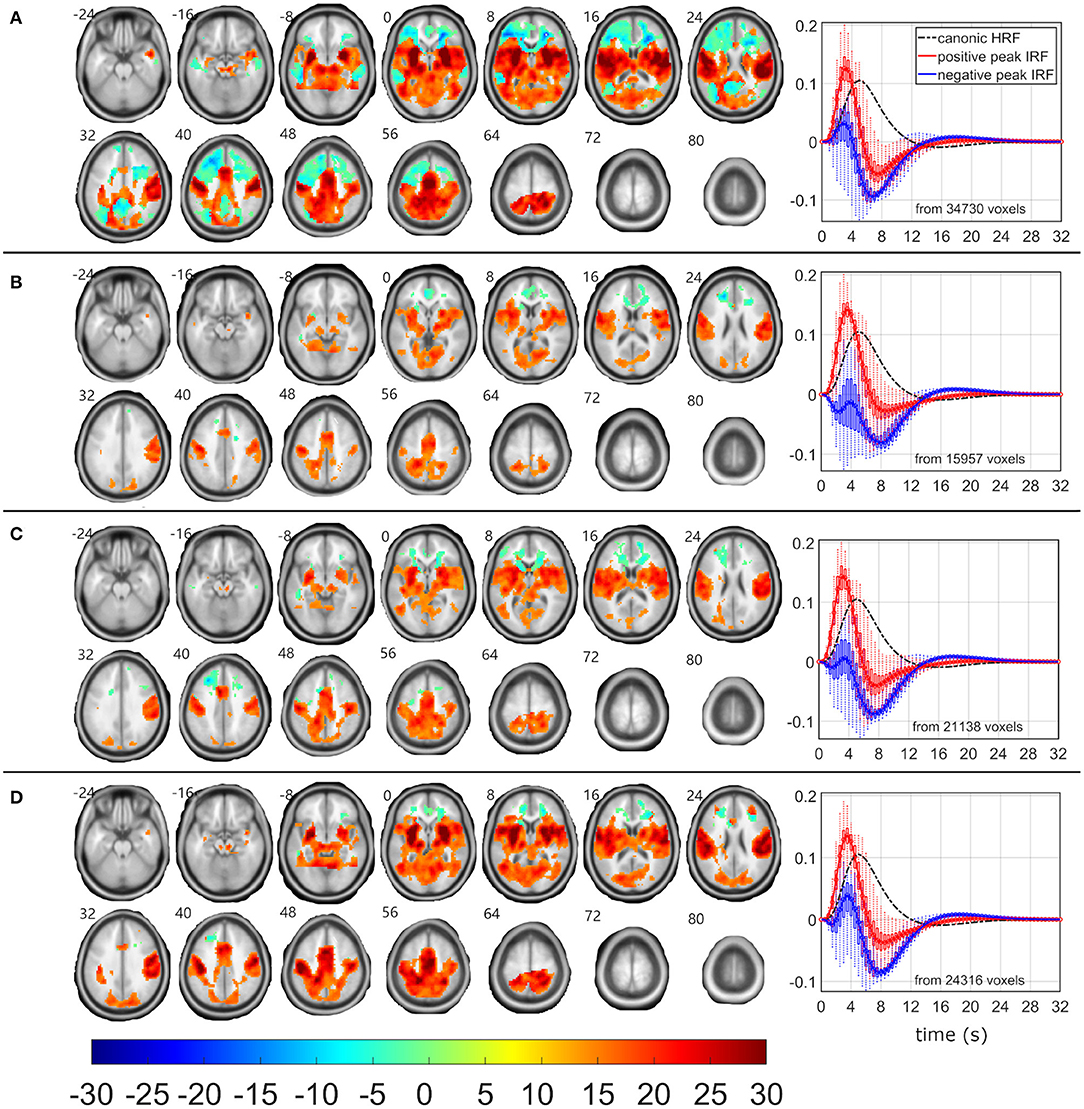
Figure 2. EEG-fMRI F-maps and estimated hemodynamic response functions for all investigated models of the δ4 pattern. The EEG-fMRI F-map colorbar is the same over all models. HRF, hemodynamic response function; IRF, impulse response function. If HRF demonstrated a reduced peak and an amplified trough (i.e., blue color-coded HRFs) the F-values were assigned with a negative sign. The F-maps were threholded with p < 0.0001, i.e., |F| > 8.1. The voxels with |F| > 12.1 met the condition pFWE < 0.05. The red color coded HRFs were derived from voxels with positive signed suprathreshold F-values. All F-maps are shown following the neurological convention, i.e., left hemisphere on the left side of the axial slice. (A) Absolute spectral. (B) Relative spectral. (C) Absolute spatiospectral. (D) Relative spatiospectral.
Positive δ4 pattern demonstrated significant (pFWE < 0.05) bilateral EEG-fMRI associations in cuneus, precuneus, insula, basal ganglia, and in sensory-motor network, somatosensory network and dorsal parts of the fonto-parietal control network (FPCN) (57–60) (Figure 2). Putamen, pallidum, thalamus, and brainstem were involved within subcortical gray matter structures (Figure 2). The dorsal parts of the FPCN overlap with the dorsal attention network (DAN) (57) and may be no discernable one from the other in a lower spatial resolution (Figure 2). Spatial distribution in Figure 2B represents the same result, which was presented in (19) with absolute spatiospectral model (ASSM) and variable HRF modeling. Here, we proposed that the ASM with variable HRF modeling or relative spatiospectral model (RSSM) with variable HRF modeling increased the statistical power and the robustness (Table 2, Figure 2). All models demonstrated a positive HRF peak faster than a peak timing of widely used canonical HRF (Figure 2) and noticeable HRF trough (Figure 2) in the insula, sensory-motor network, somatosensory network, dorsal part of the FPCN and basal ganglia. Except this expected response (i.e., red HRFs in Figure 2), every model detected brain areas with reduced HRF peak followed by larger HRF trough amplitude (i.e., the blue HRFs in Figure 2). Trough peaks in both detected HRFs were again faster than an expected trough timing for the canonical HRF (Figure 2). The HRF with a reduced peak and an amplified trough was observed in areas of superior frontal cortex and parietal cortex (Figure 2A), which might belong to the frontal parts of the FPCN (57–60) or default mode network (DMN) (57). Inferiorly, we noticed significant (pFWE < 0.05) bilateral cluster spots in frontal white matter areas (Figure 2A) where forceps minor, anterior thalamic radiation and inferior fronto-occipital fasciculus might pass [evaluated by a visual inspection of EEG-fMRI F-maps overlaid with the JHU white-matter atlas (61–63) in the MNI space].
As the β1 pattern demonstrated similar negative linear relationship between its power fluctuation and the frequent stimulus (Table 1), the EEG-fMRI F-maps demonstrated similar locations of association spots (Figure 3) where maximal |F| values were observed in the δ4 EEG-fMRI F-maps (Figure 2), and similar HRF properties (Figure 3). The β1 EEG-fMRI F-maps demonstrated a lower statistical robustness for all models (Figure 3, Table 2) when compared to the δ4 F-map robustness (Figure 2, Table 2). Again, the ASM provided the most robust statistics at the inter-model comparison level (Table 2). The relative spectral model (RSM) did not demonstrate any significant EEG-fMRI associations, which is analogical to the previous observation of no relative β associations with the fixed canonical HRF at the same dataset (18). Again, the RSSM was more robust than the ASSM (Table 2). Overall, the lower robustness, the β1 EEG-fMRI associations might appear more spatially specific. As interpreted from the ASM EEG-fMRI β1 F-map (Figure 3). From the basal ganglia, the bilateral putamen demonstrated EEG-fMRI associations with normal HRF peak. From the sensory-motor network, bilateral EEG-fMRI associations with normal HRF peak were observed in primary sensoric, premotor, somatosensory cortices, supramarginal gyrus, left lateralized Brodmann area 7 (BA7), and premotor BA6. The reduced HRF peak properties were observed for lateralized BA9, BA10, BA46, and right hand primary motor cortex. The RSSM emphasized somatosensory BA6 associations compared to the ASM results (Figure 3). In regards to the mentioned spatial specificity, it is important to note that one can get similar spatial distribution for the δ4 EEG-fMRI F-map if stricter threshold than p < 0.0001 is set in the Figure 2 visualization where local spatial statistics exceeded the β1 pattern results (Table 2).
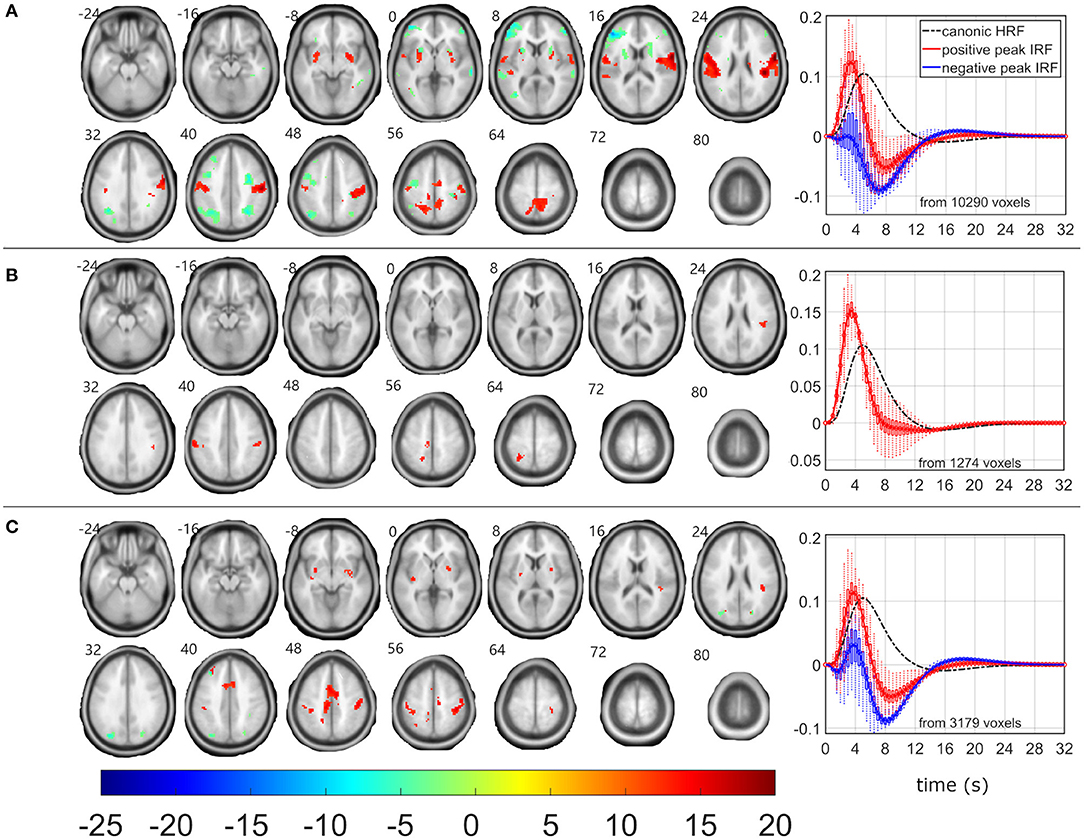
Figure 3. EEG-fMRI F-maps and estimated hemodynamic response functions for all investigated models of the β1 pattern. The EEG-fMRI F-map colorbar is the same over all models. HRF, hemodynamic response function; IRF, impulse response function. If HRF demonstrated a reduced peak and an amplified trough (i.e., blue color-coded HRFs) the F-values were assigned with a negative sign. The F-maps were threholded with p < 0.0001, i.e., |F| > 8.1. The voxels with |F| > 12.1 met the condition pFWE < 0.05. The red color coded HRFs were derived from voxels with positive signed suprathreshold F-values. All F-maps are shown following the neurological convention, i.e., left hemisphere on the left side of the axial slice. (A) Absolute spectral. (B) Relative spectral. (C) Absolute spatiospectral. (D) Relative spatiospectral.
Target-Related EEG-fMRI Neworks
Although δ2, δ3, and θ1 patterns demonstrated all the positive relationship (p < 0.05 and STD|t| < 0.5) between EEG pattern fluctuations and target stimulus, the EEG-fMRI data fusion visualized the largest and most robust F-maps for the θ1 pattern over all investigated models (Table 2, Figure 4). The most robust statistics was yielded by ASM, followed by RSSM, ASSM, and RSM (Table 2). All models emphasized left lateralized EEG-fMRI associations in the sensory-motor network (corresponding to the push on the right hand held button box and the target push button response) with smaller amounts of the basal ganglia associations, which were somewhat preserved for the ASM and partly for the RSSM (Figure 4). The ASM preserved significant EEG-fMRI associations in the dorsal parts of the FPCN overlapping with DAN (Figure 4). These EEG-fMRI associations presented a non-reduced HRF peak and a noticeable HRF trough again with timing faster than classic canonical HRF (Figure 4). The ASM still visualized a significant (pFWE < 0.05) reduced HRF peak and an amplified HRF trough in areas of the frontal parts of the FPCN, DMN and superior frontal white matter but in smaller amounts than observed for the frequent-related δ4 pattern (Figures 2, 4). The RSM, ASSM, and RSSM revealed a comparably smaller amount of significant clusters in locations as ASM (Figure 4).
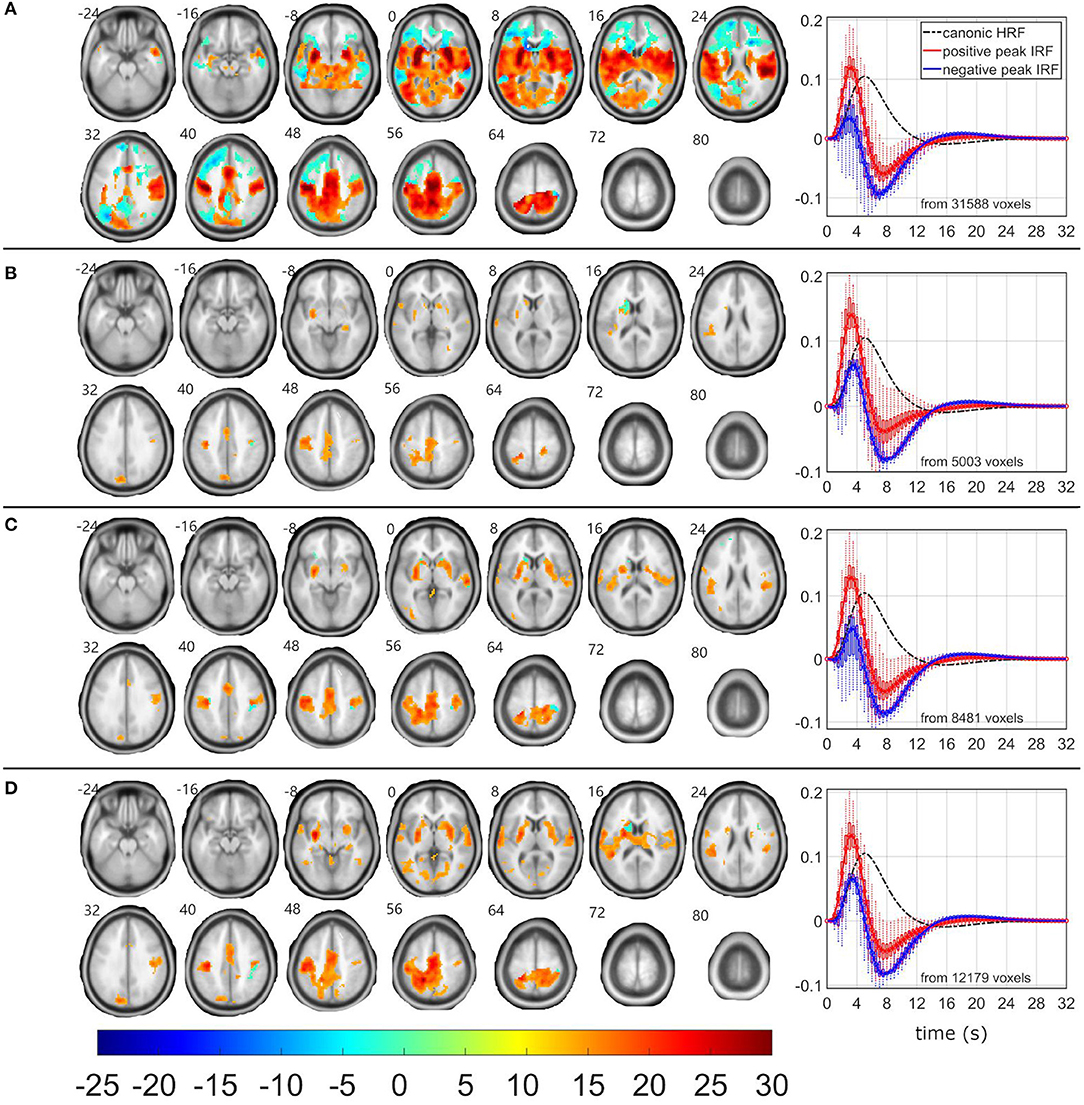
Figure 4. EEG-fMRI F-maps and estimated hemodynamic response functions for all investigated models of the θ1 pattern. The EEG-fMRI F-map colorbar is the same over all models. HRF, hemodynamic response function; IRF, impulse response function. If HRF demonstrated a reduced peak and an amplified trough (i.e., blue color-coded HRFs) the F-values were assigned with a negative sign. The F-maps were thresholded with p < 0.0001, i.e., |F| > 8.1. The voxels with |F| > 12.1 met the condition pFWE < 0.05. The red color coded HRFs were derived from voxels with positive signed suprathreshold F-values. All F-maps are shown following the neurological convention, i.e., left hemisphere on the left side of the axial slice. (A) Absolute spectral. (B) Relative spectral. (C) Absolute spatiospectral. (D) Relative spatiospectral.
The RSM, ASSM and RSSM did not demonstrate almost any significant EEG-fMRI associations for δ2 and δ3 patterns (Figures 5, 6, Table 2). The ASM for δ2 and δ3 patterns showed similar spatial and HRF observation as for the θ1 ASM (Figures 4A, 5A, 6A). The similarity in EEG-fMRI results between δ2 and δ3 ASMs was expected as both use almost the same spectral filtering properties over all leads (Figure 1).
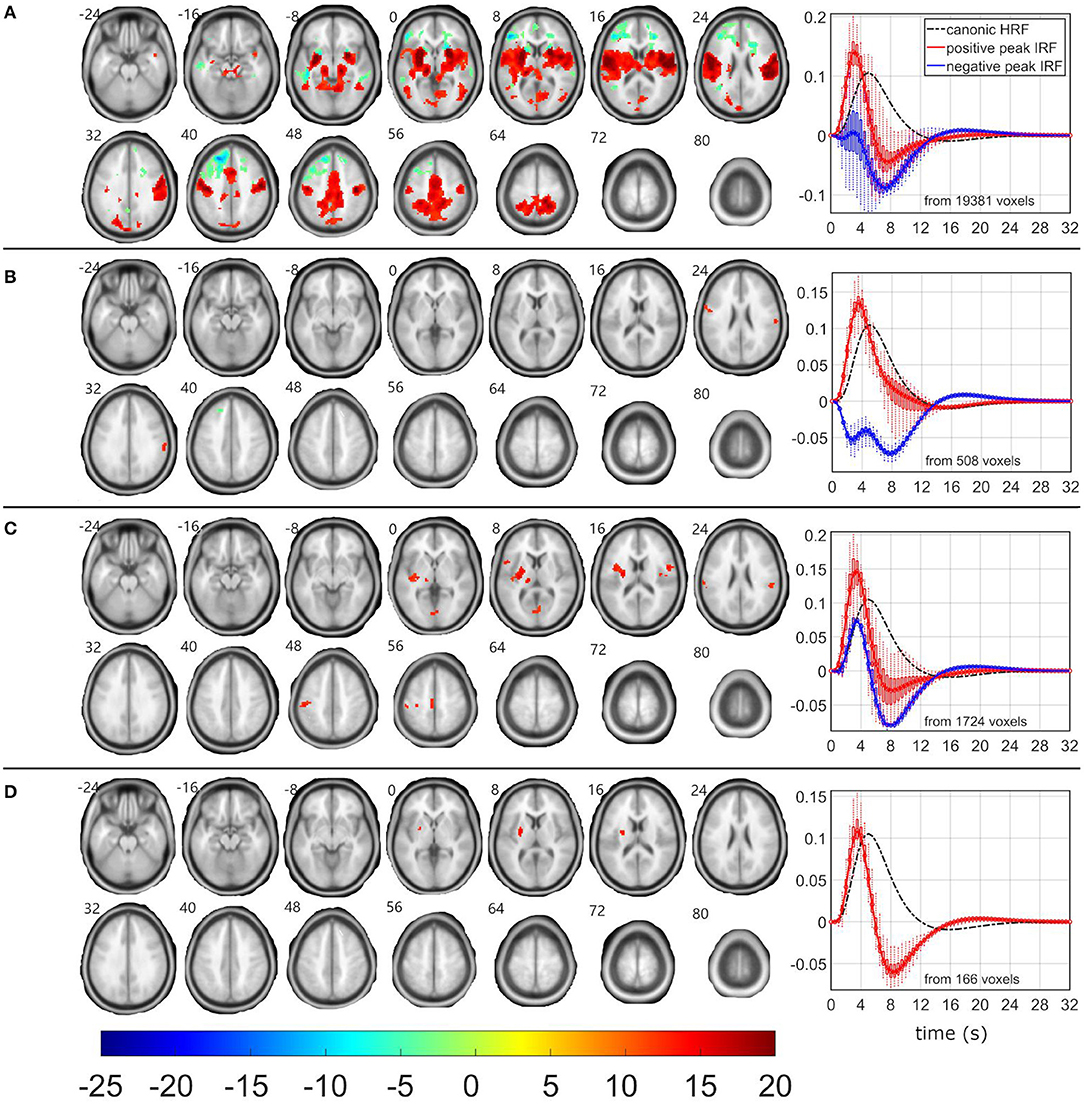
Figure 5. EEG-fMRI F-maps and estimated hemodynamic response functions for all investigated models of the δ2 pattern. The EEG-fMRI F-map colorbar is the same over all models. HRF, hemodynamic response function; IRF, impulse response function. If HRF demonstrated a reduced peak and an amplified trough (i.e., blue color-coded HRFs) the F-values were assigned with a negative sign. The F-maps were threholded with p < 0.0001, i.e., |F| > 8.1. The voxels with |F| > 12.1 met the condition pFWE < 0.05. The red color coded HRFs were derived from voxels with positive signed suprathreshold F-values. All F-maps are shown following the neurological convention, i.e., left hemisphere on the left side of the axial slice. (A) Absolute spectral. (B) Relative spectral. (C) Absolute spatiospectral. (D) Relative spatiospectral.
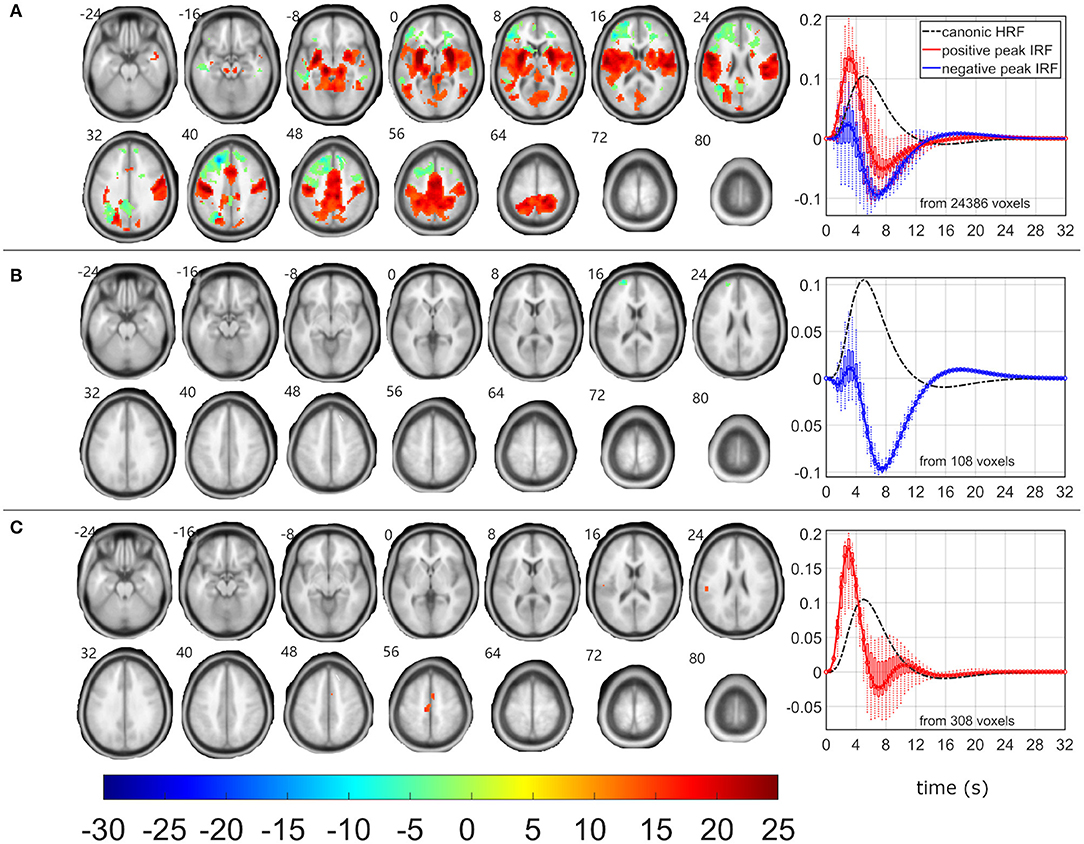
Figure 6. EEG-fMRI F-maps and estimated hemodynamic response functions for all investigated models of the δ3 pattern. The EEG-fMRI F-map colorbar is the same over all models. HRF, hemodynamic response function; IRF, impulse response function. If HRF demonstrated a reduced peak and an amplified trough (i.e., blue color-coded HRFs) the F-values were assigned with a negative sign. The F-maps were threholded with p < 0.0001, i.e., |F| > 8.1. The voxels with |F| > 12.1 met the condition pFWE < 0.05. The red color coded HRFs were derived from voxels with positive signed suprathreshold F-values. All F-maps are shown following the neurological convention, i.e., left hemisphere on the left side of the axial slice. (A) Absolute spectral. (B) Relative spectral. (C) Absolute spatiospectral. (D) Relative spatiospectral.
Distractor-Related EEG-fMRI Networks
The evidence of a negative relationship between EEG power fluctuations and distractor stimulus was only noticed for the δ4 pattern. The δ4 EEG-fMRI F-maps might then represent both frequent-related or distractor-related associations (Figure 2).
Discussion
Novelty and Neuroimaging Impact
Our results on visual oddball task data represent the systematic objective comparison of spectral (i.e., ASM, RSM) and spatiospectral (i.e., ASSM, RSSM) EEG-fMRI data fusion methods with the variable HRF permitting the variable delay between the immediate EEG following the BOLD signal changes. The automatically quantified effect of the variable HRF in the EEG-fMRI data fusion was remarkable. Both ASM and RSM results gained from the same dataset with fixed canonical HRF were far from reaching pFWE < 0.05 in EEG-fMRI statistical parametric maps (18, 43). In contrast, large numbers of voxels in δ4 and θ1 EEG-fMRI F-maps for all models met the statistical significance condition pFWE < 0.05. While accounting for the obtained EEG-fMRI map robustness and due to the involvement of insula, sensory-motor cortex, somatosensory cortex, cuneus, precuneus, basal ganglia, and FPCN (also known as central executive network) in the oddball/P300 tasks (64–73), we recommend using variable HRF and absolute spectral (ASM) or relative spatiospectral model (RSSM) for blind and fully automatic visualization of task-related networks from simultaneous EEG-fMRI data.
The current approach is fully automated, blind, and robust. It overcomes EEG-fMRI fusion via event related potential (ERP, e.g., the P300) analysis of amplitudes or latencies (22, 74–76) and is without a need of supplying an input information about stimuli timings. Manpower expertise and efforts are required for the visual identification in the ERP analysis. In the proposed analysis approach, quantitative EEG-fMRI task-related networks are generated automatically. The potential neuroimaging impact of this methodology is in a quantitative measurement of local data-driven determinants of cognitive deficit in patients suffering with epilepsy or other conditions with a cognitive impairment. The specific outcome determinants may be subject/group-specific F-value magnitudes or variable HRF amplitudes and latencies. High variance in local HRF latencies has been recently reported in patients with refractory focal epilepsy (40). This observation underlines the importance of variable HRF models for future clinical EEG-fMRI applications.
We demonstrated local EEG-fMRI response functions with the reduced HRF peak and the amplified HRF trough with the most robust location in the center of white matter bundles. These bundles may convey information related to execution and goal-directed tasks (77–79). Although the white matter BOLD signal was considered as a nuisance signal that was usually regressed out from the dataset during the preprocessing (80), several studies have reported the white matter fMRI-BOLD signal and disregarded its previous categorization as a blind spot in the functional imaging (81–85). Our robust white matter EEG-fMRI associations with the reduced HRF peak and the amplified HRF trough corroborate this recent blind spot hypothesis.
Task-related δ4 and θ1 EEG-fMRI associations might be considered controversial but we are convinced that they represent the bands of major event-related fingerprints in the simultaneously recorded EEG spectra. The postulated event-related fingerprint hypothesis is described in more detail in the following sub-chapter and supported by previous ERP findings.
Event-Related Fingerprints in EEG Spectra Hypothesis
The oddball paradigm elicits ERPs in EEG recordings (22, 67, 74–76, 86). The averaged ERP can be decomposed at several components of different frequency bands with major contributions of δ oscillations to P300 wave and θ oscillations to P300, P1, and N1 waves (87). Generally, δ and θ oscillations, which underline the P300 wave (88–93), reconfigure and enhance functional connectivity architecture from the baseline resting-state condition to the P300 task condition (73).
Temporal and spectral domains are fully complementary spaces. Therefore, each single event-related change of each oddball stimulus recorded in the EEG temporal domain fingerprints into the spectral domain such as power change in the ERSPat. Then, the task-related networks can be visualized while utilizing power spectral or spatiospectral models in the fully automated approach that is fully blind to the external stimulus timings. Our results demonstrated that the δ4 and θ1 ERSPats might be key filtering properties, i.e., g(ω) in Equation 1 or g(c,ω) in Equation 2, which appear to be in correspondence with the spectral properties of the P300 ERP (87–93). Our observation expands beyond the original hypothesis that was simply monitoring changes in the EEG mean root square frequency characterizing a signal roughness increase after stimuli (16, 47). These global EEG spectra changes are tiny and hard to detect in the event-related paradigm design. The ERSPat approach may be beneficial for the assessment of the event-related changes in EEG signal.
We have shortened the term, “event-related (spatio)spectral patterns” to an acronym, “ERSPat” and not “ERSP” to avoid confusion with the ERSP acronym. The “ERSP” acronym is used in the field for the event-related spectral perturbation (94), which are estimated from EEG segments that are apriori time-locked to the stimulus on-sets. Thus, ERSP has a slightly different meaning and interpretation than proposed ERSPats.
Comparison With Concurrent Brain Network and Early Visual Components
Our results corroborate the previous findings of δ and θ oscillations representing the major operating rhythms in P300 (87–93). Detected β oscillations underlying P300 were likely related to directed attention and cognitive activity (95). The earliest components in ERP with visual sensory input are positive and negative peaks reflecting P1 and N1 potentials and are likely generated in lateral extrastriate occipital cortex, temporo-parietal junction, and fusiform gyrus, respectively (96–98). These components may be linked to visual perceptual processing, especially visuospatial attention. Within the latency window of P1-N1 complex (90–120 ms for P1; and 150–190 ms for N1), the suggested superposition of α and θ evoked oscillations (99) was corroborated with the oscillatory activity detected in α and θ bands in the frequency decomposition of P300 response (87). In our findings, the activity in the α1 band approached the borderline of significance for the frequent stimulus and, thus, was not associated with fMRI signals. We believe that the θ activity was likely dominated by the P300-related oscillatory response and the discernibility of the rhythms linked to a minute P1-N1 complex is rather challenging.
The detection and discrimination between stimuli initiate a frontal lobe activity underlying attention-demanding task. The frontal activation interplays with an activation in temporal-parietal areas that promote memory operations. At rest, DMN (hippocampal-cingular-temporal-parietal network) is characterized by high activity. During attention-demanding task DMN activity is suppressed. FPCN is often found to be reciprocally anti-correlated with DMN, which is one of the examples of the functional antagonism (100–103). The involvement (δ4 and θ1 oscillation related) of the insula, the central node of the salience-detection system, represents an expected “switch” between the DMN and the FPCN (57–60). Observed δ4 oscillation related EEG-fMRI associations in the DMN regions are speculative. Predominantly, α oscillation related DMN deactivation has been present within the oddball task (18, 19, 60, 73) or resting-state (13). The involvement of the posterior cingulate cortex has been proposed as a potential regulatory modulator of the DMN in the task-negative state (104, 105).
Comparison With Concurrent Methods Applicable for EEG-fMRI Fusion
Temporal ICA of EEG data can isolate time-locked oscillations, artifacts (e.g., EKG, eye-blinking, etc.) (106) and epileptogenic spikes (if present) (25, 107, 108). The task specific activity represents only a small portion of signal variance, such as high frequency gamma band activity or ERPs. In addition, the present approach isolates EEG responses over large windows (e.g., 1.66 s in the present study), which discards the time-locked activity present with conventional ERP analysis. The time-locked activity preservation, e.g., with group temporal ICA, may also be a promising approach for task data (48).
Yet, considering the hypothesis that event-related changes (i.e., the small portion of signal variance) fingerprints into several distinct spectral patterns (87), then the temporal ICA appears less well-suited at decomposing distinct EEG oscillations (i.e., decompose EEG signal from EEG signal) compared to alternative approaches including (but not limited to) second-order blind identification (109–111), approximate joint diagonalization of cospectra (112, 113), and spectral ICA (114, 115).
The presented GLM EEG-fMRI fusion approach with variable HRF significantly increased robustness of obtained results for all investigated models compared to the same dataset observations proposed with ASM/RSM with the fixed HRF (18). The dominating fixed HRF GLM approach (5–9, 11–18, 21–26, 28–33, 43) may be revisited to gain an increased robustness of the results enabling variable HRF timings or utilizing an EEG-fMRI deconvolution approach (36–38). Similarly, this approach can be adopted for epileptogenic focus localization (25, 107, 108) due to the fact that the deconvolution approach demonstrated that delay timings between ictal EEG-fMRI associations does not fit to canonical HRF timings and often the local BOLD signal even precedes the EEG spike (41, 42).
The voxel-wise GLM approach is not the only data processing strategy to compare and fuse the EEG and fMRI data. The spatial ICA can rotate fMRI data into a space of spatially independent large scale brain networks (116, 117) with a representative component-specific time-course, which can be associated with simultaneously acquired EEG signal transformed into a comparable signal form (i.e., undersampled to fMRI timings, power fluctuations, spike timings/delays, etc.) (27, 30). Utilizing sliding windows over both EEG and fMRI-BOLD time-courses can be applied in the estimation of dynamic functional connectivity associations (34). A graph matrix between EEG and fMRI measures may be build via correlation measures or other similarity criteria (33). EEG-fMRI mixing parameters can be estimated through joint analysis approaches such as the joint-ICA (32, 118–120).
Over various existing EEG-fMRI data fusion strategies, we have demonstrated a fully automated GLM approach for robust lateralized task-related network visualization from local fMRI-BOLD signals and spectrally distinct task-related EEG patterns. In our approach, the variable HRF significantly improved the final robustness as the modeled EEG-fMRI peak delay did not overlap with the canonical HRF peak delay for the most task-related spectral patterns. Therefore, we propose this method for future clinical research applications in patients with neurocognitive deficits. These outcomes may also derive objective disease specific markers through local F-statistics or HRF changes that can be potentially used for the diagnostics, disease severity and treatment effect evaluations.
Limitations and Future Work
From the set of tested models, the ASM and RSSM were the most promising and robust for the blind visualization of task-related networks derived from simultaneous EEG-fMRI data. Several similar spectral models (16, 17, 47) considered Equation 10 instead of using Equation 1 for the EEG-fMRI fusion formulation, sometimes not-using the function g(ω). Comparison to the Equation 10 spectral model was not addressed here. All investigated EEG patterns were narrow band-pass filters and the effect of the non-linear ω2 modulation were considered minimal. The ASM and RSSM have also not been directly compared to the concurrent recent data-driven EEG spectra decomposition approaches such as parallel factor analysis (PARAFAC) (20, 30, 121), coupled matrix-tensor factorization (40, 122), coupled tensor-tensor decomposition (123), or source-space ICA (124, 125). A full comparison to the most recent EEG-spectra fusion strategies should be addressed in the future research. Yet the variability in HRF yielded more significant effects with all four models than in our previous work (18).
The robust task-related EEG-fMRI F-maps might be an effect of the active push-button response to the target stimuli. The maps' robustness may decrease using target count or passive responses (126) but such investigation was beyond the investigation of the current dataset and the study scope. The F-maps can be interpreted as data-driven functional connectivity maps (127, 128) where the EEG pattern's fluctuations emphasize the common relationships with local variable HRFs. The effective connectivity (127, 128) has not been quantified and evaluated here. Dynamic causal modeling (DCM), mostly between pre-selected regions of interest (ROIs), belongs to one of the most actively developed procedures quantifying the effective connectivity in fMRI or EEG data (129–132). Recently, the Bayesian fusion and multimodal EEG-fMRI DCM substantially improved the best effective connectivity model evidence (35). Future test-retest at ROIs of robust visual oddball data can provide important evidence of the DCM applicability.
Although the ASM provided the most robust spatial results, there are two weaknesses in the current ASM approach: (i) All ASM filtering properties were derived as an spectral average of the ASSM and RSSM patterns. Therefore, there would not be any optimized spectral filtering property without prior EEG ASSM and RSSM data-driven estimation via the spatiospectral ICA. Still, it appears that simple band-pass filters might be a sufficient approximation for the most promising δ4 and θ1 patterns. (ii) Thresholded ASM spatial F-maps appeared very similar over different EEG patterns. That might be an effect of a reported broadband component in the absolute EEG spectra resulting in lower spatial specificity of the ASM. On the other hand, high spatial specificity might be obtained with stricter statistical threshold, e.g., pFWE < 0.01 or even more stricter, which, however, would not be applicable for other fusion models.
Several EEG patterns demonstrated similar spatial EEG-fMRI F-maps while variable HRF was modeled in each voxel of each EEG band. It was not optimized and tested whether a weighted (wi∈ <-1,1>) mixture of N EEG patterns (ui) would increase a linear dependence (i.e., |t|-values) between the final EEG pattern and the stimulus vector (x), see Equation 11. Then, a general linear mixture EEG-fMRI fusion model with one global but still variable HRF would appear as Equation 12. Similar model analogy has been tested on hand-grip task data and compared to a single band EEG pattern with variable HRF (39). The results demonstrated more significant and specific blind task-related network visualizations for single δ and θ bands with band-specific variable HRFs. It is basically the same result presented here on the visual oddball dataset. Considering a linear mixture of EEG patterns with pattern specific HRFs maximizing relationships to the task, the Equation 12 would change to Equation 13. The optimization of the right side of the Equation 13 regarding the maximized linear dependence to the stimulus vector is challenging. Such EEG-fMRI fusion model alterations (i.e., Equations 12, 13) require a further investigation and testing on visual oddball data within the future research.
Although temporal and spectral domains are considered fully complementary, the phase information of the spectral domain in all implemented EEG-fMRI fusion models was omitted here. It is a common procedure in the field to only utilize the magnitude information (5, 7, 10, 16, 17, 26). We suggest that the phase coupling effect should not be neglected in the future research. The phase coupling can separate different sources of similar magnitude/power profiles and it has already been successfully implemented in several EEG spectra blind source separation techniques (112–114, 133–136) including the used spatiospectral ICA (37, 137).
Our proposed experiments and the comparison of the fully automated and blind methodological approaches were tested in healthy subjects. The clinical impact needs to be determined in future studies of the electrical neural and neurovascular associations measured by simultaneous EEG-fMRI. The P300 ERP has been extensively investigated in studies of cognition in healthy individuals and in a wide range of neurological or psychiatric disorders. The lower amplitude and longer latency are measures indicative of slowing of general cognitive ability due to the disease condition (100, 138). We propose that local F-map or HRF changes may discern patients with a specific cognitive dysfunction and improve spatial specificity of dysfunction focus as a benefit of the fMRI resolution in future applications.
Data Availability Statement
The data analyzed in this study is subject to the following licenses/restrictions: Data are property of the 1st Department of Neurology, St. Anne's University Hospital Brno, Czech Republic. Data can be made available upon request by email. Requests to access these datasets should be directed to Milan Brázdil, milan.brazdil@fnusa.cz.
Ethics Statement
The studies involving human participants were reviewed and approved by Masaryk University Ethics Committee, Brno, Czech Republic. The patients/participants provided their written informed consent to participate in this study.
Author Contributions
RL implemented ASSM and RSSM and wrote the first draft of the manuscript. ZW implemented ASM and RSM, compared all models, designed manuscript graphics and tables, and revised the manuscript. DB supervised the blind source separation of EEG spectra and revised the manuscript. MB led the EEG-fMRI data acquisition and preprocessing, approved the neurophysiological validity of the results, and revised the manuscript. JJ supervised the EEG-fMRI data fusion method implementation, confirmed signal processing validity of implemented methods, and revised the manuscript. IN supervised the current model comparison research, approved the neurophysiological validity of the results, and significantly revised the first draft of the manuscript. All authors contributed to the article and approved the submitted version.
Conflict of Interest
The authors declare that the research was conducted in the absence of any commercial or financial relationships that could be construed as a potential conflict of interest.
Acknowledgments
All EEG-fMRI measurements were performed at the 1st Department of Neurology, St. Anne's University Hospital Brno, Czech Republic. Authors thanks to Drs. R. Mareček and M. Mikl for the data preprocessing work.
References
1. Ives JR, Warach S, Schmitt F, Edelman RR, Schomer DL. Monitoring the patient's EEG during echo planar MRI. Electroencephalogr Clin Neurophysiol. (1993) 87:417–20. doi: 10.1016/0013-4694(93)90156-P
2. Huang-Hellinger FR, Breiter HC, McCormack G, Cohen MS, Kwong KK, Sutton JP, et al. Simultaneous functional magnetic resonance imaging and electrophysiological recording. Hum Brain Mapp. (1995) 3:13–23. doi: 10.1002/hbm.460030103
3. Allen PJ, Josephs O, Turner R. A method for removing imaging artifact from continuous EEG recorded during functional MRI. Neuroimage. (2000) 12:230–9. doi: 10.1006/nimg.2000.0599
4. Goldman RI, Stern JM, Engel J Jr, Cohen MS. Acquiring simultaneous EEG and functional MRI. Clin Neurophysiol. (2000) 111:1974–80. doi: 10.1016/S1388-2457(00)00456-9
5. Goldman RI, Stern JM, Engel J Jr, Cohen MS. Simultaneous EEG and fMRI of the alpha rhythm. Neuroreport. (2002) 13:2487–92. doi: 10.1097/00001756-200212200-00022
6. Moosmann M, Ritter P, Krastel I, Brink A, Thees S, Blankenburg F, et al. Correlates of alpha rhythm in functional magnetic resonance imaging and near infrared spectroscopy. Neuroimage. (2003) 20:145–58. doi: 10.1016/S1053-8119(03)00344-6
7. Laufs H, Kleinschmidt A, Beyerle A, Eger E, Salek-Haddadi A, Preibisch C, et al. EEG-correlated fMRI of human alpha activity. Neuroimage. (2003) 19:1463–76. doi: 10.1016/S1053-8119(03)00286-6
8. Laufs H, Krakow K, Sterzer P, Eger E, Beyerle A, Salek-Haddadi A, et al. Electroencephalographic signatures of attentional and cognitive default modes in spontaneous brain activity fluctuations at rest. Proc Natl Acad Sci USA. (2003) 100:11053–8. doi: 10.1073/pnas.1831638100
9. Gonçalves SI, de Munck JC, Pouwels PJW, Schoonhoven R, Kuijer JPA, Maurits NM, et al. Correlating the alpha rhythm to BOLD using simultaneous EEG/fMRI: inter-subject variability. Neuroimage. (2006) 30:203–13. doi: 10.1016/j.neuroimage.2005.09.062
10. de Munck JC, Gonçalves SI, Mammoliti R, Heethaar RM, Lopes da Silva FH. Interactions between different EEG frequency bands and their effect on alpha–fMRI correlations. Neuroimage. (2009) 47:69–76. doi: 10.1016/j.neuroimage.2009.04.029
11. Scheeringa R, Bastiaansen MCM, Petersson KM, Oostenveld R, Norris DG, Hagoort P. Frontal theta EEG activity correlates negatively with the default mode network in resting state. Int J Psychophysiol. (2008) 67:242–51. doi: 10.1016/j.ijpsycho.2007.05.017
12. Scheeringa R, Petersson KM, Kleinschmidt A, Jensen O, Bastiaansen MCM. EEG α power modulation of fMRI resting-state connectivity. Brain Connect. (2012) 2:254–64. doi: 10.1089/brain.2012.0088
13. Rusiniak M, Wróbel A, Cieśla K, Pluta A, Lewandowska M, Wójcik J, et al. The relationship between alpha burst activity and the default mode network. Acta Neurobiol Exp. (2018) 78:92–113. doi: 10.21307/ane-2018-010
14. Portnova GV, Tetereva A, Balaev V, Atanov M, Skiteva L, Ushakov V, et al. Correlation of BOLD signal with linear and nonlinear patterns of EEG in resting state EEG-informed fMRI. Front Hum Neurosci. (2017) 11:654. doi: 10.3389/fnhum.2017.00654
15. Sammer G, Blecker C, Gebhardt H, Bischoff M, Stark R, Morgen K, et al. Relationship between regional hemodynamic activity and simultaneously recorded EEG-theta associated with mental arithmetic-induced workload. Hum Brain Mapp. (2007) 28:793–803. doi: 10.1002/hbm.20309
16. Rosa MJ, Kilner J, Blankenburg F, Josephs O, Penny W. Estimating the transfer function from neuronal activity to BOLD using simultaneous EEG-fMRI. Neuroimage. (2010) 49:1496–509. doi: 10.1016/j.neuroimage.2009.09.011
17. Sclocco R, Tana MG, Visani E, Gilioli I, Panzica F, Franceschetti S, et al. EEG-informed fMRI analysis during a hand grip task: estimating the relationship between EEG rhythms and the BOLD signal. Front Hum Neurosci. (2014) 8:186. doi: 10.3389/fnhum.2014.00186
18. Labounek R, Lamoš M, Mareček R, Brázdil M, Jan J. Exploring task-related variability in fMRI data using fluctuations in power spectrum of simultaneously acquired EEG. J Neurosci Methods. (2015) 245:125–36. doi: 10.1016/j.jneumeth.2015.02.016
19. Labounek R, Bridwell DA, Mareček R, Lamoš M, Mikl M, Bednarík P, et al. EEG spatiospectral patterns and their link to fMRI BOLD signal via variable hemodynamic response functions. J Neurosci Methods. (2019) 318:34–46. doi: 10.1016/j.jneumeth.2019.02.012
20. Marecek R, Lamos M, Mikl M, Barton M, Fajkus J, Rektor I, et al. What can be found in scalp EEG spectrum beyond common frequency bands. EEG–fMRI study. J Neural Eng. (2016) 13:046026. doi: 10.1088/1741-2560/13/4/046026
21. Mulert C, Jäger L, Schmitt R, Bussfeld P, Pogarell O, Möller H-J, et al. Integration of fMRI and simultaneous EEG: towards a comprehensive understanding of localization and time-course of brain activity in target detection. Neuroimage. (2004) 22:83–94. doi: 10.1016/j.neuroimage.2003.10.051
22. Bénar C-G, Schön D, Grimault S, Nazarian B, Burle B, Roth M, et al. Single-trial analysis of oddball event-related potentials in simultaneous EEG-fMRI. Hum Brain Mapp. (2007) 28:602–13. doi: 10.1002/hbm.20289
23. Lemieux L, Salek-Haddadi A, Josephs O, Allen P, Toms N, Scott C, et al. Event-related fMRI with simultaneous and continuous EEG: description of the method and initial case report. Neuroimage. (2001) 14:780–7. doi: 10.1006/nimg.2001.0853
24. Vulliemoz S, Rodionov R, Carmichael DW, Thornton R, Guye M, Lhatoo SD, et al. Continuous EEG source imaging enhances analysis of EEG-fMRI in focal epilepsy. Neuroimage. (2010) 49:3219–29. doi: 10.1016/j.neuroimage.2009.11.055
25. Ebrahimzadeh E, Shams M, Fayaz F, Rajabion L, Mirbagheri M, Nadjar Araabi B, et al. Quantitative determination of concordance in localizing epileptic focus by component-based EEG-fMRI. Comput Methods Programs Biomed. (2019) 177:231–41. doi: 10.1016/j.cmpb.2019.06.003
26. Mantini D, Perrucci MG, Del Gratta C, Romani GL, Corbetta M. Electrophysiological signatures of resting state networks in the human brain. Proc Natl Acad Sci USA. (2007) 104:13170–5. doi: 10.1073/pnas.0700668104
27. Mantini D, Marzetti L, Corbetta M, Romani GL, Del Gratta C. Multimodal integration of fMRI and EEG data for high spatial and temporal resolution analysis of brain networks. Brain Topogr. (2010) 23:150–8. doi: 10.1007/s10548-009-0132-3
28. Omata K, Hanakawa T, Morimoto M, Honda M. Spontaneous slow fluctuation of EEG alpha rhythm reflects activity in deep-brain structures: a simultaneous EEG-fMRI study. PLoS ONE. (2013) 8:e66869. doi: 10.1371/journal.pone.0066869
29. Hiltunen T, Kantola J, Abou Elseoud A, Lepola P, Suominen K, Starck T, et al. Infra-slow EEG fluctuations are correlated with resting-state network dynamics in fMRI. J Neurosci. (2014) 34:356–62. doi: 10.1523/JNEUROSCI.0276-13.2014
30. Mareček R, Lamoš M, Labounek R, Barton M, Slavíček T, Mikl M, et al. Multiway array decomposition of EEG spectrum: implications of its stability for the exploration of large-scale brain networks. Neural Comput. (2017) 29:968–89. doi: 10.1162/NECO_a_00933
31. Keinänen T, Rytky S, Korhonen V, Huotari N, Nikkinen J, Tervonen O, et al. Fluctuations of the EEG-fMRI correlation reflect intrinsic strength of functional connectivity in default mode network. J Neurosci Res. (2018) 96:1689–98. doi: 10.1002/jnr.24257
32. Moosmann M, Eichele T, Nordby H, Hugdahl K, Calhoun VD. Joint independent component analysis for simultaneous EEG–fMRI: principle and simulation. Int J Psychophysiol. (2008) 67:212–21. doi: 10.1016/j.ijpsycho.2007.05.016
33. Yu Q, Wu L, Bridwell DA, Erhardt EB, Du Y, He H, et al. Building an EEG-fMRI multi-modal brain graph: a concurrent EEG-fMRI study. Front Hum Neurosci. (2016) 10:476. doi: 10.3389/fnhum.2016.00476
34. Lamoš M, Mareček R, Slavíček T, Mikl M, Rektor I, Jan J. Spatial-temporal-spectral EEG patterns of BOLD functional network connectivity dynamics. J Neural Eng. (2018) 15:036025. doi: 10.1088/1741-2552/aab66b
35. Wei H, Jafarian A, Zeidman P, Litvak V, Razi A, Hu D, et al. Bayesian fusion and multimodal DCM for EEG and fMRI. Neuroimage. (2020) 211:116595. doi: 10.1016/j.neuroimage.2020.116595
36. de Munck JC, Gonçalves SI, Huijboom L, Kuijer JPA, Pouwels PJW, Heethaar RM, et al. The hemodynamic response of the alpha rhythm: an EEG/fMRI study. Neuroimage. (2007) 35:1142–51. doi: 10.1016/j.neuroimage.2007.01.022
37. Wu L, Eichele T, Calhoun VD. Reactivity of hemodynamic responses and functional connectivity to different states of alpha synchrony: a concurrent EEG-fMRI study. Neuroimage. (2010) 52:1252–60. doi: 10.1016/j.neuroimage.2010.05.053
38. Bridwell DA, Wu L, Eichele T, Calhoun VD. The spatiospectral characterization of brain networks: fusing concurrent EEG spectra and fMRI maps. Neuroimage. (2013) 69:101–11. doi: 10.1016/j.neuroimage.2012.12.024
39. Prokopiou PC, Xifra-Porxas A, Kassinopoulos M. Modeling the hemodynamic response function using motor task and eyes-open resting-state EEG-fMRI. bioRxiv. (2020). doi: 10.1101/2020.06.29.178483v1
40. Van Eyndhoven S, Dupont P, Tousseyn S, Vervliet N, Van Paesschen W, Van Huffel S, et al. Augmenting interictal mapping with neurovascular coupling biomarkers by structured factorization of epileptic EEG and fMRI data. NeuroImage. (2021) 228:117652. doi: 10.1016/j.neuroimage.2020.117652
41. Jacobs J, Levan P, Moeller F, Boor R, Stephani U, Gotman J, et al. Hemodynamic changes preceding the interictal EEG spike in patients with focal epilepsy investigated using simultaneous EEG-fMRI. Neuroimage. (2009) 45:1220–31. doi: 10.1016/j.neuroimage.2009.01.014
42. LeVan P, Tyvaert L, Moeller F, Gotman J. Independent component analysis reveals dynamic ictal BOLD responses in EEG-fMRI data from focal epilepsy patients. Neuroimage. (2010) 49:366–78. doi: 10.1016/j.neuroimage.2009.07.064
43. Labounek R, Janeček D, Mareček R, Lamoš M, Slaviček T, Mikl M, et al. Generalized EEG-FMRI spectral and spatiospectral heuristic models. In: 2016 IEEE 13th International Symposium on Biomedical Imaging (ISBI). Prague (2016). p. 767–70. doi: 10.1109/ISBI.2016.7493379
44. Polich J. Theoretical overview of P3a and P3b. In: Detection of Change: Event-Related Potential and fMRI Findings, Polich J, editor. Boston, MA: Springer US (2003). p. 83–98. doi: 10.1007/978-1-4615-0294-4_5
45. Tueting P, Sutton S, Zubin J. Quantitative evoked potential correlates of the probability of events. Psychophysiology. (1970) 7:385–94. doi: 10.1111/j.1469-8986.1970.tb01763.x
46. Kok A. Event-related-potential (ERP) reflections of mental resources: a review and synthesis. Biol Psychol. (1997) 45:19–56. doi: 10.1016/S0301-0511(96)05221-0
47. Kilner JM, Mattout J, Henson R, Friston KJ. Hemodynamic correlates of EEG: a heuristic. Neuroimage. (2005) 28:280–6. doi: 10.1016/j.neuroimage.2005.06.008
48. Labounek R, Bridwell DA, Mareček R, Lamoš M, Mikl M, Slavíček T, et al. Stable scalp EEG spatiospectral patterns across paradigms estimated by group ICA. Brain Topogr. (2018) 31:76–89. doi: 10.1007/s10548-017-0585-8
49. Labounek R, Bridwell DA, Mareček R, Lamoš M, Mikl M, Brázdil M, et al. Stable EEG spatiospectral sources using relative power as group-ICA input. In: World Congress on Medical Physics and Biomedical Engineering 2018. Singapore: Springer Singapore (2019). p. 125–8. doi: 10.1007/978-981-10-9038-7_22
50. Allen PJ, Polizzi G, Krakow K, Fish DR, Lemieux L. Identification of EEG events in the MR scanner: the problem of pulse artifact and a method for its subtraction. Neuroimage. (1998) 8:229–39. doi: 10.1006/nimg.1998.0361
51. Calhoun VD, Adali T, Pearlson GD, Pekar JJ. A method for making group inferences from functional MRI data using independent component analysis. Hum Brain Mapp. (2001) 14:140–51. doi: 10.1002/hbm.1048
52. Bell AJ, Sejnowski TJ. An information-maximization approach to blind separation and blind deconvolution. Neural Comput. (1995) 7:1129–59. doi: 10.1162/neco.1995.7.6.1129
53. Himberg J, Hyvärinen A, Esposito F. Validating the independent components of neuroimaging time series via clustering and visualization. Neuroimage. (2004) 22:1214–22. doi: 10.1016/j.neuroimage.2004.03.027
54. Friston KJ, Holmes AP, Worsley KJ, Poline J-P, Frith CD, Frackowiak RSJ. Statistical parametric maps in functional imaging: a general linear approach. Hum Brain Mapp. (1994) 2:189–210. doi: 10.1002/hbm.460020402
55. Friston KJ, Ashburner J, Frith CD, Poline J-B, Heather JD, Frackowiak RSJ. Spatial registration and normalization of images. Hum Brain Mapp. (1995) 3:165–89. doi: 10.1002/hbm.460030303
56. Friston KJ, Fletcher P, Josephs O, Holmes A, Rugg MD, Turner R. Event-related fMRI: characterizing differential responses. Neuroimage. (1998) 7:30–40. doi: 10.1006/nimg.1997.0306
57. Uddin LQ, Yeo BTT, Spreng RN. Towards a universal taxonomy of macro-scale functional human brain networks. Brain Topogr. (2019) 32:926–42. doi: 10.1007/s10548-019-00744-6
58. Menon V, Uddin LQ. Saliency, switching, attention and control: a network model of insula function. Brain Struct Funct. (2010) 214:655–67. doi: 10.1007/s00429-010-0262-0
59. Uddin LQ. Salience processing and insular cortical function and dysfunction. Nat Rev Neurosci. (2015) 16:55–61. doi: 10.1038/nrn3857
60. Sridharan D, Levitin DJ, Menon V. A critical role for the right fronto-insular cortex in switching between central-executive and default-mode networks. Proc Natl Acad Sci USA. (2008) 105:12569–74. doi: 10.1073/pnas.0800005105
61. Mori S, Wakana S, van Zijl PCM, Nagae-Poetscher LM. MRI Atlas of Human White Matter. Amsterdam: Elsevier (2005). Available online at: https://www.elsevier.com/books/mri-atlas-of-human-white-matter/mori/978-0-444-51741-8
62. Wakana S, Caprihan A, Panzenboeck MM, Fallon JH, Perry M, Gollub RL, et al. Reproducibility of quantitative tractography methods applied to cerebral white matter. Neuroimage. (2007) 36:630–44. doi: 10.1016/j.neuroimage.2007.02.049
63. Hua K, Zhang J, Wakana S, Jiang H, Li X, Reich DS, et al. Tract probability maps in stereotaxic spaces: analyses of white matter anatomy and tract-specific quantification. Neuroimage. (2008) 39:336–47. doi: 10.1016/j.neuroimage.2007.07.053
64. Linden DE, Prvulovic D, Formisano E, Völlinger M, Zanella FE, Goebel R, et al. The functional neuroanatomy of target detection: an fMRI study of visual and auditory oddball tasks. Cereb Cortex. (1999) 9:815–23. doi: 10.1093/cercor/9.8.815
65. Stevens AA, Skudlarski P, Gatenby JC, Gore JC. Event-related fMRI of auditory and visual oddball tasks. Magn Reson Imaging. (2000) 18:495–502. doi: 10.1016/S0730-725X(00)00128-4
66. Kiehl KA, Laurens KR, Duty TL, Forster BB, Liddle PF. An event-related fMRI study of visual and auditory oddball tasks. J. Psychophysiol. (2001) 15:221–40. doi: 10.1027//0269-8803.15.4.221
67. Brázdil M, Dobsík M, Mikl M, Hlustík P, Daniel P, Pazourková M, et al. Combined event-related fMRI and intracerebral ERP study of an auditory oddball task. Neuroimage. (2005) 26:285–93. doi: 10.1016/j.neuroimage.2005.01.051
68. Brázdil M, Mikl M, Marecek R, Krupa P, Rektor I. Effective connectivity in target stimulus processing: a dynamic causal modeling study of visual oddball task. Neuroimage. (2007) 35:827–35. doi: 10.1016/j.neuroimage.2006.12.020
69. Chen C-C, Syue K-S, Li K-C, Yeh S-C. Neuronal correlates of a virtual-reality-based passive sensory P300 network. PLoS ONE. (2014) 9:e112228. doi: 10.1371/journal.pone.0112228
70. Li F, Chen B, Li H, Zhang T, Wang F, Jiang Y, et al. The time-varying networks in P300: a task-evoked EEG study. IEEE Trans Neural Syst Rehabil Eng. (2016) 24:725–33. doi: 10.1109/TNSRE.2016.2523678
71. Li F, Yi C, Jiang Y, Liao Y, Si Y, Yao D, et al. The construction of large-scale cortical networks for P300 from scalp EEG. IEEE Access. (2018) 6:68498–506. doi: 10.1109/ACCESS.2018.2879487
72. Zhang Y, Tang AC, Zhou X. Synchronized network activity as the origin of a P300 component in a facial attractiveness judgment task. Psychophysiology. (2014) 51:285–9. doi: 10.1111/psyp.12153
73. Li F, Yi C, Liao Y, Jiang Y, Si Y, Song L, et al. Reconfiguration of brain network between resting-state and P300 task. IEEE Trans Cogn Dev Syst. (2020). doi: 10.1109/TCDS.2020.2965135. [Epub ahead of print].
74. Liebenthal E, Ellingson ML, Spanaki MV, Prieto TE, Ropella KM, Binder JR. Simultaneous ERP and fMRI of the auditory cortex in a passive oddball paradigm. Neuroimage. (2003) 19:1395–404. doi: 10.1016/S1053-8119(03)00228-3
75. O'Connell RG, Balsters JH, Kilcullen SM, Campbell W, Bokde AW, Lai R, et al. A simultaneous ERP/fMRI investigation of the P300 aging effect. Neurobiol Aging. (2012) 33:2448–61. doi: 10.1016/j.neurobiolaging.2011.12.021
76. Campanella S, Bourguignon M, Peigneux P, Metens T, Nouali M, Goldman S, et al. BOLD response to deviant face detection informed by P300 event-related potential parameters: a simultaneous ERP–fMRI study. Neuroimage. (2013) 71:92–103. doi: 10.1016/j.neuroimage.2012.12.077
77. Altieri R, Melcarne A, Junemann C, Zeppa P, Zenga F, Garbossa D, et al. Inferior Fronto-Occipital fascicle anatomy in brain tumor surgeries: from anatomy lab to surgical theater. J Clin Neurosci. (2019) 68:290–4. doi: 10.1016/j.jocn.2019.07.039
78. Dalrymple-Alford JC, Harland B, Loukavenko EA, Perry B, Mercer S, Collings DA, et al. Anterior thalamic nuclei lesions and recovery of function: relevance to cognitive thalamus. Neurosci Biobehav Rev. (2015) 54:145–60. doi: 10.1016/j.neubiorev.2014.12.007
79. Schepers IM, Beck A-K, Bräuer S, Schwabe K, Abdallat M, Sandmann P, et al. Human centromedian-parafascicular complex signals sensory cues for goal-oriented behavior selection. Neuroimage. (2017) 152:390–9. doi: 10.1016/j.neuroimage.2017.03.019
80. Barton M, Mareček R, Krajčovičová L, Slavíček T, Kašpárek T, Zemánková P, et al. Evaluation of different cerebrospinal fluid and white matter fMRI filtering strategies—quantifying noise removal and neural signal preservation. Hum Brain Mapp. (2019) 40:1114–38. doi: 10.1002/hbm.24433
81. Mazerolle EL, Beyea SD, Gawryluk JR, Brewer KD, Bowen CV, D'Arcy RCN. Confirming white matter fMRI activation in the corpus callosum: co-localization with DTI tractography. Neuroimage. (2010) 50:616–21. doi: 10.1016/j.neuroimage.2009.12.102
82. Gawryluk JR, Mazerolle EL, D'Arcy RCN. Does functional MRI detect activation in white matter? A review of emerging evidence, issues, and future directions. Front Neurosci. (2014) 8:239. doi: 10.3389/fnins.2014.00239
83. Ding Z, Huang Y, Bailey SK, Gao Y, Cutting LE, Rogers BP, et al. Detection of synchronous brain activity in white matter tracts at rest and under functional loading. Proc Natl Acad Sci USA. (2018) 115:595–600. doi: 10.1073/pnas.1711567115
84. Grajauskas LA, Frizzell T, Song X, D'Arcy RCN. White matter fMRI activation cannot be treated as a nuisance regressor: overcoming a historical blind spot. Front. Neurosci. (2019) 13:1024. doi: 10.3389/fnins.2019.01024
85. Li M, Newton AT, Anderson AW, Ding Z, Gore JC. Characterization of the hemodynamic response function in white matter tracts for event-related fMRI. Nat Commun. (2019) 10:1140. doi: 10.1038/s41467-019-09076-2
86. Rektor I, Brázdil M, Nestrasil I, Bares M, Daniel P. Modifications of cognitive and motor tasks affect the occurrence of event-related potentials in the human cortex: cognitive and motor task modifications of event-related potentials. Eur J Neurosci. (2007) 26:1371–80. doi: 10.1111/j.1460-9568.2007.05713.x
87. Başar E, Düzgün A. The CLAIR model: extension of Brodmann areas based on brain oscillations and connectivity. Int J Psychophysiol. (2016) 103:185–98. doi: 10.1016/j.ijpsycho.2015.02.018
88. Başar-Eroglu C, Başar E, Demiralp T, Schürmann M. P300-response: possible psychophysiological correlates in delta and theta frequency channels. A review. Int J Psychophysiol. (1992) 13:161–79. doi: 10.1016/0167-8760(92)90055-G
89. Bernat EM, Malone SM, Williams WJ, Patrick CJ, Iacono WG. Decomposing delta, theta, and alpha time-frequency ERP activity from a visual oddball task using PCA. Int J Psychophysiol. (2007) 64:62–74. doi: 10.1016/j.ijpsycho.2006.07.015
90. Harper J, Malone SM, Bernat EM. Theta and delta band activity explain N2 and P3 ERP component activity in a go/no-go task. Clin Neurophysiol. (2014) 125:124–32. doi: 10.1016/j.clinph.2013.06.025
91. Peng W, Hu L, Zhang Z, Hu Y. Causality in the association between P300 and alpha event-related desynchronization. PLoS ONE. (2012) 7:e34163. doi: 10.1371/journal.pone.0034163
92. Bender S, Banaschewski T, Roessner V, Klein C, Rietschel M, Feige B, et al. Variability of single trial brain activation predicts fluctuations in reaction time. Biol Psychol. (2015) 106:50–60. doi: 10.1016/j.biopsycho.2015.01.013
93. Başar-Eroglu C, Demiralp T. Event-related theta oscillations: an integrative and comparative approach in the human and animal brain. Int J Psychophysiol. (2001) 39:167–95. doi: 10.1016/S0167-8760(00)00140-9
94. Makeig S. Auditory event-related dynamics of the EEG spectrum and effects of exposure to tones. Electroencephalogr Clin Neurophysiol. (1993) 86:283–93. doi: 10.1016/0013-4694(93)90110-H
95. Güntekin B, Emek-Savaş DD, Kurt P, Yener GG, Başar E. Beta oscillatory responses in healthy subjects and subjects with mild cognitive impairment. Neuroimage Clin. (2013) 3:39–46. doi: 10.1016/j.nicl.2013.07.003
96. Lin Y-Q, Cui S-S, Du J-J, Li G, He Y-X, Zhang P-C, et al. N1 and P1 components associate with visuospatial-executive and language functions in normosmic Parkinson's disease: an event-related potential study. Front Aging Neurosci. (2019) 11:18. doi: 10.3389/fnagi.2019.00018
97. Luck SJ, Heinze HJ, Mangun GR, Hillyard SA. Visual event-related potentials index focused attention within bilateral stimulus arrays. II. Functional dissociation of P1 and N1 components. Electroencephalogr Clin Neurophysiol. (1990) 75:528–42. doi: 10.1016/0013-4694(90)90139-B
98. Novitskiy N, Ramautar JR, Vanderperren K, De Vos M, Mennes M, Mijovic B, et al. The BOLD correlates of the visual P1 and N1 in single-trial analysis of simultaneous EEG-fMRI recordings during a spatial detection task. Neuroimage. (2011) 54:824–35. doi: 10.1016/j.neuroimage.2010.09.041
99. Klimesch W, Schack B, Schabus M, Doppelmayr M, Gruber W, Sauseng P. Phase-locked alpha and theta oscillations generate the P1–N1 complex and are related to memory performance. Cogn Brain Res. (2004) 19:302–16. doi: 10.1016/j.cogbrainres.2003.11.016
100. Bledowski C, Prvulovic D, Hoechstetter K, Scherg M, Wibral M, Goebel R, et al. Localizing P300 generators in visual target and distractor processing: a combined event-related potential and functional magnetic resonance imaging study. J Neurosci. (2004) 24:9353–60. doi: 10.1523/JNEUROSCI.1897-04.2004
101. Anticevic A, Cole MW, Murray JD, Corlett PR, Wang X-J, Krystal JH. The role of default network deactivation in cognition and disease. Trends Cogn Sci. (2012) 16:584–92. doi: 10.1016/j.tics.2012.10.008
102. Fox MD, Snyder AZ, Vincent JL, Corbetta M, Van Essen DC, Raichle ME. The human brain is intrinsically organized into dynamic, anticorrelated functional networks. Proc Natl Acad Sci USA. (2005) 102:9673–8. doi: 10.1073/pnas.0504136102
103. Li Y, Wang L-Q, Hu Y. Localizing P300 generators in high-density event- related potential with fMRI. Med Sci Monit. (2009) 15:MT47–53. Available online at: https://www.medscimonit.com/download/index/idArt/869569
104. Wang RWY, Chang W-L, Chuang S-W, Liu I-N. Posterior cingulate cortex can be a regulatory modulator of the default mode network in task-negative state. Sci Rep. (2019) 9:7565. doi: 10.1038/s41598-019-43885-1
105. Leech R, Sharp DJ. The role of the posterior cingulate cortex in cognition and disease. Brain. (2014) 137:12–32. doi: 10.1093/brain/awt162
106. Winkler I, Haufe S, Tangermann M. Automatic classification of artifactual ICA-components for artifact removal in EEG signals. Behav Brain Funct. (2011) 7:30. doi: 10.1186/1744-9081-7-30
107. Ebrahimzadeh E, Soltanian-Zadeh H, Araabi BN, Fesharaki SSH, Habibabadi JM. Component-related BOLD response to localize epileptic focus using simultaneous EEG-fMRI recordings at 3T. J Neurosci Methods. (2019) 322:34–49. doi: 10.1016/j.jneumeth.2019.04.010
108. Ebrahimzadeh E, Shams M, Rahimpour Jounghani A, Fayaz F, Mirbagheri M, Hakimi N, et al. Localizing confined epileptic foci in patients with an unclear focus or presumed multifocality using a component-based EEG-fMRI method. Cogn Neurodyn. (2020) 15:207–22. doi: 10.1007/s11571-020-09614-5
109. Belouchrani A, Abed-Meraim K, Cardoso J, Moulines E. A blind source separation technique using second-order statistics. IEEE Trans Signal Process. (1997) 45:434–44. doi: 10.1109/78.554307
110. Tang AC, Sutherland MT, McKinney CJ. Validation of SOBI components from high-density EEG. Neuroimage. (2005) 25:539–53. doi: 10.1016/j.neuroimage.2004.11.027
111. Tang A. Applications of second order blind identification to high-density EEG-based brain imaging: a review. In: Advances in Neural Networks - ISNN 2010 (Heidelberg: Springer Berlin) (2010). p. 368–77. doi: 10.1007/978-3-642-13318-3_46
112. Congedo M, Gouy-Pailler C, Jutten C. On the blind source separation of human electroencephalogram by approximate joint diagonalization of second order statistics. Clin Neurophysiol. (2008) 119:2677–86. doi: 10.1016/j.clinph.2008.09.007
113. Congedo M, John RE, De Ridder D, Prichep L. Group independent component analysis of resting state EEG in large normative samples. Int J Psychophysiol. (2010) 78:89–99. doi: 10.1016/j.ijpsycho.2010.06.003
114. Hyvärinen A, Ramkumar P, Parkkonen L, Hari R. Independent component analysis of short-time Fourier transforms for spontaneous EEG/MEG analysis. Neuroimage. (2010) 49:257–71. doi: 10.1016/j.neuroimage.2009.08.028
115. Bridwell DA, Rachakonda S, Silva RF, Pearlson GD, Calhoun VD. Spatiospectral decomposition of multi-subject EEG: evaluating blind source separation algorithms on real and realistic simulated data. Brain Topogr. (2018) 31:47–61. doi: 10.1007/s10548-016-0479-1
116. Allen EA, Erhardt EB, Damaraju E, Gruner W, Segall JM, Silva RF, et al. A baseline for the multivariate comparison of resting-state networks. Front Syst Neurosci. (2011) 5:2. doi: 10.3389/fnsys.2011.00002
117. Spadone S, Della Penna S, Sestieri C, Betti V, Tosoni A, Perrucci MG, et al. Dynamic reorganization of human resting-state networks during visuospatial attention. Proc Natl Acad Sci USA. (2015) 112:8112–7. doi: 10.1073/pnas.1415439112
118. Calhoun VD, Liu J, Adali T. A review of group ICA for fMRI data and ICA for joint inference of imaging, genetic, and ERP data. Neuroimage. (2009) 45:S163–72. doi: 10.1016/j.neuroimage.2008.10.057
119. Edwards BG, Calhoun VD, Kiehl KA. Joint ICA of ERP and fMRI during error-monitoring. Neuroimage. (2012) 59:1896–903. doi: 10.1016/j.neuroimage.2011.08.088
120. Mangalathu-Arumana J, Beardsley SA, Liebenthal E. Within-subject joint independent component analysis of simultaneous fMRI/ERP in an auditory oddball paradigm. Neuroimage. (2012) 60:2247–57. doi: 10.1016/j.neuroimage.2012.02.030
121. Martínez-Montes E, Valdés-Sosa PA, Miwakeichi F, Goldman RI, Cohen MS. Concurrent EEG/fMRI analysis by multiway Partial Least Squares. Neuroimage. (2004) 22:1023–34. doi: 10.1016/j.neuroimage.2004.03.038
122. Van Eyndhoven S, Vervliet N, De Lathauwer L, Van Huffel S. Identifying stable components of matrix/tensor factorizations via lowrank approximation of inter-factorization similarity. In: 2019 27th European Signal Processing Conference (EUSIPCO) (A Coruña: IEEE) (2019). p. 1–5. doi: 10.23919/EUSIPCO.2019.8902954
123. Jonmohamadi Y, Muthukumaraswamy S, Chen J, Roberts J, Crawford R, Pandey A. Extraction of common task features in EEG-fMRI data using coupled tensor-tensor decomposition. Brain Topogr. (2020) 33:636–50. doi: 10.1007/s10548-020-00787-0
124. Jonmohamadi Y, Poudel G, Innes C, Jones R. Source-space ICA for EEG source separation, localization, and time-course reconstruction. Neuroimage. (2014) 101:720–37. doi: 10.1016/j.neuroimage.2014.07.052
125. Jonmohamadi Y, Forsyth A, McMillan R, Muthukumaraswamy SD. Constrained temporal parallel decomposition for EEG-fMRI fusion. J Neural Eng. (2019) 16:16017. doi: 10.1088/1741-2552/aaefda
126. Warbrick T, Reske M, Shah NJ. Do EEG paradigms work in fMRI? Varying task demands in the visual oddball paradigm: implications for task design and results interpretation. Neuroimage. (2013) 77:177–85. doi: 10.1016/j.neuroimage.2013.03.026
127. Friston KJ. Functional and effective connectivity in neuroimaging: a synthesis. Hum Brain Mapp. (1994) 2:56–78. doi: 10.1002/hbm.460020107
128. Friston KJ. Functional and effective connectivity: a review. Brain Connect. (2011) 1:13–36. doi: 10.1089/brain.2011.0008
129. Friston KJ, Harrison L, Penny W. Dynamic causal modelling. Neuroimage. (2003) 19:1273–302. doi: 10.1016/S1053-8119(03)00202-7
130. Friston KJ, Preller KH, Mathys C, Cagnan H, Heinzle J, Razi A, et al. Dynamic causal modelling revisited. Neuroimage. (2019) 199:730–44. doi: 10.1016/j.neuroimage.2017.02.045
131. Havlicek M, Roebroeck A, Friston K, Gardumi A, Ivanov D, Uludag K. Physiologically informed dynamic causal modeling of fMRI data. Neuroimage. (2015) 122:355–72. doi: 10.1016/j.neuroimage.2015.07.078
132. Stephan KE, Tittgemeyer M, Knösche TR, Moran RJ, Friston KJ. Tractography-based priors for dynamic causal models. NeuroImage. (2009) 47:1628–38. doi: 10.1016/j.neuroimage.2009.05.096
133. Anemüller J, Sejnowski TJ, Makeig S. Complex independent component analysis of frequency-domain electroencephalographic data. Neural Netw. (2003) 16:1311–23. doi: 10.1016/j.neunet.2003.08.003
134. Bernat EM, Williams WJ, Gehring WJ. Decomposing ERP time–frequency energy using PCA. Clin Neurophysiol. (2005) 116:1314–34. doi: 10.1016/j.clinph.2005.01.019
135. Kauppi J-P, Parkkonen L, Hari R, Hyvärinen A. Decoding magnetoencephalographic rhythmic activity using spectrospatial information. Neuroimage. (2013) 83:921–36. doi: 10.1016/j.neuroimage.2013.07.026
136. Shou G, Ding L, Dasari D. Probing neural activations from continuous EEG in a real-world task: time-frequency independent component analysis. J Neurosci Methods. (2012) 209:22–34. doi: 10.1016/j.jneumeth.2012.05.022
137. Ramkumar P, Parkkonen L, Hari R, Hyvärinen A. Characterization of neuromagnetic brain rhythms over time scales of minutes using spatial independent component analysis. Hum Brain Mapp. (2012) 33:1648–62. doi: 10.1002/hbm.21303
Keywords: simultaneous EEG-fMRI, task-related network visualization, spectral and spatiospectral models, visual oddball paradigm, general linear model, GLM, independent component analysis
Citation: Labounek R, Wu Z, Bridwell DA, Brázdil M, Jan J and Nestrašil I (2021) Blind Visualization of Task-Related Networks From Visual Oddball Simultaneous EEG-fMRI Data: Spectral or Spatiospectral Model? Front. Neurol. 12:644874. doi: 10.3389/fneur.2021.644874
Received: 22 December 2020; Accepted: 22 March 2021;
Published: 26 April 2021.
Edited by:
Brunno Machado De Campos, State University of Campinas, BrazilReviewed by:
Elias Ebrahimzadeh, Institute for Research in Fundamental Sciences (IPM), IranJonas Vibell, University of Hawaii, United States
Copyright © 2021 Labounek, Wu, Bridwell, Brázdil, Jan and Nestrašil. This is an open-access article distributed under the terms of the Creative Commons Attribution License (CC BY). The use, distribution or reproduction in other forums is permitted, provided the original author(s) and the copyright owner(s) are credited and that the original publication in this journal is cited, in accordance with accepted academic practice. No use, distribution or reproduction is permitted which does not comply with these terms.
*Correspondence: René Labounek, rlaboune@umn.edu; Igor Nestrašil, nestr007@umn.edu